
Abstract
Affinity selection mass spectrometry (MS) or, simply, affinity mass spectrometry (AMS) is a label-free technology that has been used to identify high-affinity ligands of target proteins of interest by screening against small-molecule compound libraries and identifying molecules that are enriched in the presence of the target protein. We have previously applied Agilent Technology’s (Santa Clara, CA) RapidFire solid-phase extraction (SPE)-based high-throughput MS technology to screen small-molecule libraries using AMS. However, SPE-based technologies rely on fluidics for desalting and separation prior to mass analysis with attendant high solvent consumption, relatively high sample volume requirements, risk of sample carryover, and frequent maintenance. To address these challenges, we have established an AMS platform using a laser diode thermal desorption–atmospheric pressure chemical ionization (LDTD-APCI) ionization source (Phytronix, Quebec, Canada) coupled with a SCIEX 5600+ TripleTOF MS (Framingham, MA). We also validated a data-independent acquisition (DIA) Sequential Window Acquisition of All Theoretical Mass Spectra (SWATH-MS) method for the robust detection and analysis of small-molecule affinity hits. An informatics platform developed in-house has resulted in a streamlined data analysis workflow for high-throughput AMS screening campaigns and reduced data processing time without compromising data quality. Finally, 68,000 compounds were screened in a single plate and affinity selected hits were confirmed in an orthogonal enzyme activity assay.
Keywords
Introduction
Traditional binding assays for high-throughput screening (HTS) typically employ fluorescence, luminescence, radiometric, or other assays in 384- or 1536-microtiter plates, wherein compound libraries are screened against a target in a high-density single-compound format. These assay technologies are well established, and various activity assays have been developed and optimized for a multitude of targets. The high throughput of these detection methods in microtiter plate-based assays has made such methods a preferred screening approach in small-molecule drug discovery. 1 However, traditional HTS assays often rely on the availability of labeled reagents and require a focused assay development effort, as each target typically features its own activity and pharmacology. For example, scintillation proximity assays (SPAs) require the synthesis of specific radiolabeled reagents and the need to manage and dispose of radioactive wastes.2,3 Fluorescence intensity measurement is a widely used HTS method due to its ease of implementation in microtiter plate-based formats and improvements in the sensitivity of fluorescence detectors. Fluorescence detection methods such as fluorescence resonance energy transfer (FRET) or luminescence-based methods such as AlphaScreen (PerkinElmer, Waltham, MA) can measure the proximity of two interacting partners labeled as a donor or an acceptor,4,5 though each requires the synthesis of specific labeled reagents, which is a significant investment of time and capital prior to screening. 6 In contrast, label-free affinity-based approaches such as affinity mass spectrometry (AMS) can afford the advantages of the use of unlabeled, more physiologically relevant reagents, no special reagent synthesis, the absence of fluorescence or luminescence interferences, and the requirement for only minor modifications in the assay protocol to accommodate a wide variety of different therapeutic targets. Furthermore, the identity of ligands identified by AMS is unambiguous since the ligand is directly detected by MS rather than indirectly via its effect in an activity assay. A disadvantage of AMS is that it is not applicable to all targets, for example, cellular targets, and the approach is perhaps most readily applied to soluble proteins. AMS can also fail to detect weaker or faster off-rate ligands since the separation of bound from unbound compounds, even if very rapid, still requires time. Poorly ionized compounds may also fail to be detected. The amount of protein required for an AMS screen may also be higher than for an activity-based screen since micromolar concentrations of protein are typically used in AMS, although the protein requirement is reduced by compound pooling. Overall, AMS can complement traditional activity assays either as an orthogonal screening approach or as an orthogonal method to confirm hits identified by activity-based screens.
Mass spectrometry (MS)-based HTS technologies can afford direct label-free detection of molecular interactions. Recent developments with mass analyzers, transfer lenses, ionization techniques, and control software have improved the scan speed, sensitivity, and dynamic range of mass spectrometers applied to HTS.7–10 Chromatographic separation, for example, liquid chromatography (LC)–MS or ion mobility coupled with MS, has enabled the analysis of complex samples from cell culture media, natural product or food extracts, and drug metabolites or formulations.11–14 While MS systems are capable of rapid sample analysis, implementation of MS in an HTS setting (use of microtiter plate formats, automation, pooled compound libraries, multiplexed detection, data analysis software, etc.) has sometimes been challenging. 1 A variety of AMS-based screening methods have been developed based on the affinity of active compounds for a protein target. Several groups have developed AMS methods such as size exclusion chromatography (SEC) affinity selection MS, 15 pulsed ultrafiltration affinity selection MS, 16 frontal affinity chromatography MS, 17 magnetic microbead affinity selection MS, 18 and matrix-assisted laser desorption ionization (MALDI)–MS on affinity captured ligands. 19 These methods utilize the enrichment of active compounds in the presence of a target protein, followed by separation of the protein–small molecule complex from unbound library compounds and detection of interacting active small molecule using MS.
Agilent’s development of the solid-phase extraction (SPE)-based RapidFire (RF)–MS platform has reduced sample analysis time compared with conventional LC-MS and is capable of the robustness and throughput required by HTS.20–23 The RF-MS technology uses an SPE cartridge prior to sample introduction into the MS, requires binary or quaternary pumps, consumes high volumes of solvent, and operates in a continuous electrospray ionization (ESI) mode. In addition, there is a risk of carryover between two sample injections. In contrast, MALDI-MS and laser diode thermal desorption (LDTD)–MS are pulsed ionization MS techniques that require no fluidics, and hence minimal solvent consumption, and are compatible with several microtiter plate formats (96, 384, or 1536) used in HTS assays; there is a low risk of carryover between two samples. However, the drawbacks of MALDI are the requirement to correctly select an appropriate matrix and uniform sample-matrix spotting on the plate. We instead explored an LDTD–atmospheric pressure chemical ionization (APCI) ionization source (Phytronix, Quebec, Canada) coupled with a SCIEX 5600+ TripleTOF MS as an alternative AMS platform.
In a typical LDTD-MS workflow, a small volume of sample (0.5–3 µL) is mixed with an organic solvent (methanol, ethanol, etc.) and spotted onto a 384- or 1536-format coated multiwell stainless-steel plate (LazWell Phytronix, Quebec, Canada). The LDTD Luxon Ion Source uses a fiber-optic-coupled diode laser for local and uniform heating of plate wells, and indirect thermalization rapidly evaporates the predried sample. The thermally desorbed neutral molecules are transferred to the corona discharge region of the ion source by a carrier gas (nitrogen) and neutral molecules undergo APCI. Ionized molecules usually carry a + 1 or −1 charge depending on the detection mode of MS. The LDTD method combined with typical liquid handling robotics is compatible with low sample volumes, requires minimal sample preparation, requires no SPE or similar separation step, uses no high-maintenance fluidics, and consumes only minor amounts of solvent, making it an ideal platform for an AMS approach.24–26 In this study, we also evaluated positive-ion-mode time of flight (TOF) and Sequential Window Acquisition of All Theoretical Mass Spectra (SWATH-MS), a data-independent acquisition method, for compound identification. In LDTD-TOF and LDTD-SWATH acquisition methods, the instrument acquires TOF MS for a select mass range followed by sequential MS/MS scans of predivided mass range over a fixed accumulation and cycle time.27–29 SWATH MS/MS scans were acquired over variable mass-to-charge (m/z) segments and at zero collision energy ( Suppl. Table S1 ). For application to HTS, nontargeted MS acquisition methods (MS and MS/MS) are preferred, as users often have no prior experimental data. Hence, correct identification of compounds with minimal false positives or false negatives is necessary.30,31 Although we have developed a nontargeted MS acquisition method, compound identification was done with a known set of library compounds since the identity of each compound in the screening library is known. With a large library of compounds and an even larger MS data set, data analysis is a challenge particularly in an HTS environment, where high throughput is key. The availability of commercial data analysis software is still a bottleneck in the HTS workflow. Many commercial software packages (usually from instrument vendors) lack plate mapping capability and do not function well across different mass spectrometers from different vendors with different data outputs. To overcome these challenges, we developed an in-house informatics tool and applied it to data generated from the LDTD-MS system to develop the complete workflow of the LDTD-MS AMS platform described herein.
Materials and Methods
Preparation of 384-Well SEC Plates
Three hundred eighty-four-well SEC plates (74-0000, P2 material) from Harvard Apparatus (Holliston, MA) were centrifuged at 500g for 1 min to compact the P2 gel material before addition of assay buffer. Assay buffer, 66.67 mM potassium phosphate, pH 7.4, prepared in-house, was added to the plates at 35 µL per well using a Bravo liquid handler (Santa Clara, CA). All the SEC plates (Target+ and Target–) were equilibrated with assay buffer for 1 min, followed by centrifugation for 1 min at 500g to remove the excess assay buffer. This equilibration step was repeated three times.
Preparation of Positive and Negative Control Compounds, Pooled Compound Library, and Target Protein
The target protein (carbonic anhydrase [CA]) and positive and negative controls were analyzed by RF-MS to confirm the molecular mass, purity, and ionization in a positive ion mode ( Suppl. Fig. S1 ). The positive control compound 6-ethoxy-2-benzothiazolesulfonamide was obtained from Sigma Aldrich (St. Louis, MO, 333328). The negative control and pooled compound library were obtained from Amgen’s sample bank in a single vial and in a 384-well plate format ( Suppl. Fig. S2 ), respectively. Stock solutions of positive and negative controls were prepared in DMSO at a final concentration of 47.2 µM. The pooled compound library plate has 212 equimolar unique compounds per well in 320 wells, for a total of 67,848 compounds per 384-well plate, and pooled controls in the four corner wells with a final concentration of 47.2 μM per compound in DMSO. The pooled library was mass encoded so that the monoisotopic masses of compounds sharing a well differed by >0.3 amu. Target protein CA (Sigma Aldrich, C2624) was prepared in an assay buffer at a final concentration of 5 µM.
Preparation of Assay Plates
For the AMS assay, two 384-well plates (781280, PP-microplate, V-bottom) from Greiner Bio-One (Monroe, NC) were used. Plates were labeled as “Target+” and “Target–,” indicating compound incubation with a target protein or compound incubation with assay buffer, respectively. An equimolar mixture (47.2 µM) of positive and negative control at 1 µL was added to the four corner wells of each plate. Additionally, 1 µL of pooled compounds at 47.2 µM was transferred to the remaining 320 wells on each plate ( Suppl. Fig. S2 ). CA or assay buffer (46.2 µL of either) was transferred to the Target+ and Target– plates, respectively, and incubated for 1 h at room temperature with gentle shaking. After reaction incubation, 35 µL of sample was transferred to preequilibrated 384-well SEC plates. After centrifugation at 500g for 1 min, eluent was collected in new 384-well plates and diluted 1:10 in 75% methanol/water, and 2 µL of sample was transferred to LDTD 384-well DEC (Desorption-Enhancing Coating) plates (LazWell DEC, 100071100003) from Phytronix. Sample addition or sample transfer steps were performed using an automated liquid handling robot (Bravo, Agilent Technologies). Prior to analysis, plates were air-dried using a plate dryer (Phytronix) for 2 min, and the dried plates were loaded onto the Luxon S-3840 (Phytronix) plate stacker for MS acquisition after fully drying. Typically, dried compound plates were read immediately or within 1 h after drying. However, calibration LDTD DEC plates containing compounds used for mass calibration were routinely prepared in advance, air-dried as above, and stored in the plastic case supplied by the manufacturer until analyzed. These plates produced consistent ion intensities and successful mass calibration.
LDTD-MS Method
An optimized LDTD method (Luxon S-3840) and MS acquisition method parameters (SCIEX 5600+ TripleTOF MS) are provided in Supplemental Table S1 . The LDTD time was set at 11 s per well, including a 5 s ramp, 2 s hold, and total start and end delay of 4 s. The laser power was set at 65% and a constant airflow rate of 3 L/min. MS was calibrated in a positive APCI ion mode for a m/z range of 100–700 using acetaminophen, dextromethorphan, clomiphene, and reserpine calibrants. In both TOF MS and MS/MS (SWATH) acquisition methods, the m/z range was set at 100–700 to accommodate all compound masses in the compound library. The MS (TOF and SWATH) acquisition time was set at 12 s per well, which was divided into a TOF acquisition (1.2 s) and eight consecutive SWATH acquisitions (1.2 s per SWATH window). The total acquisition time for a 384-well plate (324 samples per plate) was around 65 or 130 min for a plate with a “Target+/Target–” pair.
RF-MS Method
Accurate Mass Q-TOF LC-MS 6530 and RapidFire G9203A (Agilent Technologies) were used for parallel validation of AMS assay using controls. RF-MS parameters are provided in Supplemental Table S2 . RF-MS Q-TOF was calibrated in a positive ESI mode prior to AMS data acquisition. In addition, RF-MS was used to acquire the mass spectra of the target protein CA and the positive and negative control compounds ( Suppl. Fig. S1 ).
In-House Data Analysis Platform
The software provided with the SCIEX (OS-Q) was not intended for use with pooled compounds, so a custom software application was developed to analyze the data. In-house software include features such as spectral processing, m/z peak identification, m/z peak area calculations, and plate mapping capability. The software was developed as a module, Affinity MS Pipeline, in a C#.NET desktop application called Discovery Technologies Informatic Process Automator (DTIPA). It has a graphic user interface and is user driven, relying on the user to locate the input data, configure analysis settings, and launch the analysis. The spectral data files follow a naming convention, so the software can align the plate maps to the spectral data, as well as identify the matching Target+ and Target– plates. The analysis steps are given below:
Convert raw SCIEX data (.wiff and .wiff.scan files) to .mzml format using msconvert command line (http://proteowizard.sourceforge.net/tools/msconvert.html).
Load plate maps of Target+ and Target– plates and corresponding compound information per well (plate ID, well ID, compound ID, molecular mass).
Load spectra data for all plates from .mzml files.
For Target+ plate:
a. Average the spectral data across time resulting in single intensity versus m/z vector.
b. For each expected compound:
i. Narrow analysis window to ±150 ppm around expected m/z monoisotopic peak.
ii. Identify prominent peak in ±100 ppm of expected monoisotopic peak.
iii. Calculate “area under the m/z peak” as sum of intensity point ±20 ppm from identified peak and divide by number of points. This equates to the average of intensity ±20 ppm around the identified peak.
c. Perform quality checks such as parts per million threshold and intensity threshold.
d. Record the intensity of peak, parts per million, and area.
5. Repeat step 4 for Target– plate.
6. The ratio of area (target+)/area (target–) is calculated and the percent of enrichment (POE) is reported.
7. Calculated parameters:
a. POE = 100 × [peak area (target+)/peak area (target–)]
b. Strictly standardized mean difference
CA Enzymatic Assay
Several representative example hits and the positive control compound were assayed in an orthogonal enzymatic activity assay (see
Fig. 5
).
32
CA converts 4-nitrophenyl acetate (4-NPA) (Sigma Aldrich, N8130) to 4-nitrophenolate, which has an absorbance maximum at 405 nm. The final concentrations of 4-NPA (125 µM) and CA (25 nM) and the reaction time (2 h) were optimized to maintain initial linear rates of reaction. For the inhibition assay, a stock of CA was prepared at 1 µM in an assay buffer containing 0.05% bovine serum albumin (BSA; Sigma, A3294). Substrate stock 4-NPA was prepared at 2.5 mM in 100% DMSO. Hit compounds and the positive control compound were provided by Amgen’s sample bank in a 10-point (1:3) dilution format at concentrations of 10 mM to 0.0005 mM in 100% DMSO. The inhibition assay was run in a 384-well microplate (Corning Inc., 3640). Plate wells were designated as “buffer control” (BC), “enzyme control” (EC), and “inhibitor” (I). Buffer control wells contained 95 µL of assay buffer with 0.05% BSA and 5 µL of 4-NPA at 2.5 mM. Enzyme control wells contained 90 µL of assay buffer with 0.05% BSA, 5 µL of CA at 1 µM, and 5 µL of 4-NPA at 2.5 mM. Inhibitor wells contained 90 µL of assay buffer with 0.05% BSA, 5 µL of CA at 1 µM, 5 µL of 4-NPA at 2.5 mM, and 1 µL of inhibitor from 10 mM to 0.0005 mM. The enzymatic reaction was carried out at room temperature and the plate was read by a spectrophotometer (Tecan Safire 2 multimode microplate reader, Baldwin Park, CA) at 405 nm after 2 min incubation. The POC (percent of positive enzyme control) was calculated according to
Results
Library Compound Detection by LDTD-TOF and LDTD-SWATH Methods
To first assess the robustness and consistency of compound detection (without the inclusion of target protein or an AMS separation step), we evaluated a compound pool composed of 212 compounds from Amgen’s screening collection. Pooled compound sample was prepared by diluting pooled compound stock in a 75% methanol/25% water mixture (1:10) at a final compound concentration of 1 µM. Two microliters of sample was spotted in duplicate on an LDTD 384-well DEC plate, air-dried, and acquired by the LDTD-MS method in positive mode. Instrument parameters are shown in Supplemental Table S1 . We identified individual compounds in this pooled compound library and evaluated the reproducibility of compound identification using the in-house DTIPA software. We found that under these conditions at a concentration of 1 µM more than 70% or 80% of the total compounds were identified definitively and consistently depending on the mass error criteria used (±20 or ±50 ppm). Presumably, remaining compounds were not detected due to poor ionization under the conditions employed (positive ion mode at a compound concentration of 1 µM), or clear peak identification was confounded by coincidental compound peak overlap in the pooled samples. While we attempted to minimize peak overlap by mass encoding of the library, the presence of isotopic peaks for some compounds still sometimes resulted in partial peak overlap. Identification of a higher fraction of compounds could likely be achieved by a parallel analysis in negative ion mode or by more judicious assembly of library compounds to achieve more optimal isotopic separation. In the above experiment, compound identification by both methods (TOF and SWATH) was highly reproducible with R2 values greater than 0.90 ( Suppl. Fig. S3 ).
Control Ligands in CA AMS Assay
AMS is based on the enrichment and detection of a ligand in the presence of a target protein.33,34 In a typical AMS experiment, relatively high-affinity interactions (nanomolar to micromolar) between a protein target and a small-molecule ligand are required for the formation of a stable protein–ligand complex, followed by subsequent isolation, for example, using rapid SEC, and detection of interacting ligands by high-resolution MS. In this assay, CA, a zinc-containing enzyme that catalyzes the reversible hydration of carbon dioxide, was used as a target protein. There are several reported sulfonamide-containing inhibitors of CA with Kd values ranging from high micromolar to subnanomolar.35–37 We used a known CA inhibitor, the commercially available 6-ethoxy-2-benzothiazolesulfonamide, as a positive control ligand, which has low nanomolar affinity for CA (Kd of ~1 nM). Negative control compounds that did not bind CA were selected from Amgen’s compound library. The success of the AMS protocol was evaluated based on significant enrichment of the positive control compound and no enrichment of a negative control compound ( Suppl. Fig. S7 ). We tested positive and negative control compounds using both the LDTD-MS and RF-MS methods. Figure 1 shows the POE for positive and negative control compounds derived from both methods. POE values for the negative control were consistently low regardless of the mode of ionization and instrument parameters: ~100 POE or ~1-fold, indicating no enrichment in the presence of a target protein. In contrast, the positive control showed 10- to 100-fold enrichment depending on the method used (TOF or SWATH) and instrument platform (RF-MS or LDTD-MS). TOF acquisition by positive APCI and positive ESI showed 42- and 17-fold enrichment, respectively. The difference in the enrichment could be attributed to different ionization efficiencies based on mode of ionization and instrument parameters. SWATH positive APCI MS showed greater than 100-fold enrichment of the positive control compound. In addition, SSMD values were consistently greater than 1.65 across all MS acquisition methods for this pair of controls, indicating the robustness of the assay.38,39
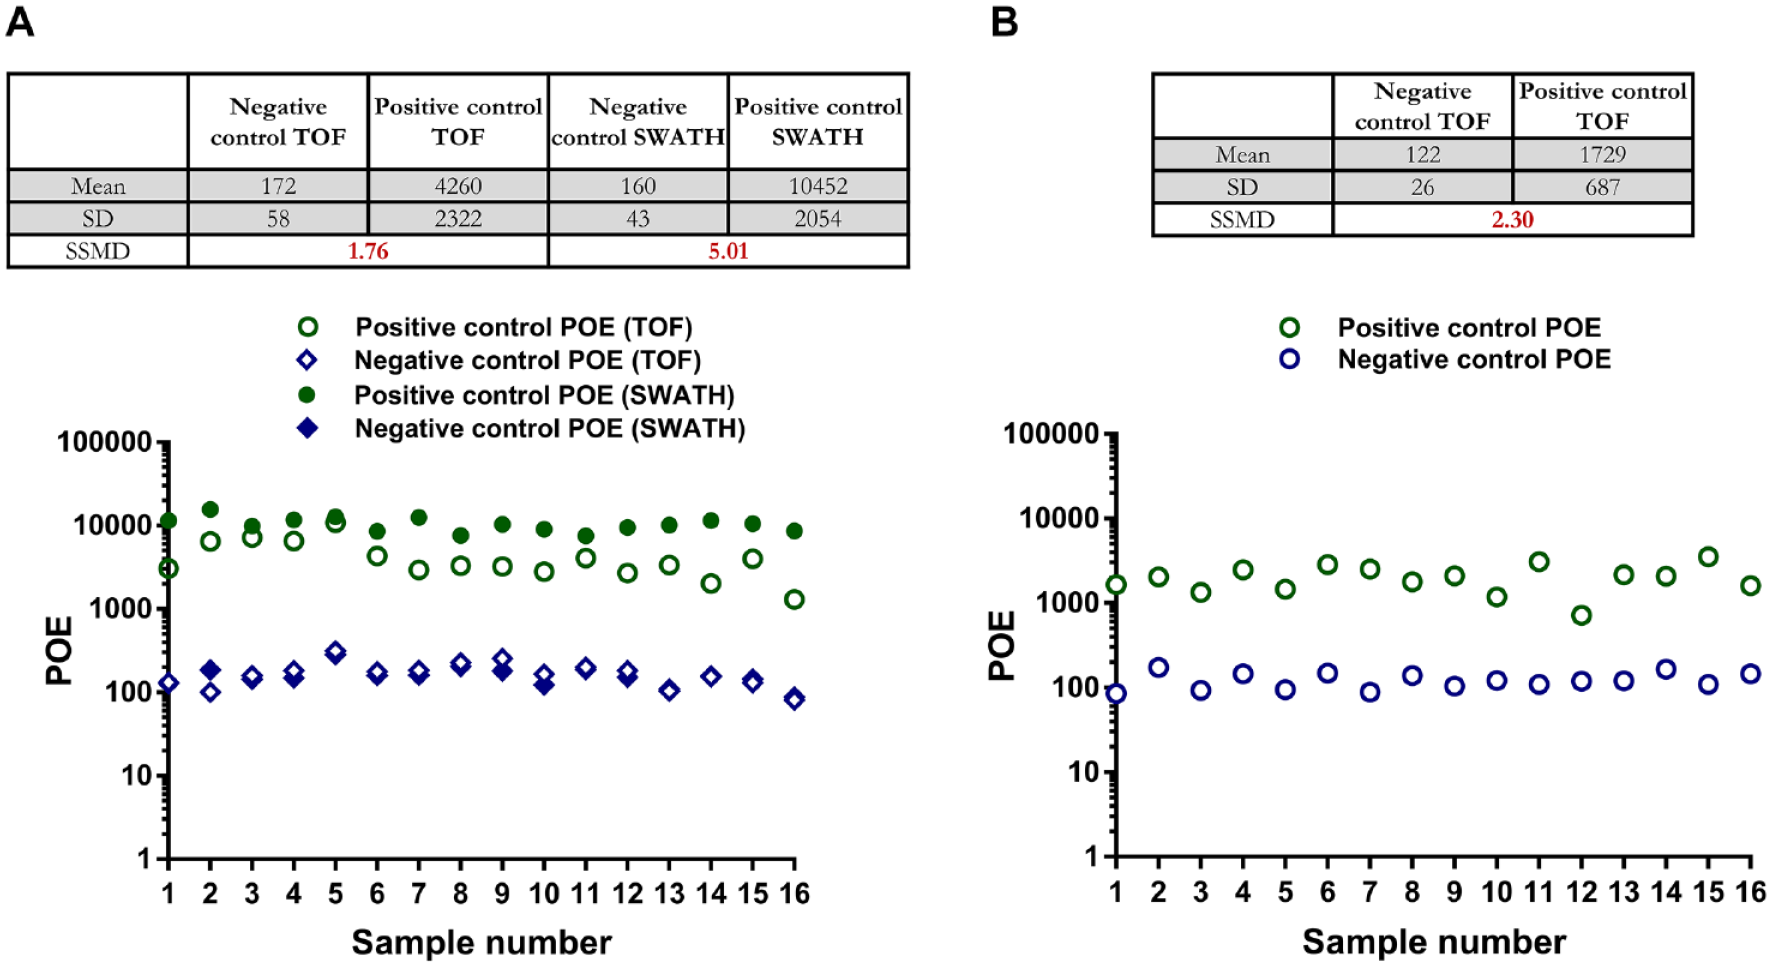
POE values of 16 samples containing an equimolar mixture of positive and negative controls. Assay statistical parameters such as mean POE, standard deviation (SD), and strictly SSMD values are provided for (
Screening of Pooled Compound Library Using an LDTD-AMS Assay
We tested a subset of Amgen’s pooled compound library in a 384-well format in duplicate on two separate days against CA. AMS screens typically use compound pools to increase throughput and decrease the amount of protein required for the screen. The pooled compound library we used in this instance contained 67,848 unique compounds in 320 wells (212 compounds per well) and pooled controls (positive and negative) in 4 wells at each corner of a single microtiter plate. CA was titrated (while the concentration of the positive control compound was fixed at 1 µM) to optimize the protein concentration for the AMS assay. Ultimately, 5 µM CA was used to screen the pooled compound library ( Suppl. Fig. S5 ). Positive controls in both replicates showed 30- and 100-fold enrichment using TOF MS and SWATH MS, respectively, and SSMDs were greater than 1.65. These controls were used as validation of the AMS assay during the screen of the pooled compound plate run ( Suppl. Fig. S4 ). The 67,848-compound plate was screened twice using each method.
To select hits efficiently and consistently from the pooled compound library, simple hit selection criteria were implemented to reduce false positives and false negatives from the screen. First, hit compounds were required to fall within a preset mass error criterion of ≤ ±20 ppm (Target+ plate mass error ≤ ±20 ppm). Second, hit compounds were required to meet a minimum enrichment threshold of the mean enrichment (POE) of all test compounds plus 3× the standard deviation (mean+3×SD), a hit threshold widely used in HTS. The “mass error filter” when applied to the TOF data set resulted in 10,777 compounds and when applied to the SWATH data set resulted in 13,154 compounds. There were 52 hits (hit rate = 0.07%) and 51 hits (hit rate = 0.07%) above their respective POE thresholds in the TOF and SWATH data sets, respectively.
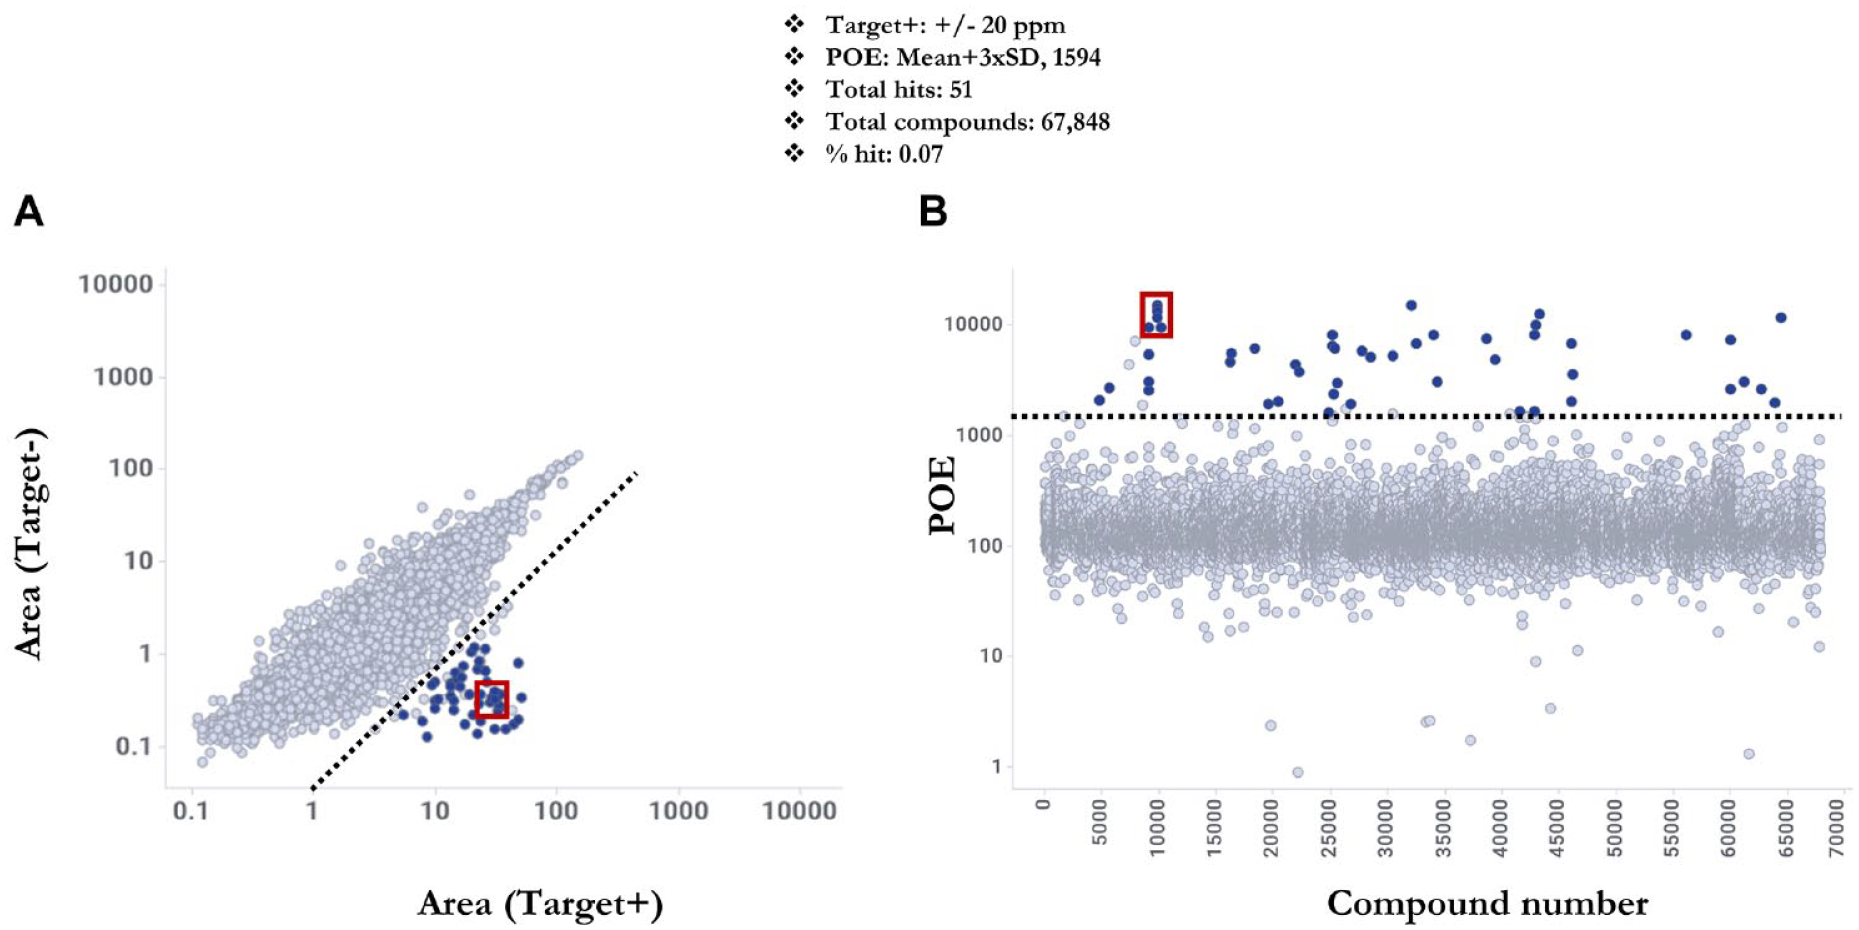
LDTD-AMS SWATH method data for a full 384-well plate. (
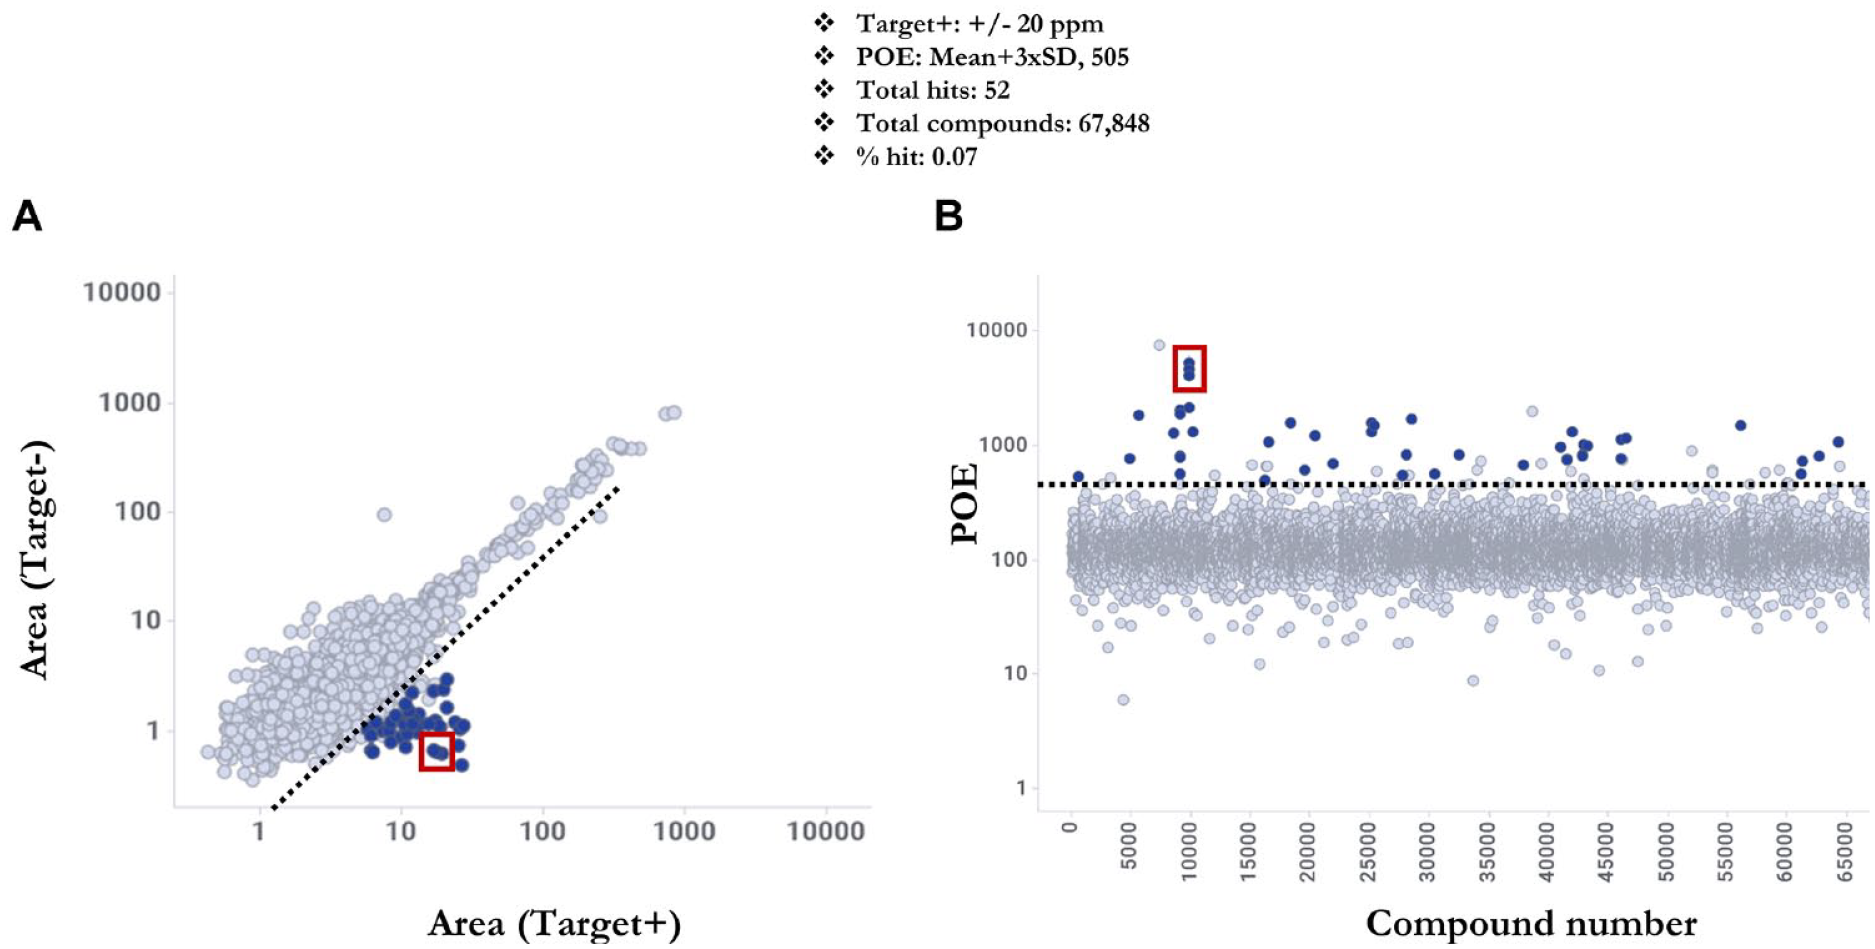
LDTD-AMS TOF method data for a full 384-well plate. (
The reproducibility of hit compound identification in HTS is critically important, with hit compounds that are selected in HTS requiring downstream hit confirmation (usually in duplicate or triplicate) and further characterization in additional assays. In this study, all 68,000 compounds, not just the hits, were tested in duplicate on different days to assess the reproducibility of the assay and compare the analysis methods. The POE values of all library compounds in duplicate AMS experiments analyzed by the TOF and SWATH methods are shown in Figure 4 . In the SWATH and TOF methods, 86% and 88%, respectively, of the hits identified in the first 68,000-compound screen were confirmed in the duplicate screen of these 68,000 compounds.
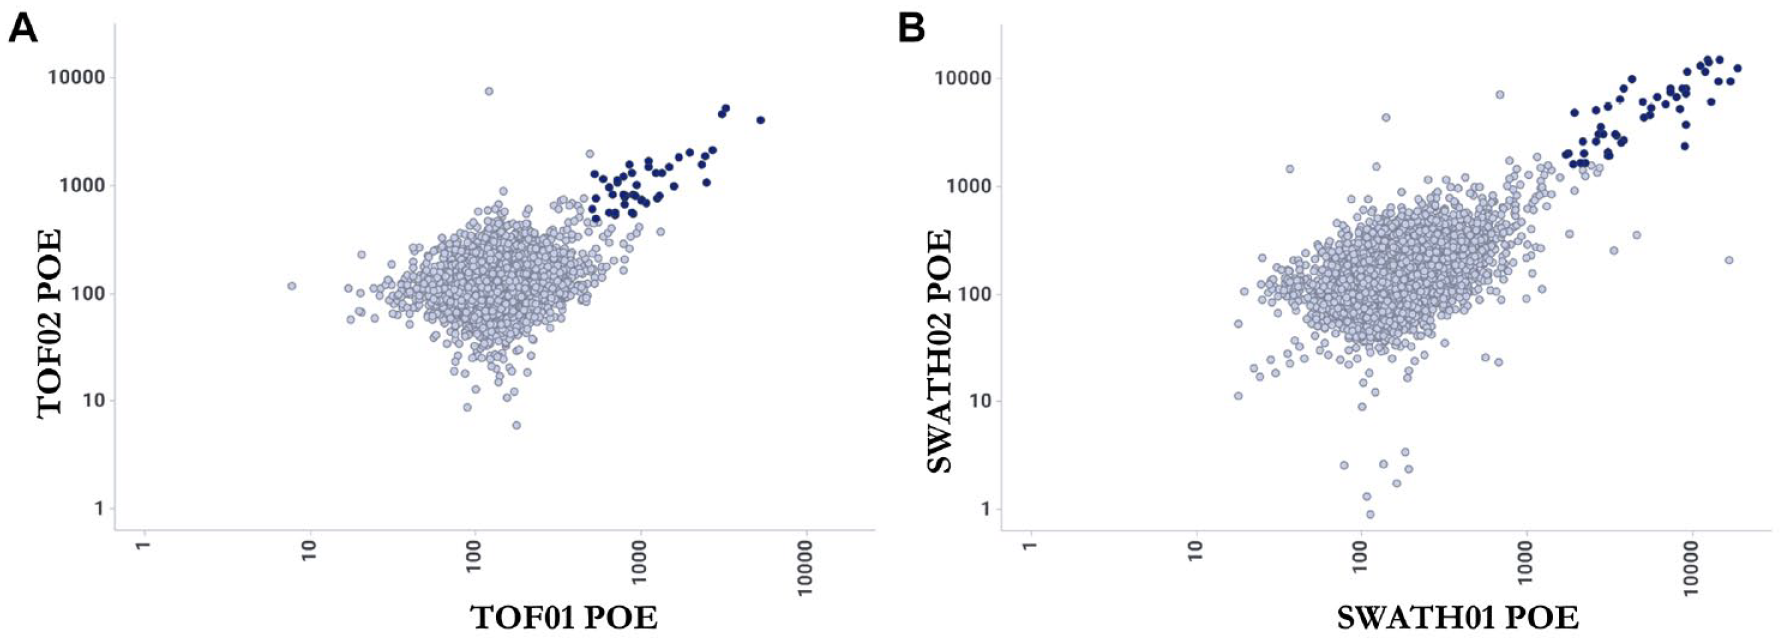
Reproducibility of compounds identified as positive hits by the (
Structural Analysis of Library Hits
The small-molecule drug discovery process relies on the identification of hit compounds that interact specifically with a macromolecular target, usually a protein, but sometimes a nucleic acid or other target.40,41 Typically, small molecules interact with a protein target via multiple specific noncovalent interactions to inhibit or antagonize or to activate or agonize the activity of the target protein.42,43 Drug–target interactions are driven by the structure of the small molecule and the binding pocket on the target protein. In this study, we analyzed structural features of hit compounds, categorized them based on substructures, and compared resulting substructures with the substructures of a positive control ligand to identify common structural features. 44 LDTD-TOF identified 52 deemed hit compounds, and LDTD-SWATH identified 51 deemed hit compounds. Out of the total hits, 44 compounds were common hits identified by both methods, 8 compounds were deemed hits only in LDTD-TOF, and 7 compounds were deemed hits only in LDTD-SWATH ( Suppl. Figs. S6 and S9 ). These 59 total hits were categorized into 139 distinct substructures. The positive control, 6-ethoxy-1,3-benzothiazole-2-sulfonamide, has six distinct substructures and belongs to an aryl sulfonamide subfamily ( Suppl. Table S3 ). We found that 57 of the 59 identified hits (97%) contained an aryl sulfonamide as a distinct substructure and, in addition, were structurally similar to the positive control ligand ( Fig. 5 ). Furthermore, studies by several groups45–48 have reported the discovery of various aryl sulfonamide-based inhibitors for different isoforms of CA.
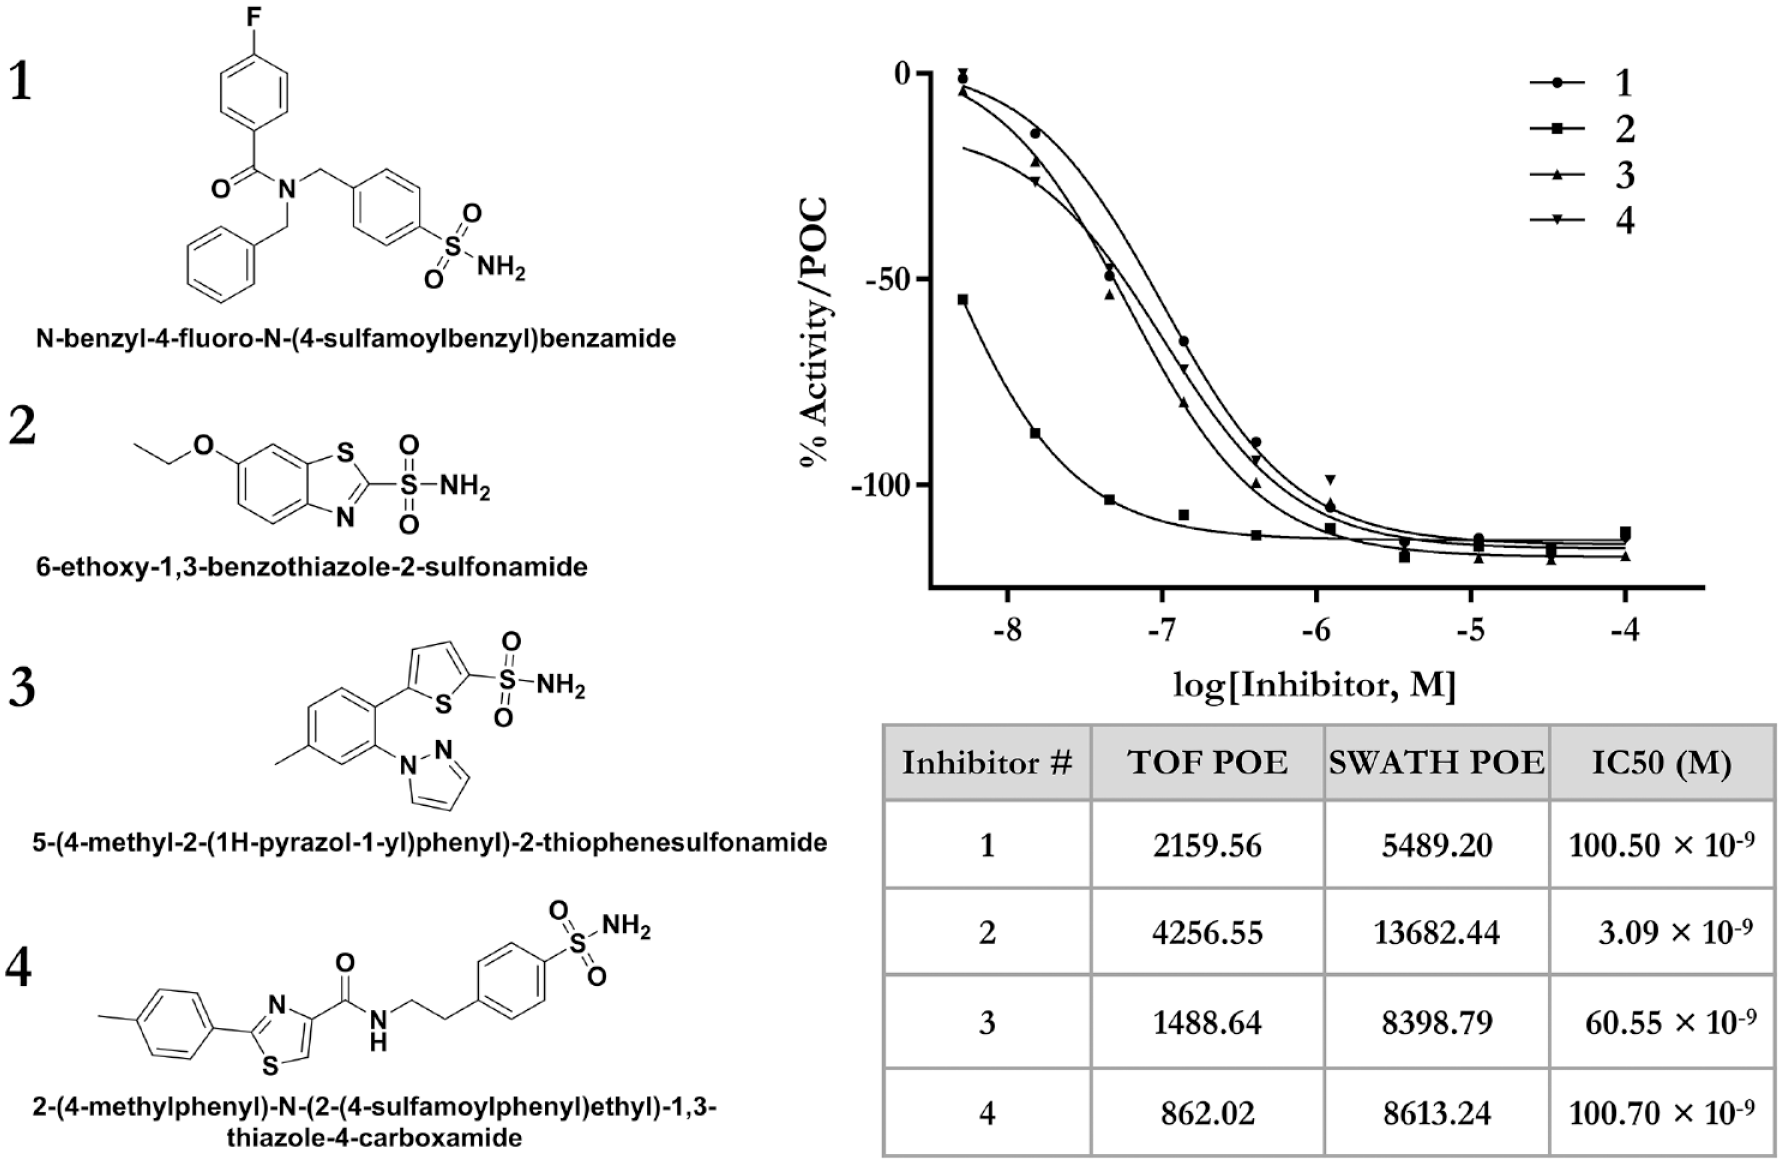
Selected examples of representative hit compounds (1, 3, and 4) and a positive control compound (2). Concentration–response curves of compounds 1–4 in orthogonal CA enzymatic assay are shown. The table shows POE values of compounds in the AMS assay and IC50 values of the same compounds in the enzymatic assay. Aryl sulfonamides comprised 97% of the hits, indicating strong selection of these compounds, including the functional group by CA in the AMS assay.
Confirmation of AMS Hits in an Orthogonal Enzymatic Assay
We tested affinity hits selected by the AMS screen in an orthogonal enzymatic assay. Selected hits and the reference inhibitor were assayed in a CA enzymatic assay and the IC50 values were determined ( Fig. 5 ). The results confirm that each of the selected affinity hits were active in the CA enzymatic assay, with IC50 values ranging from 60 to 100 nM. The reference inhibitor IC50 was determined to be 3 nM in accord with the reported literature value. 37
Discussion
HTS platforms provide a means to winnow a vast library of compounds to a smaller number of potentially useful hits in early small-molecule drug discovery efforts. HTS assays measuring target activity, for example, enzyme assays, often require labeled reagents that may contribute to assay complexity and may be costly. Such assays using fluorescence- or luminescence-based assay technologies are subject to compound interferences. In addition, activity-based assays usually require some level of customized assay development as each target typically features its own specific pharmacology. In contrast, label-free affinity-based approaches such as AMS afford the advantages of no special reagent requirements, the absence of fluorescence or luminescence interferences, and the requirement for only minor modifications in the assay protocol to accommodate a wide variety of different therapeutic targets. Furthermore, the identity of ligands identified by AMS is unambiguous since the ligand is directly detected. Disadvantages of AMS are that it is not applicable to all targets, for example, cellular targets; AMS may fail to detect weaker, faster off-rate, or poorly ionizable ligands; and AMS often has a larger protein requirement compared with activity-based screens. In addition, AMS hits should usually be confirmed in an orthogonal binding or other assay to confirm and quantitate affinity.
AMS is a true label-free platform where direct detection of an analyte in the presence of a target protein is possible. The appeal of AMS technology has led to multiple reports of the implementation of AMS platforms in industry or in academia,35,49,50 either as an orthogonal screening approach or as an orthogonal assay to confirm hits identified by activity-based screens. At Amgen, we have employed Agilent’s RF-MS technology for small-molecule AMS. Given various challenges with the RF-MS technology, such as high solvent consumption, risk of carryover between sample injections, high maintenance requirements, relatively high sample volumes, and complex data analysis, we developed a high-throughput LDTD-APCI-MS platform for AMS that requires no fluidics for desalting prior to the MS step, has relatively low sample volumes, requires only minimal solvent consumption, and has no risk of sample carryover between samples. A key difference between RF-MS and LDTD-MS is the desalting/ionization step. While RapidFire injects a solution and uses SPE to rapidly desalt samples prior to introduction to the mass spectrometer, LDTD uses a laser to selectively thermally desorb organic molecules from a predried sample. Drying is usually rapid (~2 min). While compound plates are usually read immediately or within 1 h after drying, calibrant plates containing mass calibration compounds were prepared, dried, stored for days, and used successfully with consistent results. We used a plate dryer to ensure rapid, complete, and more uniform drying during screening, although this is not necessary for good results using LDTD. A drawback of LDTD is that some higher-molecular-weight compounds, for example, peptides, do not undergo efficient desorption and therefore do not ionize well using LDTD, which is primarily used for small molecules.
We report a new data-independent acquisition (DIA) MS/MS SWATH method for the analysis of data from the compound pools usually employed in AMS screening. This SWATH acquisition method consecutively scans a narrow range of m/z in Q1 (at collision energy [CE] = 0), providing greater sensitivity than traditional TOF methods. The higher sensitivity of SWATH acquisition makes this LDTD-MS technology suitable for compounds at low concentration in the AMS workflow (e.g., Suppl. Fig. S8 ). AMS data analysis has been a challenging task due to the complexity of the pooled compound library, differences in the MS output format (in this case, SWATH data), and the lack of appropriate commercial vendor software. To overcome these challenges, in-house informatics were developed to analyze data from AMS of pooled compounds. Key features of the informatics software include library-dependent peak selection, peak integration, mass accuracy threshold limits, peak area ratio calculations, and data visualization. The in-house informatics platform simplified the data analysis workflow and reduced analysis time by four- to fivefold. We observed that 70% or 80% of the compounds at a concentration of 1 µM were successfully identified using 20 or 50 ppm mass error criteria from a pooled compound library. We attribute the failure to identify some compounds to the ionization method used (positive ion mode vs negative ion mode), differing compound ionization efficiencies, and unintended isotopic overlap of some compounds in the pooled library. Compound identification coverage could be improved by including parallel negative APCI acquisition or by more judicious assembly of library compound pools to achieve more optimal isotopic separations. In addition, while an inability to detect poorly ionizable ligands is a disadvantage of any AMS approach, not just LDTD-MS, compounds not detected at 1 µM in the above experiment could still be detected if they were sufficiently enriched by target protein binding to increase their concentration above the level of detection during analysis.
In this paper, we describe the screening by LDTD-AMS of a 68,000-member pooled library with CA as a model target protein. While the results described herein pertain to this specific screen, we have also screened >500,000-member libraries against additional targets using this same approach, demonstrating the general applicability and scalability of LDTD-AMS to libraries of the size and composition typical of large pharmaceutical collections. Notably, at the level of pooling we employed (212 compounds per well), screening 500,000 compounds requires only 16 plates, reducing the cost of such consumables. In the CA screen, the positive control ligand showed 10- to 100-fold enrichment in the presence of target protein, which is comparable to the results obtained from RF-MS. In this screen, 0.07% of the total compounds passed preestablished hit QC criteria and were deemed primary hits. Duplicate screens of all 68,000 compounds indicated that hits were consistently identified (overlap of 86% of hits identified by the SWATH method vs 88% of hits from the TOF method), signifying the high reproducibility of the approach. There was also considerable overlap of hits between the TOF and SWATH methods (75% of hits in common between the TOF and SWATH methods). Of the confirmed primary hits, 97% of compounds were aryl sulfonamides, which as a group includes several classical CA inhibitors. Although we achieved a modest reduction in time spent on data acquisition with the current LDTD-MS method (~130 min for LDTD-MS and ~150 min for RF-MS for two 384-well plates), it is possible that faster MS acquisition methods could reduce the acquisition time by up to 50% if cycle time or the number of cycles was reduced ( Suppl. Table S1 ). Furthermore, in-house software has simplified the data analysis workflow and reduced the overall analysis time significantly (up to fivefold). The current software also includes several important features, such as spectral visualization, chromatographic visualization, and peak smoothing. Finally, selected hits and the reference inhibitor were tested in an orthogonal (enzymatic) colorimetric assay of CA activity, resulting in the confirmation of each hit tested as a submicromolar inhibitor. In summary, LDTD-MS can be used in a rapid, high-sensitivity AMS platform suitable for compound library affinity screening and reproducible hit identification, as well as the confirmation of hits from activity-based screens.
Supplemental Material
sj-pdf-1-jbx-10.1177_2472555220979596 – Supplemental material for Development of a High-Throughput Affinity Mass Spectrometry (AMS) Platform Using Laser Diode Thermal Desorption Ionization Coupled to Mass Spectrometry (LDTD-MS)
Supplemental material, sj-pdf-1-jbx-10.1177_2472555220979596 for Development of a High-Throughput Affinity Mass Spectrometry (AMS) Platform Using Laser Diode Thermal Desorption Ionization Coupled to Mass Spectrometry (LDTD-MS) by Aniruddha Sahasrabuddhe, Dylan Oakley, Kui Chen and John D. McCarter in SLAS Discovery
Footnotes
Acknowledgements
We thank Shaokun Pang (SCIEX) and Pierre Picard (Phytronix) for helpful discussions and Amanda Lembke (Amgen) for sample management. All authors are employees of Amgen, Inc.
Supplemental material is available online with this article.
Declaration of Conflicting Interests
The authors declared the following potential conflicts of interest with respect to the research, authorship, and/or publication of this article: All authors are employees and stockholders of Amgen, Inc.
Funding
The authors received no financial support for the research, authorship, and/or publication of this article.
References
Supplementary Material
Please find the following supplemental material available below.
For Open Access articles published under a Creative Commons License, all supplemental material carries the same license as the article it is associated with.
For non-Open Access articles published, all supplemental material carries a non-exclusive license, and permission requests for re-use of supplemental material or any part of supplemental material shall be sent directly to the copyright owner as specified in the copyright notice associated with the article.