
Abstract
Epigenetic aberrations are increasingly regarded as key factors in cancer progression. Recently, deregulation of histone acetyltransferases (HATs) has been linked to several types of cancer. Monocytic leukemia zinc finger protein (MOZ) is a member of the MYST family of HATs, which regulate gene expression in cell proliferation and differentiation. Deregulation of these processes through constitutively active MOZ fusion proteins gives rise to the formation of leukemic stem cells, rendering MOZ an excellent target for treating myeloid leukemia. The authors implemented a hit discovery campaign to identify small-molecule inhibitors of MOZ-HAT activity. They developed a robust, homogeneous assay measuring the acetylation of synthetic histone peptides. In a primary screening campaign testing 243 000 lead-like compounds, they identified inhibitors from several chemical classes. Secondary assays were used to eliminate assay-interfering compounds and prioritize confirmed hits. This study establishes a new high-throughput assay for HAT activity and could provide the foundation for the development of a new class of drugs for the treatment of leukemias.
Introduction
A
Seventeen lysine acetyltransferases have been described to date in humans, most of which target histones as their primary substrate. The MYST (named for members MOZ, Ybf2/Sas3, Sas2, and Tip60) proteins are the largest family, having five members, including monocytic leukemia zinc finger protein (MOZ, MYST3). 3 MYST histone acetyltransferases (HATs) comprise about one third of the capacity of the human genome to regulate chromatin structure at the level of histone acetylation. They have a diverse range of biological activities, ranging from regulation of the cell cycle and adult stem cell homeostasis to patterning of the early embryo and regulation of chromatin structure across broad chromosomal domains. 4 Because MYST proteins are intimately associated with the transcriptional activity of the genome in general, as well as regulating gene expression at specific loci, it is not surprising that mutations in MYST genes are also associated with cancer. 5
The MOZ gene was initially identified through its involvement in a recurrent translocation that leads to a fusion with CREB-binding protein gene (CBP). 6 Other translocation events leading to the fusion of MOZ to a variety of other genes have since been described, which also lead to leukemia. 5 Leukemias involving MOZ fusion proteins have a very poor prognosis, with a mean survival time of less than 5 months. 7 MOZ fusion proteins in acute myeloid leukemia have a typical gene expression profile that includes overexpression of HOX genes, which are central regulators of blood formation. 8 We have previously demonstrated that MOZ is a global regulator of Hox gene expression and is required for histone H3K9 acetylation at Hox loci. 9 MOZ function is critical for the development of long-term repopulating hematopoietic stem cells. 10 The HAT activity of MOZ is essential for its function in hematopoiesis. 11 Interestingly, the MOZ-TIF2, but not the BCR-ABL fusion protein (found in CML), is able to induce self-renewal in transformed progenitor cells. 12 These results show that MOZ is a key transcriptional regulator both in normal hematopoiesis and in oncogenic pathways leading to leukemia.
Because of their potent biological activities, the interest in drugs that can modulate the activity of chromatin-modifying enzymes has surged in recent years. So far, two classes of epigenetic targeted drugs have been applied in clinical trials: histone deacetylase inhibitors (HDACi) and DNA methylation inhibitors. 13 Although the activity of HDACi may also influence nonhistone proteins, the overall effect of both classes is mediated by increased transcriptional access to associated genes. In contrast, there are classes of cancer where overexpression or ectopic expression leads to disease, which could benefit from HAT inhibition.
A number of approaches have been described for identification of small-molecule inhibitors of HATs. These include the development of bisubstrate analogs by combining AcCoA with a peptide that inhibits GCN5 and p300 with sub-micromolar affinity; however, these analogues do not possess drug-like structures. 14 Garcinal, a polyprenylated natural product, is an inhibitor of p300 and pCAF with micromolar activity but also acts as a global inhibitor of expression in HeLa cells and increases apoptosis. 15 In addition, synthetic small-molecule inhibitors of p300 HAT activity have been described in the literature.16,17 However, medicinal chemistry optimization toward drug-like molecules may be limited, as the compounds generally contain groups with the potential for protein reactivity. Clearly, there is an unmet need to identify lead-like molecules as starting points for drug development.
The primary aim of the work described here was the development of an assay format capable of high-throughput application and robustness to interference to identify noncovalent inhibitors of MOZ from our compound library. The utilization of an assay cascade for follow-up of the active library compounds is described.
Materials and Methods
Protein expression and purification
The MYST domain of human MOZ (residues 507–778) was produced as an N-terminal fusion protein with an Escherichia coli–derived NusA solubility tag 18 adjacent to a His6 tag for protein purification via nickel-immobilized metal ion affinity chromatography (Ni-IMAC). To create the pNusA-His6-hMOZ expression vector, a cDNA sequence encoding the respective region was amplified by PCR using primers with flanking 5′ NcoI and 3′ NotI restriction sites and cloned into a pETM60-derived vector. 19 For use in the surface plasmon resonance (SPR) experiments, the human MOZ MYST domain (residues 497–780) was expressed as a N-terminal His6-fusion protein (obtained from the Structural Genomics Consortium, accession number D12-APC027). Also for SPR experiments, the human MOF MYST domain (residues 177–447) was expressed as a fusion protein with a N-terminal His6-tag. To create the pHis6-hMOF expression vector, PCR primers with flanking 5′ NcoI and 3′ NotI restriction sites were used to amplify the respective region that was cloned into a pProEX-HTa vector (Invitrogen, Carlsbad, CA).
For protein production, the pNusA-His6-hMOZ, pHis6-hMOZ, and pHis6-hMOF expression vectors were transformed into E. coli BL21 (DE3) cells. Resulting strains were grown in a Braun Biostat B fermenter at a 10-L scale and induced with 0.1 mM isopropyl 1-thio-β-D-galactopyranoside (IPTG) at 15 °C overnight.
For the purification of NusA-His6-hMOZ for the high-throughput screen (HTS), a 37-g (wet weight) E. coli cell pellet was resuspended in 200 mL lysis buffer (25 mM Tris [pH 8], 500 mM NaCl, 0.02% sodium azide, 0.01% Triton-X 100, 5% glycerol, 10 mM imidazole, 5 mM dithiothreitol [DTT]) plus protease inhibitor tablets (Roche, Basel, Switzerland), 20 µL Benzonase (Merck, Whitehouse Station, NJ), and 100 mg lysozyme (Sigma, St. Louis, MO). Cells were stirred on ice for 1 h and then mechanically lysed by three passes through an Avestin C5 cell homogenizer at 15 000 psi. The resulting cell lysate was centrifuged at 48 000 g for 20 min and the supernatant passed through a 5-µm filter. The NusA-His6-hMOZ protein was then purified on a 5-mL HisTrap column (GE Healthcare, Piscataway, NJ) using a Profinia Protein Purification System (Bio-Rad, Hercules, CA). This was subsequently followed by two gel filtration steps, first using a Superdex 200 26/60 column and a Superdex 75 16/60 column (GE Healthcare). Overall, approximately 15 mg of purified NusA-His6-hMOZ protein in a final buffer of 25 mM Tris (pH 8), 500 mM NaCl, 0.02% sodium azide, 5% glycerol, and 5 mM DTT was produced using this method from the 37-g E. coli pellet.
The enzyme pCAF was purchased from Millipore (Billerica, MA).
Small-molecule libraries
The WEHI 93K HTS and CRC-CTx 153K HTS libraries have been described elsewhere. 20 Briefly, lead-like compounds were selected from a variety of vendors, and all compounds more than 85% similar to any other, as judged by the Tanimoto coefficient, were removed from further consideration. 20 Functional group filters were applied to remove reactive compounds, and additional assay interference filters 20 were applied prior to finalization of the CRC-CTx 153K HTS library. Compounds were dissolved in neat DMSO and stored at a concentration of 5 mM, under a controlled atmosphere (TTP Labtech comPOUND, Melbourn, UK).
HAT activity
The HAT activity of different enzymes was determined using an AlphaScreen-based detection method (PerkinElmer, Waltham, MA). The assay reactions were conducted in a volume of 8 µL in 384-well low-volume assay plates (Greiner, Frickenhausen, Germany or Corning, Lowell, MA). The reactions were performed in assay buffer (100 mM Tris-HCl [pH 7.8], 15 mM NaCl, 1 mM EDTA, 0.01% Tween-20, 1 mM DTT, and 0.02% m/v chicken egg white albumin). Unless stated otherwise, reactions were set up with 15 µM AcCoA (Sigma), 50 nM N-terminal histone H4 peptide (sequence SGRGKGGKGLGKGGAKRHRKV-GGK-biotin; Millipore), 10 nM MOZ enzyme, and acetyl-lysine-specific antibodies (a-AcK [final dilution 1:3500]: Cell Signaling Technology, Danvers, MA; a-H4AcK8-1 [final concentration 50 ng/mL]: Abcam, Cambridge, UK; a-H4AcK8-2 [final dilution 1:3000]: Millipore). In control reactions, fully acetylated histone H4 peptide was used (Millipore).
For the primary HTS, 15 nL of library compound stocks was dry spotted into columns 1 to 22 of the assay plates, and columns 23 and 24 received the same volume of DMSO. The use of these “assay-ready” plates allowed larger batches to be prepared and shipped from the central compound storage, before the substrate and enzyme were added in close succession. For follow-up experiments, 11-point dilution series of library compounds were prepared in DMSO; a volume of 100 nL was transferred using a pin tool into assay plates containing substrate, before adding enzyme to start the reaction. Positive (no compound) and negative (AcCoA omitted) control reactions were run on all plates (columns 23 and 24) and received the same amount of DMSO as the compound-treated wells.
After adding all reagents, the plates were sealed with adhesive seals and incubated for 60 min at room temperature. An additional 4 µL of assay buffer containing AlphaScreen Protein A acceptor beads and streptavidin donor beads (PerkinElmer) to a final concentration of 4 µg/mL was then added. After incubation for 5 h, the plates were read using an EnVision 2103 multilabel plate reader (PerkinElmer) in HTS AlphaScreen mode. Percent inhibition for each library compound was calculated relative to both the positive and negative controls on a per plate basis. For titration experiments, IC50 values were determined by fitting the percent inhibition versus compound concentration (11 dilutions, duplicates) to a four-parameter logistic model. To monitor the assay quality, the Z′ factor was determined. For titrations of CoASH, which does not dissolve in DMSO, a 20-mM stock solution in assay buffer was prepared, and 0.5 µL was added to the reaction wells. For some experiments, TruHits beads (PerkinElmer) were used to assess interference with the detection method.
Radiometric assay
The activity of HATs and inhibitory activity of small molecules were tested in a radiometric assay essentially as described previously. 21 Briefly, 1.5 µg of each of recombinant histone H3.3 and H4 (New England BioLabs, Ipswich, MA) was incubated with 120 ng purified NusA-His6-hMOZ fusion and 0.125 µCi of acetyl-1- 14 C-AcCoA (PerkinElmer) in HAT buffer (50 mM Tris–HCl [pH 8.0], 50 mM KCl, 0.1 mM EDTA, 5% glycerol, 1 mM DTT) in a total volume of 30 µL for 30 min at 30 °C. Reactions were terminated by the addition of Laemmli buffer and boiling for 5 min before resolution of half of each reaction on a 10% Bis-Tris polyacrylamide gel electrophoresis (PAGE) gel. The gel was dried before exposure to a Phosphor screen for 24 to 48 h and imaging using a Fujifilm FLA-3000 Imager (Fujifilm, Tokyo, Japan). In addition, before drying, the blot was stained with SafeStain (Invitrogen) to visualize loading. Both images were quantified using ImageJ (National Institutes of Health, Bethesda, MD), and the 14 C signal was normalized to the relative protein signal.
Compound characterization by biosensor surface plasmon resonance
Characterization of compound binding was conducted using a Biacore T100 system (GE Healthcare). Streptavidin was immobilized onto a CM5 chip by primary amine-coupling in accordance with the manufacturer’s recommendations. The target protein, MOZ, and a control protein to measure nonspecific binding, CSF1-R kinase domain, were tagged by limited biotinylation using Sulfo-NHS-LC-LC-Biotin (Thermo Scientific, Rockford, IL) at a 1:1 molar ratio. 22 The proteins were purified from unincorporated reagent by size exclusion chromatography and immobilized in running buffer (50 mM HEPES [pH 7.5], 150 mM NaCl, 10 mM MgCl2, 5 mM DTT, 0.05% Tween-20, 5% DMSO) on the streptavidin chip surface. Compounds were injected over the spots at 4 °C and a concentration of 100 µM. The signal of the reference channel was subtracted from signal of the protein channel in addition to solvent correction. Data processing and analysis were performed using Scrubber Software (www.biologic.com.au).
Results
Assay optimization and validation
We developed a homogeneous AlphaScreen assay to measure the MOZ-catalyzed acetylation of specific substrate peptides. A substrate peptide was derived from the N-terminal sequence of a core histone, which encompasses the endogenous target sites of lysine acetylation. The biotinylated substrate peptide was bound to streptavidin-coated AlphaScreen donor beads, and acetylated lysine residues were detected by the addition of acceptor beads coated with an acetyl-lysine-specific antibody ( Fig. 1 ). Initially, we chose an antibody that is specific for acetyl-lysine but insensitive to the amino acid sequences neighboring the target lysine residue, thus permitting a wide range of substrate peptides to be tested.
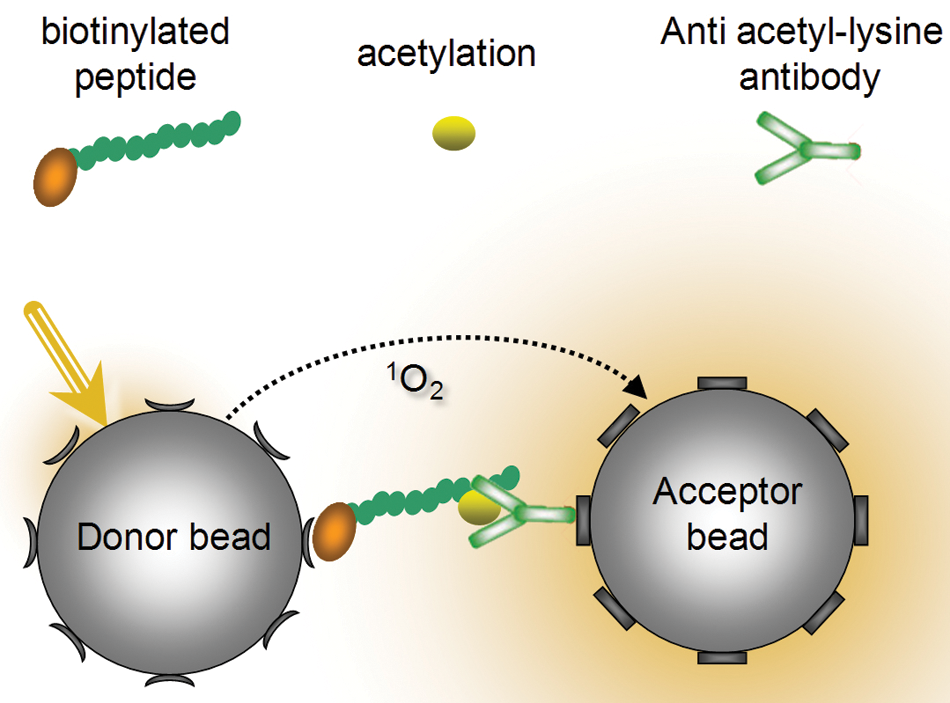
AlphaScreen-based histone acetyltransferase (HAT) activity assay. Binding of an acetyl-lysine-specific antibody attracts a Protein A–coated acceptor bead, which brings it into close proximity to a streptavidin-coated donor bead bound to the biotinylated peptide. Excitation light causes the donor bead to generate singlet oxygen, which can diffuse up to 200 nm through solution. If an acceptor bead is within 200 nm, singlet oxygen interacts with the bead’s contents, eliciting a chemiluminescent emission. Small-molecule inhibitors will lead to a reduced incidence of peptide acetylation and therefore a reduction in AlphaScreen signal.
The intensity of the assay signal increased with HAT enzyme concentration, the linear response observed between 2 and 20 nM, and reached maximum intensity at 100 nM ( Fig. 2A ). At enzyme concentrations >100 nM, we observed an increase in the AcCoA-independent nonspecific signal, possibly due to nonspecific association of the proteins with the detection beads, which thereby reduced the overall signal-to-background (S/B). Therefore, an enzyme concentration of 10 nM was chosen as the optimum working concentration.
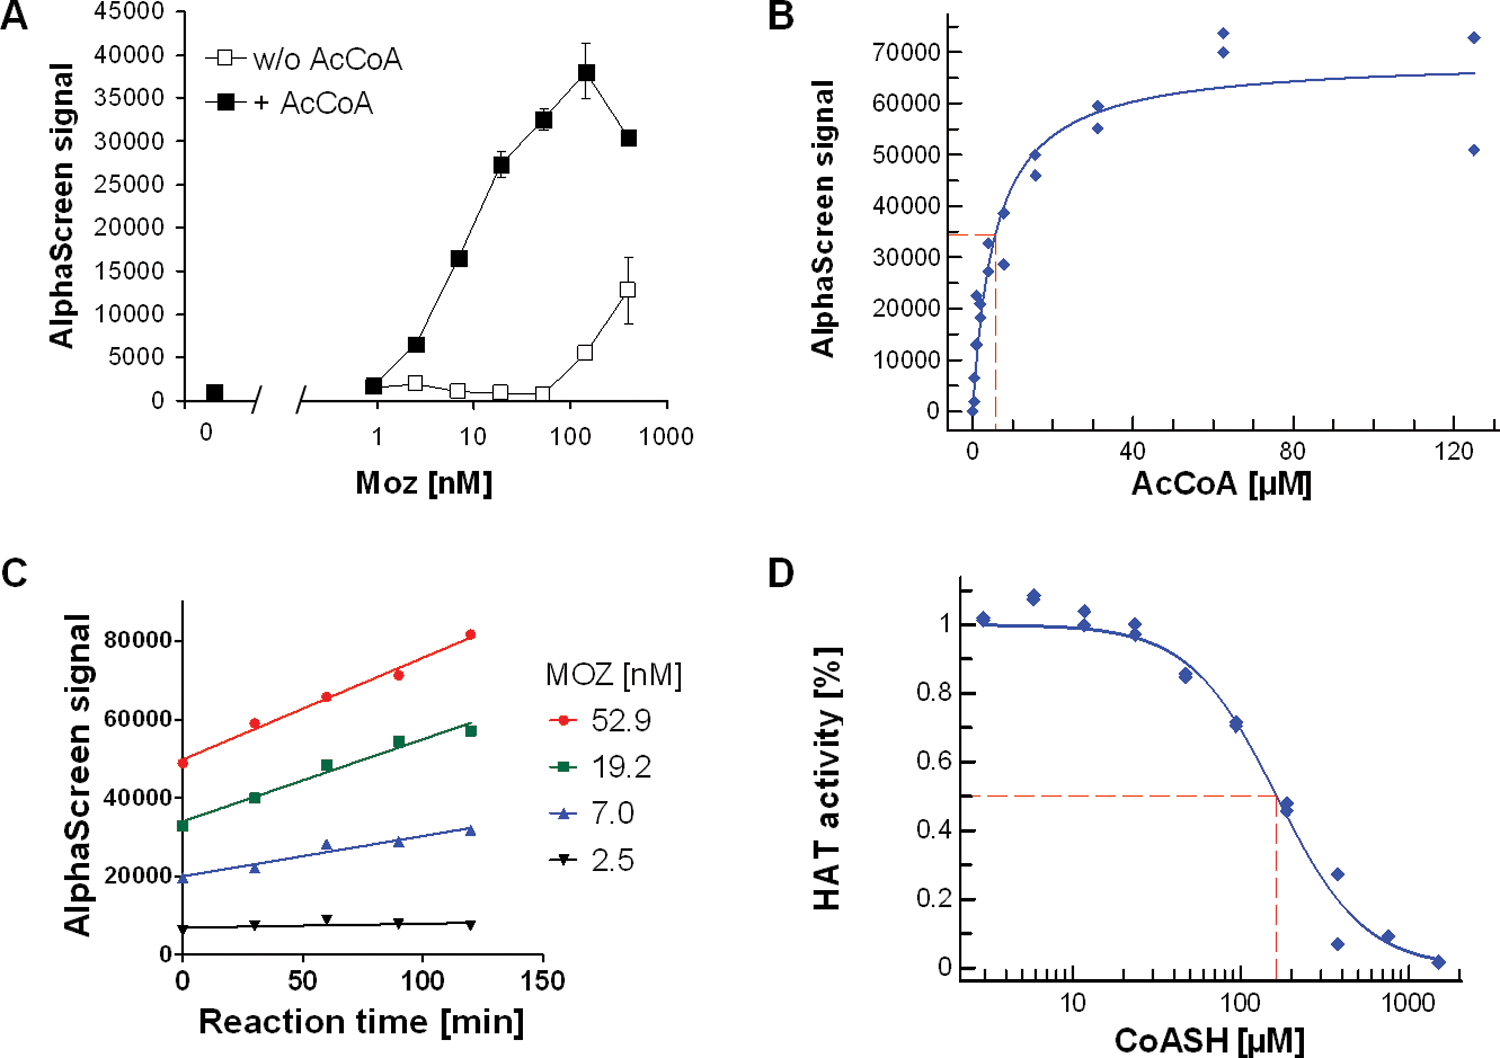
Assay optimization and validation with histone H4 peptide substrate (50 nM). (
A published crystal structure of MOZ shows that the AcCoA binding site forms a deep hydrophobic pocket lined with electrostatically charged surfaces, likely making it favorable for small-molecule binding.
23
In contrast, the histone binding site is relatively flat and featureless. Therefore, an important design consideration for our primary screening assay was to select a concentration of the AcCoA substrate that would provide good assay signal and maximize the probability of identifying compounds that bind in the AcCoA site while also maintaining a reasonable probability of identifying noncompetitive inhibitors.
24
We chose to screen with the AcCoA substrate fixed at a concentration equivalent to its apparent Michaelis-Menten constant, which was determined to be 15 µM (
We also evaluated the substrate selectivity of MOZ by testing different substrate peptides based on the N-terminal sequences of histone H3 and H4. Consistently, the H4 peptide produced greater S/B than the H3 peptide. Subsequent titration of the H4 biotinylated histone peptide at a fixed concentration of MOZ (10 nM) and a constant reaction time (60 min) produced a bell-shaped dose–response curve with maximum S/B attained at 50 nM peptide (data not shown). This type of dose–response curve has been previously reported for many AlphaScreen assays and is related to the saturation of the streptavidin binding sites on the acceptor bead by the biotinylated substrate. The assay tolerated DMSO up to 0.4% without significant loss of signal (data not shown).
Reaction time was the final parameter that required optimization, and so the time course of peptide acetylation was investigated. As shown in Figure 2C , when MOZ concentrations were maintained between 7 and 52.9 nM, the reaction progress curves remained linear for up to 120 min.
Finally, the ability of the assay to detect AcCoA-competitive inhibitors was evaluated under the optimized assay conditions. As noncovalent inhibitors of MOZ have not yet been reported, we assessed the ability of our assay to measure competitive inhibition by CoASH, a reaction product that binds competitively with AcCoA. As shown in Figure 2D , increasing CoASH concentration reduced the HAT activity in a dose-dependent manner, producing a smooth dose–response curve that yielded an IC50 value of ~150 µM.
Radiometric assay
The HAT activity of the enzyme preparations was independently confirmed using a radiometric assay method. Incorporation of 14 C-acetyl into core histones confirmed the acetyltransferase activity (data not shown). No self-acetylation of the enzyme was observed. In the in vitro experiments, MOZ acetylated the histones H2A, H2B, H3, and H4, agreeing with the selectivity observed in vitro but less selective than in vivo. 25 Accessory proteins in concert with MOZ can be assumed to define the specificity.
Direct binding surface plasmon resonance assay
Surface plasmon resonance was employed to independently verify ligand binding. Several methods of immobilizing the MOZ protein to the biosensor chip were investigated. Immobilization through coupling of primary amines to a carboxymethyl dextran inactivated the MOZ protein. Limited success was achieved with anti-His5 antibody-coated biosensor chips exploiting the internal His6 tag. However, in this case, the stability of the protein binding to the chip surface was insufficient to allow more than a few measurements before reimmobilization of the protein was required. Limited biotinylation of the protein and subsequent immobilization on streptavidin chips were the most successful approach, producing immobilized protein that remained stable for multiple cycles of experimentation. We validated the immobilized enzyme by examining the binding of the substrate cCoA (KD = 50 µM) and CoASH (KD >> 100 µM), the latter of which bound to MOZ with much lower affinity than AcCoA, in agreement with the results from the AlphaScreen binding assay.
Primary screening campaign
After the completion of assay development, we screened 243 000 compounds from a diverse, lead-like chemical library for inhibitors of MOZ HAT activity. Compound samples were screened at a final concentration of 10 µM, which resulted in a DMSO concentration of 0.19%, well within the DMSO tolerance limits of the assay. The average assay Z′ for the primary screen was 0.72 ± 0.12, and 7% of the screening plates failed to achieve a Z′ >0.5 and were rescreened. The activity distribution of the library compounds was normal, with an average of −1.0% inhibition relative to controls on a per plate basis. Samples exhibiting an inhibition greater than three standard deviations from the average activity of all compounds were selected for follow-up, yielding 1394 compounds (0.6% hit rate; Fig. 3A ).
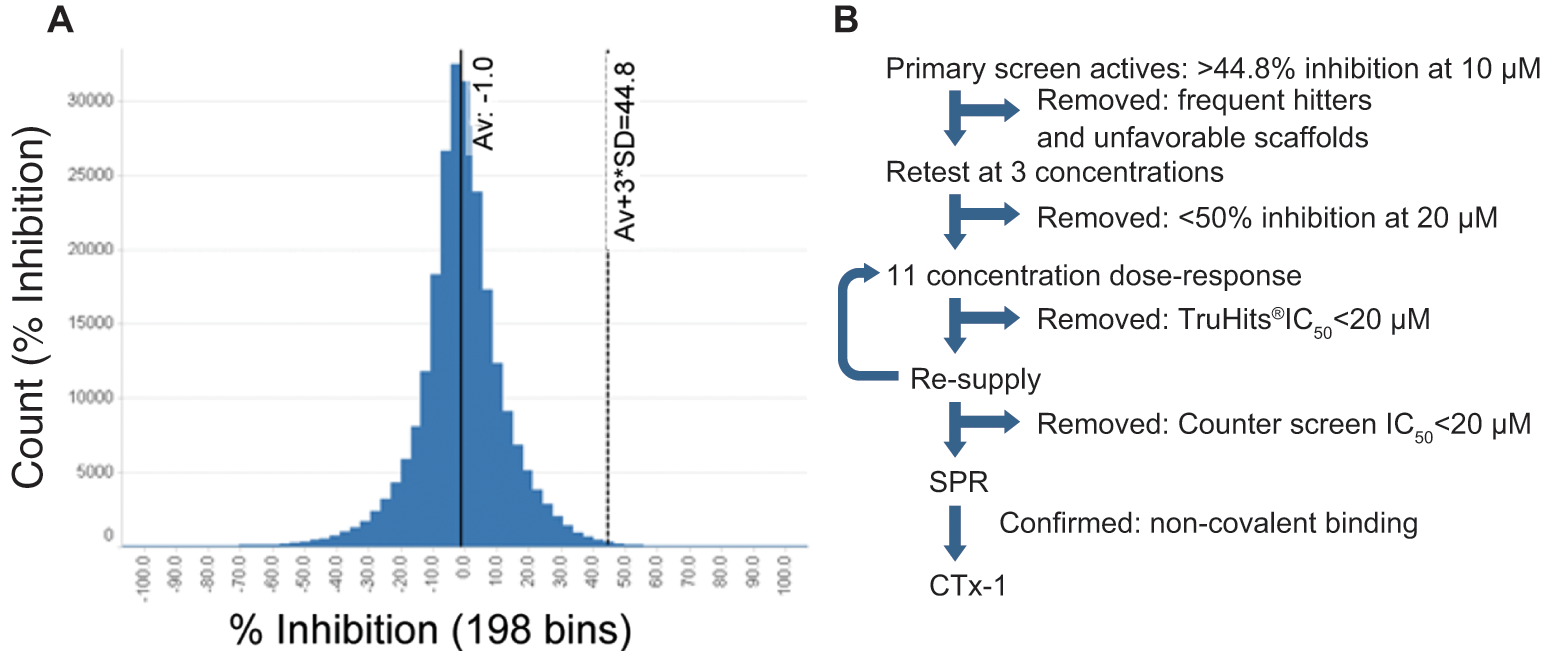
Quality assessment of primary high-throughput screening (HTS) campaign and workflow for compound selection. (
Confirmation and triage of active compounds
The triage process outlined in Figure 3B was followed to confirm the inhibitory activity of the compounds identified in the primary HTS assay. Active compounds were first retested from library stocks, in duplicate, at three concentrations (5, 10, and 20 µM). A total of 167 compounds were confirmed at this stage. These compounds were then carried forward to 11-point dose–response curves in the following formats: (1) the primary HTS assay to obtain accurate IC50 values, (2) the primary HTS assay conducted at AcCoA concentrations ranging from ¼ to 4 KM to determine if test compounds bind competitively with this substrate, and (3) TruHits beads, to assess compound interference with the detection method. Only seven compounds were found to reduce the signal output from the TruHits beads with apparent IC50 <20 µM ( Fig. 4A ), and these compounds were excluded from further consideration. For competitive inhibitors, a shift in IC50 with a slope of Ki/KM is predicted. We found several examples of a slope below this but greater than zero. Although drug discovery focuses on competitive inhibitors, we chose not to exclude compounds based on this criterion, as these might represent new mechanisms of action. At this stage, the number of active compounds was reduced to 160, which had demonstrated reproducible activity from the library stock solutions.
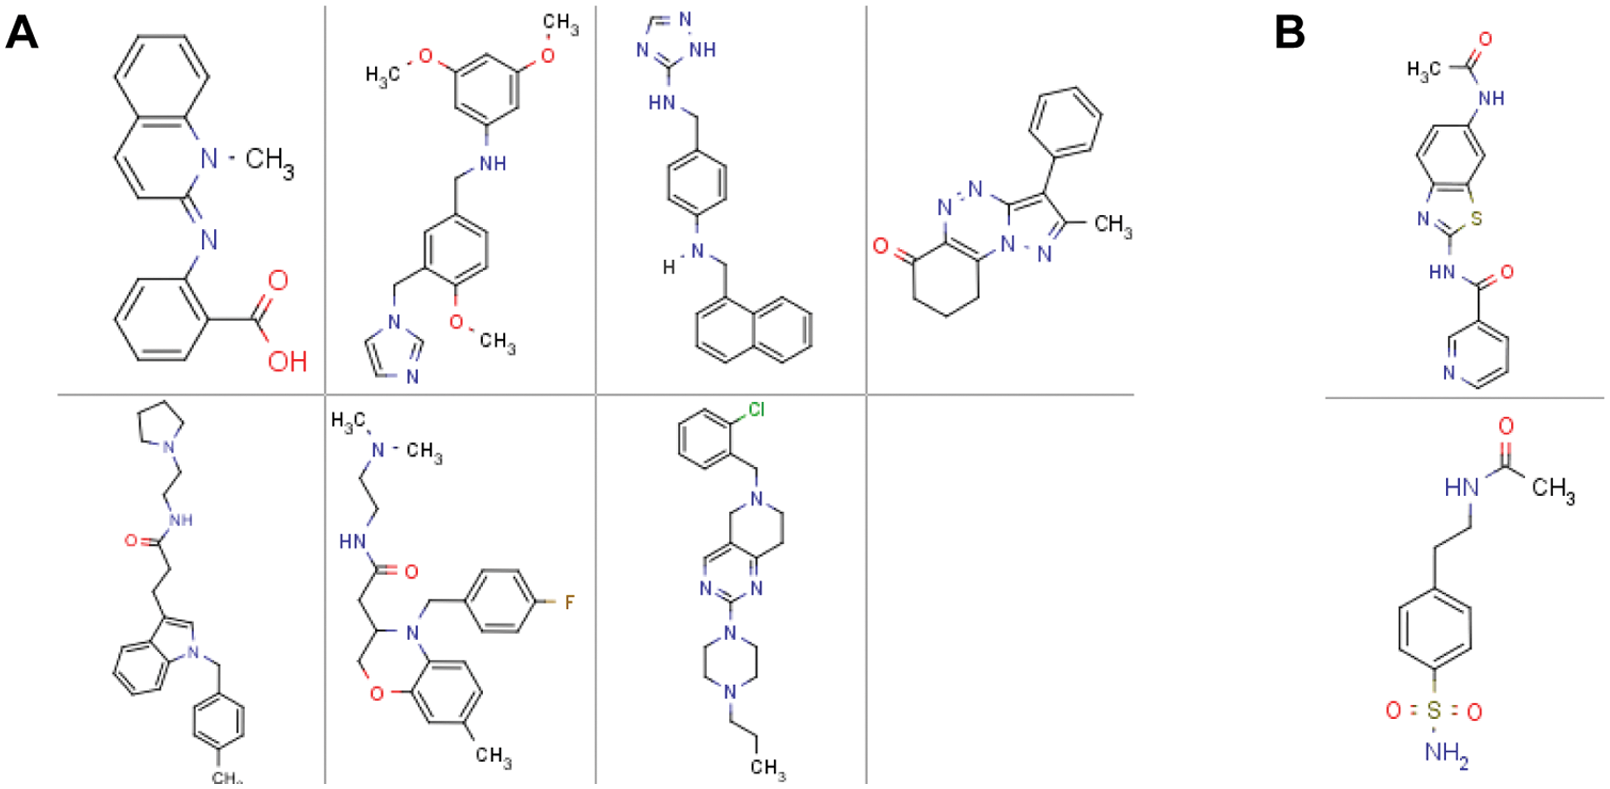
Structures of compounds found to represent false-positive results. (
A further possible mechanism of assay interference that would not be detected by the TruHits beads is the direct inhibition of antibody binding to the acetylated peptide by the library compounds. A hint that this could be a concern was provided by early inspection of the hit set chemistry, which revealed an unexpectedly wide variety of chemical scaffolds, 55 of which contained acetamides as a common structural motif (see Fig. 4B for examples). To investigate the affected assay component, we employed a counterscreen that omitted the MOZ enzyme and employed a chemically acetylated histone peptide to induce aggregation of the detection antibody and AlphaScreen beads. For a large proportion of the 160 remaining compounds, the inhibitory activity in this counterscreen closely correlated with the activity observed in the MOZ HAT assay ( Fig. 5A ), strongly suggesting that these compounds are interfering by disrupting the binding of the detection antibody or the beads. We were able to refine our MOZ HAT assay by examining sequence-specific antibodies that bind selectively to acetylated lysine 8 of histone H4 and retested all 160 compounds. The validation of the biochemical assay parameters ( Fig. 2 ) did not change with the choice of the antibody (data not shown). As shown in Figure 5B , most compounds lost all inhibitory activity in this modified assay. These false positives in fact accounted for all acetamides.
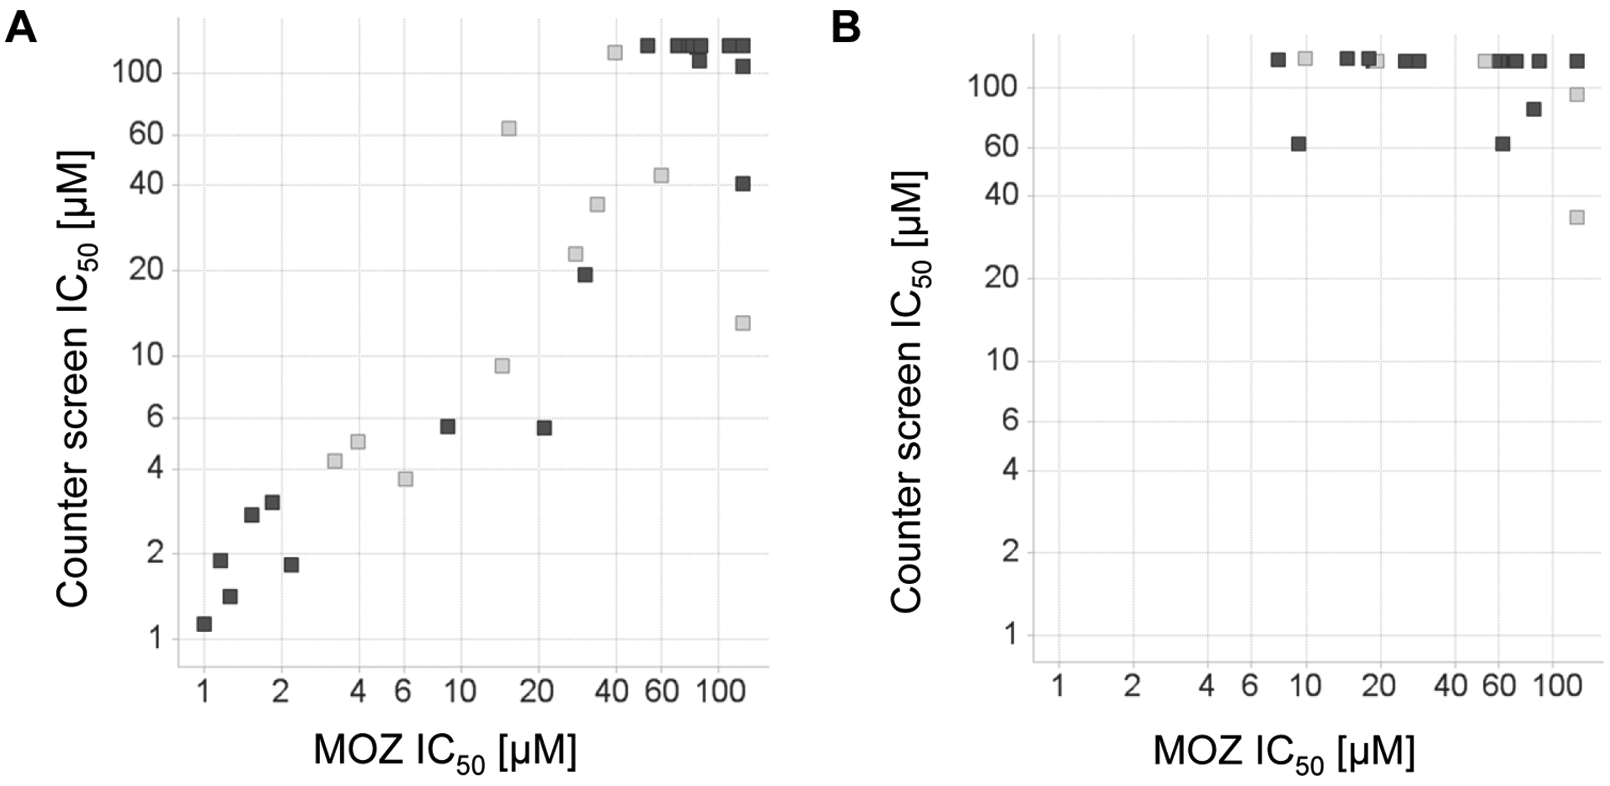
Correlation of MOZ inhibitory activity versus activity in a counterscreen that contains a preacetylated substrate peptide but no histone acetyltransferase (HAT) enzyme with two detection antibodies differing in their epitope (compounds in light gray have been tested with both antibodies). Compounds exhibiting no inhibition are graphed at the highest concentration tested (125 µM). (
Of continued interest were several compound classes occupying the MOZ-selective portion of the plot in Figure 5B (top left quadrant). The remaining MOZ inhibitory compounds that performed acceptably in the liquid chromatography/mass spectrometry (LC/MS) quality control analyses belonged to three different chemical classes. Two of these compound classes—heteroethylanilides and tetrahydroindazoles—were ultimately determined to be false positives. Because of this and the potential relevance to other drug discovery researchers interested in screening this class of enzyme, it is instructive to briefly discuss this false-positive behavior in our assays.
Heteroethylanilides
Shown in Table 1 are two subclasses of heteroethylanilides: pyrazole ethylanilides and quinazolone ethylanilides and a tetrahydroindazole.
Structural Clusters of MOZ Enzyme Assay Interfering Compounds
At first glance, both heteroethylanilide subclasses appear promising, as vendor-resupplied material passed LC/MS analysis and reconfirmed as active. In addition, an early structure–activity relationship (SAR) was apparent for both subclasses as numerous analogues were present in our library and so we could readily mine the primary HTS data. However, in all cases, high-performance liquid chromatography (HPLC)–purified material or resynthesized material lost all inhibitory activity. We attribute this behavior to the presence of trace impurities, possibly arising through a retro-Michael reaction. 26 It is also possible that the library samples contained chemically reactive impurities that were not detected by LC/MS analysis. Intriguingly, vendor-resupplied samples lost all activity when the antibody was changed yet again to a-H4AcK8-2. Again, these observations reaffirm the importance of antibody selection for reducing false-positive rates in this screening assay. As also shown in Table 1 , the tetrahydroindazole behaved in a similar manner to the heteroethylanilides, and in this case reactive by-products could be plausibly explained through oxidation of sulfur to a reactive thiophene.
Further characterization of the remaining compounds with the SPR binding assay left us with a single compound that met all our selection criteria (CTx–1). Furthermore, consistent inhibitory activity was demonstrated across several batches of CTx–1, irrespective of whether the test compound was obtained from the library DMSO stock, resupplied from vendors, or resynthesized. The SPR assay confirmed that the binding of CTx–1 to MOZ is fully reversible, and an equilibrium dissociation constant of 0.38 µM was determined from the sensorgrams using nonlinear regression analysis ( Fig. 6A ). The putative binding site of CTx–1 was determined by varying the concentration of the AcCoA substrate in the AlphaScreen assay and observing effects on the inhibitory potency of the test compound. In this experiment, increasing the concentration AcCoA concomitantly produced a shift to a higher IC50 value in a manner consistent with the hypothesis that CTx–1 was binding competitively with AcCoA in the substrate site ( Fig. 6C ). Also, a Ki of 2.4 µM (95% confidence interval [CI], 1.1–3.6 µM) for CTx–1 was estimated from the lower asymptote of the curve at diminishing substrate concentrations ( Fig. 6C , inset).
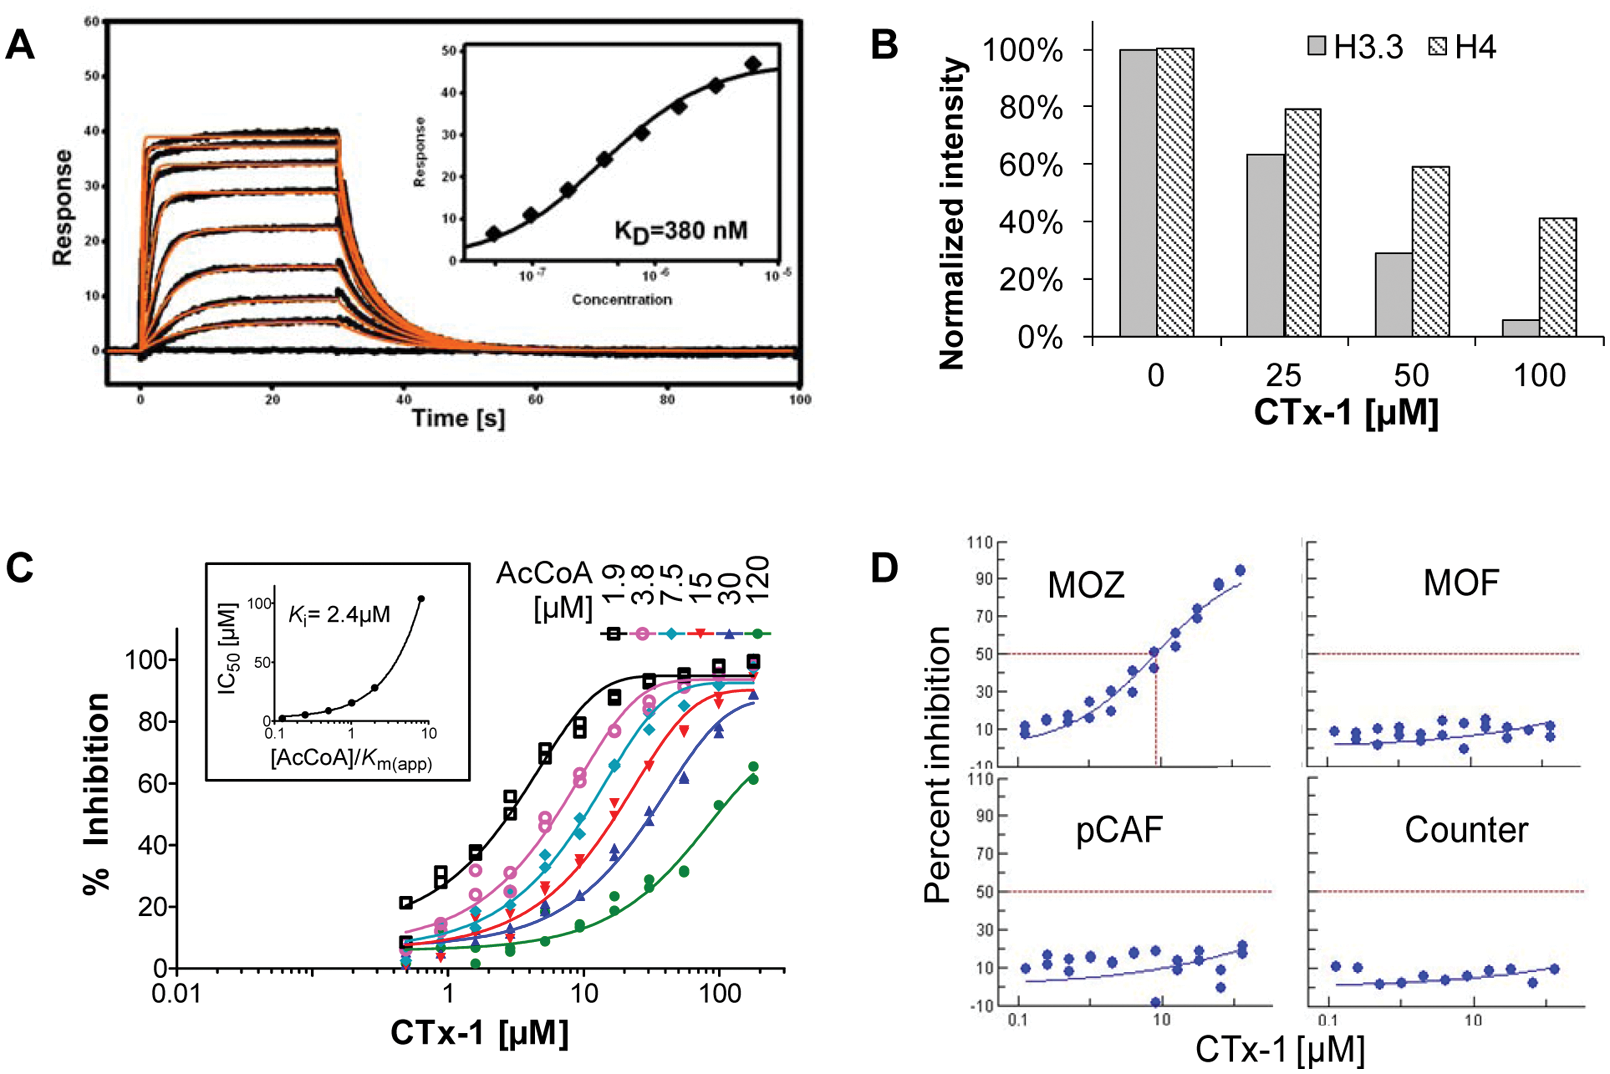
Evaluation of compound activity using surface plasmon resonance (SPR), radiometric detection, and AlphaScreen. (
The inhibitory activity of CTx–1 was also confirmed in a radiometric assay format using recombinant full-length histone proteins (
Discussion
We have developed and employed a bead-based assay to measure the activity of acetyltransferases. The HTS campaign demonstrated that acetylation-specific antibodies are very useful to measure acetylation in an endpoint format and identify activity modulating compounds. With reasonable robustness, reagent costs below 10 ct/well, and consistent Z′ factors, the assay was highly amenable to HTS. The primary screen hit rate was 0.6%, with only one scaffold finally meeting all of our compound selection criteria. The use of H4 N-terminal peptides instead of full-length histones made the assay more tractable and cost-effective, and we used SPR and a radiometric assay using full-length histones to confirm the activity for selected compounds. We were able to demonstrate that the binding of CTx–1 to the AcCoA binding site of MOZ was fully reversible and that CTx–1 is a selective inhibitor of MOZ HAT activity with respect to MOF, a closely related MYST family member. Furthermore, we have begun initial exploration the SAR of the CTx–1 scaffold. To date, we have obtained approximately 50 analogues of this compound and have observed both positive and negative SAR trends among these analogues (data not shown). To the best of our knowledge, this is the first report of a reversible selective small-molecule inhibitor of MOZ HAT activity.
The AlphaScreen assay identified a number of false-positive compounds, which affected the assay signal through various mechanisms. Few compounds were found to inhibit the AlphaScreen chemiluminescent detection, which can be affected by quenchers of singlet oxygen (e.g., antioxidants), color quenchers, and biotin analogues that may interfere in the interaction between streptavidin and the biotin-labeled peptide. The principal determinant of the assay robustness from our experience was the susceptibility of the detection antibody to interference by small molecules. We suspect that the structural similarities of many of these compounds to an acetylated lysine allow them to bind the antibody or at least compete at the screening concentration with the epitope. Another factor besides that is the possible contamination of the library sources, with, for example, metal ions from catalyzed chemical synthesis, but this is one of the most difficult to assess mechanisms. The selection and evaluation of several antibodies against a larger number of test compounds enabled us to better understand the specificity of each antibody. On the basis of our observations, we speculate that the more generic the epitope, the more flexible the antibody binding region, which makes it more accommodating to small-molecule interference. A more specific antibody in the primary screen would presumably reduce the number of false positives, improve the confirmation rate, and speed up the hit-to-lead process. This is in contrast to the broad experience in the kinase assay field where the use of generic phosphotyrosine antibodies (PY20, PY66, and PY100) is widespread and successful.
Although the identification of covalent binders could not be excluded with the primary assay, a number of counterscreens and SPR allowed for reliable identification of compounds with reversible binding. This highlights the importance of avoiding chemically reactive entities in the library design process—or, if it cannot be avoided, when it is desired to cover additional areas of chemical space, to be able to characterize the exact profile of reactivity by subsequent assays. The screening method, together with the follow-up cascade described herein, describes a rational process to identify small-molecule inhibitors of HATs that will enable the effective exploration of this new class of epigenetic targets.
Footnotes
Acknowledgements
The authors thank the CSIRO Fermentation Group and Moana Simpson, Rebecca Lang, and David Camp from the Queensland Compound Library. We also thank Georgina Holloway for supplying reagents.
The authors acknowledge the financial support of the Cancer Therapeutics CRC, established and supported under the Australian Government’s Cooperative Research Centre’s Program and a fellowship from the Australian Research Council (FT100100100) for JMM.
References
Supplementary Material
Please find the following supplemental material available below.
For Open Access articles published under a Creative Commons License, all supplemental material carries the same license as the article it is associated with.
For non-Open Access articles published, all supplemental material carries a non-exclusive license, and permission requests for re-use of supplemental material or any part of supplemental material shall be sent directly to the copyright owner as specified in the copyright notice associated with the article.