
Abstract
Cytokines and their receptors play critical roles in biological processes. Dysfunction or dysregulation of cytokines may cause a variety of pathophysiological conditions. Consequently, cytokine profiling and related technologies are essential for biological studies, disease diagnosis, and drug discovery. In this report, three cytokines, interleukin (IL)-1β, IL-6, and tumor necrosis factor alpha (TNF-α), from the same sets of samples were analyzed with several commonly used technologies (enzyme-linked immunosorbent assay [ELISA], Luminex, Meso Scale Discovery [MSD], time-resolved fluorescence resonance energy transfer [TR-FRET], cytometric bead array [CBA], AlphaLISA, and FirePlex). Through experimental data analysis, several assay features were compared, including sensitivity, dynamic range, and robustness. Our studies reveal that MSD has the best sensitivity in the low detection limit and the broadest dynamic range, while CBA and Luminex also demonstrate superior performance in the sensitivity and dynamic range. Additional aspects of these technologies, including assay principles, formats, throughputs, robustness, costs, and multiplexing capabilities, were also reviewed and compared. Combining all these features, our comparison highlights MSD as the most sensitive technology, while CBA is the most suitable one for cytokine high-throughput screening with multiplexing capability. Along with perspectives on new technology development in the field, this report aims to help readers understand these technologies and select the proper one for specific applications.
Introduction
Cytokines are secreted small proteins including interleukins, interferons, tumor necrosis factors, growth factors, and chemokines. They bind to corresponding receptors on effector cells and initiate signal transduction. It has been well known that cytokines play critical roles in immunological responses such as infection, inflammation, hematopoiesis, homeostasis, tissue repair, cellular development, growth, and tumorigenesis.1,2 Dysfunction or dysregulation of cytokines is associated with a variety of diseases.3–5 It is therefore critical to investigate cytokine regulation to understand disease mechanisms and progression and, more importantly, to identify novel therapeutic targets. Indeed, targeting cytokine–receptor interactions has been a well-recognized strategy for drug target development.6,7 For example, tumor necrosis factor alpha (TNF-α) antagonists and anti TNF-α antibodies have been used as a therapy for inflammatory bowel disease (IBD) and rheumatoid arthritis with a long history of success. 8 Interleukin (IL)-2 and granulocyte–macrophage colony-stimulating factor (GM-CSF) have been well studied for cancer therapy. A more recent example of cytokine-based therapy is anti-IL-5 antibody for asthma.9,10
Due to the critical functions of cytokines and their close relationship to diseases, cytokine profiling technologies are indispensable tools in drug discovery. A sensitive and robust detection technology can powerfully facilitate disease biomarker identification and drug candidate screening. In addition, multiplexing and high-throughput capabilities are important features for cytokine screening.11,12 For analyte quantitation at the protein level, most of the technologies are antibody-based immunoassays, except for mass spectrometry analysis, which directly measures the analytes. The commonly used immunoassays include enzyme-linked immunosorbent assay (ELISA), Luminex, Meso Scale Discovery (MSD), cytometric bead array (CBA), time-resolved fluorescence resonance energy transfer (TR-FRET), AlphaLISA, and FirePlex. TR-FRET is also referred to as homogeneous time-resolved fluorescence (HTRF) in this report. In our analysis, three cytokines, IL-1β, IL-6, and TNF-α, from two sets of samples were measured with the above technologies. Data were then analyzed to compare the sensitivity, linear dynamic range, and robustness of these technologies. The comparison reveals that CBA has a good sensitivity and robustness with a broad accurate dynamic range and is homogeneous and suitable for cytokine multiplexing high-throughput screening. Meanwhile, MSD shows the best sensitivity, the broadest accurate dynamic range, and good robustness but has nonhomogeneous assay process features. Luminex has a sensitivity, broad accurate dynamic range, and robustness comparable to those of CBA, but with a nonhomogeneous feature. Other technologies tested in this report show different sensitivities, dynamic ranges, and robustness. Besides the comparative analysis from experimental data, we aim to provide a comprehensive review about other features, including assay principle, assay process, throughput, and cost. Lastly, considerations about cytokine biology and perspectives on new technologies are also discussed. We hope this report can help readers understand assay principles and basic features and select the right platform for specific applications.
Materials and Methods
Cell Culture and Treatment
THP-1 cells (ATCC, Manassas, VA, no. TIB202) were maintained in RPMI-1640 (Gibco, Gaithersburg, MD, cat. no. A42755SA) supplemented with 10% fetal bovine serum (FBS) (Gibco, cat. no. 10099-141) at a density of less than 2e6 cells/mL at any time. Prior to treatment, cells were collected and resuspended at 500,000 cells/mL. Phorbol 12-myristate 13-acetate (PMA) (Sigma, St. Louis, MO, cat. no. P1585) was added to a final concentration of 2 nM. Cells were then plated at 100 µL/well to 96 well plates (Corning, Corning, NY, Costar cat. no. 3595) and incubated overnight (O/N) at 37 °C, 5% CO2. The next day, lipopolysaccharide (LPS) (Sigma, cat. no. L6529) was added to half of each plate at a final concentration of 100 ng/mL via an 11 µL addition of 10× stock. The other half was untreated. After 17 h of incubation, supernatants were collected and pooled for the same condition. Aliquots were frozen at –80 °C until needed for assay.
Detection of IL-1β, IL-6, and TNF-α
Three cytokines, IL-1β, IL-6, and TNF-α, from two sets of samples were analyzed with seven technologies in this report (ELISA, Luminex, MSD, TR-FRET, CBA, AlphaLISA, and FirePlex). The first set of samples was recombinant IL-1β (no. 201-LB-005/CF), IL-6 (no. 206-IL-010/CF), and TNF-α (no. 210-TA-005/CF) from R&D Systems (Minneapolis, MN) as standards. They were dissolved at a top concentration of 10,000 pg/mL and serially diluted threefold for 11 doses to generate dose curves. Another set of samples was supernatants of THP-1 cells treated with or without LPS. Supernatant with LPS treatment was used as the top concentration, followed by a twofold serial dilution with culture medium for 11 doses. Supernatant without LPS stimulation served as the background. The detection procedures of each technology are described below and summarized in Table 1 .
Main Experimental Steps from Representative Protocols for Seven Tested Technologies. a
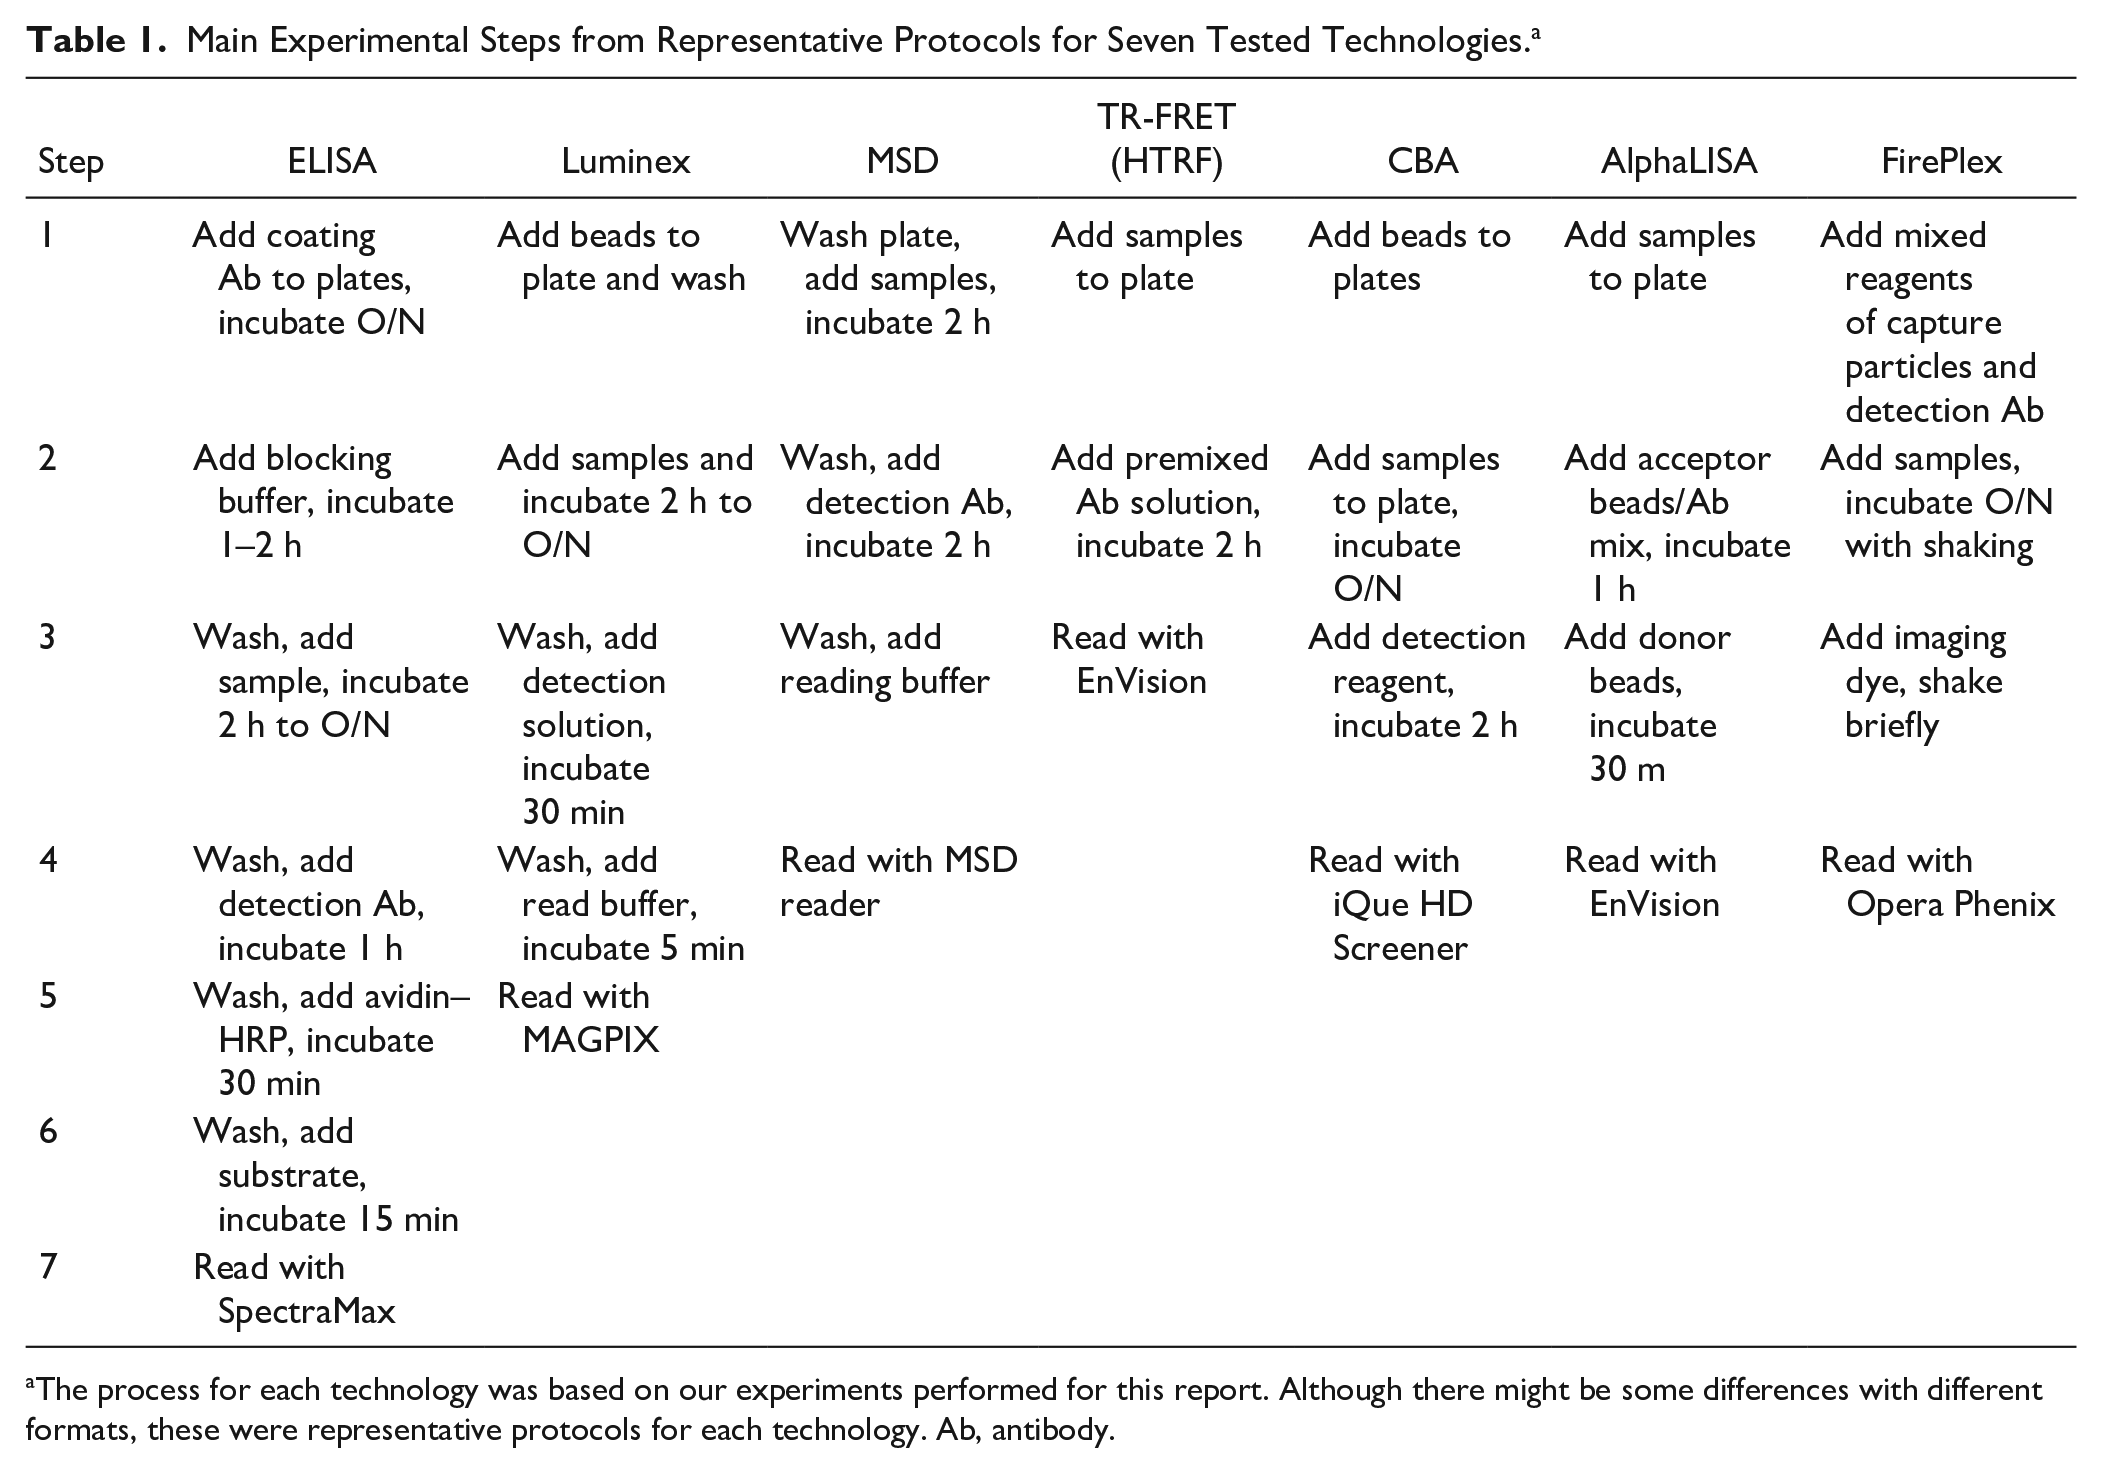
The process for each technology was based on our experiments performed for this report. Although there might be some differences with different formats, these were representative protocols for each technology. Ab, antibody.
ELISA kits were from Thermo Fisher (Waltham, MA, no. 88-7261-22 for IL-1β, no. 88-7066-22 for IL-6, and no. 88-7346-22 for TNF-α). Based on kit instructions, ELISA plates were coated with the capture antibody O/N at 4 °C. After saturating nonspecific background binding through incubation with a blocking buffer, samples were added and incubated O/N at 4 °C. The next day, plates were washed three times and incubated with biotinylated detection antibody solution for 1 h at room temperature (RT). After three washes, avidin–horseradish peroxidase (HRP) substrate was added and incubated for 30 min at RT. Following three washes, TMB substrate was added and incubated for 15 min. The solution of 2 N H2SO4 was then added to stop the enzyme–substrate reaction. Plates were read with a SpectraMax for absorbance at 450 nm.
Luminex kits were from Thermo Fisher (no. EPX01A-10224-901 for IL-1β, no. EPX01A-10213-901 for IL-6, and no. EPX01A-10223-901 for TNF-α). The three analytes were simultaneously detected in a 96-well plate. Based on the instructions, a mixture of three groups of beads was added to the plate at 50 µL/well. The plate was washed once using a magnetic plate at the bottom to retain the beads. Samples were added at 50 µL/well and incubated O/N at 4 °C. The next day, the plate was incubated at RT for 30 min with shaking at 500 rpm. After washing three times, 25 µL/well of detection buffer was added and incubated for 30 min at RT with shaking at 500 rpm. After three washes, 50 µL/well of streptavidin–phycoerythrin (SAPE) solution was added and incubated for 30 min at RT shaking at 500 rpm. After washing three times, 120 µL/well of reading buffer was added. After 5 min of shaking at 500 rpm, the plate was read on a MAGPIX Luminex instrument.
MSD detection used a three-plex custom kit (MSD, Hercules, CA, cat. no. N0504A-1) for IL-1β, IL-6, and TNF-α. The kit was a 96-well plate format including an MSD plate, sample diluent, and antibody solution diluent. Three cytokines were simultaneously detected following the kit instructions. First, the plate was washed and samples were added to incubate for 2 h at RT. After three washes, the detection antibody solution was added and incubated for 2 h at RT in the dark. After washing, the reading buffer was added and the plate was read with an MSD reader.
Three HTRF kits were from PerkinElmer-CisBio (no. 62HIL1BPEG, no. 62HIL06PEG, and no. 62HTNFAPEG). Each cytokine detection was performed separately in a 96-well plate following the kit instructions. Samples were added at 16 µL/well to a 96-well HTRF plate (PerkinElmer, Waltham, MA, cat. no. 6002290), and then premixed antibody solution (including cryptate donor antibody and d2 acceptor antibody) was added at 4 µL/well. After 2 h of incubation at RT in the dark, the plate was read with an EnVision plate reader with the excitation wavelength at 320 nm, the donor emission at 615 nm, and the acceptor emission at 660 nm. The results were calculated as the ratio 660/615 nm signal.
CBA kits were from BD Biosciences (San Jose, CA, no. 558279 for IL-1β, no. 558276 for IL-6, and no. 558273 for TNF-α). Three cytokines were simultaneously detected in a 384-well V-bottom plate (Greiner Bio-One, Monroe, NC, cat. no. 781280). Based on the instructions, beads for three cytokines were mixed and added to the plate at 5 µL/well. Samples were then added at 5 µL/well. After brief spinning and shaking, the plate was incubated O/N at 4 °C in the dark. The next day, the mixture of diluted detection antibodies was added to the plate at 5 µL/well and incubated for 2 h at RT in the dark. The plate was read with IntelliCyt iQue HD Screener. The detection protocol followed IntelliCyt instructions for QBeads analysis.
AlphaLISA kits were from PerkinElmer (no. AL220C for IL-1β, no. AL3025HV for IL-6, and no. AL325HV for TNF-α). The detection was separately performed in 96-well plates (PerkinElmer, cat. no. 6005290) following the kit instructions. Samples were added to plates at 10 µL/well, and then 40 µL/well of a mixture of diluted acceptor beads and capture antibody was added. The plates were incubated for 1 h at RT in the dark. Then 2× donor bead solution was added at 50 µL/well and incubated for 1 h at RT in the dark. The plates were read with an EnVision plate reader with AlphaLISA setting (excitation at 680 nm and emission at 615 nm).
The FirePlex-HT (HT indicates high content) kit was from Abcam (Cambridge, MA, cat. no. ab234897). The detection for three cytokines was performed simultaneously in a 384-well imaging-compatible plate (Thermo Scientific, Nunc 242764). Samples were added at 12.5 µL/well, and then 12.5 µL/well of the mixture of FirePlex-HT capture and detection reagents was added and incubated O/N at 4 °C with shaking in the dark. The next day, imaging dye solution was added at 10 µL/well and incubated for 10 min at RT with shaking in the dark. The plate was then allowed to sit 2 min to let particles settle down on the plate bottom. An Opera Phenix imager was used to scan the plate for imaging analysis.
Data Processing and Statistics
As described above, standard dose curve analysis included 11 doses and a background (assay buffer only) with eight repeats for each dose. The four-parameter log-logistic dose–response curves were fit for all available wells of each cytokine under tested technology using the drc 13 package in the R 14 statistical computing environment. No data point was excluded for dose curve fitting except the background signal (concentration at 0). A back calculation approach was used to assess the performance of each technology. From the standard dose detection results, three points of each dose for each analyte were randomly picked to generate a standard curve via the four-parameter log-logistic dose–response curve fitting. The readouts of the remaining five points of each dose were used to back-calculate concentrations from the three-point standard curve. The percent error of the calculated concentration was computed in reference to the true dose. We repeated the simulations 100 times and aggregated the percent error calculations by taking the median error across all test wells and simulations. A criterion of median errors within ±25% was used to evaluate the accuracy of analyte detection for each technology.
Overview of Technologies Analyzed in This Report
We aim to provide an integrated comparison for these commonly used cytokine profiling technologies via experimental analysis. Meanwhile, in order to pick a proper technology for a specific application, it is essential to understand assay principles, formats, process flow, advantages, and limitations. Therefore, these aspects of each technology tested in this report are reviewed before the comparison using experimental data.
ELISA
ELISA has existed for more than 45 years and has been broadly used to detect and quantify biological analytes. 15 There are different formats of ELISA with a similar principle but differences in immobilization and detection.15,16 As shown in Figure 1A , the simplest format is the direct ELISA in which the analyte is immobilized to the surface of plate wells, and then an enzyme (such as HRP)-linked specific antibody is added to form a complex with the immobilized analyte. After washing, the substrate is added and interacts with the linked enzyme to generate a measurable colorimetric product. The direct ELISA format is simple and easy to perform but may be prone to nonspecific interference and a low sensitivity. The indirect format has the same step as the direct format for immobilization but uses an enzyme-conjugated secondary antibody to bind to the detection antibody. In this way, the signal can be amplified. A more advanced format is the sandwich ELISA in which a specific capture antibody is coated to the surface of plate wells, and then the analyte sample is applied and an enzyme-conjugated detection antibody is added to bind to the analyte-capture antibody. With both the capture and detection antibodies, the sandwich format can be very specific and sensitive. However, multiple components and steps can also cause some crossover interactions and interference. Another sophisticated format is the competitive ELISA. In this format, a reference analyte is coated. The analyte sample competes with the coated reference to bind to the antibody, resulting in a decreased signal (Fig. 1A). This format can sensitively detect concentrations of analytes. However, it requires intensive optimization of several factors, such as the reference analyte amount and the detection antibody concentration.
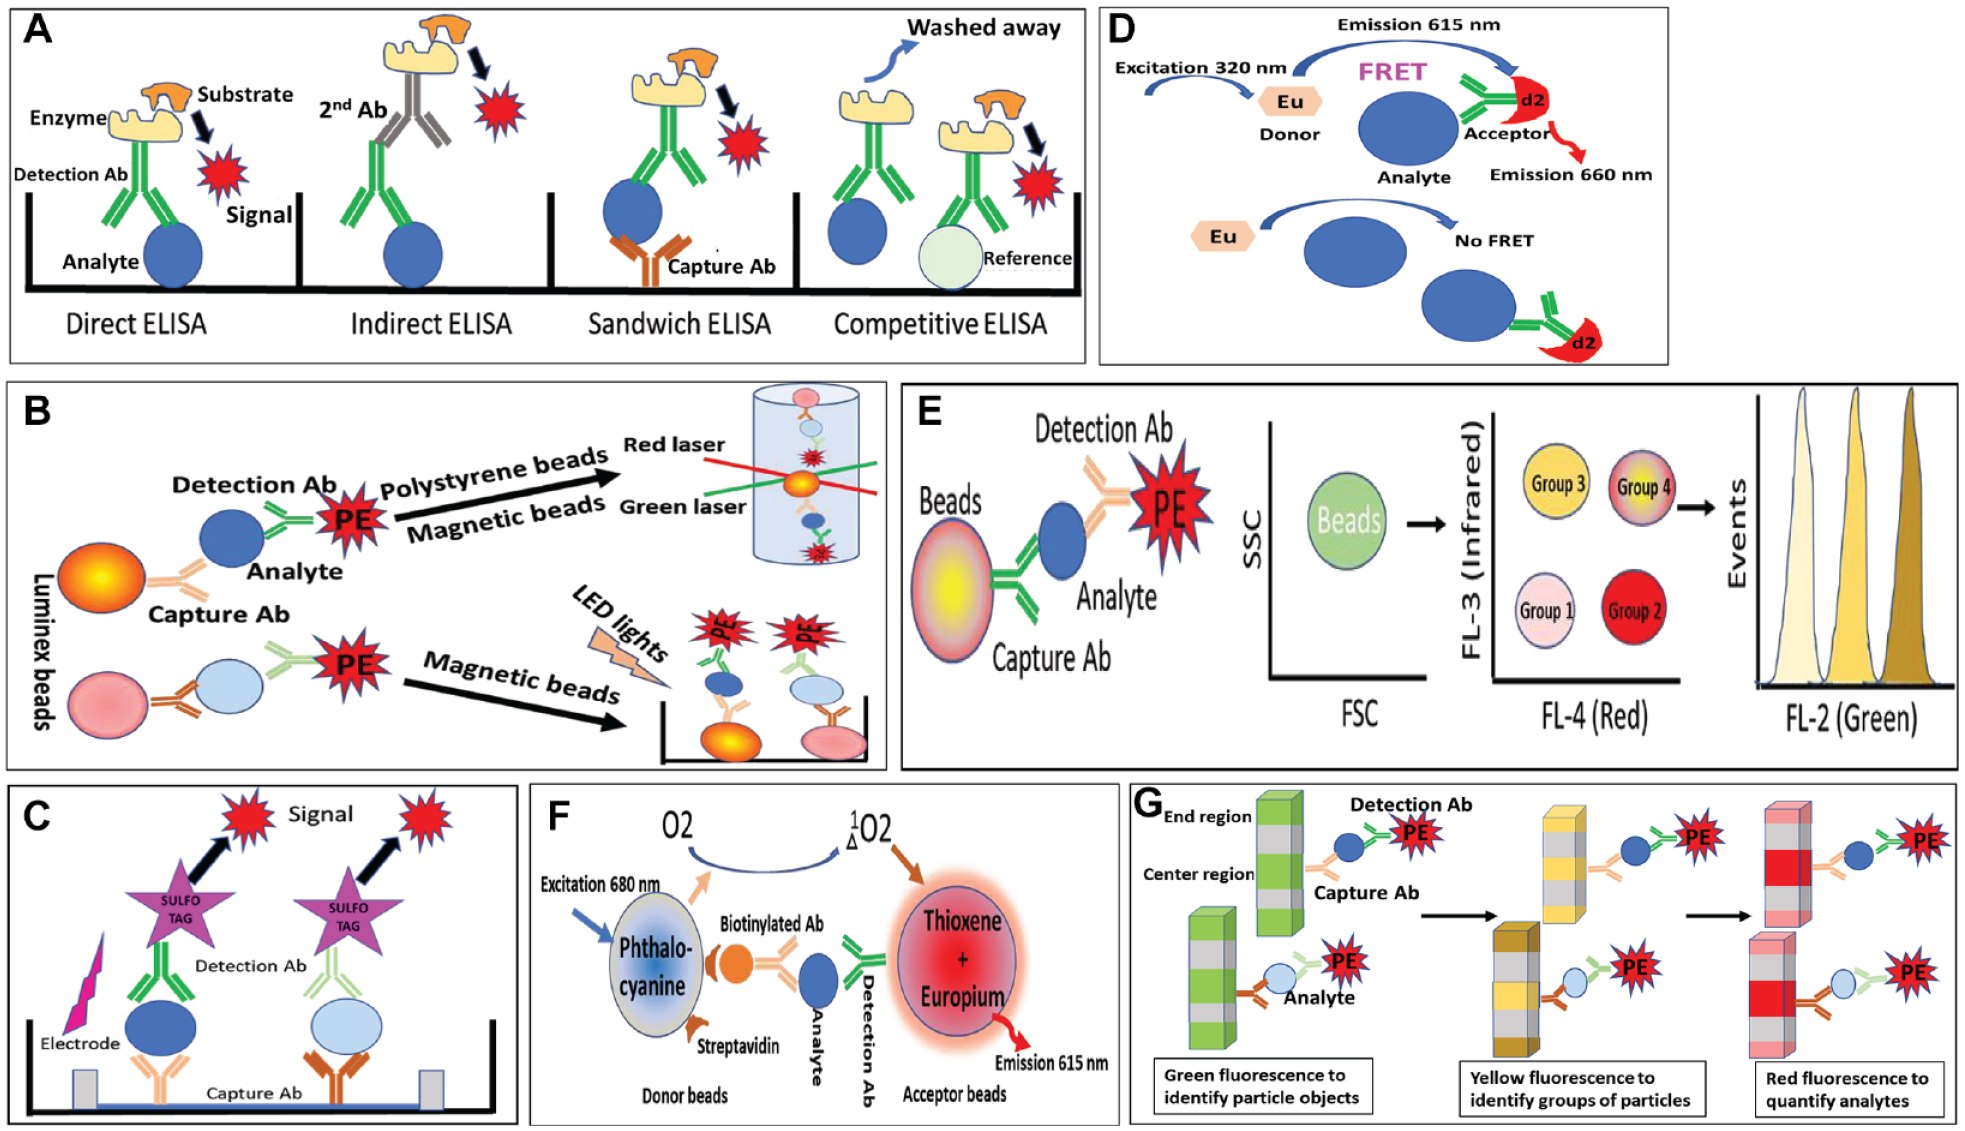
Illustration of assay principles for seven tested technologies in this report. (
The assay steps for ELISA vary with different formats. Table 1 shows the main steps of a sandwich format, which can serve as a representative ELISA protocol. The main steps include coating of the capture antibody, blocking, binding of the analyte, and addition of the detection antibody and substrate. The blocking step is to prevent nonspecific binding of the next components. Washing steps between each addition are essential to remove unbound and weak nonspecific bound components. Through decades of development, protocols for each ELISA format and commercial ELISA kits have been well established.16–18 In addition, the availability of commercial reagents supports the development of de novo ELISA, as detailed in a previous publication from this group. 19
Though ELISA is a mature technology and has been broadly used, it still bears several limitations. ELISA only detects one analyte at a time and lacks multiplexing capability. For example, in this report, three independent ELISA kits were run to detect IL-1β, IL-6, and TNF-α separately. This increases labor, time, cost, and sample amount. In addition, ELISA is not homogeneous due to the essential washing steps and not suitable for high-throughput screening.
Luminex
Luminex technology (Luminex Corp., Austin, TX) is a patented xMAP (multianalyte profiling) technology to detect protein and nucleic acid analytes using proprietary microsphere beads. The beads, either polystyrene or paramagnetic, are coded with two colors (red and infrared) at different ratios so that they can be defined into different groups, as shown in Figure 1B . Each group of beads is coated with an analyte-specific binder (such as an antibody) to specifically capture the analyte. A detection reagent (such as a detection antibody) is conjugated with a distinct fluorophore, phycoerythrin (PE). This allows multiplexing of up to 500 individual analytes in a single sample (depending on types of analytes and readers). As shown in Figure 1B , there are two types of Luminex beads, nonmagnetic polystyrene beads and magnetic beads, which have different detection principles and require different readers. Both types of beads can be read in a dual laser flow-based detection system. One laser is used to distinguish different groups of beads to classify analytes to be detected. The second laser is to determine the intensity of the detection reagent (PE-conjugated detection antibody) that positively correlates to the amount of analytes captured in beads. Luminex 100/200, FLEXMAP 3D from Invitrogen, or Bio-Plex from Bio-Rad is configured to read polystyrene and magnetic beads. Luminex 200 can multiplex up to 100 different analytes, while FLEXMAP 3D can detect as many as 500 different analytes, depending on the analyte types. Luminex MAGPIX Analyzer, the simplest Luminex reader, is specifically used to read magnetic beads only and can detect up to 50 different analytes. A magnet in the MAGPIX reader pulls down the magnetic beads to the bottom of a plate, ideally to form a monolayer of beads. One LED light illuminates beads to emit signals. Another LED light illuminates the detection reagent to emit a distinct signal captured by a CCD camera for the detection of analyte concentration.
As described in Table 1 and in Materials and Methods, Luminex also has washing steps between each addition. Hence, it is not homogeneous and not suitable for high-throughput screening. In terms of plate format, FLEXMAP 3D can read 384-well plates, while Luminex 200 and MAGPIX can only read 96-well plates. As indicated above, Luminex has high multiplexing with a good flexibility for users to combine analytes of interest to test. Luminex Corp, Invitrogen, R&D Systems, and Bio-Rad all have developed reagents for a very large panel of analytes. Users can easily configure a panel of analytes to test. Moreover, Luminex technology has a superior sensitivity that can be in the single digits (pg/mL) for cytokines. Nevertheless, with its attractive features of flexibility, sensitivity, large dynamic range (3–4 log), multiplexing, and moderate throughput, Luminex is one of the most commonly used technologies to detect biological analytes.20,21
MSD
The MSD assay is similar to ELISA but uses an electrochemiluminescence detection technology.
22
Like ELISA, MSD also has various formats. Using the common sandwich format as an example (
MSD also combines the multiarray feature, which comes from multiple spots on the bottom of each well. Each spot can be coated with a different antibody, and the CCD camera of the MSD detector can read an independent signal from each spot. Up to 10 spots for a 96-well plate and 4 spots for a 384-well plate can be used for multiarray (multiplexing).
MSD has direct, indirect, sandwich, and competitive formats that have very similar procedures to the respective ELISA format. Table 1 shows the steps from the experiments used to analyze IL-1β, IL-6, and TNF-α in this report. Besides several common features to ELISA, MSD has a superior sensitivity and a broad dynamic range. The superior sensitivity is largely due to its chemiluminescent reaction, together with washing steps that can reduce the nonspecific background. The high binding capacity of the carbon electrode bottom of MSD plates further increases a large dynamic range. Though MSD can be in the 384-well format, due to its nonhomogeneous feature (washing steps are essential), it is not suitable for high-throughput screening. With the superior sensitivity, broad dynamic range, and multiplexing capability, MSD has been commonly used to detect biological analytes, including cytokines, in drug discovery.23,24
TR-FRET
TR-FRET is a technology combining time-resolved fluorometry and fluorescence resonance energy transfer. As shown in Figure 1D, FRET involves two fluorophores, a donor and an acceptor with overlapping spectra; that is, the donor fluorophore has an emission wavelength falling in the range of the excitation wavelength of the acceptor. Close proximity between the donor and the acceptor enables the resonance energy transfer. The time-resolved feature is a delay between the excitation and emission of the donor fluorophore (fluorescence with a long lifetime). Europium–allophycocyanin (Eu-APC or Eu-XL665) and terbium–PE (Tb-PE) are two common donor–acceptor pairs. Eu has peak excitation/emission at 340/615 nm, while APC has excitation/emission at 615/660 nm. Due to a couple of disadvantages of APC (such as a very large molecule), new acceptor dyes have been developed. ULight dye from PerkinElmer and d2 from CisBio can be used as an acceptor for Eu with features of smaller molecular weight and light resistance. Tb and PE have peak excitation/emission at 340/545 nm and 545/575 nm, respectively. For most of the TR-FRET pairs, the proximity to have 50% FRET efficiency is between 20 and 90 Å. TR-FRET can be applied to analyze many biological interacting components, such as DNA–DNA, DNA–protein, ligand–receptor, and analyte detection.25,26 In the case of cytokine detection, the donor and acceptor pair is normally a fluorophore-labeled antibody pair. One antibody is labeled with the donor fluorophore (europium cryptate) while the other antibody is labeled with the acceptor fluorophore (APC, ULight, or d2). They specifically bind to the analyte but in different binding sites to enable FRET. Very often, the donor antibody is polyclonal while the acceptor antibody is monoclonal.
As described in Table 1 , TR-FRET has simple steps of just addition of samples and donor and acceptor reagents. After an incubation of several hours to O/N, the plate is ready to be read with a compatible reader (EnVision, ViewLux, or PHERAStar). There are well-developed and optimized commercial reagents/kits for TR-FRET. HTRF 27 is the registered name of TR-FRET assay reagents from CisBio. Reagents from PerkinElmer for TR-FRET are called LANCE TR-FRET reagents. Both CisBio and PerkinElmer have well-optimized kits for many common analytes as well as reagents to develop your own TR-FRET assays.
TR-FRET has several practical advantages. The time-resolved feature and close proximity-induced signal can exclude the background fluorescence from unbound components, enabling it as a no-wash homogeneous assay. The ratiometric calculation of acceptor/donor fluorescence further reduces nonspecific signals. Normally, TR-FRET has a small-volume reaction in 96-, 384-, and 1536-well formats. With features of simple steps, good sensitivity, and a homogeneous and ultra-high-throughput format, TR-FRET has been widely used in drug discovery, including high-throughput screening.28,29 On the other hand, TR-FRET has several drawbacks. First, it can only have one analyte detected in one well and is not suitable for multiplexing. TR-FRET involves complex physics among the three essential components: donor, analyte, and acceptor. The concentrations and ratio of these three components can significantly affect the signal, requiring very intensive optimization. The requirement of close proximity (20–90 Å) may also be problematic to identify a good donor–acceptor pair. The signal/background (S/B) ratio is not always robust or sensitive enough to meet the requirement of high-throughput screening. It is also possible that the dynamic detection range is small and often generates a bell-shaped curve. 30
Cytometric Bead Array
CBA from Becton Dickinson (BD) is a bead-based flow cytometry platform to quantitatively detect analytes. IntelliCyt Sartorius has a similar technology named QBeads. As shown in Figure 1E , CBA beads are intrinsically embedded with unique fluorescence at two channels (FL-4 and FL-3) so that beads can be gated into different groups in the flow analysis. Each group of beads is coated with antibody against a specific analyte. Upon the addition of a fluorophore-conjugated detection antibody, bead-captured analytes can be quantified via the fluorescent intensity of the detection antibody. The fluorophore of the detection antibody, normally PE, is in a different channel from bead fluorescence. With the correct configuration for the flow analyzer, up to 30 groups of beads can be gated and distinguished, providing the ability to simultaneously read up to 30 different analytes. The flow analyzer for this technology needs to have at least two lasers to have three detecting channels. Flow analyzers from IntelliCyt, such as iQue HD, are specifically configured to run this bead-based assay.
CBA or QBeads technology has simple mix-and-read procedures—incubate beads with samples and then add the detection antibody, incubate, and read ( Table 1 ). A wash step can be applied before reading to increase sensitivity. This may be particularly helpful for multiplexing analysis. The detection steps with a flow analyzer are also relatively straightforward, particularly if using an IntelliCyt iQue flow analyzer. As shown in Figure 1E , the first step is to identify bead objects from forward scatter and side scatter. Then different groups of beads are gated under FL-4 (red) and FL-3 (infrared). Under each group of beads, the intensity of PE in channel 2 is positively correlated to the analyte concentration. Both BD and IntelliCyt have reagents for single analyte and premixed multiplexing kits for multiple cytokine analysis. It is also possible to set up your own multiplexing kit via mixing multiple single-analyte reagents. For that purpose, the first step is to identify unique groups of beads for the analytes of interest. The second step is to exclude reagents with crossover reactions. This can be done via comparing the standard curves of analytes at singlet and mixed analysis.
CBA/QBeads technology has a sensitivity at the range of double- to single-digit picograms per milliliter, depending on the detection kit. BD also provides enhanced CBA kits with a low detection limit at the subpicogram per milliliter level for several analytes. For example, we tested the enhanced detection kit for IL-10, which resulted in a very sensitive detection around 0.12 pg/mL (data not shown). The throughput of this technology is mainly dependent on the flow analyzer. If the IntelliCyt iQue HD instrument is used, it can be in a 96-, 384-, or 1536-well format. With several attractive features, including sensitivity, multiplexing, and high-throughput capability, this technology has been broadly used for cytokine profiling.31,32
Alpha Assays
AlphaLISA and AlphaScreen are two formats of PerkinElmer’s exclusive amplified luminescent proximity homogeneous assay (Alpha assay). Similar to TR-FRET, as shown in Figure 1F , the Alpha assay involves an energy transfer from a donor to an acceptor within proximity. The difference is that the Alpha assay uses luminescent oxygen-channeling chemistry. 33 It also uses beads as the donor and acceptor. The donor beads contain a photosensitizer (phthalocyanine), which, after excitation at 680 nm, activates ambient oxygen to interact with dyes embedded in the acceptor beads within proximity (200 nm) and eventually generate fluorescent signal. Both AlphaLISA and AlphaScreen use the same donor beads but different acceptor beads. For AlphaScreen, the acceptor beads are embedded with three dyes (thioxene, anthracene, and rubrene) and emit light between 520 and 620 nm. The acceptor beads of AlphaLISA are embedded with thioxene and europium, which emits at 615 nm. The narrower detection wavelength of AlphaLISA can exclude many background signals. AlphaPLEX, a multiplexing format of AlphaLISA, uses streptavidin-conjugated donor beads to bind to multiple biotinylated antibodies. Three types of acceptor beads are distinguished via their unique dyes (terbium, europium, and samarium) with different emissions at 545, 615, and 645 nm, respectively. The Alpha assay can analyze many biological interacting components, such as DNA–DNA, DNA–protein, ligand–receptor, protein modification, and analytes. To detect cytokines, both donor and acceptor beads are conjugated with specific antibodies to the analyte of interest. The donor beads are often conjugated with streptavidin, which binds to a biotinylated antibody. The binding of the analyte to both antibodies brings the donor and acceptor beads into proximity and triggers FRET to generate signal.
The Alpha assay has simple steps of additions of donor beads, sample, and acceptor beads (Table 1). It can be configured in 96-, 384-, and 1536-well plates. Therefore, it is homogeneous and suitable for high-throughput screening. In addition, the Alpha assay normally has a large dynamic range and good sensitivity. PerkinElmer has optimized reagents and kits for the Alpha assay to detect many analytes. With these advantages, this technology has been reported in a number of studies.34,35 On the other hand, this technology has several pitfalls. Since the generation of singlet oxygen from ambient oxygen is one essential step, this assay is very sensitive to environmental changes such as temperature. In addition, the donor beads are very light sensitive and should be processed under a consistent dim light condition. These factors make the assay subject to high variations. 36 Similar to TR-FRET, AlphaLISA can easily have a bell-shaped dose curve, a common feature for proximity assays. Therefore, it is also important to titrate and identify an appropriate detection range. During the assay optimization, it is recommended to test a few dilutions of samples to ensure the sample concentration in the linear correlation range.
FirePlex
FirePlex technology from Abcam, a novel immunoassay technology, uses patented innovative FirePlex particles for multiplexing analysis of biological analytes. As shown in Figure 1G , the particles, made from porous bioinert hydrogel, have green fluorescence and three distinct functional regions. After identification via green fluorescence, particles are grouped based on their yellow fluorescence intensities. Each group of particles has a conjugated binder (such as an antibody) in the center region to capture analytes specifically. The detection still uses fluorophore-conjugated detection reagents (such as PE-conjugated antibodies). FirePlex uses high-content (HT) imagers or flow cytometers as readers. Compatible imagers include imagers manufactured by Molecular Devices (ImageXpress), TTP LabTech (MirrorBall), PerkinElmer (Opera Phenix), GE (In Cell Analyzer 2200 and 6000), and Yokagawa (Cell Voyager 7000s and 8000). Compatible flow analyzers include Millipore’s Guava; BD Biosciences’ Accuri C6, FACSCanto, FSRII, and FSRFortessa; and Thermo Fisher’s Attune. If using a high-content imager, the assay can be in 384-well format with up to 10 analytes. If a flow analyzer is used, the multiplexing capacity is up to 70 analytes, based on the description of the technology on Abcam’s website. Though no special reading instrument is required, FirePlex has its own software (provided free by Abcam) to process data. For cytokine analysis, Abcam has ready-to-go reagents for a predesigned panel of human cytokines. Besides, Abcam also has reagents for a variety of cytokines to build up a custom panel for analysis. It is worth noting that Abcam has validated FirePlex reagents for analyzing 70 human miRNAs.
The steps for FirePlex are relatively straightforward ( Table 1 and Materials and Methods). It is homogeneous with good throughput (384-well plate format if using imaging analysis). Based on our analysis, FirePlex has good detection accuracy in the high concentration range (above 123 pg/mL). The sensitivity is generally in the double-digit picogram per milliliter level, but varies with different analytes. FirePlex has been used in biomarker analysis and even diagnosis in several reports.37,38
Comparisons of Technologies Analyzed in This Report
To have an integrated comparison for these seven technologies, three cytokines, IL-1β, IL-6, and TNF-α, were analyzed from two sets of samples as described in the Materials and Methods section. With actual experimental data from the same sets of samples and rigorous statistics, we compared three critical aspects: sensitivity, dynamic range, and robustness. Two additional features, multiplexing and high-throughput capability, were also compared to further understand how to best use each of the technologies.
Sensitivity and Dynamic Range
For each technology, we first measured three analytes (recombinant proteins of IL-1β, IL-6, and TNF-α) in a dose range from 10,000 to 0.17 pg/mL with 11 doses and 8 repeats for each dose. The dose curves were analyzed via four-parameter log-logistic dose–response curve fitting (
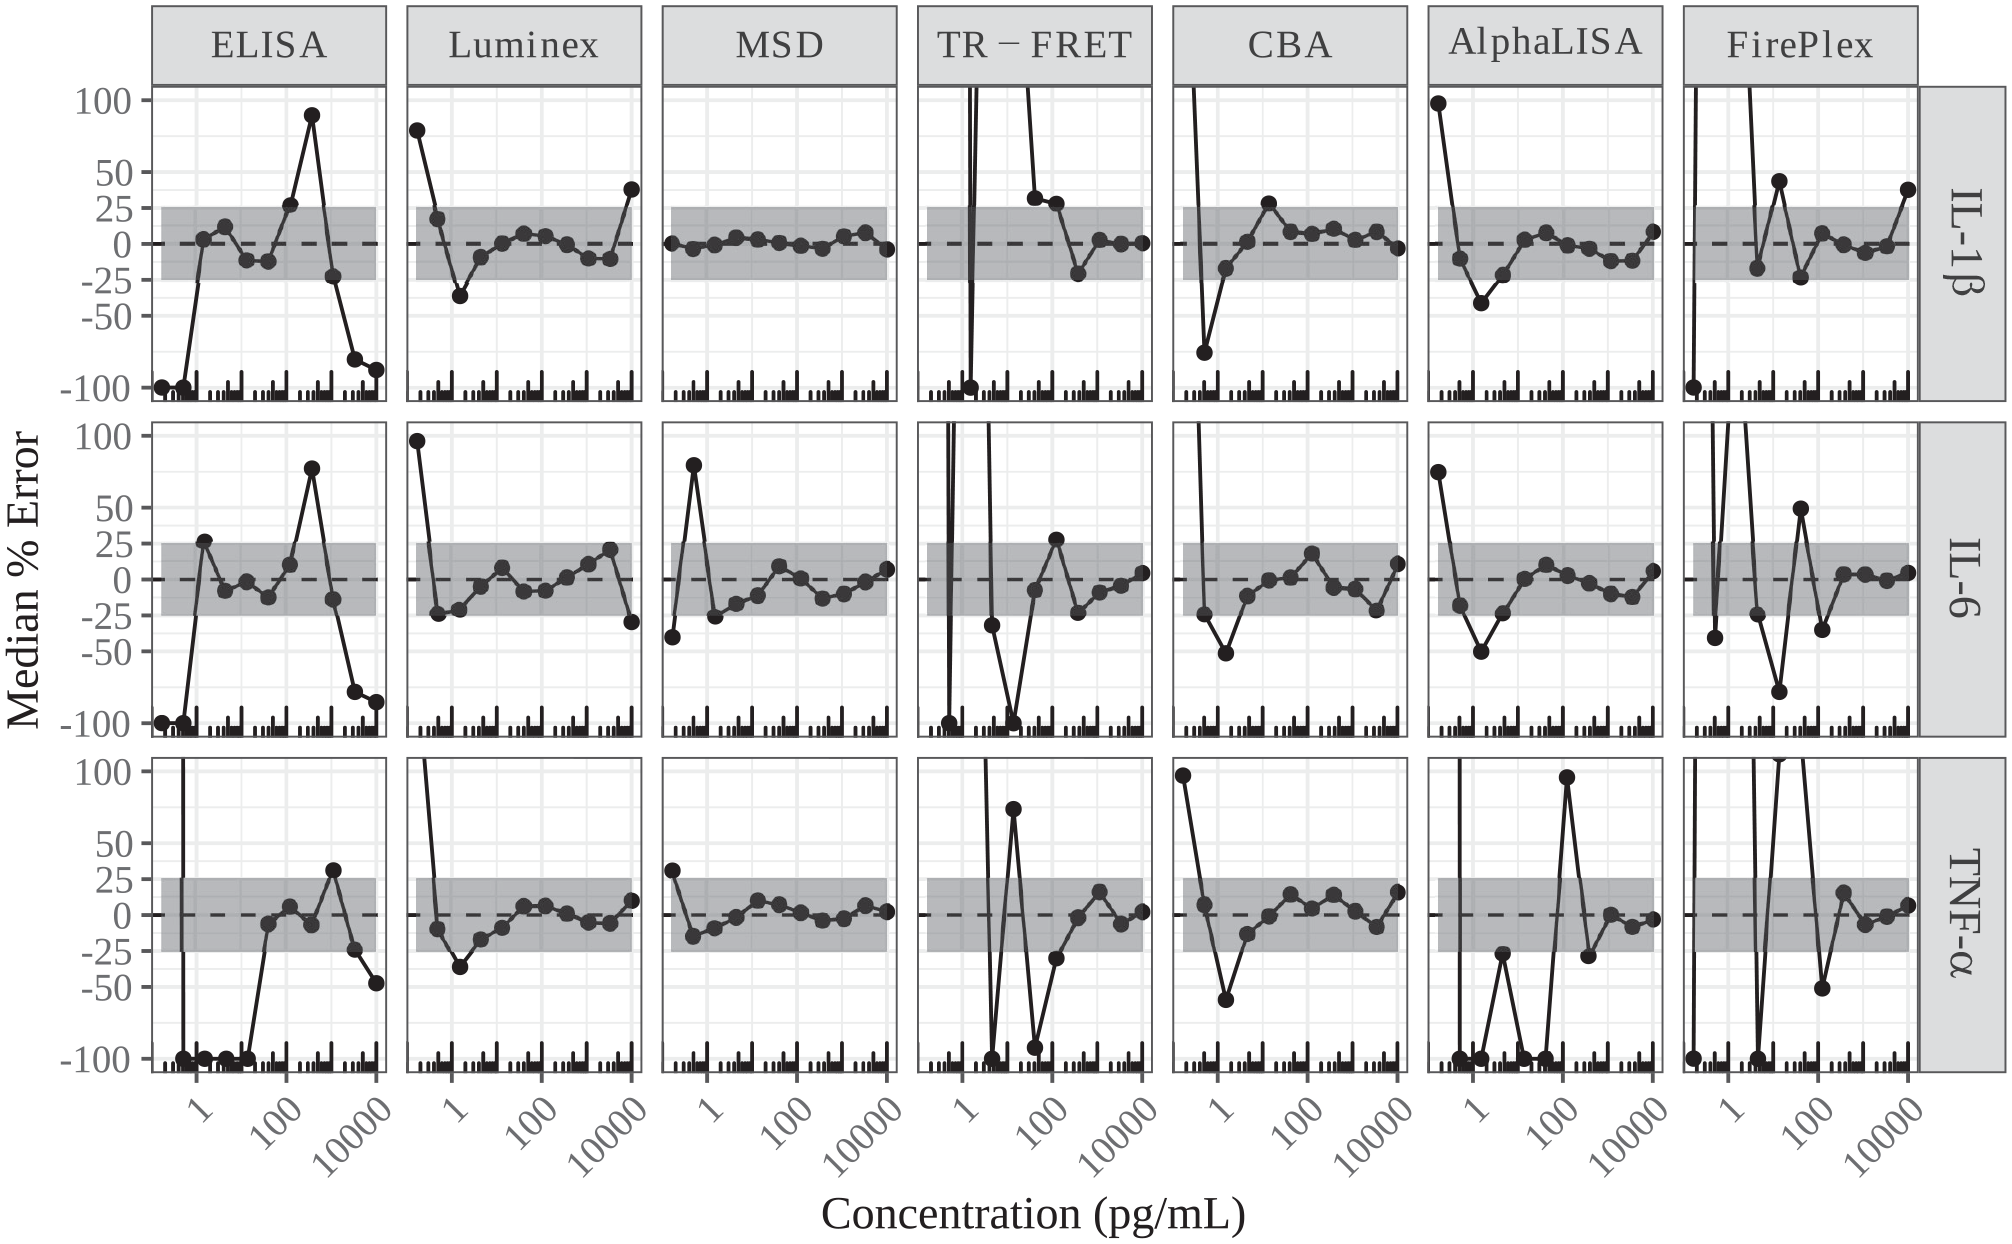
Median errors of back calculation for each analyte with tested technologies. With the results of eight repeats from the measurement of recombinant standards, a standard curve was generated from three randomly picked data points for each dose of each cytokine. The remaining five data points were used for back calculation from the three-point standard curve. The back-calculated concentrations were compared with the actually used concentrations for percent error calculation with the following equation: 100*(back-calculated concentration – actual concentration)/actual concentration. This simulation was performed 100 times to generate a median percent error for each dose of three analytes. The gray shaded area indicates within ±25% of median error.
With this back calculation analysis, we first compared the performance of each technology in the low concentration range (the last six doses, from 0.17 to 41 pg/mL), specifically the sensitivity for the low detection limit. Figure 2 shows that ELISA has median errors within ±25% for IL-1β and IL-6, except the last two doses, but for TNF-α, only the 41 pg/mL dose has a median error close to 0; the other five doses have median errors around 100% or –100%. Compared with ELISA, Luminex has better performances at the low concentration range. For IL-6, only the last dose (0.17 pg/mL) has a high positive median error of back calculation (above 50%), while IL-1β and TNF-α have errors within ±25%, except the last dose (0.17 pg/mL) and the dose of 0.51 pg/mL. MSD clearly has the smallest median error of the back calculation in the low range. The median errors of back calculation for both IL-1β and TNF-α in MSD are very tight and near 0, except the lowest dose of TNF-α, with a median error of around 30%. IL-6 also has small median errors, except the last two doses, which have median errors of more than ±25%. The tight and small median errors of back calculation in the low concentration range demonstrate MSD as the most sensitive among the tested technologies in this report. Another technology with relatively small median errors of back calculation is CBA, in which only the last two or three doses have median errors of back calculation of more than ±25%. AlphaLISA has median errors within ±25% for doses of 0.51 and 4.5–41 pg/mL for IL-1β and IL-6, but for TNF-α, the median errors are all out of ±25% for the whole low range, from 0.17 to 41 pg/mL. Figure 2 also shows that, for TR-FRET (HTRF) and FirePlex, almost all the median errors of back calculation are out of ±25% for the low dose range, from 0.17 to 41 pg/mL, indicating insensitivity for low concentrations for these two technologies.
Besides sensitivity in the low concentration range, accurate detection for a high top concentration is also critical in order for an assay platform to cover responses with a robust induction or inhibition. If the accurate detection range is shallow, multiple tests with dilutions may be needed to identify a sensitive detection range. Figure 2 also shows the performances of these technologies in the five high concentration ranges from 123 to 10,000 pg/mL. MSD shows very tight and small median errors (close to 0) for every dose of all three analytes in the high concentration range, demonstrating very accurate detection of analytes in the high concentrations. CBA has median errors within ±25% for every dose in the high concentration range, although with slightly higher variations than MSD. Luminex has median errors within ±25% for the high-concentration doses, except the top dose (10,000 pg/mL) for IL-1β at around 30% error and IL-6 at around –30% error. TR-FRET (HTRF) has median errors within ±25% for the top four doses of every analyte, but with median errors around the border for the dose of 123 pg/mL. AlphaLISA has median errors within ±25% for IL-1β and IL-6 for all the high-concentration doses, but only the top three doses for TNF-α. FirePlex shows median errors within ±25% for IL-1β for doses from 123 to 3333 pg/mL and a slightly high median error (close to 30%) at the top dose, while for IL-6 and TNF-α, the median errors are within ±25%, except for the dose of 123 pg/mL. ELISA has median errors within or on the border of ±25% for TNF-α in the high concentration range up to 3333 pg/mL, while for IL-1β, all the median errors are out of the range ±25%, and for IL-6, only two doses have median errors within ±25%.
Based on the performance in the low and high concentrations, we further assessed the accurate detection dynamic range for each technology based on the back calculation analysis in Figure 2 . The accurate detection range covers a continued concentration range with less than ±25% median error of back calculation, as shown in Figure 3 , blue bars. Meanwhile, we also compared the obtained accurate detection ranges with reported detection ranges from each kit instruction (orange bars). It clearly shows that ELISA has relatively shallow accurate detection ranges for all three tested cytokines. For both IL-1β and IL-6 with ELISA, the accurate detection range is from 1.5 to around 123 pg/mL in our analysis. These ranges match well with reported ones from the ELISA kits for IL-1β and IL-6. The detection range from our analysis for TNF-α is from 41 to 3333 pg/mL, a much higher low detection limit than the reported value from the TNF-α ELISA kit. Luminex shows a 3–4 log unit accurate detection dynamic range from 4.5 to 3333 pg/mL for IL-1β, 0.5 to 3333 pg/mL for IL-6, and 4.5 to 10,000 pg/mL TNF-α. The accurate detection range for IL-1β with MSD is even broader, covering the entire tested range from 0.17 to 10,000 pg/mL—a 5 log unit accurate dynamic range. For TNF-α, MSD also shows a superior broad dynamic range from 0.5 to the top level of 10,000 pg/mL, while IL-6 has an accurate dynamic range from 1.5 to 10,000 pg/mL. Overall, MSD shows 4–5 log unit broad accurate dynamic ranges for three tested analytes. In comparison with MSD kit reported values, our analysis has a small right shift for the detection ranges of three analytes, as shown in Figure 3 . Consistently between our analysis and kit reports, TR-FRET (HTRF) shows an accurate detection range from 41 to 10,000 pg/mL for IL-6 and 123 to 10,000 pg/mL for IL-1β and TNF-α. The top detection limit of TR-FRET (HTRF) reaches the top concentration in our analysis (10,000 pg/mL), slightly higher than what is reported from the kits. As shown in Figure 3 , CBA has sensitive low detection limits and broad detection ranges in our analysis, which are also very comparable to CBA kit reported values. The low detection limits are all single digit (1.5 pg/mL for IL-1β and 4.5 pg/mL for IL-6 and TNF-α). The top detection limits reach our top concentration of 10,000 pg/mL. These values give a 4 log unit broad detection range for CBA. AlphaLISA has an accurate detection range from 4.5 to 10,000 pg/mL, a 4 log unit detection range for IL-1β and IL-6, but for TNF-α, the accurate detection range is only from 370 to 10,000 pg/mL. There is also a significant discrepancy for the detection sensitivity and dynamic range between our analysis and reported values from AlphaLISA kits, particularly for TNF-α. FirePlex shows relatively narrow detection ranges with accurate detection ranges of 41 to 3333 pg/mL for IL-1β and 370 to 10,000 pg/mL for IL-6 and TNF-α.
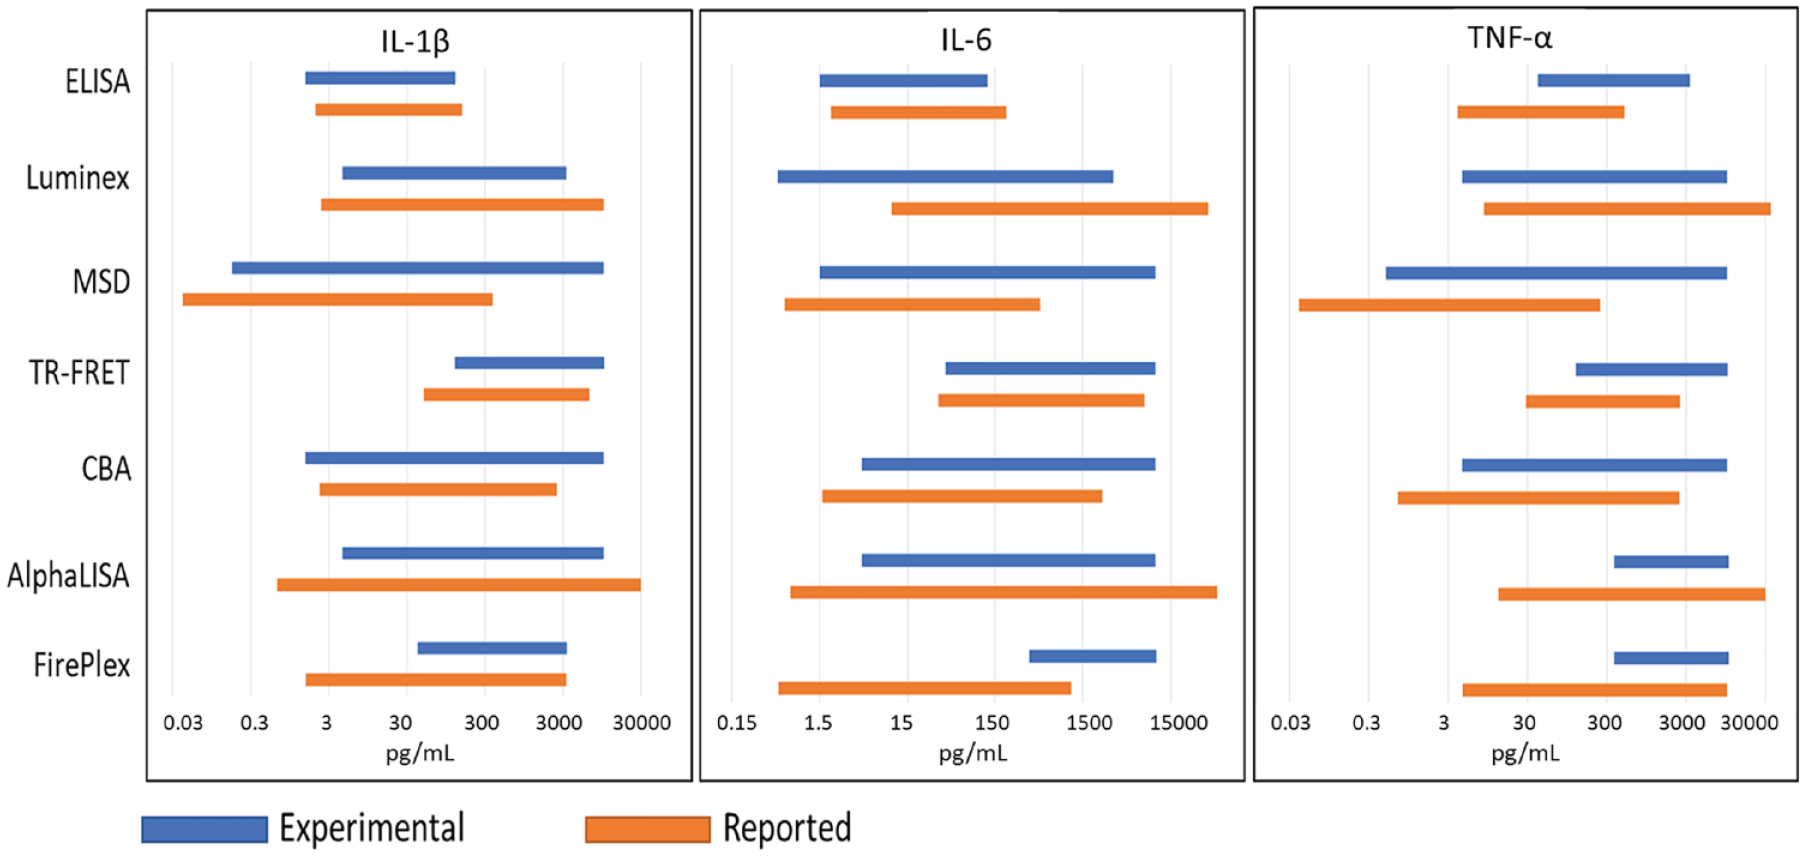
Comparison of accurate detection dynamic ranges for seven tested technologies. Blue bars are for results derived from our standard curve analysis. The results covered continued concentration ranges with median percent errors of back calculation within ±25%. Yellow bars are for reported values from each kit instruction.
Though several technologies show good matches between the accurate detection ranges of our analysis and kit reported values, there are some significant discrepancies observed in the comparison. One possible cause may be due to different standard proteins used. For the goal to fairly compare these technologies, we used commercial recombinant proteins as standards for each technology, instead of using standards from each kit. This may generate some differences in the detection results. Moreover, the analysis method to determine the accurate detection range may be very different. We use a criterion of median error of back calculation less than ±25% for a continued concentration range to determine the accurate detection range. This may be more rigorous than values determined from a commonly used standard curve fitting, such as four-parameter log fitting.
Robustness
With the data from standard dose curves and THP-1 cell supernatant serial dilutions, robustness parameters are analyzed, including coefficient of variation percent (%CV), S/B, and Z′ values. Percent CV values in this report are the average of each dose’s %CV calculated from eight repeats of each dose of standard curves and THP-1 cell supernatants. The S/B ratio is the signal of supernatants of THP-1 cells treated with LPS divided by the signal of supernatants of THP-1 cells without LPS treatment. Z′ values are calculated with the equation Z′ = 1 – 3*[(STDEV of +LPS) + (STDEV of –LPS)]/(average signal of +LPS – average signal of –LPS). STDEV of +LPS is the standard deviation of signals from supernatants of THP-1 cells treated with LPS; STDEV of –LPS is the standard deviation of signals from supernatants of THP-1 cells without LPS treatment. The average signal of +LPS is the average signal of supernatants of THP-1 cells treated with LPS. The average signal of –LPS is the average signal of supernatants of THP-1 cells without LPS treatment.
These robustness parameters are summarized in Table 2 . Among these technologies, Luminex has the smallest %CV values, at less than 10% under our conditions (4% for IL-1β and TNF-α and 7% for IL-6), suggesting small variations of readouts from Luminex. MSD shows the second best %CV values of 4%, 19%, and 7% for IL-1β, IL-6, and TNF-α, respectively. ELISA and TR-FRET (HTRF) have %CV values of around 15% for these three analytes. CBA and AlphaLISA show comparable %CV values of around 20%, while FirePlex has %CV values above 30%, indicating relatively large variations from FirePlex technology. It should be noted that we have only eight repeats for each dose, which may not be enough to represent the situation of screening. In addition, our reported %CV values are compromised by %CV values of low doses, which have small values of readouts and hence high variations in percentage. Therefore, %CV values can be smaller in a real screening assay with appropriate high and low controls and adequate repeats (16 repeats for each control in a 384-well format and 32 repeats for each control in a 1536-well format). Nevertheless, the %CV values in Table 2 should be able to indicate a trend of variation for these technologies. As for the S/B ratio, interestingly, the S/B ratio values for IL-1β are smaller than those for IL-6 and TNF-α with each technology. To compare among tested technologies, MSD has the highest S/B ratios overall, with an even S/B ratio of 2696 for IL-6. S/B ratios of Luminex and CBA are comparable to or even slightly higher than those of MSD for IL-1β and TNF-α. For IL-6, Luminex also shows a very high S/B ratio at 674. FirePlex has an S/B ratio for IL-1β that is very comparable to those for MSD, Luminex, and CBA, but for IL-6 and TNF-α, the S/B ratios are slightly lower than those for MSD, Luminex, and CBA. ELISA has S/B ratios for IL-6 and TNF-α at the middle level, but a low S/B ratio for IL-1β (only 2.6). AlphaLISA has S/B ratios between 10 and 30 for three analytes, in the relatively low range compared with MSD, Luminex, CBA, and FirePlex. Data show that for TR-FRET (HTRF) all the S/B ratios are below 5—the lowest S/B values for all three analytes among the tested technologies. Consequently, Z′ values, a parameter of combined outcome of %CV and S/B ratio, show that MSD and Luminex have the highest Z′ values above 0.8 for all three analytes, while ELISA and CBA have Z′ values very close to or above 0.7. FirePlex has acceptable Z′ values between 0.6 and 0.8, mostly due to a robust S/B ratio, while TR-FRET (HTRF) and AlphaLISA have relatively low but still acceptable Z′ values between 0.5 and 0.7 for IL-6 and TNF-α, but the Z′ values for IL-1β are 0.34 with AlphaLISA and only 0.08 with TR-FRET (HTRF). The low Z′ values are mostly due to the low S/B ratio and relatively high variations (%CV values) of these two technologies.
Comparison of Robustness Parameters for Seven Tested Technologies. a
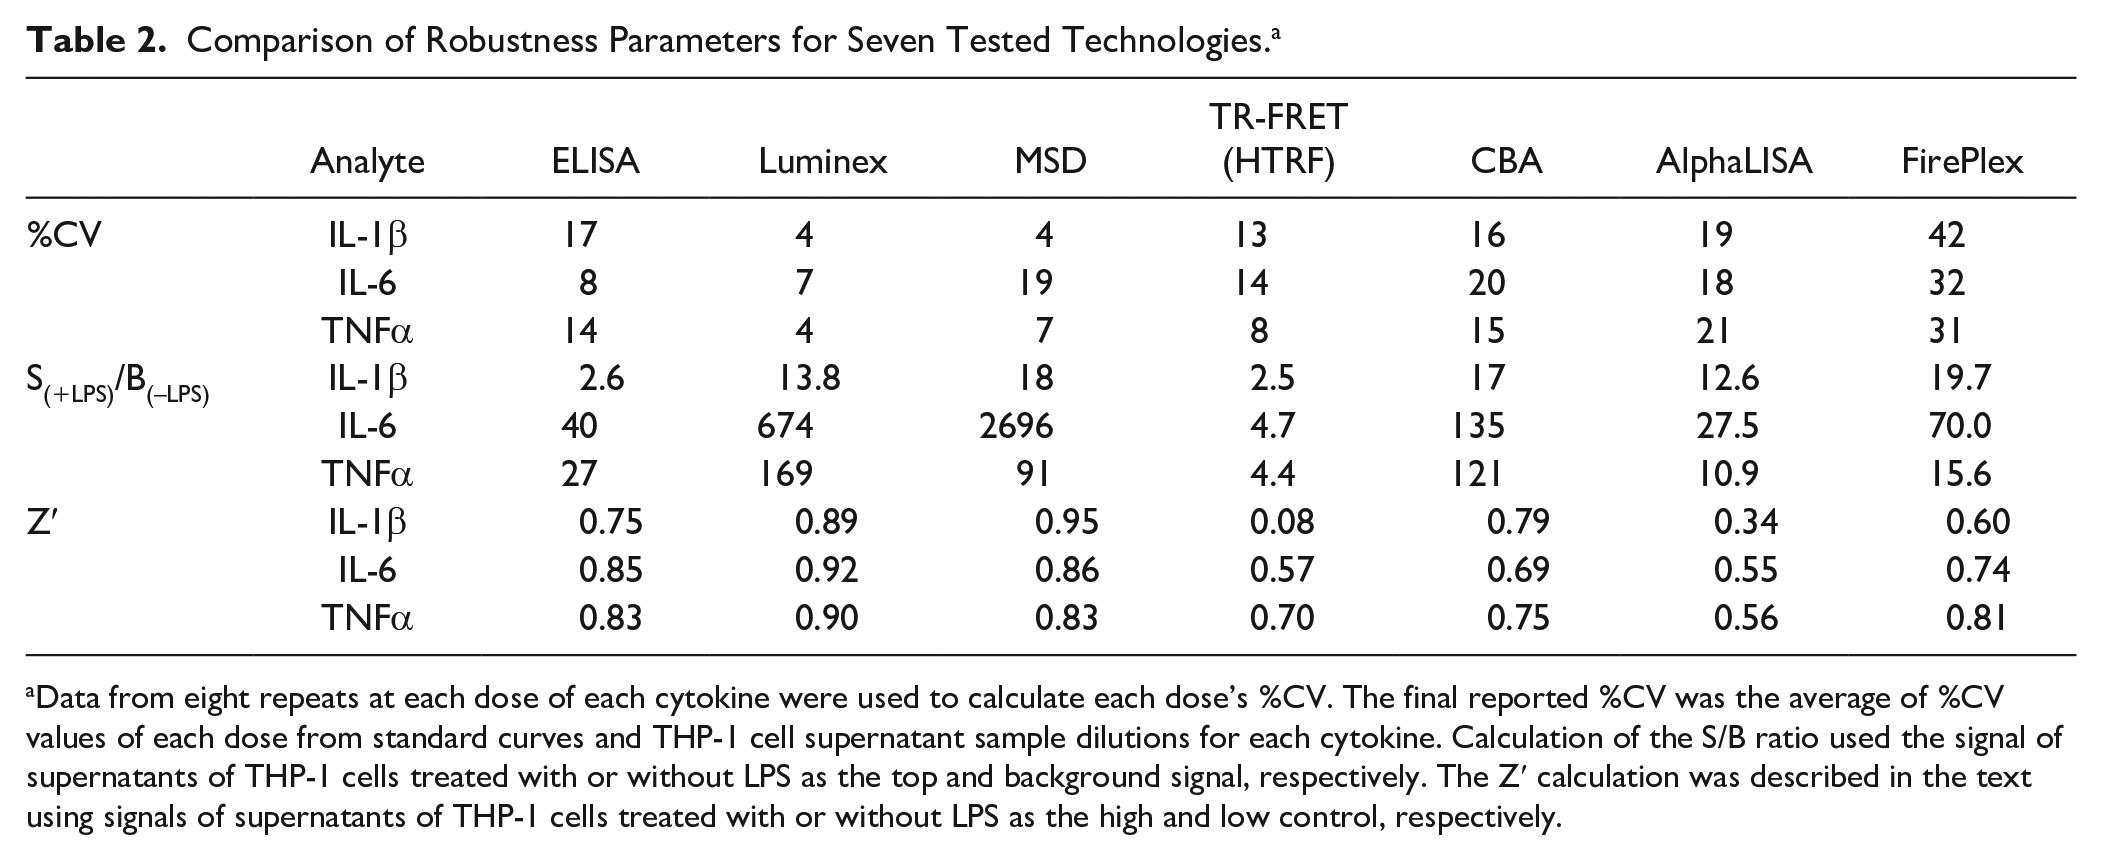
Data from eight repeats at each dose of each cytokine were used to calculate each dose’s %CV. The final reported %CV was the average of %CV values of each dose from standard curves and THP-1 cell supernatant sample dilutions for each cytokine. Calculation of the S/B ratio used the signal of supernatants of THP-1 cells treated with or without LPS as the top and background signal, respectively. The Z′ calculation was described in the text using signals of supernatants of THP-1 cells treated with or without LPS as the high and low control, respectively.
Multiplexing and High-Throughput Capability
One important and useful feature for cytokine profiling technology is the capability of multiplexing. Among the tested technologies, ELISA and TR-FRET are confined to measure one analyte at a time. AlphaPLEX (derived from AlphaLISA) can maximally detect three analytes from one reaction. MSD and FirePlex-HP have multiplexing capability up to 10 analytes. For CBA, we have tested 17 analytes with satisfactory results (data not shown). Based on vendor information (BD and IntelliCyt), the multiplexing capacity of CBA can go above 30 analytes. Luminex can measure 50–500 analytes depending on its specific format. Though it is powerful to have a large multiplexing capability, the multiplexing capacity up to 10 analytes is likely a satisfactory number in the screening stage. From this point of view, MSD, CBA, FirePlex, and Luminex can all fit the purpose for multiplexing in screening.
Several criteria should be considered to select and develop an assay for high-throughput screening. As described in the section above, robustness parameters including %CV, S/B, and Z′ values have to meet certain expectations to ensure a reasonable hit rate. The expectation for Z′ value would be minimally above 0.4, but very often a higher Z′ value such as above 0.7 is desired to have a successful screening campaign. In addition to the first-line criteria of robustness, when considering HTS suitability, several other factors are important to take into account, such as plate format, homogeneity, ease of use, and cost. Table 3 summarizes information related to high-throughput suitability (focusing on throughput, homogeneity, robustness, and cost) and multiplexing capacity. The throughput and homogeneity information in Table 3 is mostly based on our experimental hands-on experience and technology principles, while the robustness information is from the experimental data in this report. The cost information, a necessary and practical consideration for the execution of a high-throughput campaign, is calculated from catalog prices from vendor websites for the kits (latest at the time of writing) and reagent volumes used in this report. For technologies tested in this report, ELISA, MSD, and Luminex show high-throughput suitable robustness features (such as Z′ values, as shown in Table 2 ), but they are not homogeneous due to washing steps, and mostly in the 96-well format with challenges to miniaturize. The costs of these three technologies, based on vendor list prices, are in the high range for a regular high-throughput campaign. Hence, these formats are not the top choice for a high-throughput screening. TR-FRET (HTRF), AlphaLISA, and FirePlex have a homogeneous and medium- to high-throughput format, but their robustness features are moderate or even low (such as the low Z′ values for IL-1β with TR-FRET and FirePlex). Overall, it seems that CBA is the most suitable technology for high-throughput screening due to its high-throughput and homogeneous format and good robustness features (such as Z′ values very close to or above 0.7, as analyzed in the above section). Moreover, CBA has simple and quick steps (as described in the “Overview of Technologies Analyzed in This Report” section). CBA is also the most cost-effective if employing a reduced volume protocol as described in the Materials and Methods section.
Summary of High-Throughput Capability Features for Tested Technologies. a
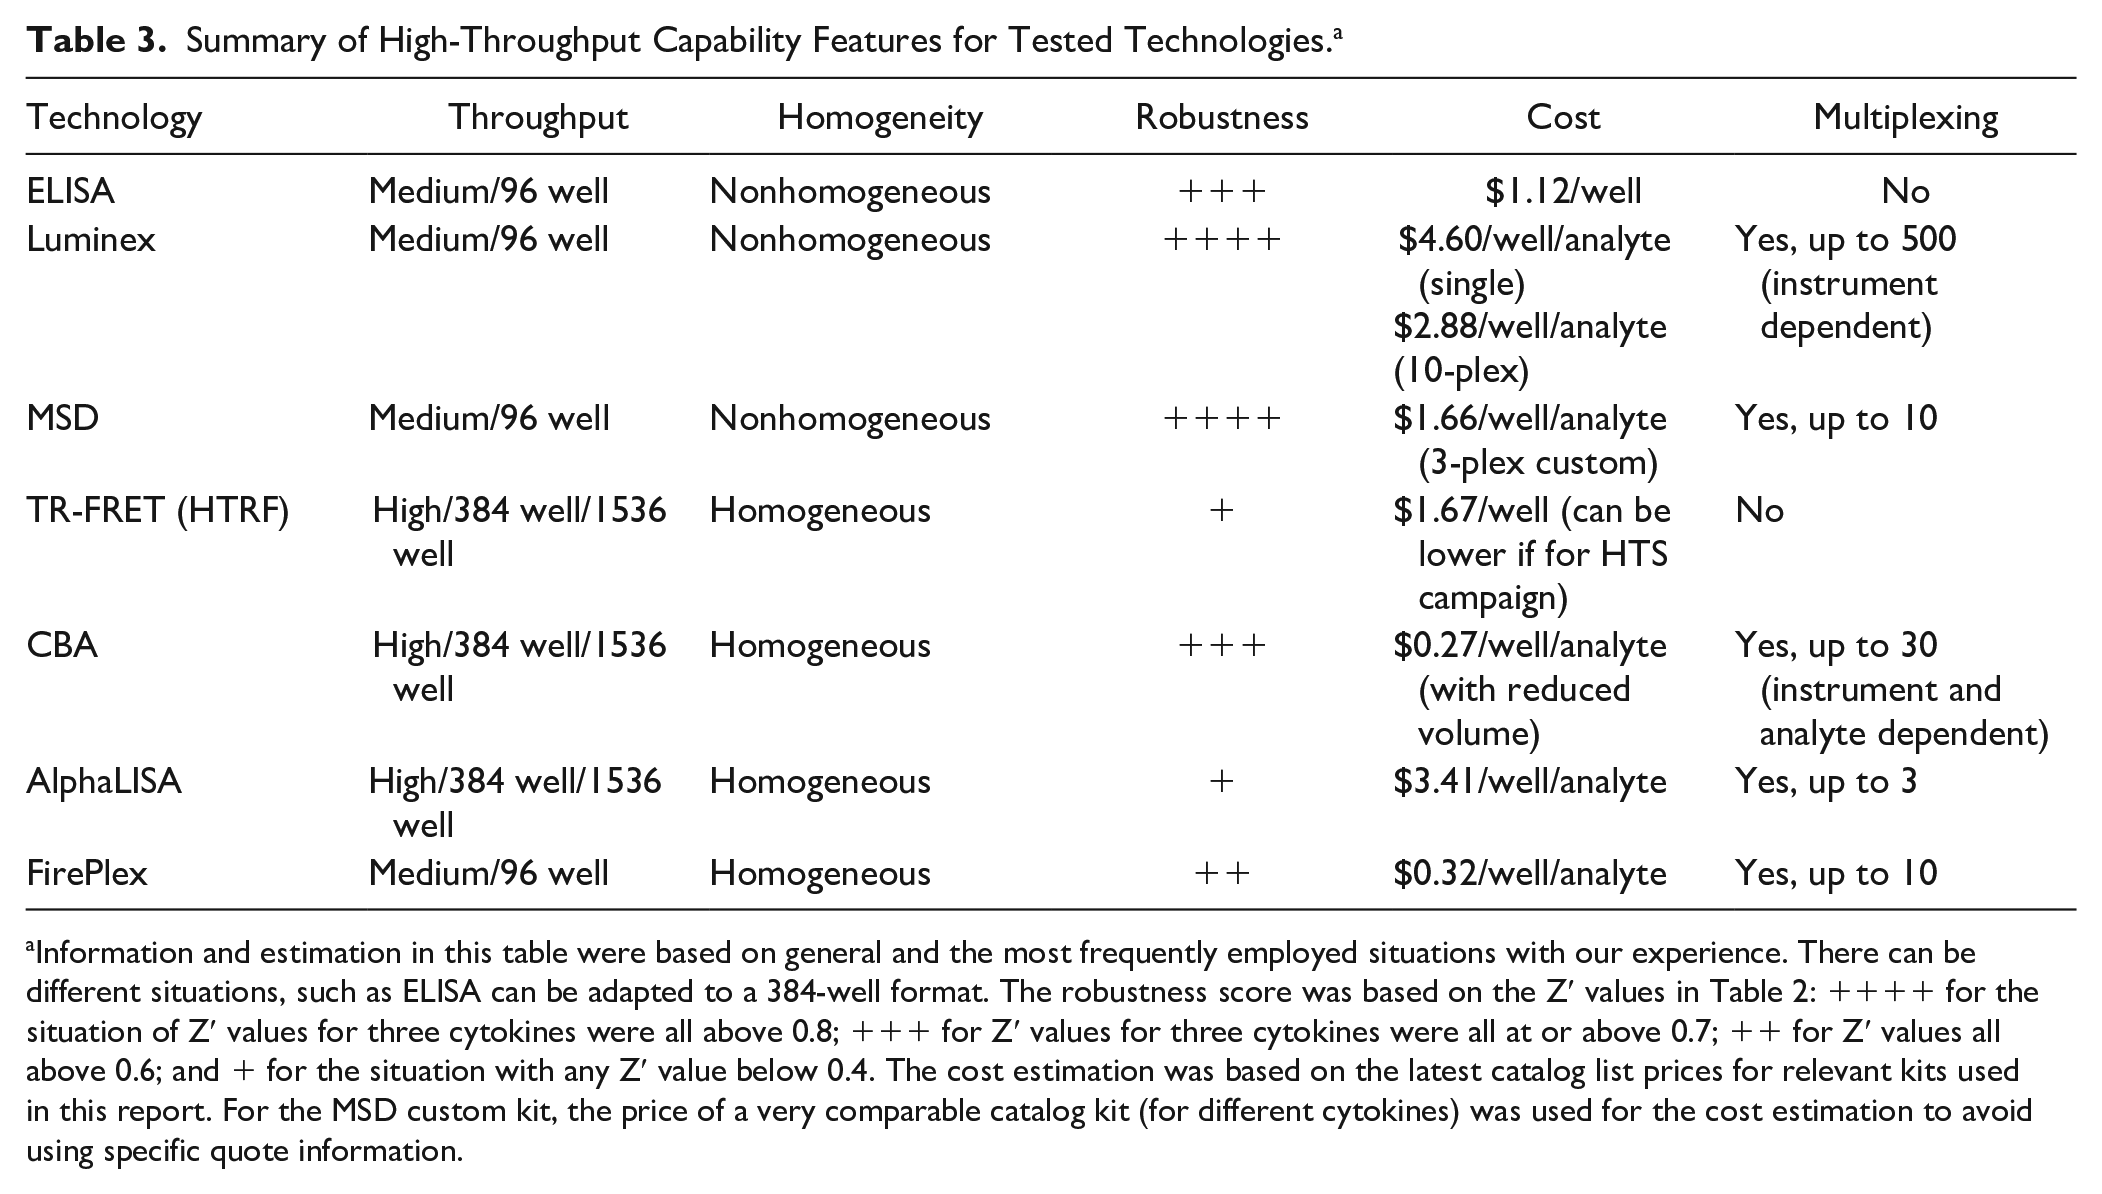
Information and estimation in this table were based on general and the most frequently employed situations with our experience. There can be different situations, such as ELISA can be adapted to a 384-well format. The robustness score was based on the Z′ values in Table 2: ++++ for the situation of Z′ values for three cytokines were all above 0.8; +++ for Z′ values for three cytokines were all at or above 0.7; ++ for Z′ values all above 0.6; and + for the situation with any Z′ value below 0.4. The cost estimation was based on the latest catalog list prices for relevant kits used in this report. For the MSD custom kit, the price of a very comparable catalog kit (for different cytokines) was used for the cost estimation to avoid using specific quote information.
Biological Considerations for Cytokine Profiling Studies
Cytokine levels are closely regulated via complex pathways and mechanisms. They can change dramatically and sensitively under different conditions. Besides choosing an appropriate technology, it is also critical to carefully consider relevant biological aspects. Besides common considerations for biological in vitro assays, a few specific aspects may need to be considered for cytokine profiling studies, as discussed below.
Cytokine Dynamics
It has been reported that each cytokine has different kinetics of expression in response to biological stimuli in both in vitro cellular systems and in vivo animal models. 39 At a specific time point, one cytokine can have a dramatically different level from another. For example, in human peripheral blood mononuclear cells (PBMCs) stimulated with LPS, TNF-α usually has a very quick response within a couple of hours, then decreases after 24 h of stimulation 40 (data not shown). Interestingly, IFN-γ is at a very low level in the early phase (within 24 h) but increases significantly after 48 h stimulation (data not shown). Therefore, particularly at the beginning, it is necessary to perform time-course studies across a broad time period to identify the peak time point for each specific cytokine. Based on the time-course studies, it may be possible to select a time point in which cytokines of interest have a significant response, and therefore samples collected under this time point can be used for multiplexing or a large-scale screening. In our experiments, time points between 30 min and 24 h were tested initially, and ultimately a 17 h time point of LPS-treated THP-1 cells was selected for cytokine analysis.
Relevance of Model Systems
For every in vitro and in vivo research system, one of the most important considerations is whether it can translate and mimic physiologically relevant disease mechanisms. For in vitro cytokine analysis, one critical factor is to choose the relevant cell type. Blood or PBMCs have many cell types and are physiologically relevant. However, due to the complexity of blood or PBMCs, or low abundance of a particular cell type of interest, some cell-type-specific responses may not be easily observed or distinguished. It may be necessary to isolate/enrich a specific cell type (such as T regulatory cells or NK cells) to study cell-type-specific responses. Meanwhile, tissue/organ-specific immune cells (such as Kupffer cells in liver or microglia in the nerve system) may be desired for a specific study. These cell types may need to be isolated from the specific tissue. Alternatively, induced pluripotent stem cell (iPSC)-differentiated cells can be considered if the differentiation and characterization are validated. Very often, a cell line is used to investigate effects of a specific target after genetic manipulation (overexpression or knockdown/knockout). In those cases, one needs to be sure the cellular context is physiologically relevant with the target-responsive pathways. It may be worthy to examine a list of relevant cell lines to confirm observations and further validate responses in primary cells.
A specific and relevant stimulus is another important factor in cytokine studies. LPS, a mixture of lipid and polysaccharide derived from the outer membrane of gram-negative bacteria, has been commonly used to stimulate an inflammatory response in various systems. It is well known that different sources/batches of LPS may stimulate different responses or yield the same trend, but to a very different level. This is mostly due to variations of LPS structure and components, as well as strains of bacteria used. 41 It is a good practice to evaluate several batches of LPS to select a suitable one and obtain a large amount to keep consistency during the course of study. For studies on immuno-oncology, autoimmunity, and other inflammatory-related diseases, other stimuli should be considered based on the mechanisms of interest.
Several additional factors can be easily overlooked but may have profound effects on cytokine levels. One factor is the components of the culture medium. It was reported that glutamine affected several cytokine levels in PBMCs stimulated by LPS. 42 FBS can also critically affect cytokine levels and responses. There are several common approaches to reduce/avoid effects from FBS, such as serum starvation, using charcoal-stripped FBS, 43 or using serum-free medium, which is a very common option to control variations from FBS.
Secreted and Intracellular Cytokine Levels
Cytokines in culture supernatants or body serum/fluids are secreted functional proteins, and their levels can provide critical information about immune responses. However, analysis from secreted proteins is unable to provide information about which cell type is generating each specific cytokine. For this purpose, intracellular cytokines have to be specifically detected together with cell-type-specific markers. Nevertheless, the technologies for detecting intracellular cytokines are different from those for secreted cytokine profiling. The above-discussed platforms are for secreted cytokine analysis. As for intracellular cytokine studies, the main approach is intracellular staining, followed by flow cytometry or imaging analysis. With a cell-type-specific marker in parallel, it can identify cytokine generation in each specific cell type. Although still at a relatively limited capacity, flow cytometry and high-content imaging platforms have been significantly advanced toward multiplexing, high content, and a screening scale.
Besides biological considerations, statistical rigors should be applied for the design of experiments and data analysis to identify reproducible biological responses. Adequate repeats should include biological repeats (such as biological samples treated on different days) and technical repeats (such as repeats with the same samples) to cover variations from biology and experimental processes. Plate edge effects also should be addressed for plate-based assays. Randomization of treatment is recommended during the validation stage. This is important during the assay development stage but may not be practical during the screening process.
Additional Platforms and Perspectives on New Technologies
The platforms discussed above are well established and commonly used in cytokine measurement. However, several other technologies can be very useful for specific applications. One example is single-molecule array (Simoa) technology developed by Quanterix. It can isolate and detect single-molecule events and reach an ultrasensitivity at femtomolar concentrations. Simoa uses specific antibody–enzyme-conjugated beads to capture analytes that are loaded to array plates for detection via an enzyme–substrate reaction. The generated signal is highly concentrated due to an extremely small reaction volume, enabling the detection of a single-enzyme reaction. 44 Though this technology provides ultrasensitivity, its high-throughput capability is limited due to washing steps and array format. Another useful platform is Cytokine Array, which can easily detect hundreds of cytokines in one blot. It is attractive for initial investigation with a large panel of analytes to identify responsive ones. However, due to multiple washing steps and array format, Cytokine Array is not optimal for profiling multiple samples. MirrorBall from TTP Labtech is a bead-based assay using a laser scatter detector to locate the beads and fluorescence intensity from a bead–analyte–antibody complex. 45 With the capability to locate nonfluorescent objects, MirrorBall excludes the background from unbound antibody in the solution. This provides the features of low background and homogeneous mix-and-read. The proprietary optics of the laser scanner also provide high sensitivity and limited multiplexing capability.
It is worth noting that all of the above-discussed immunoassays rely on specific antibodies. Though antibody generation has been dramatically advanced, it still presents a challenge to have specific antibodies to distinguish some closely related protein isoforms. Combining nonimmunoassays may provide a solution to this concern. Another bottleneck for these technologies is detection sensitivity. Though several of them have sensitivity to the subpicogram per milliliter level, there is still a gap to detect cytokines at a femtogram per milliliter level. Increasing sensitivity is clearly one direction for new technology development. Simoa, as mentioned above, is able to detect analytes at a femtogram per milliliter level through the detection of a single-enzyme reaction. Similarly, single-molecule counting (SMC) is another technology with superior sensitivity. SMC still uses the basic immunoassay principle (antibody antigen detection) but has the ability to count signals as digital events. The sensitivity is hence dramatically improved with good accuracy. Meanwhile, all the technologies discussed above lack the ability to detect analytes at the single-cell level. It has been well realized that biological samples are typically heterogeneous and present challenges to understand biological responses from bulk sample studies. Single-cell analysis offers a powerful tool to dissect biological responses to a single-cell level. Abseq technology utilizes DNA sequence-tagged antibodies to specifically bind to cell surface proteins and then go through microfluidic barcoding and DNA sequencing to read out the signal on a single cell.46,47 However, Abseq can only detect cell surface proteins and hence is not for secreted or intracellular proteins. BD Biosciences has developed the Rhapsody system using the Abseq technology for simultaneous measurement of both RNA and protein expression from a single cell, 47 which can reveal information regarding various protein isoforms derived from mRNA splicing. Another example for single-cell protein analysis is single-cell Western blotting. It has been used to quantitate multiple proteins at the single-cell level.48,49 The commercial single-cell Western blotting device Milo from ProteinSimple can analyze 1000 single cells in one run and can detect ~12 proteins per cell, although this device is not for secreted cytokine detection. The IsoLight from IsoPlexis is a platform to perform single-cell functional proteomic studies. In conjunction with the IsoCode chip and an ELISA antibody barcode array, this platform can analyze more than 1000 single cells for multiple secreted cytokines from each single cell. It has been used to investigate single immune cell functional cytokines and has demonstrated powerful potential for immunostudies and cell therapy. 50
Taken together, in this article, we describe an integrated comparison of seven technologies (ELISA, Luminex, MSD, TR-FRET, CBA, AlphaLISA, and FirePlex) commonly used for cytokine profiling in drug discovery. Combining actual experimental data with our hands-on experience and literature information, the comparison covers assay principles, assay flow process, multiplexing capability, high-throughput suitability, and, more importantly, sensitivity, accurate detection range, and robustness. The usage of the same source of samples and standards in our analysis ensures a fair and direct comparison among these various technologies. More importantly, our comprehensive analysis provides invaluable information for readers to understand and select these technologies for specific applications. In addition, the discussion related to cytokine biology and assay conditions, derived from our hands-on experience, provides initial but critical considerations for cytokine profiling analysis. The perspectives showcase developing directions for cutting-edge technologies in cytokine profiling, especially on sensitivity, multiplexing capability, and single-cell functional proteomic analysis. The learnings and guidelines discussed in this report can be readily applied to not only cytokine profiling studies but also other phenotypic assays and biomarker and disease signature studies in biological research and drug discovery. Nevertheless, there is no one technology fit for all. It is important to understand the features of each technology in order to decide which is the most suitable for a specific goal and situation.
Supplemental Material
Supplemental_Material_for_Comparative_analysis_of_multiple_immunoassays_for_cytokine_by_Platchek_et_al – Supplemental material for Comparative Analysis of Multiple Immunoassays for Cytokine Profiling in Drug Discovery
Supplemental material, Supplemental_Material_for_Comparative_analysis_of_multiple_immunoassays_for_cytokine_by_Platchek_et_al for Comparative Analysis of Multiple Immunoassays for Cytokine Profiling in Drug Discovery by Michael Platchek, Quinn Lu, Hoang Tran and Wensheng Xie in SLAS Discovery
Footnotes
Acknowledgements
We thank Dr. Ricardo Macarron for support and guidance with the manuscript, Dr. John Emery for critical reading of the manuscript, Chris Watson for help in imaging analysis for FirePlex, and Dr. Daniel Pregibon for initial technique advice for FirePlex. This research received no specific grant from any funding agency in the public, commercial, or not-for-profit sectors.
Supplemental material is available online with this article.
Declaration of Conflicting Interests
The authors declared no potential conflicts of interest with respect to the research, authorship, and/or publication of this article.
Funding
The authors received no financial support for the research, authorship, and/or publication of this article.
References
Supplementary Material
Please find the following supplemental material available below.
For Open Access articles published under a Creative Commons License, all supplemental material carries the same license as the article it is associated with.
For non-Open Access articles published, all supplemental material carries a non-exclusive license, and permission requests for re-use of supplemental material or any part of supplemental material shall be sent directly to the copyright owner as specified in the copyright notice associated with the article.