
Abstract
Phenotypic profiling assays are untargeted screening assays that measure a large number (hundreds to thousands) of cellular features in response to a stimulus and often yield diverse and unanticipated profiles of phenotypic effects, leading to challenges in distinguishing active from inactive treatments. Here, we compare a variety of different strategies for hit identification in imaging-based phenotypic profiling assays using a previously published Cell Painting data set. Hit identification strategies based on multiconcentration analysis involve curve fitting at several levels of data aggregation (e.g., individual feature level, aggregation of similarly derived features into categories, and global modeling of all features) and on computed metrics (e.g., Euclidean and Mahalanobis distance metrics and eigenfeatures). Hit identification strategies based on single-concentration analysis included measurement of signal strength (e.g., total effect magnitude) and correlation of profiles among biological replicates. Modeling parameters for each approach were optimized to retain the ability to detect a reference chemical with subtle phenotypic effects while limiting the false-positive rate to 10%. The percentage of test chemicals identified as hits was highest for feature-level and category-based approaches, followed by global fitting, whereas signal strength and profile correlation approaches detected the fewest number of active hits at the fixed false-positive rate. Approaches involving fitting of distance metrics had the lowest likelihood for identifying high-potency false-positive hits that may be associated with assay noise. Most of the methods achieved a 100% hit rate for the reference chemical and high concordance for 82% of test chemicals, indicating that hit calls are robust across different analysis approaches.
Keywords
Introduction
High-throughput profiling (HTP) assays are untargeted screening assays that measure a large number (hundreds to thousands) of cellular features to capture the biological state (i.e., phenotype) of a cell. 1 Examples of HTP assays are “omics” technologies, including transcriptomics2–4 and imaging-based morphological profiling, such as Cell Painting.5,6 HTP assays have been used in various research settings, including academia7,8 and industry, 4 to characterize the biological activity of chemicals or genetic manipulations using a variety of different cell models and assay technologies. These types of assays are also of interest for broader use by regulatory organizations in the context of next-generation chemical safety assessments.9,10 One fundamental application for HTP data relevant to each of these sectors is reliable identification of “hits,” that is, treatments that produce biologically and statistically significant changes in cellular phenotype that are associated with biological activity. 11
The high-content nature of profiling assays introduces additional challenges to hit identification10,12 as compared to targeted high-throughput screening (HTS) assays. Targeted HTS assays are designed to measure one (or a few) specific endpoints, and response thresholds for hit identification are based on either the use of well-characterized negative and positive control treatments or defined based on the separation of true signal from statistically characterized baseline activity (i.e., noise). Responses to test conditions falling below these thresholds are then classified as inactive, whereas responses above these thresholds are classified as active.13,14 This strategy is difficult to generalize to HTP assays, for several reasons: (1) HTP assays often measure hundreds to thousands of features (i.e., have high dimensionality), and it would not be feasible to define a threshold for each individual feature in an analogous manner to targeted assays. (2) Measurement of many features allows for observation of a multitude of diverse cellular responses (i.e., phenotypes). Therefore, within the context of a large HTP screen, it is not known a priori which phenotypic responses will be observed. Hence, there is not a single positive control that can be used to establish hit thresholds for the multitude of phenotypes that may be observed. (3) Even without perturbation, stochastic variations in feature measurements can contribute to identification of false actives in high-dimensionality data sets to a greater extent than in HTS assays. This is a classic manifestation of the multiple testing problem.
To date, there are no widely accepted standard practices for hit identification from HTP data.15,16 As a consequence of the large number of features that are measured, there are a wide array of potential strategies for identification of hits and—for concentration-response screening—derivation of potencies. The choice of hit definition strategy also depends on the purpose of the screen. For example, for lead compound identification in the pharmaceutical sector, a hit definition strategy that minimizes false actives may be desirable.17,18 In contrast, for toxicology screening, the tolerance for identification of false actives using profiling assays will vary depending on the nature of the downstream application (e.g., comparatively higher tolerance in screening for prioritization versus comparatively lower tolerance for defining a specific hazard in the context of a risk assessment). 19
The recently released Next Generation Blueprint for Computational Toxicology at the United States Environmental Protection Agency (USEPA; i.e., USEPA Comptox Blueprint) advocates the use of HTP assays for initial characterization of the biological activity of environmental chemicals in human-derived cell models. 9 The use of HTP assays has been proposed as part of a tiered toxicity testing approach that relies on computational and non–animal-based methods for chemical safety evaluation. 9 Applications for HTP data include identification of potency thresholds for perturbation of cellular biology, prediction of putative mechanism of action and/or molecular initiating events, 20 and prioritization of chemicals for further testing and subsequent confirmation in targeted HTS or organotypic assay systems. 9 Chemicals with environmental exposure potential often lack a specific molecular target in human-based cell models and may have biological activity that is associated with polypharmacology (i.e., promiscuous activity at multiple molecular targets) or general cell stress.21–23 All of these attributes contribute to the challenging task of hit identification when applying HTP assays to the universe of structurally diverse environmental chemicals. The variety of data analysis strategies that can be applied to profiling data and uncertainties regarding concordance of results, including active or inactive hit calls, across different analysis strategies represents a potential barrier to the broader use of these types of data in regulatory applications.24,25
We previously operationalized the Cell Painting HTP assay 5 for concentration-response screening in U-2 OS osteosarcoma cells and screened 462 unique environmental chemicals. 26 Following extraction of 1300 features, concentration-response modeling was performed using the BMDExpress software package 27 to identify individual features affected by chemical treatment. We then grouped the features into biologically meaningful categories (based on the channel, compartment, and analysis module). Chemicals in which at least one category had ≥30% of constituent features identified as concentration responsive were considered active, and their phenotype altering concentration (PAC) was defined as the median potency of the most sensitive (i.e., potent) category. Using this approach, 95% of tested chemicals were identified as active, which is helpful in terms of identifying a minimum bioactive concentration that can be used to prioritize chemicals using a bioactivity:exposure ratio.26,28 Although a high rate of actives was expected because of the nature of the chemical test set (i.e., enriched in pesticides and chemicals with biological activity in ToxCast assays 28 ) and the use of a permissive benchmark response (BMR; i.e., 1*standard deviation [SD] of controls 29 ), the proportion of false active hits using this approach was unclear. This was due to uncertainty regarding the identity and proportion of true-negative (i.e., biologically inert) chemicals present in the test set in the concentration range tested and the aforementioned challenges in establishing hit criteria for HTP assays.
In the present study, we compared various approaches for identification of hits in imaging-based phenotypic profiling (i.e., Cell Painting) data using the above-mentioned data set. The goal of this work was to understand the impact of decisions made in the data analysis workflows on the resulting active or inactive hit calls and the associated PACs for perturbation of cellular biology, as these results may inform future chemical safety evaluations. With a focus on applications for in vitro bioactivity screening as the first step in a tiered toxicity testing strategy,
9
both multiconcentration and single-concentration approaches for hit identification were considered (
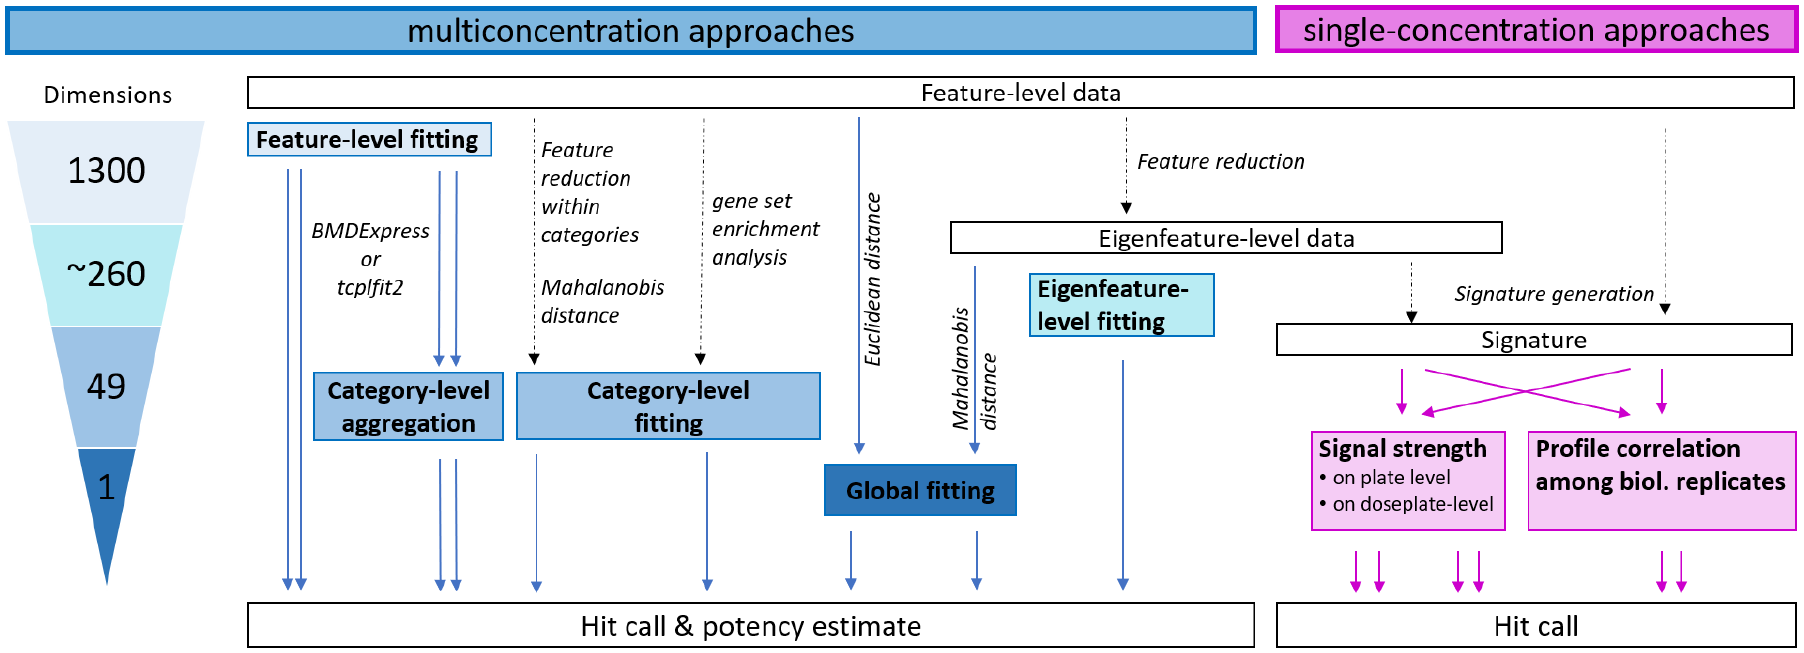
Approaches for hit determination from imaging-based phenotypic profiling data. Multiconcentration approaches for hit determination are shown in blue. Single-concentration approaches for hit determination are shown in pink. The number of individual benchmark concentrations that could potentially be derived from each multiconcentration approach is shown in the triangle to the left. The starting point for all approaches was well-level data for each phenotypic feature. Feature-level data can be fit and directly used for potency estimation, or the fit results can be aggregated to the category level (i.e., collection of related features) before determining hit calls and calculating potency estimates. Data from our adaptation of the Cell Painting assay 26 can be reduced to 49 categories before curve fitting using either feature reduction (principal component analysis) or single-sample gene set enrichment analysis approaches. The 1300 individual features can also be used to calculate a Euclidean distance from controls and model this value as a single-response variable. Similarly, feature-level data can be transformed to eigenfeatures to account for correlation among features, and then the distance from controls can be calculated using the Mahalanobis distance approach.30,31 Eigenfeature-level data can also be used directly for curve fitting. For single-concentration approaches, feature-level or eigenfeature-level data can be used to derive signatures, and the overall signal strength of the signature can be compared with that of controls. Alternatively, the correlation of signatures among biological replicates of the same treatment can be used as a hit-calling criteria.
Materials and Methods
Experimental Data
The data set used for this study has been previously published 26 and is publicly available at https://doi.org/10.23645/epacomptox.12132621.
Briefly, U-2 OS human osteosarcoma cells were treated for 24 h with eight concentrations (1/2 log10 spacing, typically 0.03–100 µM) of each chemical. The screen was performed in 384-well plate format. A total of 462 unique test chemicals from the ToxCast chemical library were screened. A total of 16 randomly selected chemicals were screened in duplicate, which brought the total number of chemical samples evaluated to 478. The screen was performed using 12 dose plates, each with a different subset of test chemicals in a dilution series. Each chemical sample was screened in four independent cultures (i.e., biological replicates) with one technical replicate (i.e., well) per culture for each concentration of each chemical sample. Test plates from each biological replicate that were dosed with the same subset of test chemicals belong to the same plate group. Each test plate also contained 24 solvent control wells and six concentrations of four phenotypic reference chemicals: berberine chloride, Ca-074-Me, rapamycin, and etoposide (see also Fig. S1 in Nyffeler et al. 26 ). For the reference chemicals, each plate group was considered to be independent of one another, that is, resulting in a total of 12 response profiles for each reference chemical, which we refer to as “replicates.”
For phenotypic profiling, labels were applied to visualize the nucleus (DNA), nucleoli (RNA), endoplasmic reticulum (ER), actin skeleton, Golgi and plasma membrane (AGP), and mitochondria (Mito). After image acquisition, 1300 features were extracted for each cell. Cell-level data were normalized to the solvent control using median absolution deviation normalization 5 and aggregated to well level by calculating the median of normalized cell-level data within each well. Well-level data were further z-standardized within the plate by scaling to the standard deviation (SD) of solvent control wells. These previously reported well-level results were used as the starting point for the present study.
A parallel set of plates was live labeled with propidium iodide and Hoechst 33342 to assess cytotoxicity and cytostasis. Information from this cell viability (CV) assay was used to identify a benchmark concentration (BMC) for onset of cytotoxicity/cytostasis and subsequently identify the highest noncytotoxic concentration (CV.NOEC) and the lowest cytotoxic concentration (CV.LOEC). As previously reported, data from wells above the CV.LOEC were not used for concentration-response analysis. 26
Data Analysis Software
Data processing, storage, analysis, and visualization were performed using R v3.6.2. 32 The R scripts are available at https://doi.org/10.23645/epacomptox.12589256.
Generation of a Null Data Set
A null data set representative of inactive response profiles was constructed using the well-level data from concentrations of test chemicals that had a low probability of being bioactive. This consisted of data from the two lowest concentrations of each test chemical, but only using test chemicals for which there was no inferred bioactivity at or below the third lowest tested concentration in the previous study. 26 Using these constraints, 472/478 test chemicals demonstrated no activity at the two lowest concentrations tested. Therefore, these wells were included in constructing the null data set.
For each test plate, well-level data for these inactive test chemical concentrations were randomly assigned to one of nine null chemicals and one of eight concentration indices (with ½ log10 spacing, consistent with the actual design of the screening study). The test plate-to-plate group relationship was maintained. Of note, the four biological replicates of a null chemical × concentration were derived from different test chemicals through the random sampling process. A total of 108 null chemicals were generated.
Metrics for Comparison of Analysis Approaches
Specificity was defined as the percentage of null chemicals (n = 108) that were correctly identified as inactive. Conversely, the false-positive rate (FPR) was calculated as 1 – specificity. Sensitivity (or true-positive rate [TPR]) was defined as the percentage of true-positives that were correctly identified as active. While all four phenotypic reference chemicals could have served as true-positives, we decided to focus on replicate screenings of only the reference chemical berberine chloride (n = 12) as a true-positive for this analysis, as it had subtle but reproducible effects in a small number of measured features. 26 The hit rate was calculated as the percentage of test chemicals (n = 478) that were identified as active. Concordance was defined as the percentage of test chemicals screened in duplicate (n = 16) for which both replicates were identified as either inactive or active.
Parameters for each analysis approach were optimized to maximize TPR while maintaining an FPR of ~10%. Tunable parameters for the various approaches included cutoff threshold (based on variance in the solvent control) and hit call probability for tcplfit2, threshold for effect size for BMDExpress, or threshold for signature generation, as described below. A list of all fixed and tunable parameters, as well as the final choices, is provided in
Multiconcentration Analysis Approaches
The starting point for all multiconcentration approaches was well-level data. For each chemical, concentrations above the CV.LOEL were excluded from concentration-response modeling to avoid potential problems with nonmonotonic curve behavior that can be observed at cytotoxic test concentrations. Different levels of data were modeled, in some cases preceded by feature reduction, to derive between 1 and 1300 potency estimates (BMCs). For all approaches, BMCs below the tested range were set to ½ order of magnitude below the lowest tested concentration (corresponding to dividing the concentration by 3), whereas BMCs above the tested range or above the CV.LOEC were discarded as invalid. Three test chemicals (disulfiram, thiram, ziram) had less than four concentrations remaining and were not modeled with tcplfit2 in accordance with previous recommendations regarding the use of benchmark dose modeling in toxicology.33,34 Therefore, some multiconcentration approaches and figures include results from only 475 test chemicals.
Feature-level fitting
Two different concentration-response modeling software packages were used: (1) BMDExpress 27 (https://www.sciome.com/bmdexpress/) and (2) tcplfit2, a curve-fitting package that includes constant, Hill, and gain-loss models from tcpl 35 and additional models to match the functionality of BMDExpress.
For BMDExpress, modeling parameters were identical to the previous study. 26 Briefly, the command line version of BMDExpress (v2.2.180) was used. Only features with an absolute mean response >1 in at least one test concentration were modeled. Four functions were fit to the data: Hill, power, and first- and second-degree polynomial. The model with the lowest Akaike information criterion was selected as the winning model. The BMR was set at ±1 (i.e., 1 SD from vehicle control). For the present study, an additional threshold for effect size was chosen to increase stringency. BMCs of features that had an absolute effect size ≤1.75 (designated as absolute maximal fold change of ≤2^1.75 in BMDExpress) were excluded.
For fitting with tcpl, a new version (tcplfit2, v.0.1.0, https://ncct-bitbucket.epa.gov/projects/TCPLFIT2/repos/tcplfit2/browse) of curve fitting was used, which allows fitting of effects in either direction and includes more fit functions: the four functions used with BMDExpress were run, as well as four exponential models (Exp2 – Exp5) and a constant model. In addition, tcplfit2 returns a continuous hit call probability, ranging from 0 to 1. Analogous to BMDExpress, features were modeled only if there was at least one test concentration with an absolute mean response >1. The BMR was defined using the median and normalized median absolute deviation (nMad; Nyffeler et al. 26 ) of the vehicle controls (of the corresponding plate group) and was set at 1 nMad (corresponding to 1 SD). BMCs were retained only if the hit call probability was ≥0.95.
For both approaches, chemicals were considered active if more features were affected (i.e., had a valid BMC) as compared with the 90th percentile of the null data set. For BMDExpress, chemicals with >20 affected features were considered active. For tcplfit2, chemicals with >24 affected features were considered active. The PAC was calculated as the fifth percentile of the valid BMCs (using R, function quantile with option type = 7 for linear interpolation of the quantile from continuous data).
Category-level aggregation
Each of the 1300 features was assigned to exactly 1 of 49 categories, based on the channel, compartment, and module from which it was derived (
Global fitting (Euclidean distance)
For each well, the Euclidean distance from the mean of the vehicle controls (of the corresponding culture plate) was calculated as
Feature reduction
For several of the approaches described below, well-level data were first transformed to a reduced set of eigenvectors, which we term eigenfeatures, using principal component analysis (PCA). Wells with <100 cells were excluded, as was the null data set (because it was sampled from the original data). PCA was conducted using R (v3.6.2), package stats 32 and function prcomp with options center=F and scale.=F using the entire data set as input. The first 260 principal components, covering >95% variance in the data set, were used to transform the original data set to the eigenfeatures.
Eigenfeature-level fitting
Fitting of eigenfeature-level data was performed with tcplfit2, similarly as to that described above. The BMR was defined based on the median and nMad of the vehicle control (of the corresponding plate group) and set at 1 nMad. Nine functions were fit, and eigenfeatures were fit only if there was at least one concentration that exceeded the BMR. BMCs were retained only if the hit call probability was ≥0.50. Hits and PACs were defined as described in the section “Feature-level fitting.”
Global fitting (Mahalanobis distance)
A covariance matrix was calculated from eigenfeature-level data using all wells with ≥100 cells (the null data set was not used). The inverse of the covariance matrix
Category-level fitting (Mahalanobis distance)
For each category, well-level data were transformed using PCA as described in the “Feature reduction” section, except that only the features within the category were used as input. The first N eigenfeatures that cover ≥90% of variance within that category were retained. Mahalanobis distance was then calculated for each category as described in the “Global fitting (Mahalanobis distance)” section.
Subsequently, the category-level Mahalanobis distances were modeled with tcplfit2, using nine functions and the median and nMad of the null data sets (of the corresponding plate group) to define the BMR, which was set at 1 nMad. BMCs were discarded if the hit call probability was <0.80 or if the top of the curve was negative (smaller than average distance to the mean of the vehicle controls is not considered an effect). Chemicals with at least one valid BMC were considered active, and the lowest BMC was defined as the PAC.
Category-level fitting (single-sample gene set enrichment analysis [ssGSEA])
The ssGSEA approach was originally developed for transcriptomics data and was adapted for use with the HTPP data with slight modification. 36 In brief, gene sets were defined as the set of features within each category as described in the section “Category-level aggregation.” Normalized feature data for each chemical and concentration were rank-ordered based on scaled response magnitude and zero-centered prior to calculating the Kolmogorov-Smirnov–like running sum statistic as described previously.36,37 The category enrichment score is the sum integration of the Kolmogorov-Smirnov–like running sum of features within the category and features outside of the category. Enrichment scores were further normalized by the range of scores across all test samples and categories. Large positive or negative scores for a category indicate that a sample is enriched in features for that category in the top or bottom extremes of the ranked feature set distribution, respectively.
Category enrichment scores were modeled with tcplfit2, using nine functions and the median and nMad of the null data sets (of the corresponding plate group) to define the BMR, which was set at 1.349 nMad. BMCs were discarded if the hit call probability was <0.50. Chemicals with at least one valid BMC were considered active, and the lowest BMC was defined as the PAC.
Single-Concentration Analysis Approaches
To simulate single-concentration data, we tested approaches that use only one concentration for each test chemical. In this study, the tested concentration range varies across chemicals. As we have cell viability information for all chemicals, we chose to use the highest noncytotoxic test concentration for each chemical (i.e., CV.NOEC) in evaluation of the single-concentration analysis approaches. This is the highest concentration below the threshold for cytotoxicity or cytostatic effects. For chemicals for which no cytotoxicity or cytostatic effects were observed, this value corresponds to the highest tested concentration.
Generation of profiles and signatures
A profile was defined as a vector consisting of the scaled response magnitude of the 1300 features at the corresponding concentration. To reduce noise, signatures were constructed from profiles by replacing all values that were below a certain signature threshold with 0 (signature thresholds are applied uniformly across all features). For the following approaches, signature thresholds between 0 and 6 were evaluated. The best signature threshold was selected independently for each method below based on highest sensitivity with FPR ≤10%, followed by having the lowest (most permissive) signature threshold that produced high concordance of hit calls for chemicals screened in duplicate. The approaches described below were also used to model eigenfeature transformed data (covering >95% of variance). In that case, no signature threshold was used.
Signal strength overall
Well-level data for a chemical was aggregated to a median across biological replicates (e.g., within-plate group). Three different measures of signal strength (SS) were tested: (1) the Euclidean norm
Signal strength platewise
In this approach, SS was calculated for each biological replicate of a chemical. The same three measures as described above were evaluated. The four values for SS were then compared with the distribution of SS for null chemicals (from the same plate group, i.e., 36 values) using a Wilcoxon rank-sum test (R function wilcox.test with option alternative=“greater”) to test if the SS values of the chemical were greater than the SS distribution of the null data. For null chemicals, the four SS values were compared with the SS values from the remaining null chemicals (i.e., 32 values).
Chemicals were considered active if the resulting p-value was below the 10th percentile of p-values of the null data set. The option with the best performance was Euclidean norm with a signature threshold of 2.25 (for feature-based data) and without a threshold (for eigenfeature-based data).
Profile correlation among biological replicates
The signatures of the four biological replicates were compared pairwise to each other using four different measures: (1) Pearson correlation, (2) cosine similarity
Chemicals were considered active if the third best value was higher than the 90th percentile of values of the null data set (or lower than the 10th percentile for Jaccard p-values). The option with the best performance was Pearson correlation with a signature threshold of 1.75 (for feature-based data) and cosine similarity (for eigenfeature-based data).
Results
Overview of the Different Approaches
For this study, we compared several multiconcentration and single-concentration approaches for hit identification, as illustrated in
Figure 1
. Definitions for hit calls and potency estimates are summarized in
Comparison of Performance of Hit Determination Approaches
A previously published data set 26 was reanalyzed and results compared using all of the described approaches. The data set comprised 462 unique test chemicals, of which 16 were screened in duplicate. Four reference chemicals were screened in concentration-response 12 times (corresponding to the number of plate groups in the study). In addition, a null data set comprising 108 null chemicals was constructed using data from the lowest two concentrations of test chemicals.
These various quality control data sets (i.e., duplicated test chemicals, reference chemicals, null data set) were used to optimize parameters for each individual modeling approach and to subsequently compare their performance. The FPR was empirically measured using the null data sets, while the TPR was based on the ability to reliably detect a subtle, specific reference chemical (berberine chloride). Concordance was based on hit calls for 16 chemicals screened in duplicate (i.e., the ability to consistently call both instances as inactive or bioactive). Parameters of each approach were optimized to achieve an FPR of ~10% and maximal TPR. If multiple sets of parameters produced equivalent results according to these criteria, the most permissive threshold with high concordance was chosen.
For 11 of 15 approaches, 100% TPR was achieved at an FPR ≤10% (
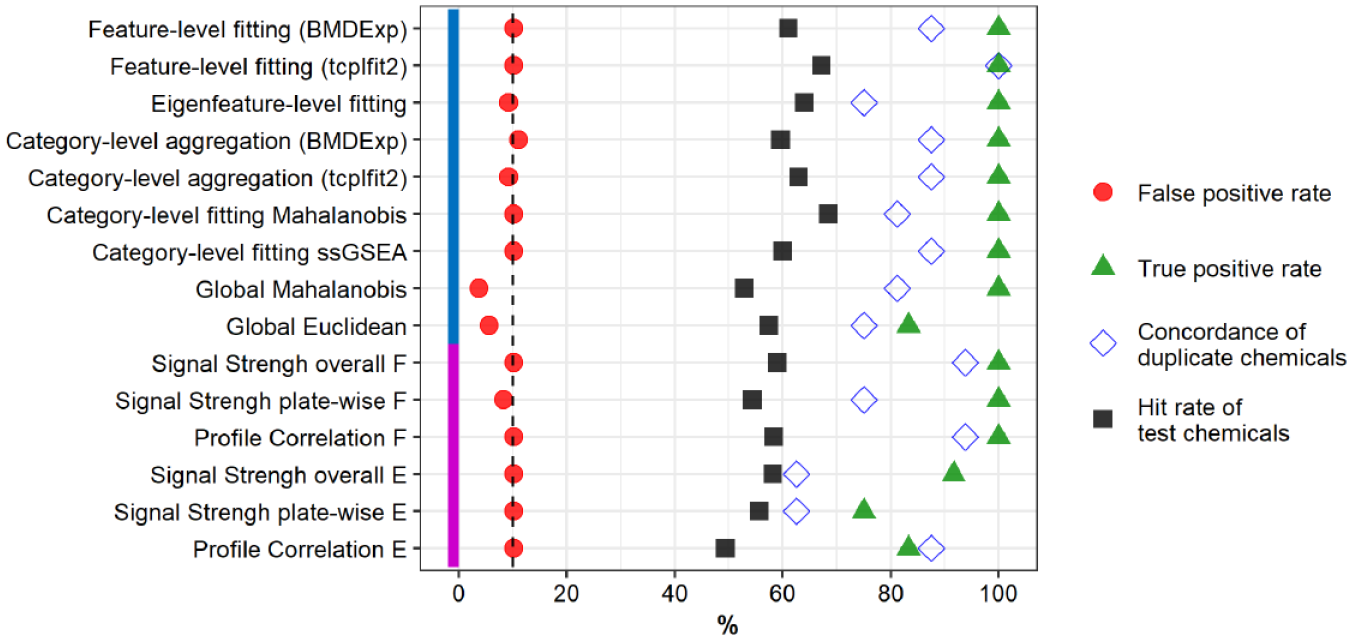
Comparison of performance of hit determination approaches. A previously published data set 26 was used to compare all approaches. U-2 OS cells were exposed for 24 h to the chemicals. Chemicals were tested in four biological replicates, resulting in a total of 48 assay plates organized as 12 plate groups. Approaches were optimized to a false-positive rate of ~10% (vertical dashed line) based on a randomized null data set (red circles; n = 108) and the best possible true-positive rate based on the reference chemical berberine chloride (green triangles; n = 12). Sixteen random test chemicals were screened in duplicate and used to calculate concordance (blue open diamonds) as the number of unique chemicals classified in both occurrences as either active or inactive. The hit rate of test chemicals (black squares) was calculated from 478 test chemicals, with the exception of approaches using tcplfit2 to fit, for which three chemicals had fewer than four concentrations and were excluded from concentration-response modeling. Method name abbreviations: ssGSEA, single-sample gene set enrichment analysis; F, feature based; E, eigenfeature based.
Overall, the evaluated approaches identified between 49% and 68% of test chemicals as bioactive. In general, multiconcentration approaches had a slightly higher hit rate than single-concentration approaches did. Of note, fitting with tcplfit2 resulted in more chemicals identified as bioactive than fitting with BMDExpress, for both feature-level fitting and category-level aggregation of feature-level fits as the basis for hit calls.
Concordance of Hit Calls among Approaches
Next, we wanted to investigate whether different approaches identify the same chemicals as bioactive. Overall, there was a large number of test chemicals that were identified as bioactive by all approaches, whereas another group of test chemicals, together with most null chemicals, were identified as inactive with all approaches (
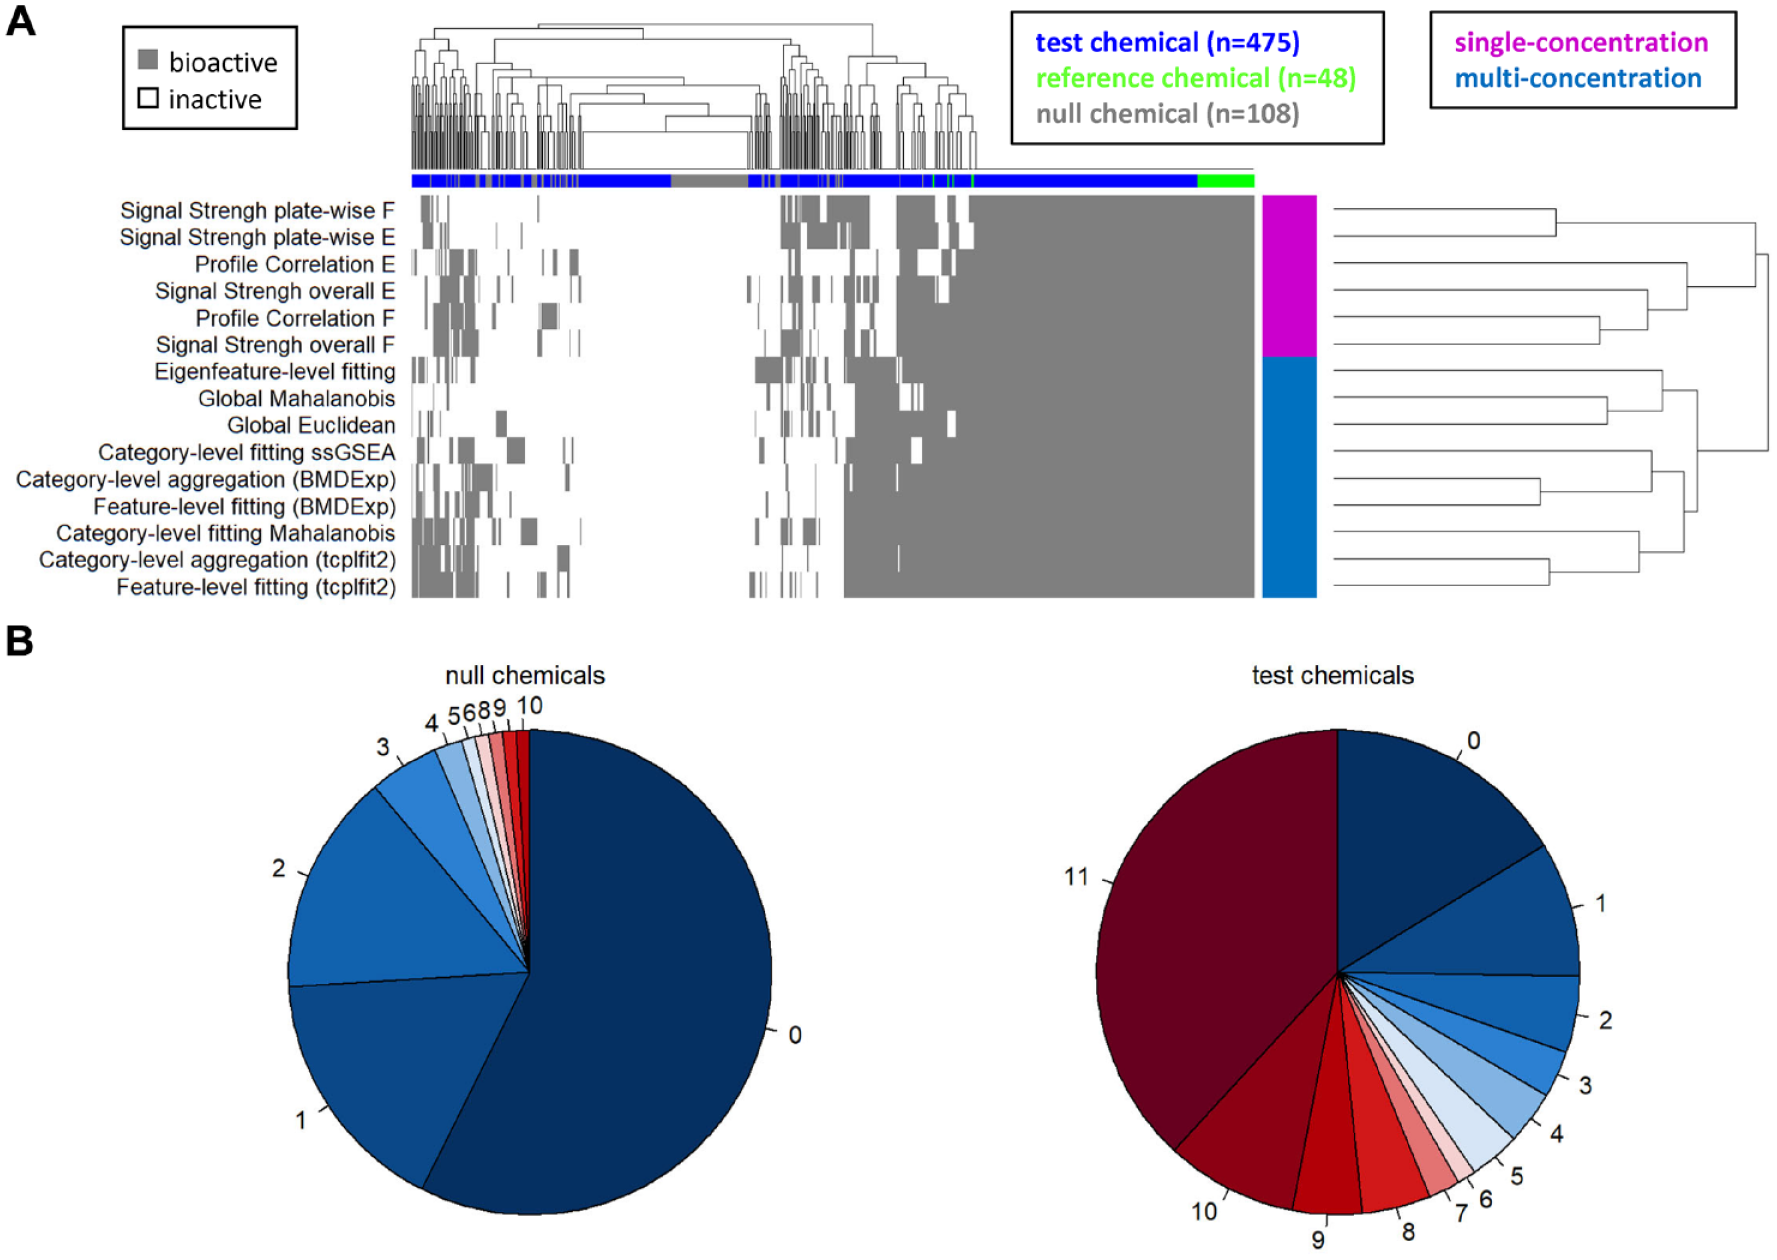
Concordance of hit calls across approaches. (
To quantify the concordance among approaches, only the 11 approaches with 100% TPR were considered. These approaches identified the four reference chemicals (berberine chloride, Ca-074-Me, etoposide, rapamycin) as bioactive in all 12 replicates. For the null chemicals, 57% (62/108) were inactive with all approaches, with an additional 30% (32/108) identified as active by only one or two approaches (
In contrast, 38% (181/475) of test chemicals were considered active with all approaches, and an additional 13% (64/475) were called as active by 9 or 10 of the approaches (
Concordance of Potency Estimates among Multiconcentration Approaches
One potential application of phenotypic profiling in regulatory toxicology is the derivation of potency estimates for perturbations of cellular biology from HTP data. For this purpose, limited detection of false actives is acceptable. However, avoiding false actives associated with highly potent estimates of bioactivity (i.e., those identified within the lower portion of the tested concentration range or below and associated with assay noise and not true biological activity) is desirable. Potency estimates such as these would not be an accurate representation of the biological activity of the chemical.
To evaluate these performance characteristics of the concentration-response modeling approaches, potency estimates (e.g., PAC) of reference chemical replicates were compared. While the true PAC is not known, previous analysis showed the reference chemical replicates yielded highly reproducible phenotypic profiles
26
; therefore, PACs of individual replicates should be similar. This was the case for most approaches, particularly for the two reference chemicals with broad phenotypic effects (etoposide, rapamycin;
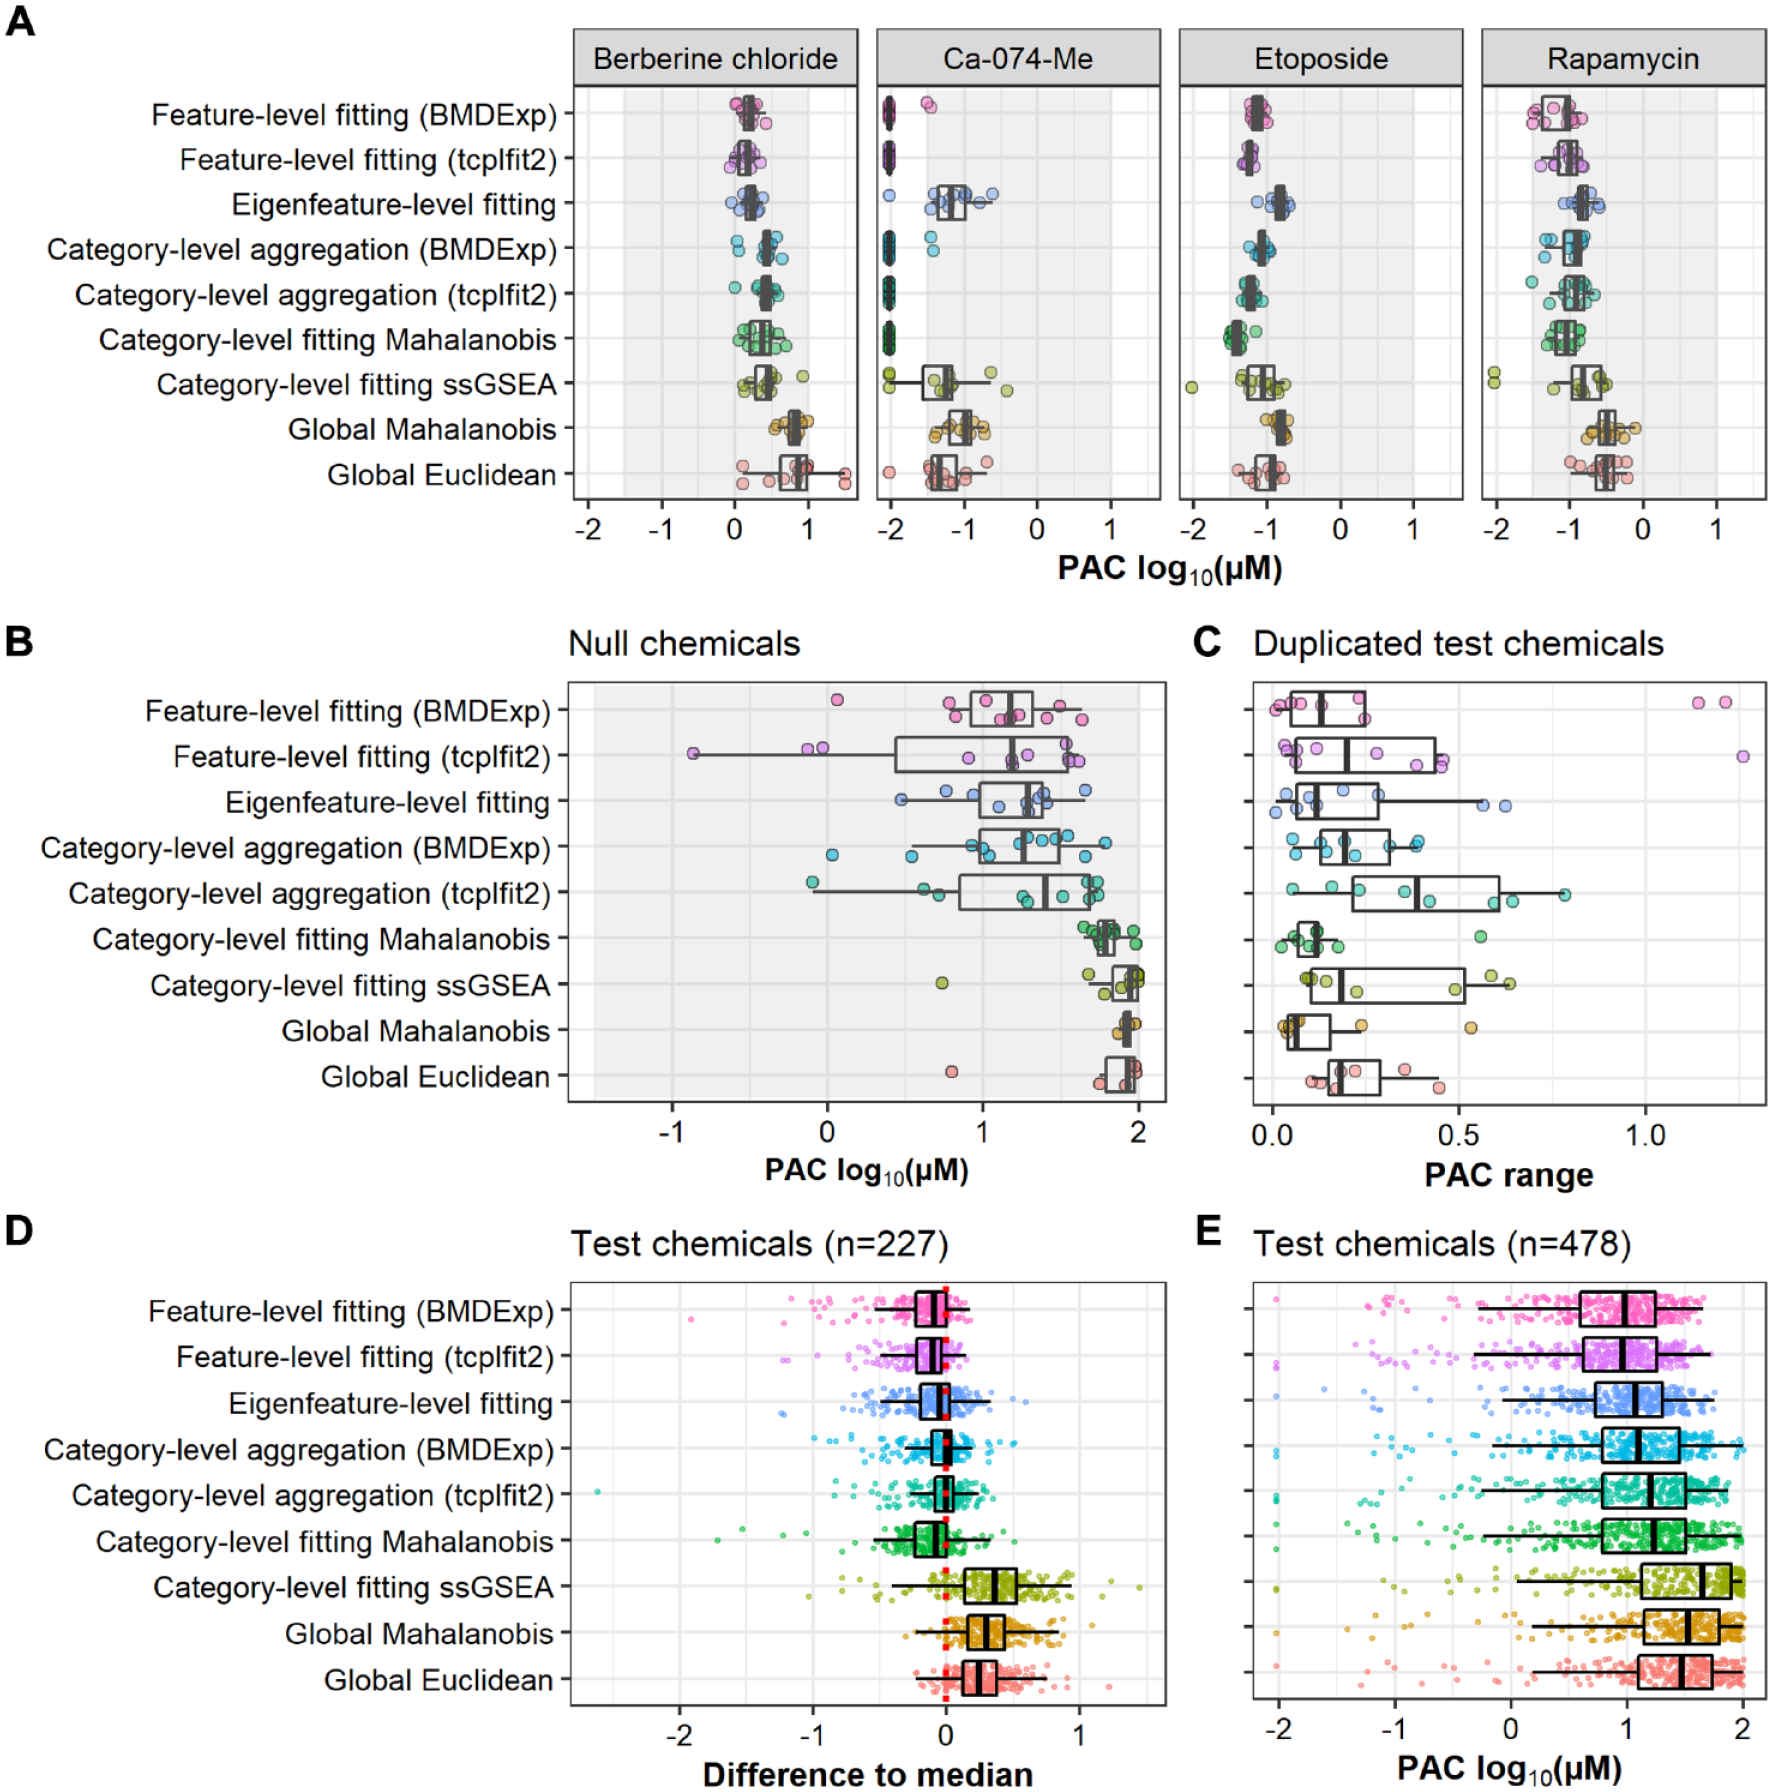
Concordance of potency estimates across multiconcentration approaches. (
We also compared the potency estimates from each method for null chemicals, which provides a model of false-positive hits. As described above, each method was optimized to achieve an FPR of ~10%. Thus, by definition, only a small subset of null chemicals was identified as active and subsequently assigned a PAC by each approach. However, comparing the distribution of PACs for known false-positives in each method provides an estimate of which methods are more prone to incorrectly calling bioactivity at higher potencies. We observed marked differences in the potencies estimated for null chemicals when comparing feature-level fitting and category-level aggregation approaches as compared with category-level and global fitting approaches: all feature-level and category-level aggregation approaches resulted in potency estimates well below the upper limit of the concentration range assigned to the null data set (i.e., 100 µM;
Another important performance metric for each method is the similarity of PACs for chemicals screened in duplicate. Specifically, we computed “PAC range” as the log-scale difference in PAC estimates from the same method, between each pair of duplicate chemicals. Ideally, the PACs of duplicate chemicals should be close together (low PAC range). This was the case for the two global approaches and for category-level fitting of Mahalanobis distance (
Lastly, potency estimates of test chemicals were compared across the approaches. As the true potencies were not known, we calculated the median potency across all approaches for test chemicals called as active by all nine methods. We then investigated how individual approaches performed relative to this median. Feature-level and eigenfeature-level fitting resulted in the lowest PACs (highest potency estimates) for most of these test chemicals, sometimes >1 order of magnitude below the median, followed by category-level fitting of Mahalanobis distance (
To summarize, feature-based approaches (feature-level fitting and category-level aggregation approaches) generally resulted in lower PACs but also produced a greater frequency of high-potency false active results.
Comparison of Bioactivity Profiles across Feature- and Category-Based Approaches
We also wanted to investigate whether the phenotypic features and feature categories identified as most sensitive for a given chemical were consistently identified using the multiconcentration modeling approaches. In this context, the most sensitive feature/category is defined as having the lowest potency estimate compared with other features/categories within a given method and is distinct from the calculation of TPR described above. For this purpose, we leveraged the reference chemicals that were tested in 12 replicates and whose qualitative effects have been described previously.6,26 Potency and effect size values for feature-level data were averaged across the 12 replicates and plotted (
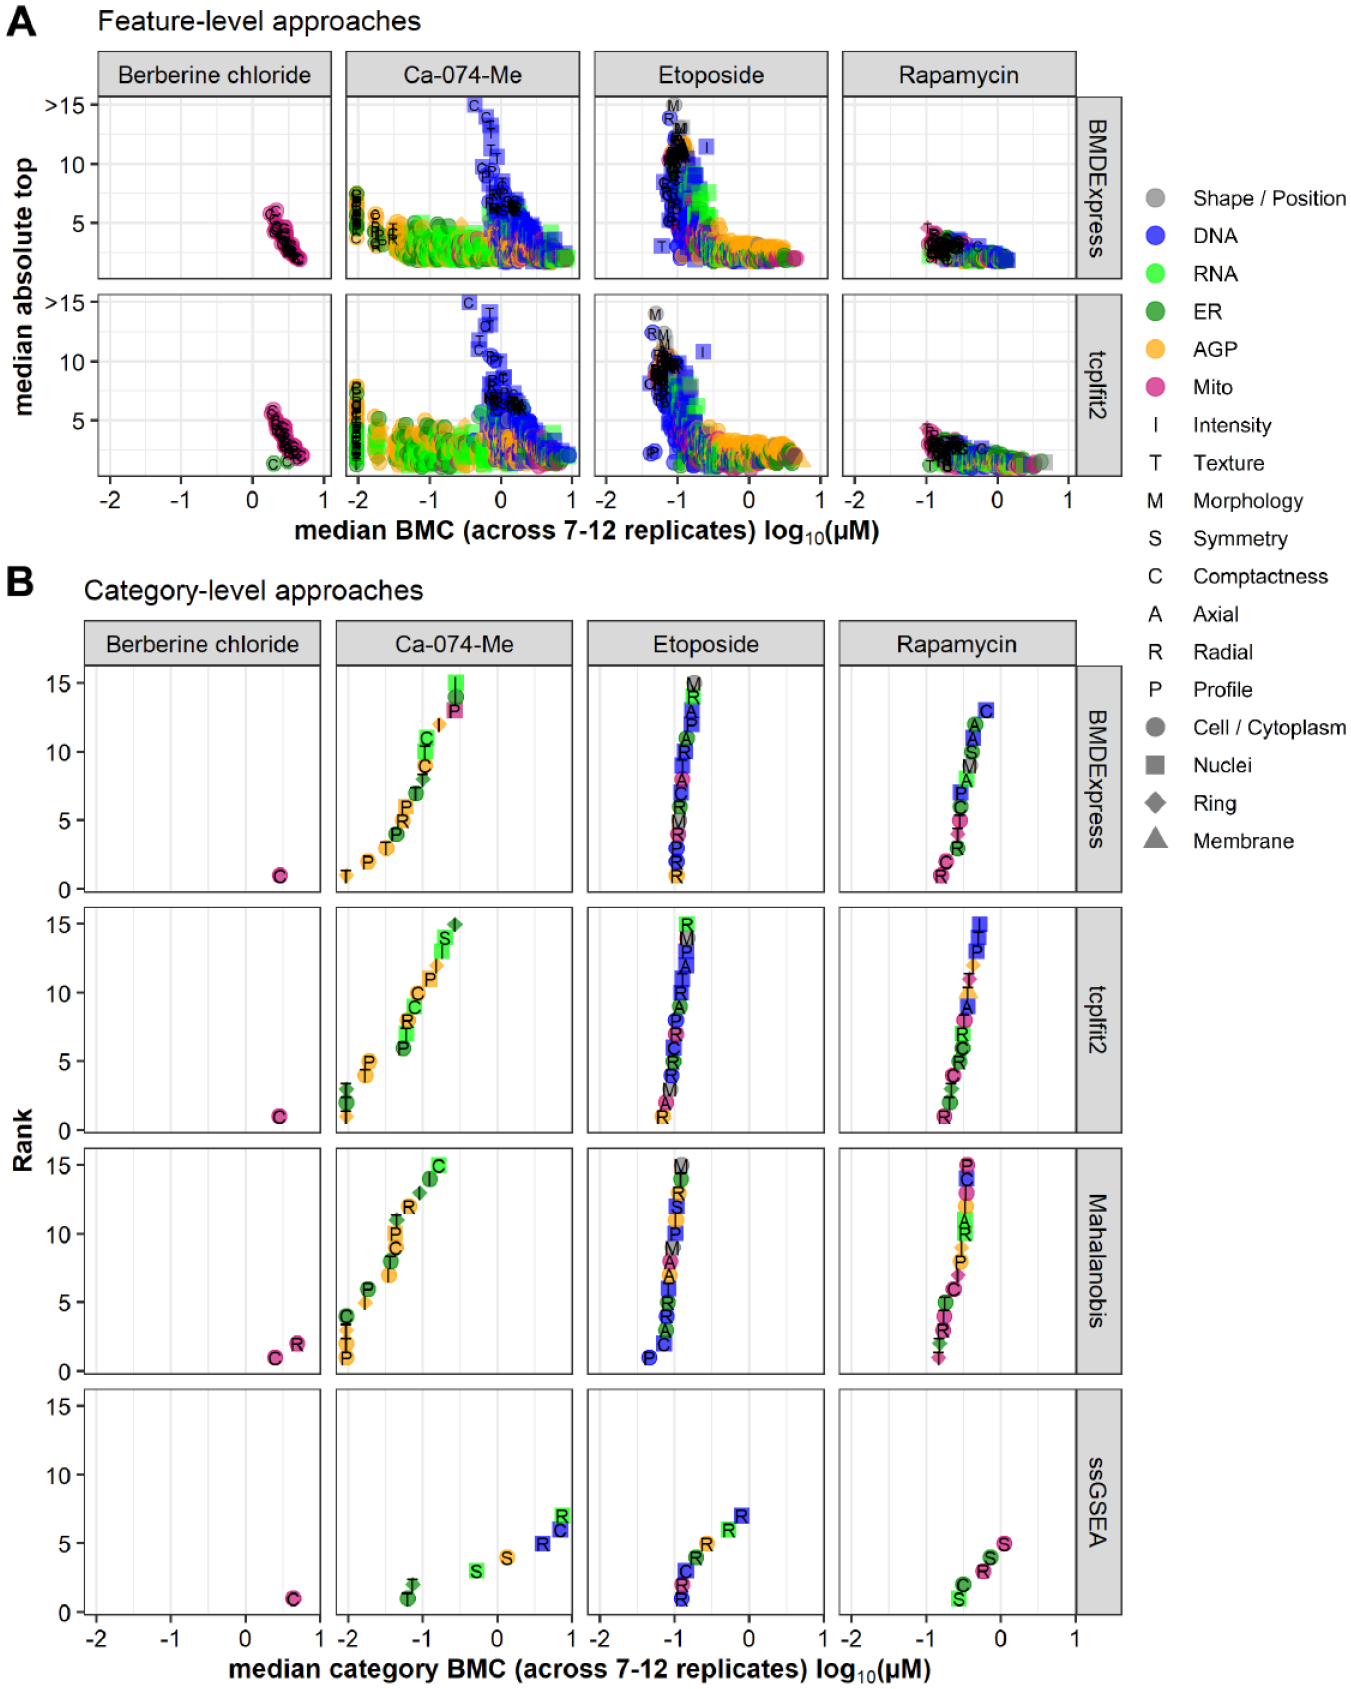
Comparison of bioactivity profiles across feature- and category-based approaches. (
Overall, fitting with BMDExpress and tcplfit2 resulted in very similar bioactivity profiles, both on the feature level (
Overall, the two curve-fitting software tools BMDExpress and tcplfit2 had good agreement, both on the feature level and with regard to category aggregation. Category-level Mahalanobis was comparable with the aforementioned approaches, whereas category-level ssGSEA yielded largely discordant results.
Discussion
HTP assays are becoming increasingly popular in the pharmaceutical and toxicological sciences for investigating the effects of chemicals or genetic manipulations on cellular biology. The high dimensionality of these assays makes hit identification in the context of HTS very challenging. In the regulatory science arena, it has been proposed that HTP assays can be used to rapidly screen chemicals for the purpose of hazard identification and identification of bioactive concentrations.9,12 However, at present, there are no widely accepted standard practices for identifying hits or potency estimates from imaging-based HTP assays. 15 The lack of standardized approaches for data analysis, including demonstration of reliable approaches for classification of chemicals as inactive or bioactive with some accompanying estimation of potency, represents a barrier to broader use of imaging-based HTP data for application to regulatory decision making. We previously screened a set of 462 environmental chemicals with the Cell Painting assay in U-2 OS cells. 26 In the previous study, we used feature-level fitting with BMDExpress followed by category-level aggregation to identify bioactive chemicals and determine PACs. However, we did not explore other approaches for data analysis and PAC determination. The previously implemented category-level aggregation approach used an empirical threshold of 30% of features being concentration responsive for a category to be considered active. One objective of the present study was to explore the use of category-based and global analysis approaches that were not dependent on this inflexible criteria for classifying chemicals as inactive or bioactive. In the present study, we analyzed the data set from Nyffeler et al. 26 with nine multiconcentration and six single-concentration approaches (including the previously implemented category-aggregation approach using the BMDExpress software package) and systematically compared hit concordance and potency estimates where applicable. For the present study, we optimized each approach in terms of FPR as determined using a null data set and TPR as determined using a subtle, but reproducible, phenotypic reference chemical. For the vast majority of test chemicals, there was good agreement among the different approaches, both in terms of hit calls and potency estimates. However, we did observe differences among the approaches, in particular with regard to consistency of potency estimates for chemicals screened in duplicate and the risk of identifying high-potency false actives. Based on the comparisons performed in this work, category-wise Mahalanobis distance calculation followed by curve fitting demonstrated the lowest variability in PACs determined from duplicate screening of chemicals and the lowest risk of identifying high-potency false active chemicals. Both of these performance characteristics are desirable for analysis of HTP data in the context of environmental chemical bioactivity screening and potential use in chemical safety assessment applications.
In the present study, we evaluated approaches with varying degrees of complexity that yield inactive versus bioactive hit calls (all approaches) and, for multiconcentration approaches, PACs based on calculation, aggregation, and/or ranking of feature-, category-, or global-level potency values (
We also evaluated other approaches used frequently in image-based profiling for discrimination of treatment from control samples, namely, Euclidean and Mahalanobis distance metrics.15,42 We had previously used the latter approach in a steroidogenesis screening assay that measures levels of 11 hormones (e.g., features) to calculate a single metric for discrimination of active and inactive environmental chemicals in a screening for prioritization context.30,31 The Mahalanobis distance–based approach requires dimensionality reduction, a process frequently implemented in imaging-based profiling studies,8,15 and accounts for covariance among features, a common property of imaging-based profiling data. Here, we used feature reduction with PCA to derive eigenfeatures that were then used to calculate Mahalanobis distances. Both Euclidean and Mahalanobis distances were computed globally (i.e., using all of the feature data). We then took the novel step of concentration-response modeling the global distance metrices (as well as the eigenfeatures used to derive the latter) using tcplfit2 to identify PACs. While an apparent advantage of the global-fitting approach was derivation of a single-response variable for hit determination and calculation of PACs, a decided disadvantage was the loss of biological or mechanistic interpretability; that is, it is unclear from the global modeling approaches which feature(s) or category(ies) are most sensitive to perturbation or driving the phenotypic response. We therefore implemented the Mahalanobis distance approach within the predefined phenotypic categories to maintain biological interpretability similar to the aforementioned category aggregation approaches while also accounting for correlations in similarly derived features. We adapted the ssGSEA approach from transcriptomics36,37 using the phenotypic categories as de facto gene sets and z-standardized responses in lieu of fold-changes; ssGSEA scores were also modeled using tcplfit2. The signal strength approach in this study is a modification of the global Euclidean distance for the single-concentration application and has been used in a different form by others. 7 Finally, we evaluated profile comparison approaches that have been used in both transcriptomics studies43–46 and image-based profiling, 15 although we repurposed the approach to measure the similarity of biological replicates of a single chemical. While the primary focus of our research is concentration-response screening, the profile comparison and signal strength approaches are appropriate for use in hit determination by researchers conducting single-concentration screening studies, a common practice used to reduce the resources required to screen large chemical libraries. Overall, the described suite of hit determination approaches have tradeoffs with regard to computational complexity, computing time, ease of biological interpretability, and provision of potency values that should be taken into account by researchers in the context of their particular research objectives.
The different approaches were compared by estimating FPR (from a null data set), TPR (from berberine chloride replicates), and concordance (from duplicated test chemicals). To compare the approaches in a consistent way, we first tuned each method to achieve a target FPR of 10% (
All of the approaches we evaluated had a comparable hit rate for test chemicals, between 50% and 70%. This was surprising, as these approaches were implemented using different levels of compressed data. For example, global fitting with the Mahalanobis approach worked surprisingly well, although the 1300 features were compressed to only one number (e.g., Mahalanobis distance) before curve fitting. Moreover, single-concentration approaches were able to identify a similar number of bioactive chemicals as compared with the multiconcentration approaches. Thus, if hit identification is the primary goal of a study (and not estimating potency), single-concentration screening might be sufficient for this purpose. However, it should also be noted that in the present study, we used information from multiconcentration cytotoxicity screening to choose the most informative (single) concentration to include in the analysis.
The hit rate of 50% to 70% was also substantially lower than the 95% hit rate reported in our previous analysis of these data. 26 The main explanation for this difference was the more stringent hit call thresholds implemented in the present analyses, which were optimized to an upper limit of 10% FPR. Specifically, for feature-level fitting and subsequent category-level aggregation of BMDExpress results, an additional effect size threshold (not used in the previous study) had to be introduced to reduce the FPR to 10% and led to an overall reduction in the percentage of chemicals identified as hits (i.e., excluding chemicals with nonefficacious changes in phenotypic features). From a practical perspective, calibrating the hit call threshold to a set FPR using the noise structure inherent to HTP data provides a means to identify bioactive chemicals with greater confidence, an important consideration when triaging chemicals for hit confirmation within a tiered toxicity testing strategy or for considering HTP data for use in chemical safety assessment.
Of note, fitting with tcplfit2 led to a slightly higher hit rate than fitting with BMDExpress using either feature-level fitting or category-level aggregation. In instances in which a chemical was identified as active using both approaches, the number of affected features and PACs was highly correlated (
The concordance of potency estimates for reference chemicals was high, indicating that for chemicals with a robust signal, most approaches provide equivalent results (
Category-level fitting of ssGSEA scores did not produce high-potency false actives in the null chemicals but had large variability in terms of potency estimates for chemicals screened in duplicate. In addition, comparison of bioactivity profiles across feature-level fitting, category-level aggregation or category-level fitting approaches demonstrated marked qualitative differences between biological responses identified by ssGSEA and any of the other approaches (
In this study, the null data set was constructed from data from the lowest two test concentrations used for chemical screening. As chemicals with activity at these concentrations were excluded, we are confident that the null data set is an appropriate surrogate for inactive chemicals. However, other strategies to build null data sets could be used. For example, for some applications, it might be desirable to randomly sample individual feature values independently, rather than randomly sample individual wells, as we have done here. Our current strategy was chosen to maintain the observed correlation among features in our profiling data and to provide a fair comparative basis for approaches that inherently account for this correlation. In addition, although we included some approaches that model a reduced feature set (eigenfeatures), we have not explored all of the feature reduction and feature selection strategies that have been proposed in the imaging-based profiling research community, including machine-learning–based approaches. 15 Because many features within imaging-based profiling data are inherently correlated, feature reduction could decrease the amount of data input into the analysis and equalize the weight of each feature. The benefit of feature reduction can be seen in the present study by comparing global fitting with Euclidean distance (all features) versus Mahalanobis distance (reduced feature set): global Mahalanobis had a higher TPR at the fixed FPR. We observed in preliminary work that the results of approaches based on eigenfeatures depend on the choice of input data to the PCA. More work is needed to find the optimal input data set, feature reduction method, and number of retained eigenfeatures.
For our purposes, the Cell Painting assay is envisioned as a first-tier bioactivity assay for environmental chemicals. 9 As with any other in vitro assay, a low FPR is desirable. However, from the perspective of human health protection, identification of false-positives is preferred over misclassification of true-positives as inactive, particularly when only positive hit calls will undergo follow-up testing. With these principles in mind, the present study was tailored for screening of environmental chemicals, under the hypothesis that many (but not all) environmental chemicals will have marginal bioactivity as evaluated using the Cell Painting assay or produce nonspecific (i.e., promiscuous) molecular effects in human cells. This is in sharp contrast to pharmaceutical screenings, in which the bioactivity of small molecules is desired and expected. In our study, approaches were optimized for high sensitivity and consequently accepted a relatively high FPR of 10%. Overall, using the described optimization criteria, we found that feature-based approaches were sensitive but had a higher risk of high-potency false actives and that category-based modeling with Mahalanobis distance had nearly as high a sensitivity but a lower risk for high-potency false actives. This category-level fitting approach also facilitates biological interpretation of the profiling data, a utility that is lacking using the global-fitting approaches. Although some of these findings described here might be specific to the chemical space examined and the optimization schema, the general framework of comparing different approaches to gain confidence in hit identification should be of broad interest to both the HTS and regulatory research communities. In particular, this analysis framework can be applied to ongoing applications of the Cell Painting assay to a broader range of human-derived in vitro models and screening a larger chemical space to calculate thresholds for chemical bioactivity and discern putative cellular mechanism of action for environmental chemicals.
Footnotes
Acknowledgements
The authors would like to thank Dr. Thomas Sheffield and Jason Brown for their work on tcplfit2. The authors would also like to thank Terri Fairley, Daniel Hallinger, and Sandra Roberts for operations support activities during the conduct of this research. Finally, the authors thank Drs. Grace Patlewicz, Scott Auerbach, Brian Chorley, and Maureen Gwinn for their insightful comments during review of this article and Richard E. Brockway for proofreading.
Supplemental material is available online with this article.
Authors’ Note
This article has been reviewed by the Center for Computational Toxicology and Exposure, Office of Research and Development, U.S. Environmental Protection Agency and approved for publication. Approval does not signify that the contents reflect the views of the Agency, nor does mention of trade names or commercial products constitute endorsement or recommendation for use.
Declaration of Conflicting Interests
The authors declared no potential conflicts of interest with respect to the research, authorship, and/or publication of this article.
Funding
The authors disclosed receipt of the following financial support for the research, authorship, and/or publication of this article: the USEPA through its Office of Research and Development provided funding for this research. J.N. and D.E.H. were supported by appointments to the Research Participation Program of the USEPA, Office of Research and Development, administered by the Oak Ridge Institute for Science and Education through an interagency agreement between the U.S. Department of Energy and the USEPA.