
Abstract
Funding pressure on the pharmaceutical industry to deliver new medicines to the market under aggressive timelines has led to a demand for analytical tools with higher detection sensitivity, increased throughput, and automation to speed up research and discovery efforts and converge upon clinically fit leads faster. In the quest for therapeutic antibodies, the early adoption of interaction analysis platforms utilizing surface plasmon resonance (SPR) detection provides insightful molecular-level information about the binding properties of antibody libraries that are key to understanding an antibody’s mechanism of action and can guide the library-to-leads triage. Here, we sought to compare the binding kinetics obtained on two state-of-the-art high-throughput SPR platforms in an independent study conducted by unrelated groups located on different continents. We show that when experiments were performed by skilled users adhering to SPR best practices and allowed freedom in their assay design, the two platforms yielded near-identical results, establishing them both as reliable tools in accelerating the characterization of antibody libraries in providing critical information needed to advance leads to the clinic.
Keywords
Introduction
Antibodies are providing transformative medicines in treating and preventing previously incurable diseases like cancer and autoimmune disease, due in part to their exquisite specificity, tunable affinity, and overall low toxicity compared with many other drug modalities. While antibodies continue to yield lucrative sales for the pharmaceutical industry, 1 it is estimated that it takes, on average, 12 years and 1 billion USD to progress a therapeutic antibody from the bench to the market, which increases the financial burden on patients and the healthcare system as drug manufacturers try to recoup their research and development costs. Indeed, a recent study reported that antibody therapies approved for the treatment of cancer and hematologic disorders cost around 100,000 USD per year of treatment more than antibody medicines for other diseases. 2 The approval success rate for antibodies entering the clinic is only 20%, with the highest attrition occurring upon transitioning from phase 2 to 3. 3 Clinical trials have been getting longer, in part motivated by the continued focus on unmet medical needs, including intractable diseases. Interestingly, while fast track-designated antibodies—about a third of all Food and Drug Administration-approved antibodies to date—have benefitted from expedited review initiatives, their development times are an average 1 year longer than those for non-fast track antibodies. Drug discovery is expensive, tedious, nonprescriptive, and fraught with failures, so any technique that speeds up research and cuts costs to ensure that only the most promising drugs enter the clinic and meet their rigorous standards is highly sought after.
Surface plasmon resonance (SPR) is an established analytical technique for characterizing biomolecular binding interactions in terms of their kinetics, affinity, and epitope specificity, which are key parameters in understanding a drug’s mechanism of action, a critical requirement for the success of any clinical program to increase safety and efficacy. SPR is a real-time and label-free phenomenon allowing for the detailed measurement of native molecules with lower sample consumption and higher throughput compared with many other biophysical methods. However, despite the emergence of different commercial SPR platforms with varying levels of automation, throughput, and detection sensitivity, and their widespread adoption in the pharmaceutical and biotechnology industries as core analytical tools, the quality and reliability of the results are often confounded by various practical factors, notably sample quality and the skill level of the user. The proper implementation of SPR requires adherence to some basic best practices, laid out 20 years ago in Myszka’s seminal paper, 4 which still provides fundamental guidance for improving biosensor analysis. Only when these practices are followed can one make a meaningful assessment of new technologies.
Here we sought to compare the binding kinetics obtained on two state-of-the-art high-throughput SPR platforms, the Biacore 8K (Cytiva, Marlborough, MA) and the Carterra LSA (Salt Lake City, UT), hereafter referred to simply as the 8K and LSA. To make for a fairer comparison of the technologies, we tasked two laboratories skilled in SPR best practices to perform a blinded study, where they were provided with the same reagents and allowed freedom in their assay design, other than mandated use of a standard temperature (25 °C) and run buffer (HBS-EP+).
Figure 1 shows a cartoon of the basic fluidic differences between the two biosensor platforms used in this study. The 8K injects samples from an eight-needle manifold that addresses eight parallel flow cells (channels), each with in-line referencing, under unidirectional flow, with samples exiting to waste. Injection volumes (of approximately 200 µL plus a dead volume of approximately <50 µL, depending upon the application) scale with the user-defined contact time and are limited by the size of the injection syringes.
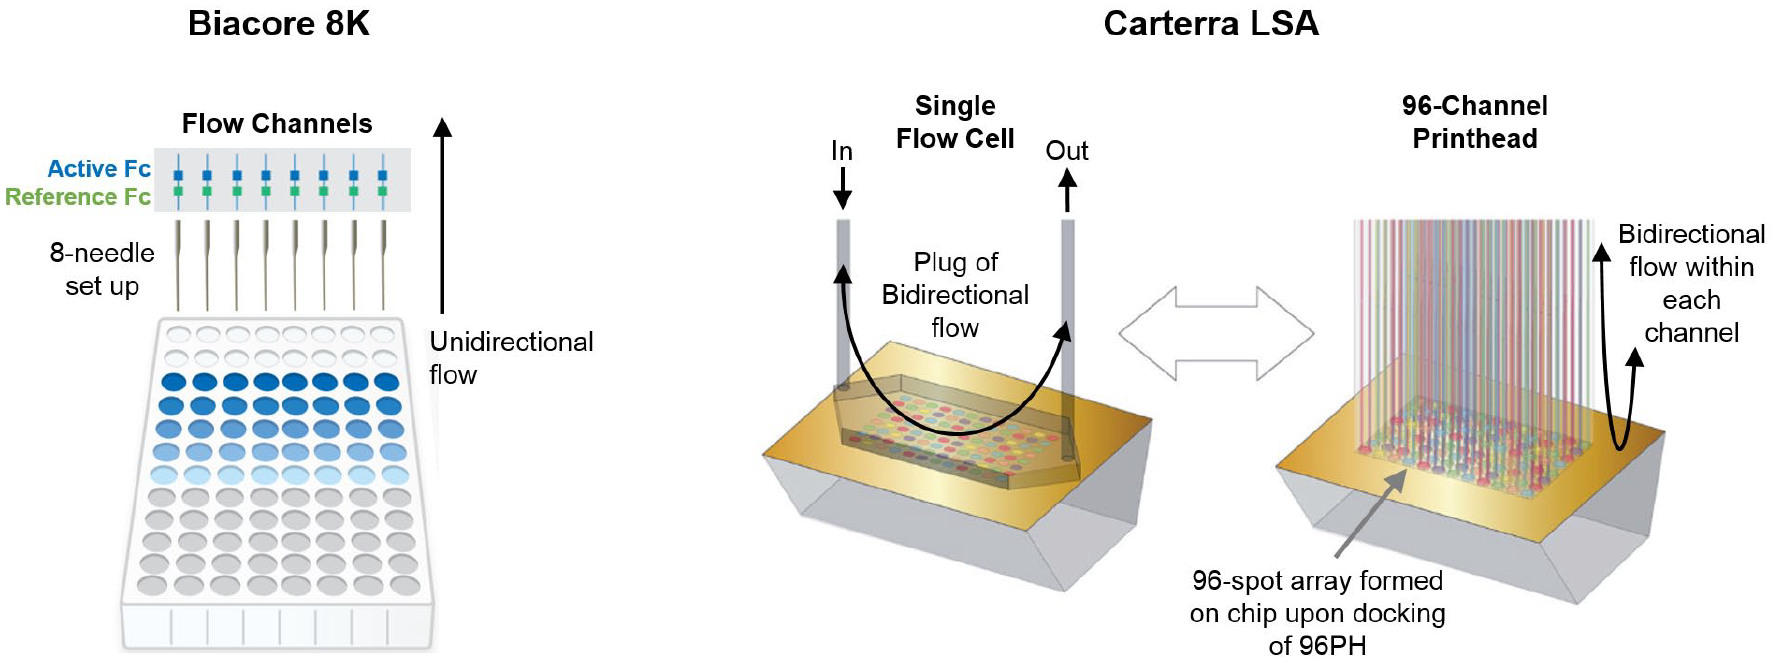
Basic fluidic setup of the Biacore 8K (left) and Carterra LSA (right). Adapted from the vendors’ websites, cytivalifesciences.com and carterra-bio.com.
The LSA uses two microfluidic modules, a single flow cell (SFC) and a 96-channel printhead (96PH), which can be docked onto the chip surface via a user-defined choreography. The chip accommodates either the SFC or the 96PH at any one time, but not both. Samples drawn through the SFC are injected from a single needle and pass across the entire chip surface and exit to waste. Samples drawn through the 96PH are injected from a 96-needle manifold and delivered to discrete spots on the chip surface via 96 parallel flow cells that contact the chip perpendicularly. Samples used in the 96PH are recovered to the print plate. The 96PH can be repositioned to address four areas (or print blocks) of the chip surface, allowing for the arraying of 96, 192, 288, and 384 spots. In contrast to the unidirectional flow employed in the 8K, the LSA draws a fixed injection volume (250 µL in the SFC or 200 µL in the 96PH, plus a dead volume of approximately 20–50 µL) and shuttles it as a sample plug in a bidirectional manner across the sensor surface for a user-defined contact time so that sample consumption does not scale with the allowed contact time. For additional details on the two platforms, the reader is referred to the specifications as published on the vendors’ websites (cytivalifesciences.com and carterra-bio.com).
In collaboration with Sanofi-Aventis Deutschland GmbH (Hessen, Germany), Antibody Analytics (Motherwell, Scotland) designed an assay setup on the 8K aimed at measuring the binding kinetics and affinity of their novel anti-CD3 epsilon (CD3-ε) antigen-binding fragment (FAb). The LSA experiments were performed in a blinded fashion at Carterra. The goal was to both compare the performances of the two technologies in terms of the determined kinetic and affinity values and characterize a panel of FAbs subjected to different stresses (freeze/thaw cycles, pH, etc.) for developability assessment.
Materials and Methods
All interaction analysis was performed at 25 °C in a run buffer of HBS-EP+ (10 mM HEPES, pH 7.4, 150 mM NaCl, 3 mM EDTA, 0.05% Tween-20) for Biacore 8K and HBS-EP+ supplemented with 0.5 g/L bovine serum albumin (BSA) for Carterra LSA. AviTag-biotinylated CD3-ε was purchased from ACROBiosystems, and Sanofi-Aventis Deutschland GmbH provided the anti-CD3-ε-purified recombinant FAb fragments. Glycine, pH 2.0 (8K) or pH 1.5 (LSA), was used as regeneration solution. Streptavidin was purchased from Jackson Laboratories.
Biacore 8K Kinetics
Streptavidin was immobilized to ~800 RU using standard amine coupling reagents 1-ethyl-3-(3-dimethylaminopropyl)carbodiimide (EDC) and N-hydroxysuccinimide (NHS) onto a Series S Sensor Chip CM5. Biotinylated CD3-ε (a heterodimeric protein comprising more than one binding site per molecule) was then captured onto the prepared surface to an initial level of 16 response units (RU), which was predicted to generate an interaction with maximum response (Rmax) of ~ 50 RU, but under experimental observation a capture level of ~60 RU was found to be optimal and produced a response with an Rmax of 50–100 RU. The CD3-ε-coated chip was preconditioned with glycine, pH 2.0 (used as regeneration solution), to stabilize the surfaces prior to injecting the analyte samples. The 2D kinetics functionality of the 8K was used to determine the optimum concentration series, and an initial analyte concentration range from 3 pM to 100 nM (nominal) of the reference FAb fragment was assessed. Analysis of 2D kinetics showed that a concentration series of 3.125–100 nM was most appropriate for further analysis. All analyte samples were prepared as triplicates in 1× HBS-EP+ run buffer.
FAb analytes were each prepared in this run buffer at nominal concentrations of 0, 3.125, 6.25, 12.5, 25, 50, and 100 nM and injected for 5 min, allowing a 30 min dissociation phase. Regeneration of the captured biotinylated CD3-ε was accomplished with glycine, pH 2.0 (1× 30 s pulses).
The data were processed and analyzed in Biacore Insight Evaluation Software using double-reference 4 subtraction of the data and then fitted to a simple Langmuir binding model using global kinetic rate constants for association (ka), dissociation (kd), and Rmax values per sample. Fit quality was determined by inspection of the residuals and of statistical T values and the equilibrium dissociation (or affinity) constant was deduced by the ratio of the kinetic rate constants, KD = kd/ka.
Carterra LSA Kinetics
Surface preparation involved amine-coupling streptavidin onto an HC-30M chip type as a “lawn” using the SFC followed by capture of titrating levels of biotinylated CD3-ε onto discrete spots using four serial dockings of the 96PH to produce a 384-ligand array. To produce the streptavidin lawn, the entire chip surface was activated with a freshly prepared mixture of 1:1:1 v/v/v 0.4 M EDC (Pierce) + 0.1 M sulfo-NHS (Pierce) + 0.1 M MES, pH 5.5 (Carterra), for 7 min, coupled with 50 µg/mL streptavidin in 10 mM sodium acetate, pH 4.25, for 10 min, and excess reactive esters were quenched with 1 M ethanolamine, pH 8.5, for 7 min, yielding final coupled streptavidin levels of 3338 ± 230 RU (mean ± standard deviation) across 384 spots. Biotinylated CD3-ε was then prepared as a 17-membered twofold series spanning concentrations from 76 pg/mL to 5 µg/mL in either pH 7.4 (HBS-EP+) or pH 4.5 (10 mM sodium acetate) buffer, to test their effect on preconcentration, and dispensed into duplicate wells of a 96-well plate, filling the remaining wells with buffer. The samples in this 96-ligand plate were captured onto individual spots of the chip in a single step via the 96PH, and by reprinting the samples three additional times to address all four print block locations on the chip surface, a 384-ligand array was generated, comprising 272-ligand coated spots and 112 blank spots, with each ligand concentration represented 16 times within the array (8 times each in HBS-EP+ and acetate buffers). Final captured levels spanned 1 to 1900 RU.
The LSA’s SFC was then primed with the interaction analysis run buffer of HBS-EP+ supplemented with 0.5 g/L BSA. FAb analytes (IDs 02–24) were each prepared in this run buffer at nominal concentrations of 0, 3.1, 12.5, 50, and 200 nM and injected for 5 min, allowing a 5 min dissociation phase. Regeneration of the immobilized biotinylated CD3-ε was accomplished with glycine, pH 1.5 (2× 20 s pulses). Some FAbs were injected in duplicate binding cycles to assess cycle-to-cycle reproducibility. The data were processed and analyzed in Carterra’s KIT software tool by interspot referencing and double referencing the data and then fitting them to a simple Langmuir binding model using global ka, kd, and Rmax values per spot. Fit quality was determined by inspection of the residuals.
Results
Both Biosensor Platforms Produce High-Quality Data
Both users chose to orient the assay using the FAb as monovalent analyte and the CD3-ε as ligand to avoid avidity effects. 4 Figure 2 shows an example of the data collected on the 8K using a single-cycle injection methodology and on the LSA using a multicycle injection mode for three Fab analytes with disparate binding affinities for the captured CD3-ε. Both instruments produced high-quality data that were well described by a simple Langmuir binding model, as judged by the near-perfect superposition of the measured and fitted data at each analyte concentration tested. Replicates were built into the 8K and LSA assays in different ways, as convenient to their respective sample handling configuration. On the 8K, each analyte titration series was injected in triplicate cycles and the data from all three curves were fit simultaneously, whereas on the LSA, the analyte injections were measured on a large number of varying-capacity ligand spots in parallel, and the mean and standard deviation of the kinetic rate and affinity constants were reported from a global kinetic analysis (global ka, kd, and Rmax) per spot.
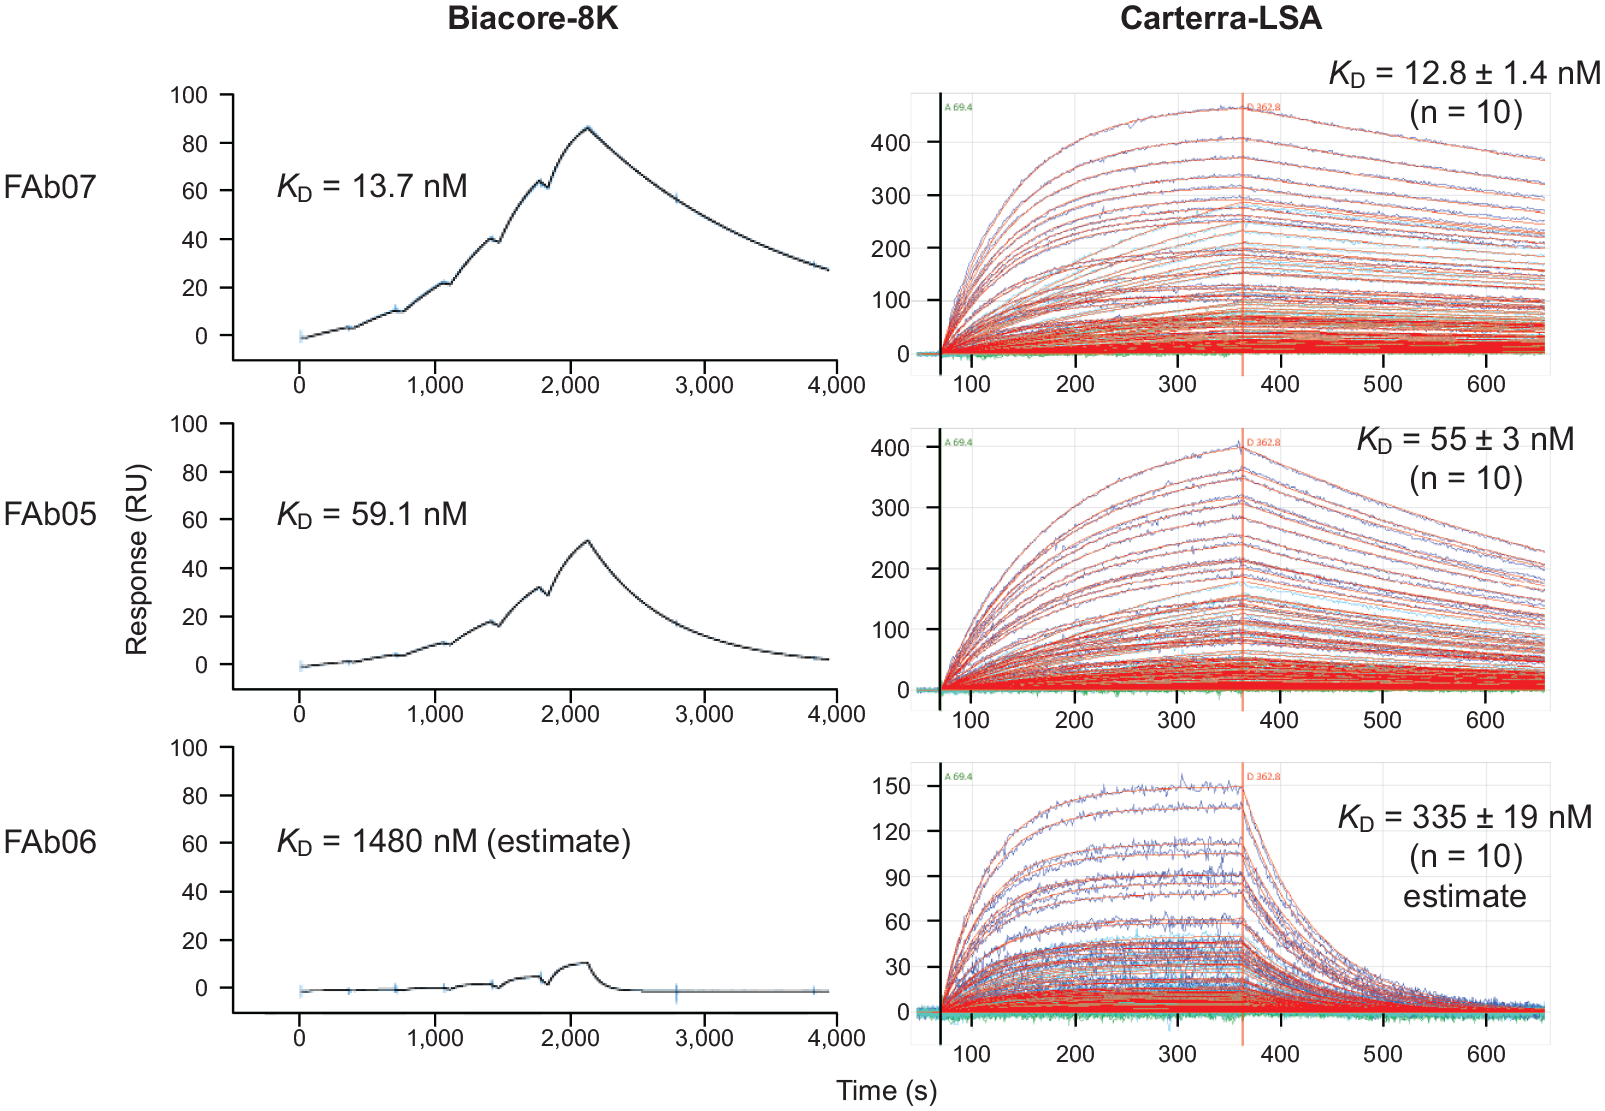
Examples of Fab analytes (FAb IDs 07, 05, and 06) with different kinetic profiles binding to immobilized CD3-ε (ligand) as measured by (
Choosing an appropriate ligand capacity on each platform was determined empirically by exploring a range of immobilized levels. In this aspect, the LSA’s expanded ligand capacity was advantageous, enabling a broad range of ligand levels to be tested in parallel, by capturing a titration series of biotinylated CD3-ε in immobilization buffers of different pH values onto different spots. This scouting approach essentially incorporated optimization into the assay by filling out the 384-ligand array with a wide range of ligand densities, some producing capacities that were too high and others that were too low. Optimum capacity spots were judged by those giving low and randomly scattered residuals as shown in Figure 3 . Empirically, these were produced from biotinylated CD3-ε captures at 0.01–0.6 µg/mL in either immobilization buffer tested.
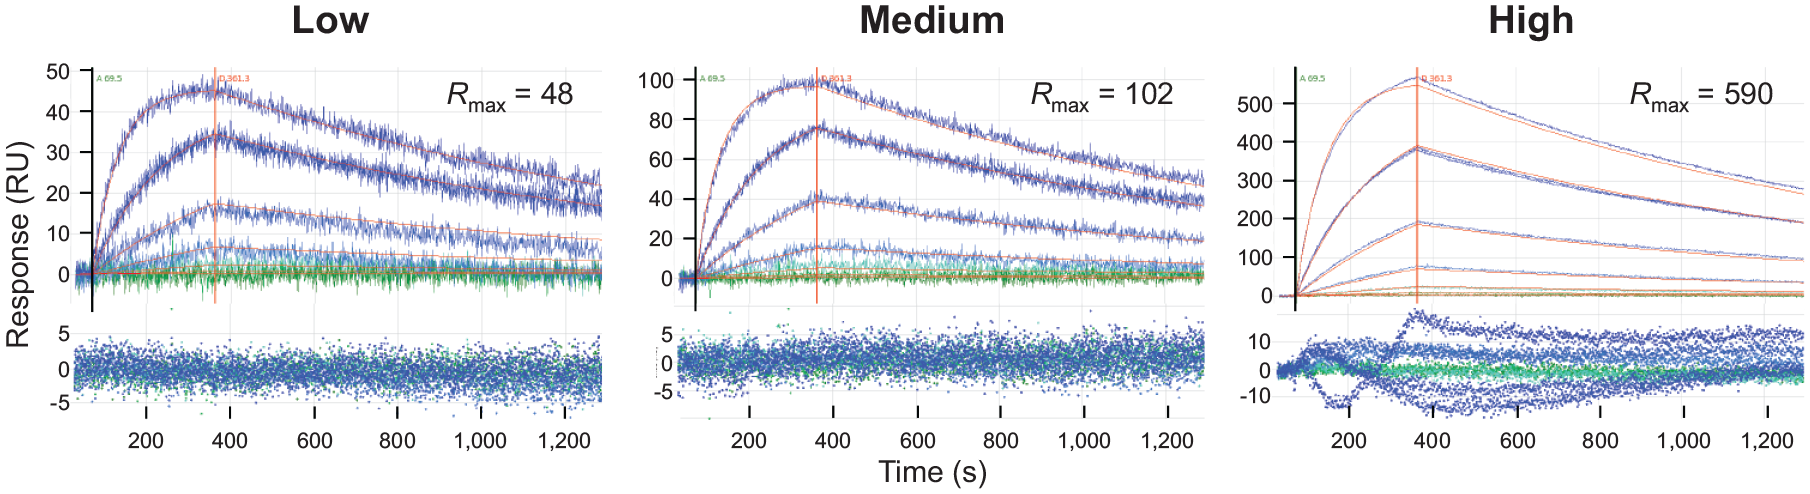
Scouting ligand capacity on the LSA. Optimum capacity spots were judged by fits that yielded low residuals randomly scattered about the baseline (as shown by the low- and medium-capacity spots). High-capacity spots were excluded from the analysis because of their deviant residuals. This example shows global fits for FAb02 titrated as a threefold series from 0.4 to 300 nM over low-, medium-, and high-capacity spots. The measured data are colored by a green-blue palette (in ascending analyte concentration) with simulated fits in red. For color figures, please see the article online.
The 8K and LSA Produce Near-Identical Kinetic Rate and Affinity Constants for Most Interactions Tested
Figure 4 compares the kinetic rate and affinity constants produced on the LSA when benchmarked against the 8K, shown as scatterplots. All 23 Fabs tested gave kd values that varied less than 2-fold across platforms, with kd values varying 0.65- to 1.33-fold. For 20 of these FAbs, the ka values also showed closer than 2-fold agreement across platforms, with ka values varying 0.66- to 1.57-fold, giving concomitant affinities varying only 0.70- to 1.57-fold across platforms. The three outliers were weak-affinity FAbs that were more accurately estimated by the LSA due to the use of a higher analyte concentration (300 nM) than on the 8K (100 nM). The validity of these affinity estimates can be assessed by noting the ratio of the fitted Rmax compared with the highest binding response recorded. Generally, Rmax values that exceed twofold the highest binding responses recorded are questionable because there are insufficient data to define the value properly, so it is extrapolated. For the LSA, this ratio was around 2, whereas for the 8K this ratio was over an order of magnitude (ratios of 16, 19, and 49 for FAb IDs 06, 14, and 22, respectively), resulting in the 8K underestimating the ka and therefore overestimating the KD values (affinity constants) of these weak binders. This discrepancy was due to user design where a concentration series optimized against a reference standard (100 nM) was used and is not an intrinsic flaw in the technology. The next step in a typical workflow if the goal was to more precisely resolve their affinities would be to repeat the analysis of these FAbs using a much higher analyte concentration (e.g., starting at 1 µM), but that was beyond the scope of this head-to-head technology comparison.
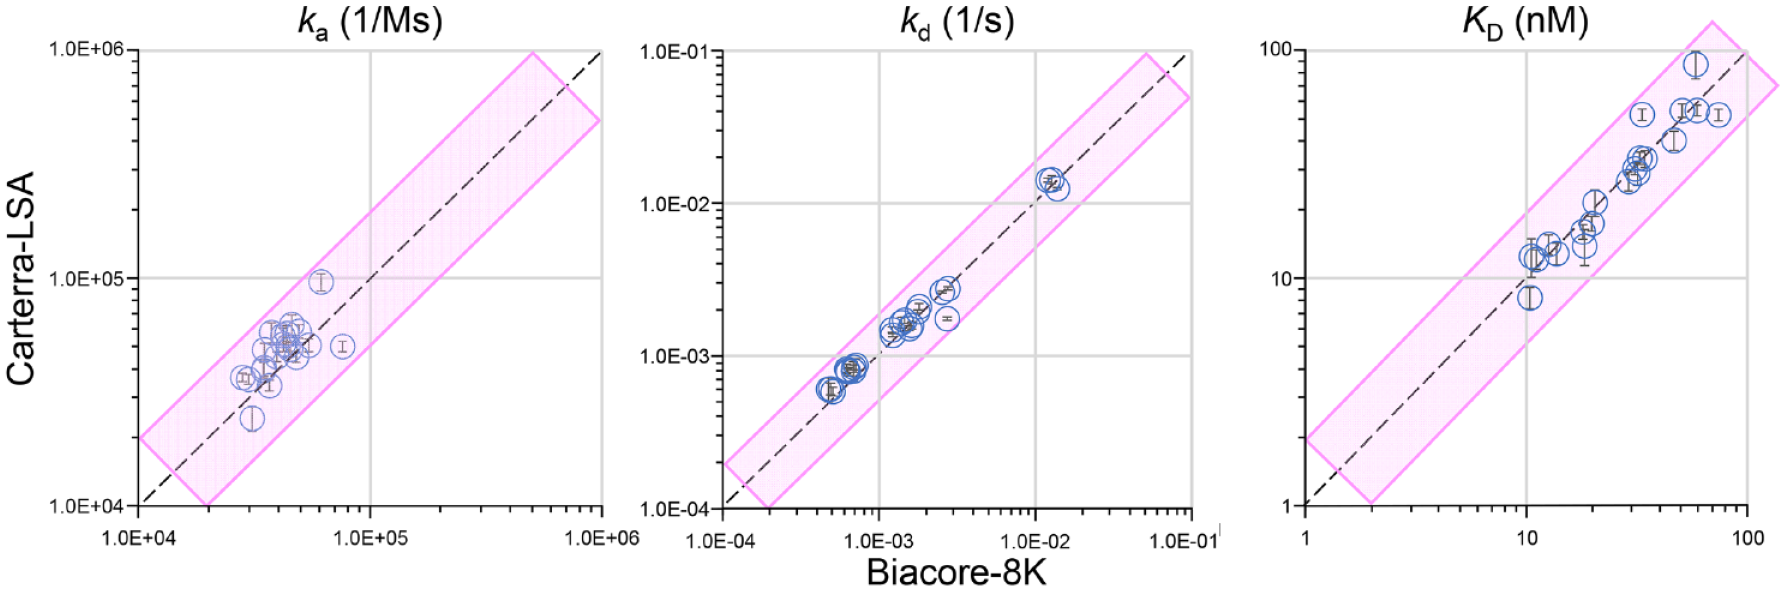
Scatterplots comparing the binding kinetic rate and affinity constants obtained on the 8K (X axis) and the LSA (Y axis) for a panel of 23 FAb analytes binding to immobilized biotinylated CD3-ε. The diagonal dotted line shows a perfect correlation, and the pink shaded box shows a twofold variance. The 8K measurements are single global fits for triplicate binding cycles per Fab, whereas LSA measurements are the mean ± standard deviation (Y error bars) of global fits from a single-analyte series on 10 spots per FAb. Three outliers (weak-affinity Fabs) are excluded from the ka and KD plots.
Figure 5 shows a histogram plot of the affinity-ranked FAbs by their 8K data compared with their respective LSA data, and Table 1 summarizes these data. Note that the LSA affinities were reported with statistical confidence (mean ± standard deviation of multiple spots), whereas the 8K data are reported as single measurements (from triplicate assessments). Overall, 20 of the 23 studied FAbs gave affinities that were within 1.5-fold of one another when compared across platforms. The three weak-affinity FAbs were correctly identified by both platforms, but more accurately estimated by the LSA due to the use of a higher analyte concentration, which was a user-influenced parameter and not an instrument limitation.
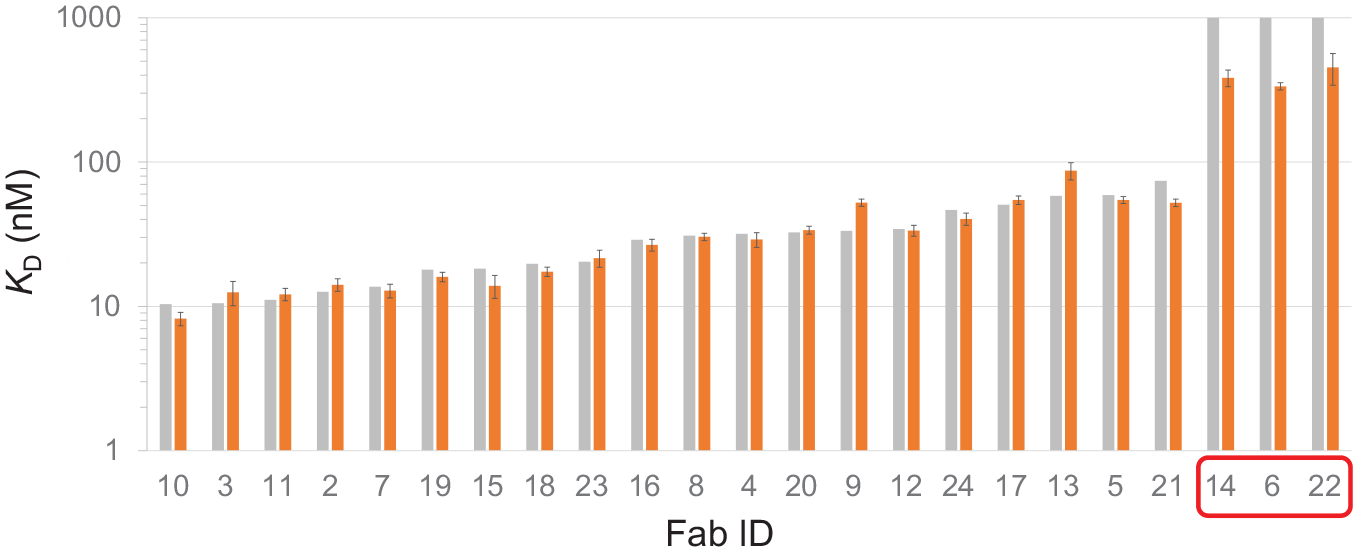
Affinity-ranked FAbs by their 8K (gray) data alongside their LSA (orange) comparator data. The 8K measurements are from global fits of triplicate analyte injections on a single surface, whereas LSA measurements are the mean ± standard deviation (Y error bars) of global fits from a single-analyte series on 10 spots per FAb. The KD values of the weakest affinity FAbs (14, 6, and 22, indicated by the red box) were poorly estimated by the 8K (KD > 1 µM) due to the use of insufficient analyte concentration (top of 100 nM), resulting in grossly extrapolated Rmax values (>18× the highest binding response observed). For color figures, please see the article online.
Technology Comparison of the Affinities (KD values) Produced by Biacore 8K and Carterra LSA for a Panel of FAb Analytes Binding to Immobilized CD3-ε. FAb IDs are Colored by Their Affinity-Ranked Position Within a Platform; Rank Order 1-5 (green), 6-15 (yellow), and 16-23 (red).
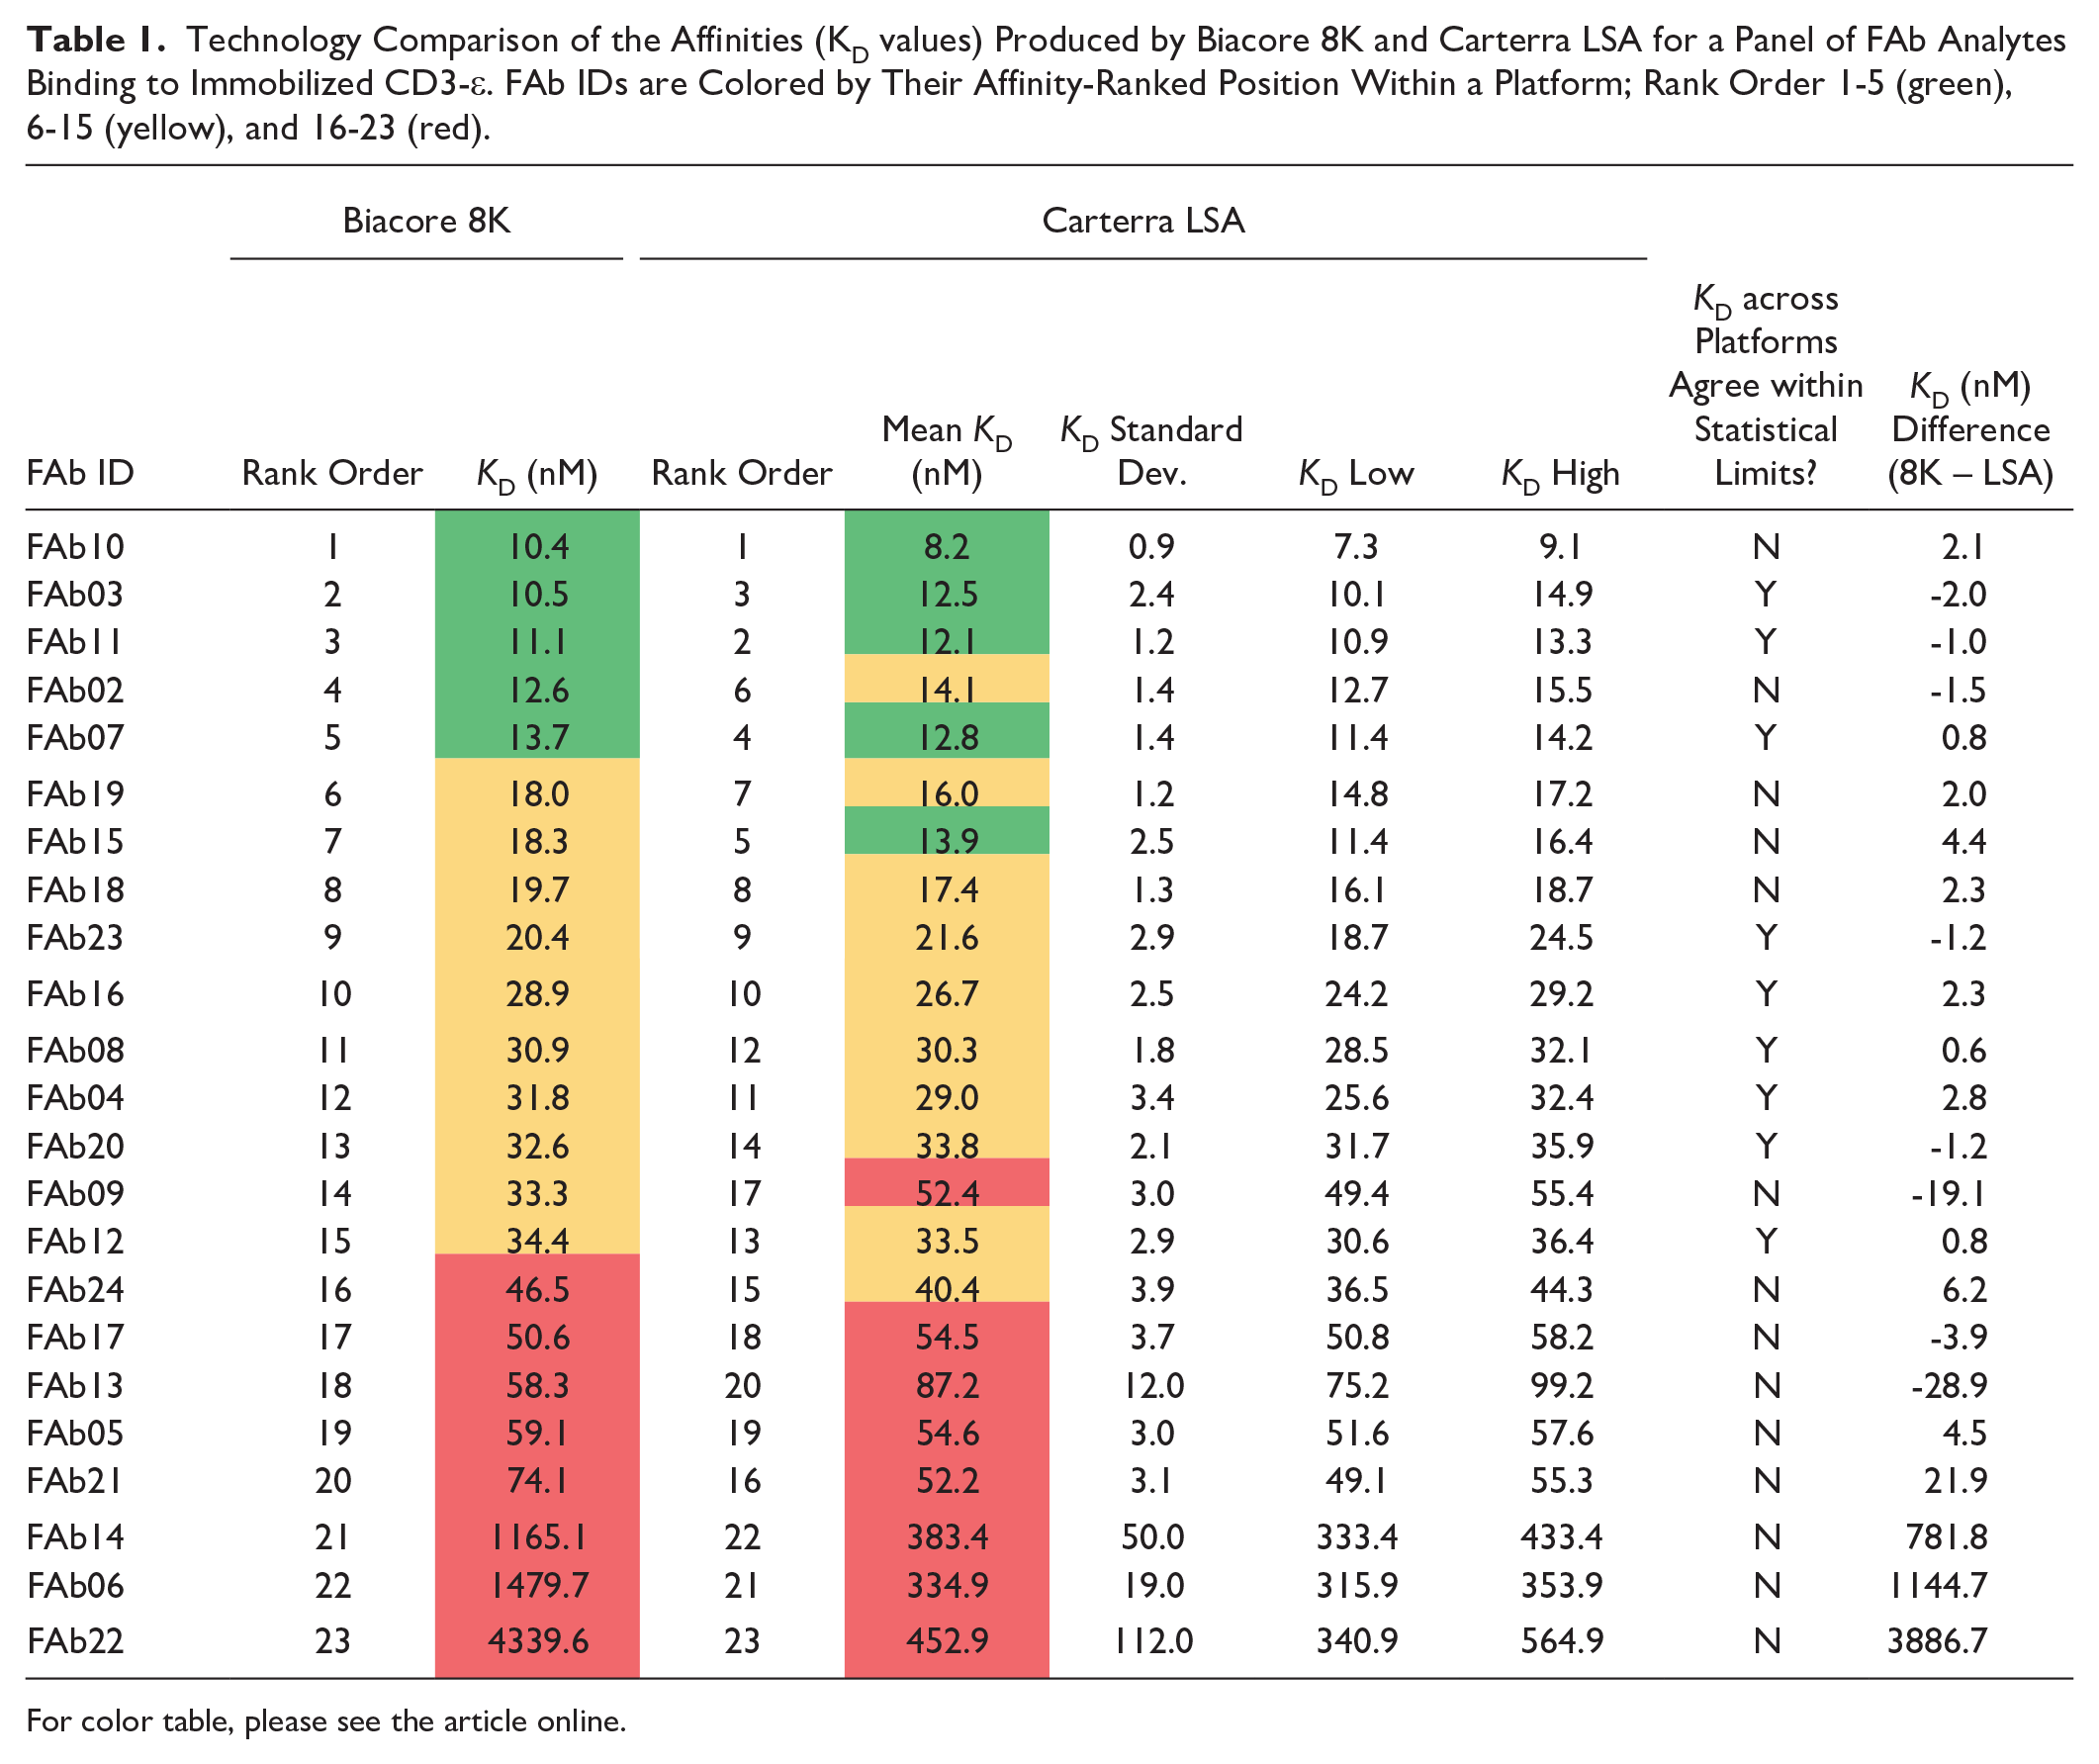
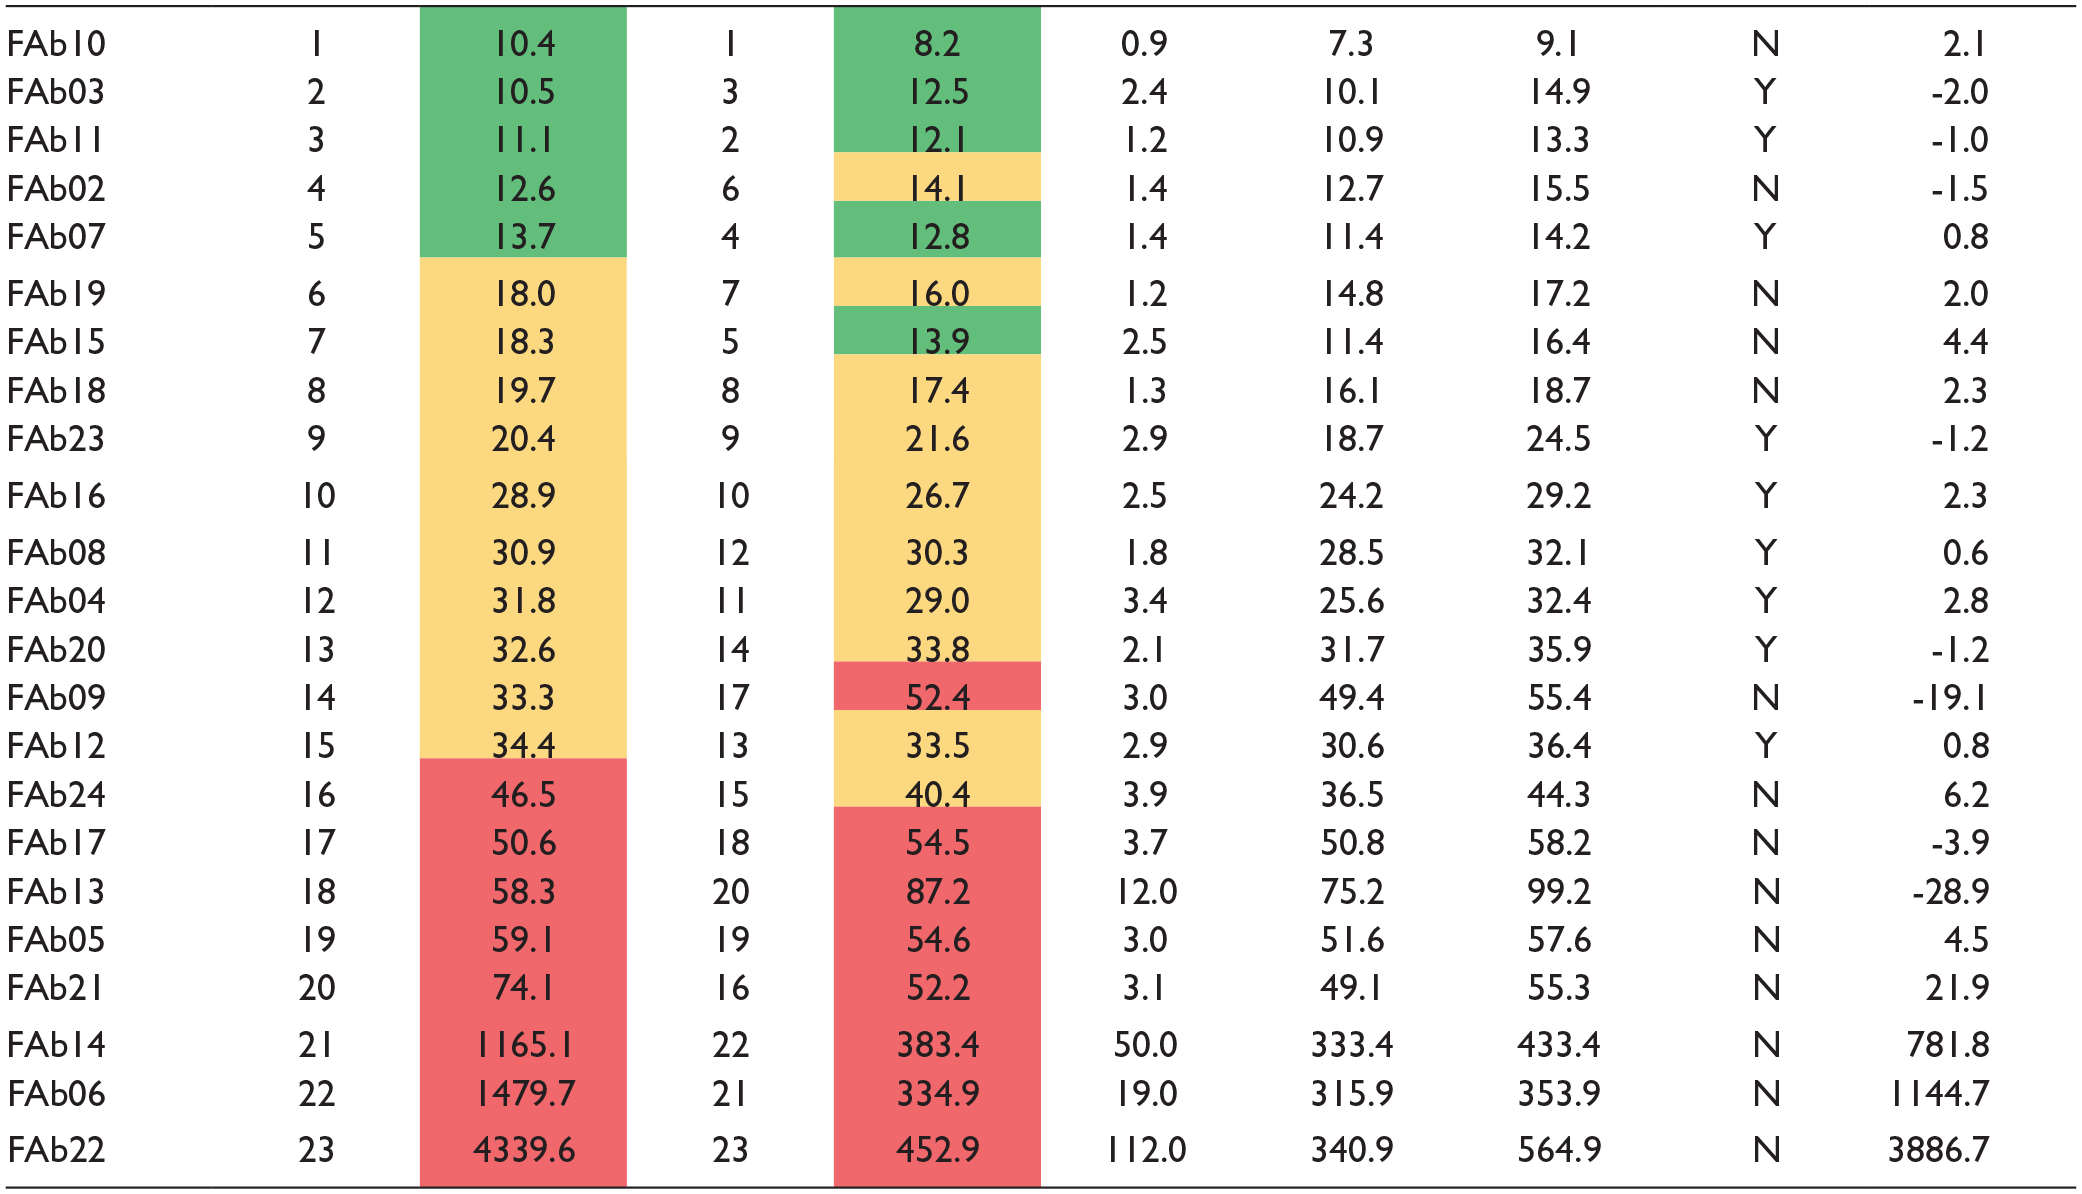
For color table, please see the article online.
Despite the experiments being performed on different chip types (CM5 for 8K and HC-30M for LSA), this did not appear to produce a significant difference in the apparent kinetic rate constants obtained across the technologies. A recent study reported that 3D hydrogels systematically produce slower apparent on-rates (ka values) than those on planar chips. 5 HC-30M is nearly planar as it is composed of short-hair (30 nm) unbranched polycarboxylate, compared with the Biacore CM5 chip, which is a complex branched carboxymethyl 3D hydrogel with a height of approximately 200 nm. Any differences between the two chip types were likely minimal in this study because the on-rates of the FAb interactions were relatively slow (<1 × 10⁵ M−1 s−1), as chip type becomes more of a differentiator for binding interactions with fast on-rates that approach mass transport limitation.
Each Platform Offers Unique Benefits
The array format of the LSA offers throughput and sample consumption advantages, whereas the 8K offers flexibility in assay setup, higher detection sensitivity, and reproducibility.
The ability to explore a wide range of ligand-loading capacities is a key advantage of the LSA, due to its expanded array capacity, enabling the simultaneous analysis of up to 384 ligands per chip. Arraying 384 ligands in batches of 96 took approximately 2.5 h using a print contact time of 5 min per print block and overhead time for wash steps and mechanical homing in between the docking steps. This contrasted the 8K’s parallel channel configuration, which limits the total number of covalently immobilized ligands to eight per chip, but since the flow cells are defined and fixed upon docking the chip, the immobilization was not slowed down by the accumulated overhead from the mechanical flow cell switching of the LSA (SFC to 96PH and from multiply docking/undocking the 96PH to address different print block locations in generating high-order arrays).
Low sample consumption is highly appealing in early-stage research where samples are numerous but each is available in precious quantity. In this regard, the LSA was advantageous because of various sample delivery factors. First, its automated choreography between two microfluidic modules (96PH and SFC) enable a “one-on-many” “analyte-on-ligand” assay format when the 96PH is used to batch-immobilize ligands and the SFC is used to deliver analyte across them. Second, both the 96PH and SFC cycle samples quickly (up to 2 mL/min) in a back-and-forth cycling manner using a fixed volume such that the volume of sample required neither scales nor is limited by the user-defined contact time. Third, the samples delivered through the 96PH are recovered to the plate, allowing their reuse within the same assay or in other assays. In contrast, the 8K’s parallel channel configuration meant that a separate analyte sample was delivered per ligand channel, significantly increasing the assay’s volume requirements. Additionally, the use of unidirectional flow means that the sample volume on the 8K depends upon the specified contact time and flow rate. In the current study, we used an analyte contact time of 300 s at 30 µL/min, which required approximately 200 µL per injection, inclusive of dead volume. Therefore, the total volume required to inject analyte over 384 ligands would have been approximately 50× that on the LSA. To offset this large consumption, a typical analyte titration series on the 8K would comprise either fewer or lower concentrations than on the LSA, where analyte consumption is not limiting. Doing so can affect the dynamic range of the assay.
In terms of data analysis, both SPR platforms have automated software tools to easily generate the fitted kinetic rate and affinity constants and flag outliers that do not satisfy quality criteria for fitting. An important consideration that was beyond the scope of this study was the uptake of these platforms to mainstream users that may not be expert in the application of SPR. In this case, hardware and software reliability issues and ease of use become critical decision factors in choosing one biosensor over another in an industry setting. The current study was also limited to a single application, essentially a “many-on-one” analyte-on-ligand assay format that did not take full advantage of the LSA’s expanded ligand capacity that is well suited to one-on-many screening of a small panel of analytes over hundreds of ligands. The LSA’s array format lends itself to high-throughput epitope binning, which is particularly useful in the early triage of antibody libraries. In contrast, a key advantage of the 8K is its exceptionally low noise, positioning it as an excellent analytical tool for small-molecule analysis where binding signals may be only a few RUs, which is not within the specifications of the LSA.
With the repertoire of commercially available biosensors, the value of benchmark studies cannot be understated as an unbiased way of evaluating the performance of emerging platforms against established ones. Indeed, Myszka et al. initiated a series of biosensor benchmark studies, with the first aimed at evaluating the variability in results when 29 independent participants were asked to follow a detailed experimental protocol on their Biacore platform (2000, 3000, or S51 systems) to generate a total of 60 data sets on a small-molecule application. 6 That study (and others) also aimed to compare affinity determinations produced by solution and surface methods. 7 Other benchmark studies engaged many participants using various SPR biosensor platforms without mandating experimental protocols8–12 to assess overall the performance of the scientific community to produce reliable affinity measurements with minimal experimental guidance.
Biacore has earned the reputation of the SPR gold standard in terms of data quality for biomolecular interaction analysis but has limited throughput. Here we showed that, when experiments are performed with care following some basic “best practices,” the LSA produced equivalent kinetic and affinity measurements as those on the 8K, and offered significant throughput, speed, and minimal sample consumption advantages, poising it as a bonified commercial competitor in the SPR antibody screening and characterization space.
Supplemental Material
Supplemental_Table – Supplemental material for Direct Comparison of Label-Free Biosensor Binding Kinetics Obtained on the Biacore 8K and the Carterra LSA
Supplemental material, Supplemental_Table for Direct Comparison of Label-Free Biosensor Binding Kinetics Obtained on the Biacore 8K and the Carterra LSA by Stuart Knowling1, Jennifer Clark, Hanno Sjuts and Yasmina Noubia Abdiche in SLAS Discovery
Footnotes
Supplemental material is available online with this article.
Declaration of Conflicting Interests
The authors declared the potential conflicts of interest with respect to the research, authorship, and/or publication of this article: S.K. and Y.N.A. were employed at Antibody Analytics and Carterra, respectively, at the time the work was performed.
Funding
The authors received no financial support for the research, authorship, and/or publication of this article.
References
Supplementary Material
Please find the following supplemental material available below.
For Open Access articles published under a Creative Commons License, all supplemental material carries the same license as the article it is associated with.
For non-Open Access articles published, all supplemental material carries a non-exclusive license, and permission requests for re-use of supplemental material or any part of supplemental material shall be sent directly to the copyright owner as specified in the copyright notice associated with the article.