
Abstract
An important aspect to understand about an experimental molecule in drug discovery is its stability in solution. A compound that degrades might be eliciting its apparent effect via a degradation product, so it is important to understand the solution stability profile of a compound early on in the drug discovery process. Improvements and application of a streamlined, higher-throughput method for testing solution stability to support drug discovery are described. Mass spectrometry detection has been incorporated into the screen to allow for the identification of degradation products. The amount of compound needed for the assay has been significantly reduced using 10 mM DMSO solutions instead of solid material. The buffers used in the screen provide the stability-pH profile of compounds with additional variations to assess liabilities under oxidizing and reducing conditions. In this article, we discuss the method development, screen validation, guidelines for result interpretation, and results for a set of marketed drugs to illustrate the application of the screen.
Keywords
Introduction
The stability of experimental molecules in solution can have a significant impact on the interpretation of biochemical data and the progression of compounds in drug discovery at all stages of the process. In the early stages of hit identification and lead optimization, some compounds or their degradation products can be reactive, leading to false positives in biological screening or indeed activity in multiple screens (so-called pan-assay interfering nuisance substances [PAINS] 1 ). A molecule also needs to be stable during handling and in formulations 2 to ensure compound fidelity and maximize the chance of securing good in vivo exposure with reproducible and interpretable results. Thus, it is important to be able to screen for stability in solution at an early stage, ideally from small quantities of compound in the era of solution-only collections. Automated methods to measure solution stability and their applications in early drug discovery and development have previously been described in the literature,3,4 using the advantages of high-performance liquid chromatography (HPLC) autosamplers. This article outlines a new, higher-throughput, automated method for measuring solution stability, validated and benchmarked versus current standards, with some illustrative examples of its applications in support of drug discovery.
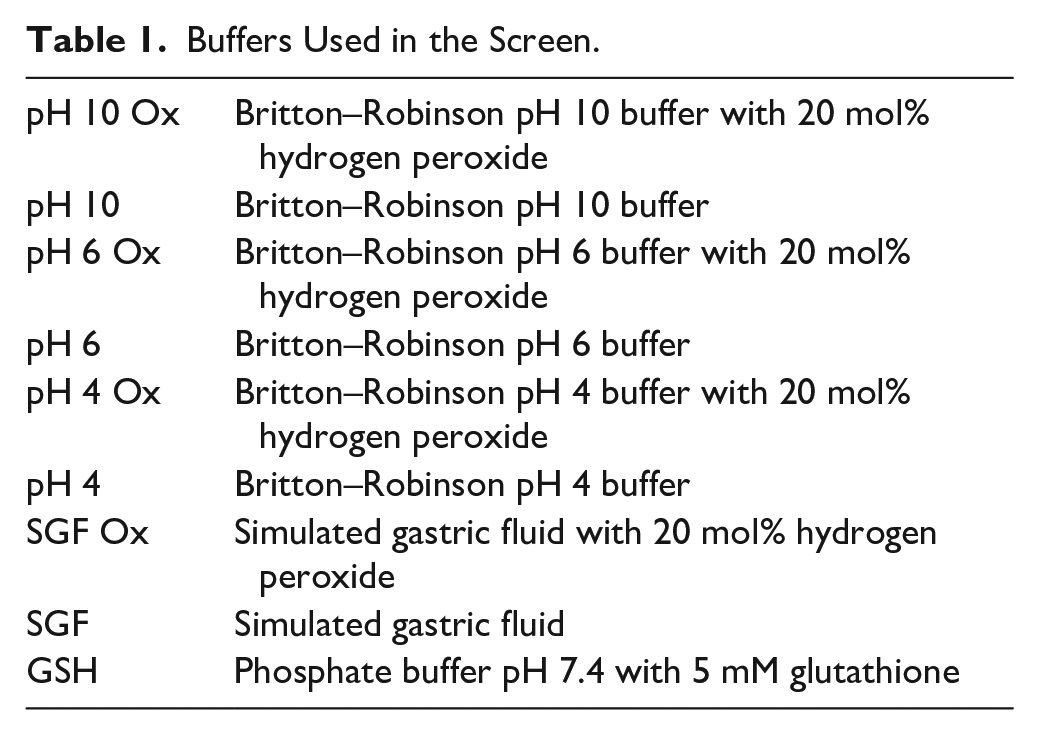
The established protocol within GlaxoSmithKline (GSK) was a screen from a 1 mM stock solution in acetonitrile (made up from 2 mg of solid samples), which was diluted with simulated gastric fluid (SGF; pH 1.6) 5 and with pH 4, 6, and 10 Britton–Robinson buffers. The pH range chosen reflected the likelihood that any molecule with an ionizable center would be ionized or neutral in at least one of the buffers. These conditions also have biological relevance: SGF can identify gastric degradation, pH 4 is relevant to skin, and pH 6 is relevant to intestinal conditions. To assess the potential for oxidative degradation, 20 mol% hydrogen peroxide was added to additional vials at each chosen pH. 6 The solutions were held at 40 °C (accelerated conditions) and assayed repeatedly over 24 h to provide information about degradation kinetics.
The existing screen proved valuable but was necessarily labor-intensive and required milligram quantities of often limited or unavailable solid sample stocks. To expedite the process, a higher-throughput screen, incorporating mass spectrometry (MS) detection to help with the identification of degradation products, was developed and evaluated. With higher-throughput and lower-compound requirements, the screen was designed to be utilized at earlier stages of drug discovery (hit-to-lead and lead optimization, rather than the historical use of the screen toward candidate selection). As 10 mM DMSO solutions are readily available from the company’s compound library, the method was developed starting from 10 mM DMSO solutions rather than from solids (thus 60 µL required, instead of 2 mg). Previous stability studies have ensured optimum conditions for the storage of DMSO stocks as part of the company’s screening collection. 7 The streamlined solution stability screen was validated using a variety of compounds with previous stability data obtained by the original screen. Guidelines were defined for stable and unstable compounds, including instances where further investigation was recommended. The utility is described in the following sections with data generated on a set of marketed drugs. The assay is not meant as a termination point on a given compound or series, but as an early alert for program teams to have an idea of stability issues that could adversely influence screening output, to aid in decision-making between series or to highlight potential issues in a structural series that may need to be addressed during progression. Since the screen was streamlined at the end of 2015, it has been requested multiple times, attracting the interest of a wide range of therapeutic areas covering a number of research sites globally. 8
Materials and Methods
The reagents used in the method were DMSO (analytical reagent grade, 99.8% pure; Fisher Chemical, Loughborough, UK), acetonitrile (HPLC gradient grade, 99.9% pure; Sigma Aldrich, Haverhill, UK), simulated gastric fluid (pH 1.6), Britton–Robinson buffers (pH 4, 6, and 10), hydrogen peroxide solution 30% (w/w) in water (Sigma Aldrich), and
Buffers Used in the Screen.
The LC-MS instrument used was a Waters Acquity UPLC (ultra-performance liquid chromatography) system with an Acquity UPLC BEH C18 1.7 µm, 2.1 × 50 mm column held at 40 °C, an Acquity DAD (photodiode array detector; 210–350 nm range), and a Waters SQD mass spectrometer (100–1000 m/z range, in both positive and negative ionization modes). The mobile phase was (A) 100% water with 0.1% formic acid and (B) 100% acetonitrile with 0.1% formic acid (high pH mobile phase, 10 mM ammonium bicarbonate, was considered if the chromatography was not satisfactory using low-pH acetonitrile gradients). The run time was 2 min using gradient elution (97% A to 0% A). The autosampler thermostat was set at 40 °C to accelerate degradation conditions, compared with physiological conditions. The vials were sampled in each buffer approximately every 2.5 h for 24 h (5 µL injection volume).
Compounds were ordered as 10 mM DMSO stocks from the compound stores (60 µL). These stocks were then diluted to 0.5 mM in acetonitrile. The remaining dilution was done in chromatography vials using the assay buffers to obtain a final concentration of 0.1 mM and a final volume in the vial of 550 µL (microtiter plates could be used instead of vials, if less volume was desired). All the samples were prepared in the buffers at the same time, so that the incubation time could be taken from the chromatography injection times. A standard screen contained five compounds and nine buffers, so with a 2 min run time, the first time point in all the buffers was taken within the first 2 h of incubation. The peak area of this first time point was taken as the reference to which the peak areas of subsequent time points were compared. If degradation was already observed in this first time point, the reference peak area was taken from the injection of a 100 µM standard in 20% acetonitrile (aqueous) injected at the beginning of the run.
A seven-component test mix was used to ensure system suitability and quality control employed at the beginning and at the end of the run, and every 80 injections. These both acted as standards and confirmed the retention times of a series of compounds with different lipophilicity and acidic/basic characteristics. The seven-component test mix was a DMSO solution of 8-bromoguanosine, amitriptyline-HCl, 4-chlorocinnamic acid, diethyl phthalate, di-amyl phthalate, di-n-hexyl phthalate, and dioctyl phthalate.9,10 The concentration of each component was chosen taking care not to saturate any of the detectors. A control with known stability in the assay buffers was also used to confirm the reproducibility of results. The results were reported in the form of a spreadsheet. The variation of peak area of the parent compound with time was used to plot stability curves over 24 h (peak area expressed as a percentage with respect to the peak area at time 0). Using data-fitting tools, the half-life of the compound in the buffers was calculated and reported along with the percentage remaining after 24 h. A pseudo-first-order rate constant (k) for a test compound/buffer was determined from the slope of a linear regression fit. The half-life was calculated as follows: half-life = −50/k. The MS data collected for degradation often provided pertinent information to help identify any degradation products.
Results
The original method involved manual handling and dilution from solid samples, creating 1 mM solutions in acetonitrile, that were diluted to 200 µM with the buffers (final composition containing 20% acetonitrile). The analyses were performed by a validated 10 min HPLC chromatographic method, using single-wavelength ultraviolet (UV) detection.
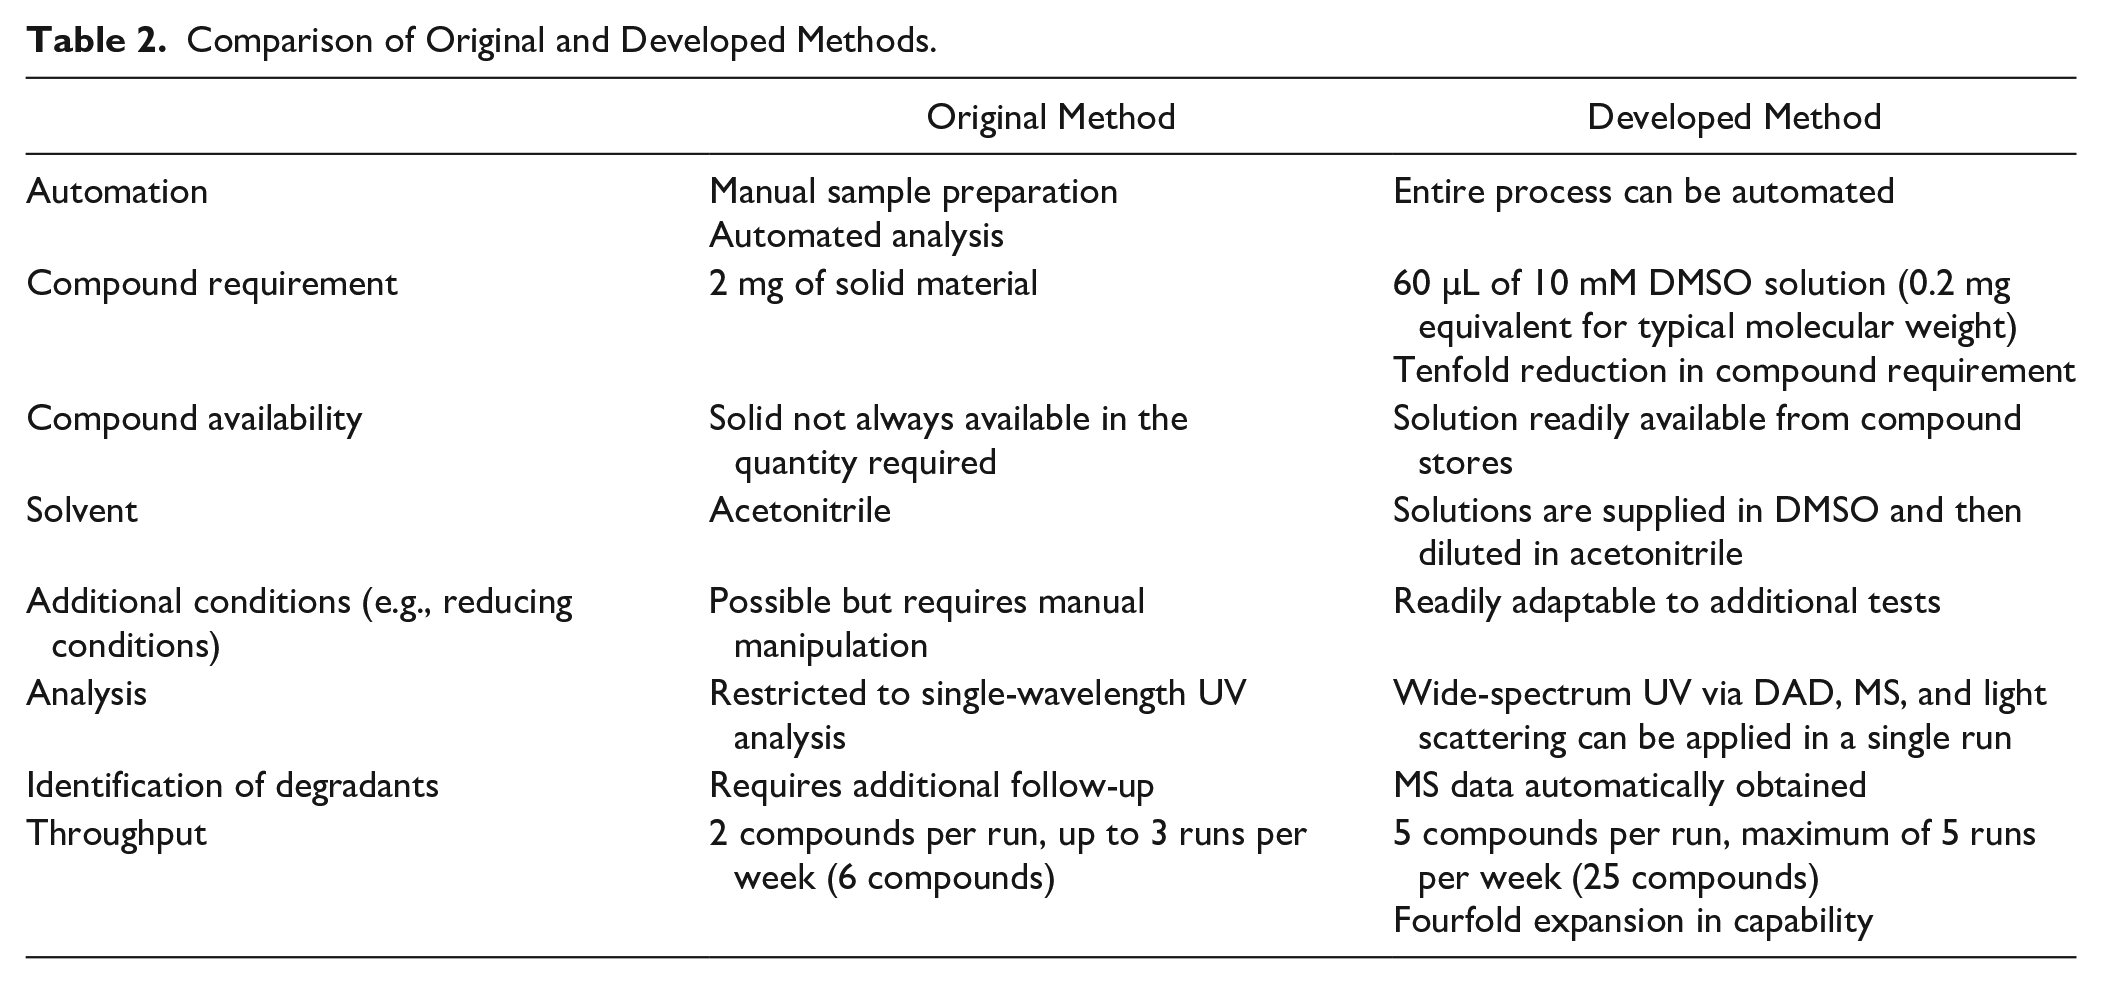
Employment of the 10 mM stock DMSO solutions from GSK’s compound library, which could be automatically dispensed, was a desirable starting point so modifications to the assay conditions were investigated to allow for the presence of DMSO. Replacing acetonitrile completely by DMSO, that is, diluting to 200 µM in 20% DMSO (aqueous), was not appropriate, as the high percentage of nonbenign DMSO promoted oxidation. The optimum conditions were found when diluting to 100 µM with 2% DMSO plus 20% acetonitrile (aqueous). This final solvent composition was obtained by diluting the 10 mM DMSO solution to 500 µM in acetonitrile and then diluting to 100 µM with the aqueous screen buffers. To account for the lower final concentration (100 µM instead of 200 µM), the signal-to-noise was increased by doubling the injection volume (now 5 µL). Another reason for choosing 2% DMSO in the final solvent composition is its relevance for high-throughput screening, where DMSO stocks are normally diluted in aqueous assay buffers to low proportions of DMSO. The analysis was performed by UPLC, with a 2 min chromatographic method, using diode array detection UV (scanning from the 210 to 350 nm range) and MS detection (100–1000 m/z range, in both positive and negative ionization modes). Among the attractions of the developed method ( Table 2 ) was a fourfold increase in throughput on a single instrument over the 24 h incubation due to the shorter analysis times.
Comparison of Original and Developed Methods.
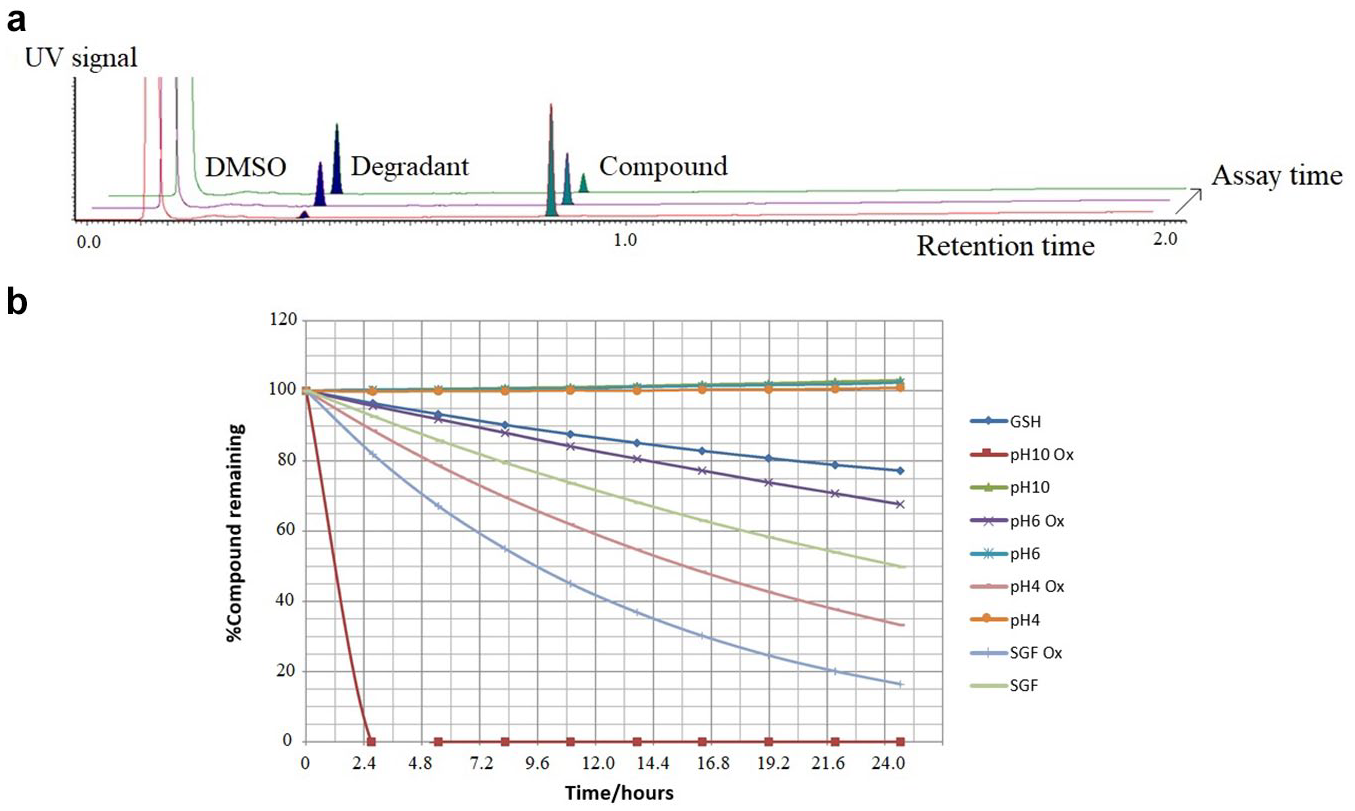
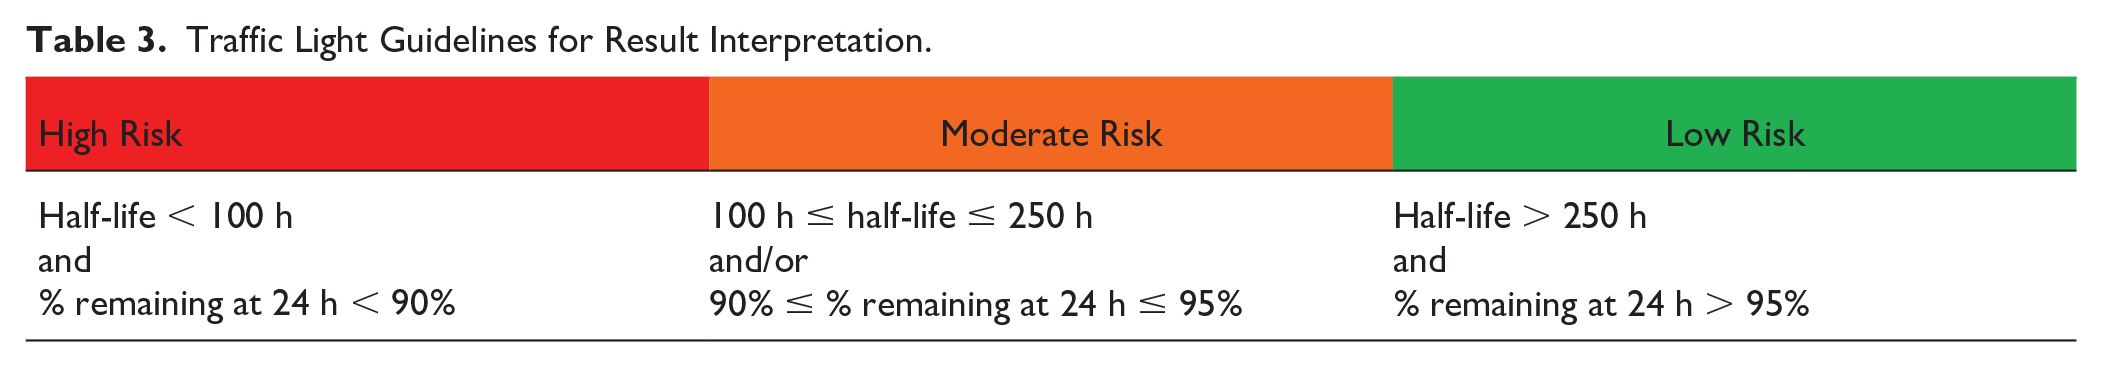
Validation of the protocol was achieved by comparison of data generated with compounds that had previously been run by the original method. The results show expected trends, with exceptions for compounds possessing a significant oxidative liability, due to the propensity for even a 2% DMSO solution to cause some oxidative degradation. In routine use of the assay, caution and further investigation are recommended when interpreting the results for compounds with evidence of high oxidative liability. Furthermore, from the cross-validation exercise a set of guidelines was developed to help with interpretation ( Table 3 ). With the original method a compound was considered low risk if the half-life was greater than a thousand hours, but from the cross-correlation results this was reduced to 250 h, to account for the differences observed from the presence of 2% DMSO. The percentage remaining after 24 h of incubation was monitored together with the appearance of degradation peaks in the chromatogram (see Fig. 1a chromatograms showing an increasing degradant with assay time and Fig. 1b for an example of a drug discovery compound showing good-, moderate-, and high-risk profiles in the different buffers). If the compound’s peak area decreased with time but there was no evidence of degradation, then the reduction in peak area was attributed to likely precipitation and thus flagged a solubility alert. In the reducing conditions buffer, when a degradation peak indicated reaction with glutathione (307 m/z), this was flagged as a potential hepatotoxicity alert. 11 From the stability curves the half-life and percentage remaining at 24 h were calculated for comparison with the guidelines in Table 3 .
(
Traffic Light Guidelines for Result Interpretation.
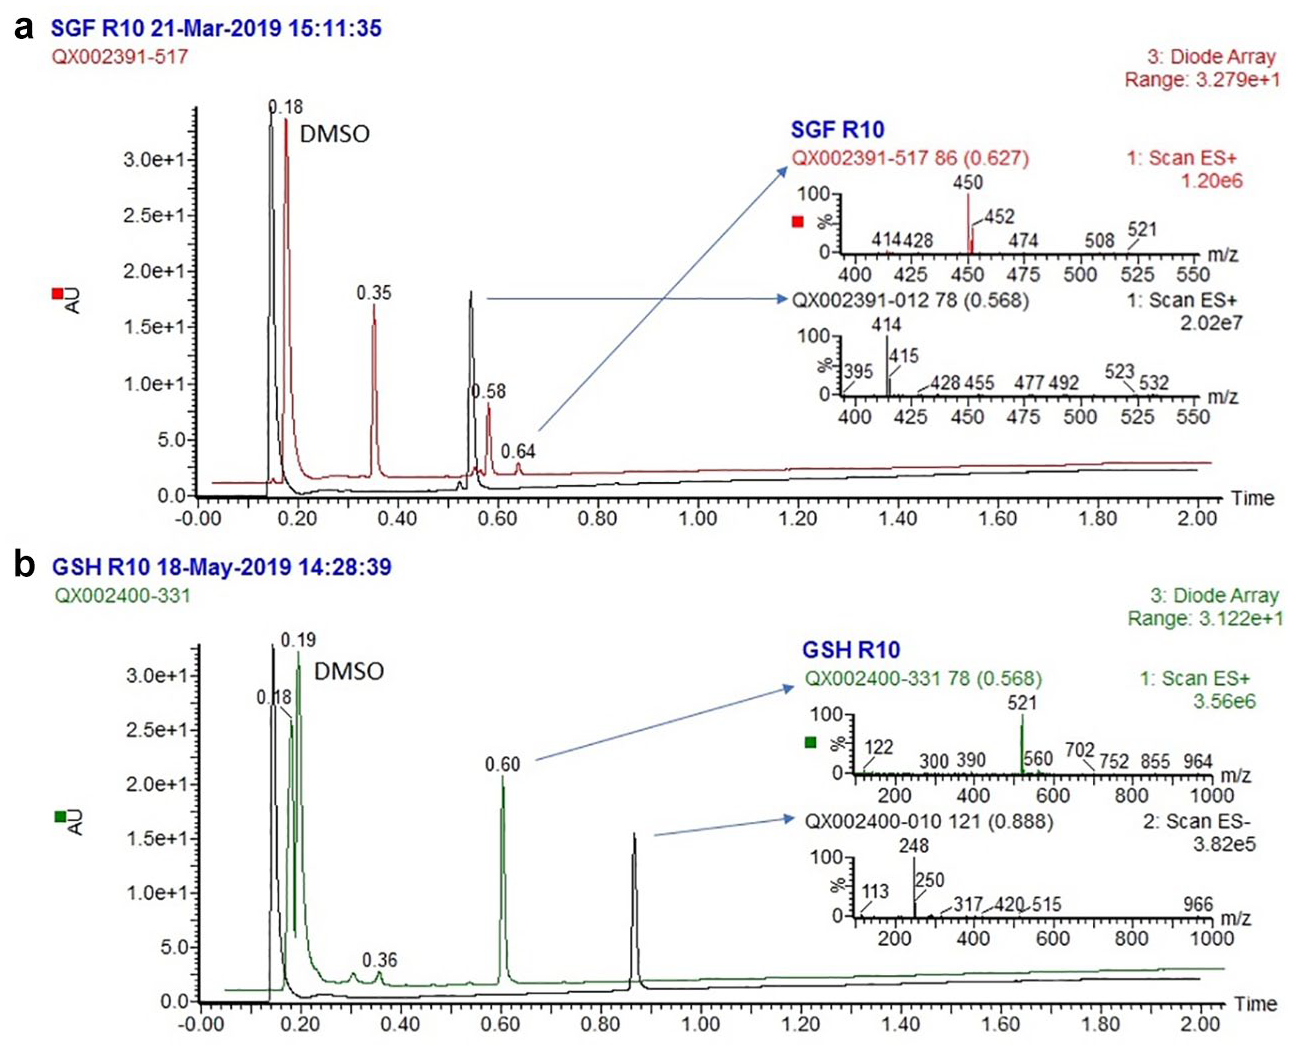
A set of marketed drugs was used to further validate the protocols, and the results illustrate the utility of the screen ( Table 4 ). The marketed drug set was specifically selected to explore known chemical stability behaviors; for example, the loss of water in omeprazole in SGF is as expected and necessary for the mechanism of action of this class of proton pump inhibitors. 12 The chemical structures for the marketed drug set can be found in the Supplemental Material . As an example of the benefit of introducing MS detection, a program team was interested to know whether any alkyl chlorides were formed when exposing their compound to SGF. Our assay was able to show evidence for such a chlorinated product, with the envisaged mass and characteristic isotope pattern ( Fig. 2a ) corresponding to the peak at 0.64 min, which increased from 0.6% to 3.9% area/area over the first and last time points in SGF. In another example, the potential hepatotoxicity risk was flagged for a compound on incubation with GSH ( Fig. 2b ), with near-complete conversion to the peak at 0.60 min supportive of a reaction with glutathione.
Stability Screen Results for Marketed Drug Set.
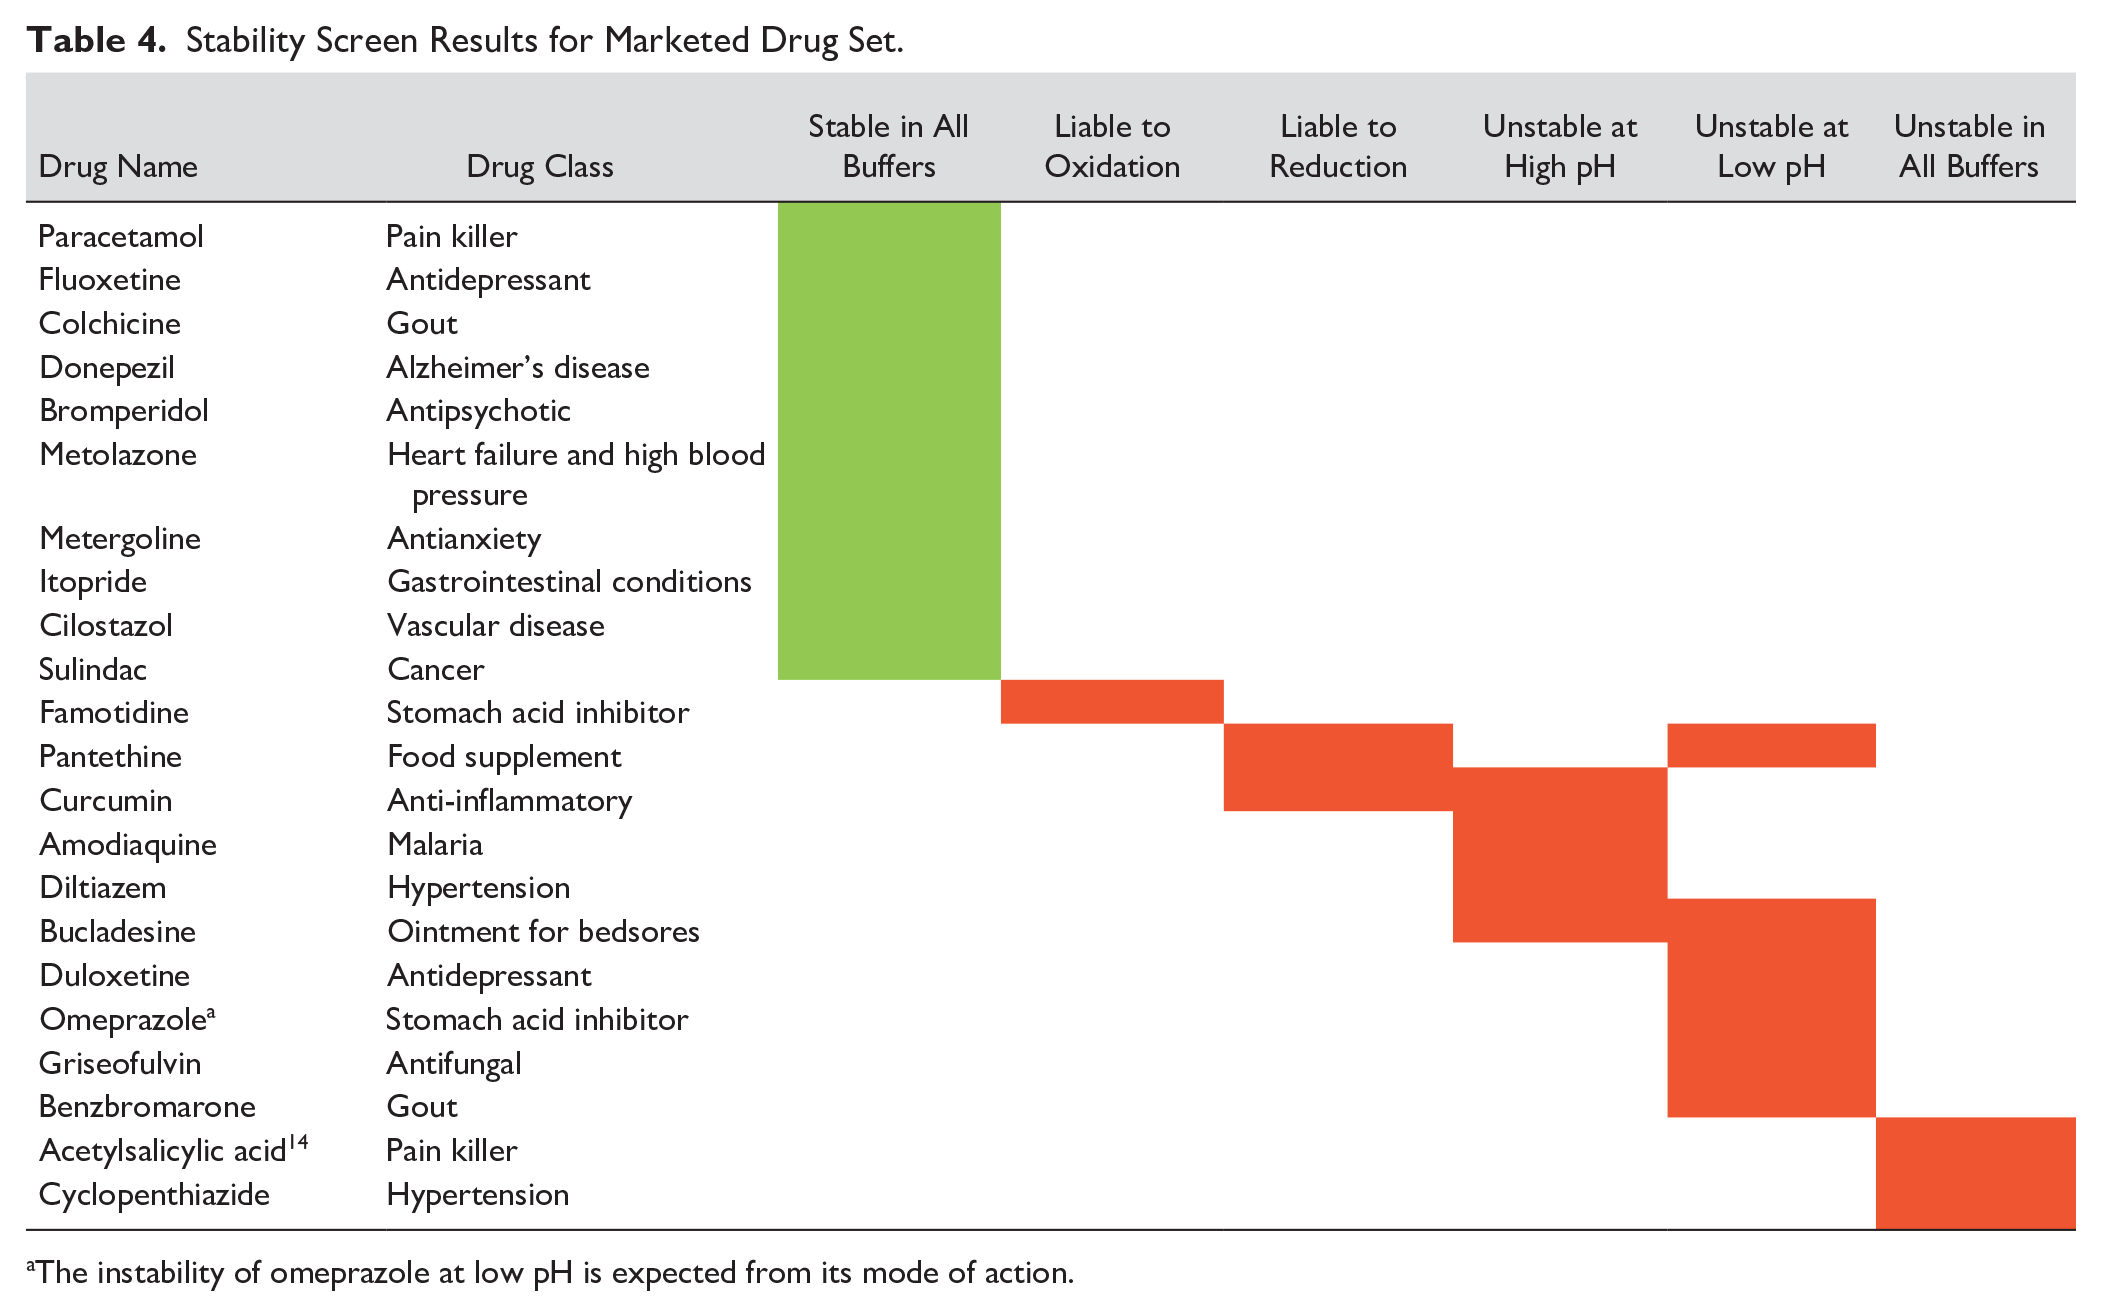
The instability of omeprazole at low pH is expected from its mode of action.
(
Discussion
An increased throughput automated screen has been developed that can give valuable information in the categorization and quantification of solution stability. This validated, automated method provides data more rapidly and with good reproducibility, comparing favorably with other reported protocols.13–25
The improvements to the method described herein offer higher throughput and excellent reproducibility and incorporate UV and MS detection by default. This higher throughput means the screen can be offered at an earlier stage of drug development and for more compounds, contributing earlier to attrition reduction and reducing the need for resynthesis and/or repurchasing when only liquid stocks are available. The screen helps to prioritize chemical series, when more stable actives may be preferable or perceptions of stability risk are allayed, in addition to identifying false positives and false negatives from biological screens that can inform on series and/or structure–activity relationship (SAR) decision-making.
Supplemental Material
Supplemental_Material_for_Method_Development_and_Application_of_an_Accelerated_Solution_Stability_Screen_for_Drug_D_by_Gomez-Sanchez,_et_al – Supplemental material for Method Development and Application of an Accelerated Solution Stability Screen for Drug Discovery
Supplemental material, Supplemental_Material_for_Method_Development_and_Application_of_an_Accelerated_Solution_Stability_Screen_for_Drug_D_by_Gomez-Sanchez,_et_al for Method Development and Application of an Accelerated Solution Stability Screen for Drug Discovery by Ruben Gomez-Sanchez, Stephen Besley, Zoe Zeliku and Robert J. Young in SLAS Discovery
Footnotes
Acknowledgements
We thank Natalie Warren-Godkin, an industrial placement student, for her work collecting the data for some of the marketed drugs; former colleagues Dominic Beaumont, Dave Clapham, and Bob Gibbon for their input into the validation work; and Julie Quayle for her supportive managerial oversight.
Supplemental material is available online with this article.
Declaration of Conflicting Interests
The authors declared no potential conflicts of interest with respect to the research, authorship, and/or publication of this article.
Funding
The authors received no financial support for the research, authorship, and/or publication of this article.
References
Supplementary Material
Please find the following supplemental material available below.
For Open Access articles published under a Creative Commons License, all supplemental material carries the same license as the article it is associated with.
For non-Open Access articles published, all supplemental material carries a non-exclusive license, and permission requests for re-use of supplemental material or any part of supplemental material shall be sent directly to the copyright owner as specified in the copyright notice associated with the article.