
Abstract
Since its first report in 1956 by Puck and Marcus, the clonogenic assay has not been completely adapted into high-content-screening (HCS) workflows despite the numerous automated systems available. Initially, clonogenic assays were used to observe the effects of radiation on cell survival, particularly with cancer cells. The clonogenic assay has since been well characterized as a measure of cancer stem cell (CSC) stemness, demonstrating that a single CSC can generate clonogenic colonies. CSCs are highly tumorigenic with an unlimited proliferation potential and capacity to generate malignant tumors. Furthermore, CSCs are also known to resist conventional chemotherapy as well as more contemporary targeted therapies alike. Therefore, given the complexity of CSCs and their clinical relevance, new methods must follow to more effectively study and characterize CSC mechanisms that allow them to proliferate and persist, and to develop drugs and other therapies that can more effectively target these populations. Herein, we present a HCS method to quantify the number and size of colonies in 2D and 3D culture models and to distinguish colonies based on fluorescent markers using an Opera Phenix high-content-screening system. In addition, we present a method to scan at low magnification and rescan at a higher magnification to capture in greater detail colonies or even single cells of interest. These methods can be adapted to numerous applications or other imaging systems to study CSC biology using high-content analysis and for high-throughput drug discovery.
Keywords
Introduction
In 1956, Puck and Marcus designed their experiments to study the effects of X-rays on the proliferative ability of single HeLa cells grown in petri dishes, thus developing the clonogenic assay. 1 Now, the assay is generally performed in six-well plates, and the cells are plated at a low enough density that they settle as single cells. After incubation and treatment, the single-cell-derived colonies are fixed, stained with crystal violet, and counted under a microscope. 2 The clonogenic assay has since become a gold standard in the functional study of cancer stem cells (CSCs), measuring CSC stemness through the ability to form colonies, and determining effective radio- and chemotherapies. 2 -4 The ability of CSCs to continuously proliferate, self-renew, and resist chemotherapy and radiotherapy, however, complicates the development of effective therapies to treat malignant cancer. 5,6 Furthermore, CSCs have been shown to play a role in metastasis and in the repopulation of primary tumors after treatment. 6 -8 Although the clonogenic assay has been instrumental in developing radiotherapy dose regimens and effective chemotherapeutics, it presents several drawbacks. In particular, the standard six-well plate format, including fixatives and stains, limits throughput and constrains data collection to single timepoints with few parameters to examine. Several groups have already started to modify the standard protocol to increase the measurement throughput. Mayr et al. developed a non-endpoint method to quantify colonies by confluence measurements using brightfield through a plate reader in a 96-well-plate format. 9 Fedr et al. developed a method to plate multiple or single cells using a fluorescence-activated cell sorter (FACS) in which the cells were labeled for stem cell markers, also in a 96-well format. 10 Lee et al. established a micropillar/microwell chip to measure clonogenic potential in 3D-grown cells. 11 Ricci et al. reported a high-content-analysis method called Colony Assay Toolbox (CAT), which allows for colony counts and surface area quantitation, and incorporates fluorescent dyes to estimate senescence. 12
In this study, we outline high-content-screening (HCS) methods to quantify the number of colonies grown in both 2D and 3D by using the Opera Phenix High Content Screening System (PerkinElmer, Waltham, MA) and the Harmony software interface (PerkinElmer). These methods can be adapted to perform HCS in non-confocal mode or confocal mode for more complex experiments in which the colonies are fluorescently labeled. The mode of choice is up to the user and depends on the experiment, with non-confocal providing a more rapid acquisition compared to confocal. However, confocal mode generally provides higher resolution by removing out-of-focus light. The Harmony software allows for flexibility to perform an initial low-magnification scan to locate colonies of interest and a rescan at a higher magnification of only the XYZ location of desired colonies. The ability to locate and reimage colonies in 2D and 3D vastly reduces the time required to image with a smaller field of view and high-magnification objective. Our approach also uses well-accepted cell surface biomarker staining of CSCs, CD44high and CD24low, to further characterize stemness. 13 These methods can be expanded to study different aspects of the complex biology of CSCs and help find new targets that may help to advance modern therapies.
Materials and Methods
Cell Culture
A549 lung cancer (passage no. 82) and SW620 colorectal cancer (passage no. 92) cells were obtained new from ATCC (Manassas, VA), short tandem repeat (STR)-profiled, and mycoplasma-tested to ensure quality control. All experiments were conducted within five passages of the ATCC cryopreserved stock. All cells were maintained in 10 cm2 dishes in RPMI-1640 (ThermoFisher, Waltham, MA) medium supplemented with 5% fetal bovine serum (ThermoFisher) in a humidified incubator at 37 °C and 5% CO2. The cells were harvested by aspirating the media, washing with 10 mL of phosphate-buffered saline (PBS), detaching with 1 mL of Trypsin-EDTA (0.25%; ThermoFisher), and neutralizing with 4 mL of complete growth medium. Cells were counted using Trypan Blue in a Bio-Rad TC20 automatic cell counter (Bio-Rad, Hercules, CA).
Image Acquisition and Analysis
The images were acquired using the Opera Phenix High Content Screening System in confocal mode with the following objectives: 5× air NA 0.16, 10× air NA 0.3, 20× water NA 1.0, and 63× water NA 1.15. The fluorophores were detected with the following excitation and emission (Ex/Em) wavelengths: Hoechst 33342 (405/435–480), fluorescein isothiocyanate (FITC; 488/500–550), and tetraethylrhodamine isothiocyanate (TRITC; 561/570–630). Cell segmentation and quantification analyses were performed using the Harmony software, version 4.9.
2D Limiting Dilution Assays and Topoisomerase-IIα (TOP2A) Inhibitor Treatment
Vehicle control (0.5% DMSO), pretreatment, and continuous-treatment groups were plated in triplicate in Falcon six-well plates (cat. no. 353046, Corning, Corning, NY) at 300,000 cells/well. The pretreatment group was treated in the six-well-plate format for 24 h at 10 µM and 1 µM with a TOP2A inhibitor 4-(2-benzofuranyl)-8-hydroxy-7-(3-(morpholin-4-yl)-propanamido)quinoline (compound
3D Limiting Dilution Assays
Cells were counted and diluted in ice-cold growth medium to an initial number of 40,000 cells in a microcentrifuge tube, spun down at 4 °C, and the supernatant was aspirated. The cells were then resuspended in 400 µL ice-cold growth factor reduced Matrigel (10.3 mg/ml protein concentration; Corning), and twofold serial dilutions were performed by gentle pipette mixing to avoid bubbles into separate microcentrifuge tubes to a final concentration of ∼1248 cells per 200 µL. A CellCarrier Ultra 96-well plate (PerkinElmer) was precooled to 4 °C by using an XT Cooling Core (Corning), and then 50 µL of each cell suspension was added to triplicate wells. The plate was then placed on top of a prewarmed XF-96 metal plate (Corning) inside an incubator at 37 °C for 10 min to solidify the Matrigel. Finally, 50 µL of growth medium was added to each well, and the cells were then incubated for 7–10 days for a final volume of 100 µL/well. The complete growth medium was refreshed every 3 days by the addition of 25 µL. Live colonies were stained by adding 25 µL of Hoechst 33342 (16.7 µg/mL) for 30 min in 37 °C phenol red-free media. Note the higher concentration of Hoechst is due to the 3D matrix.
Immunofluorescence Staining
Live colonies were stained with 25 µL of Hoechst 33342 (2 µg/mL) for 10–15 min in 37 °C phenol red-free media plated in a CellCarrier Ultra 96-well plate. The cells were then fixed with 50 µL of 4% paraformaldehyde in PBS and incubated at room temperature for 15 min, washed twice with 200 µL PBS, blocked with 50 µL of 5% bovine serum albumin (BSA) and 0.3% Triton X-100 in PBS for 1 h, and washed twice with 200 µL PBS. Afterward, the primary antibodies, CD44 Rabbit IgG (cat. no. 15675-1-AP; ThermoFisher) and CD24 Mouse IgG primary antibody (cat. no. MA5-11828; ThermoFisher), were diluted in 1% BSA and 0.3% Triton X-100 and added at a concentration of 1:100 (25 µL), incubated overnight at 4 °C, and washed twice with PBS. Finally, the cells were incubated with FITC-conjugated secondary antirabbit IgG antibody (cat. no. PI31573; ThermoFisher) at 1:200 (25 µL) and TRITC-conjugated secondary antimouse IgG antibody (cat. no. PIPA128625; ThermoFisher) at 1:1000 (25 µL) for 1 h at room temperature and washed twice with PBS.
Statistical Analysis
Biological data were subjected to one-way and two-way ANOVA or the Student’s t test analysis with Prism version 8.0 (GraphPad Software, La Jolla, CA). All experiments were conducted in triplicate or quadruplicate, or as otherwise described in the methods.
Results
High-Content Analysis of Colonies Reveals a Cell-Concentration-Dependent Response to Treatment
The extreme limiting dilution of SW620 colorectal cancer cells showed a cell-concentration-dependent response to treatment with a TOP2A inhibitor (compound
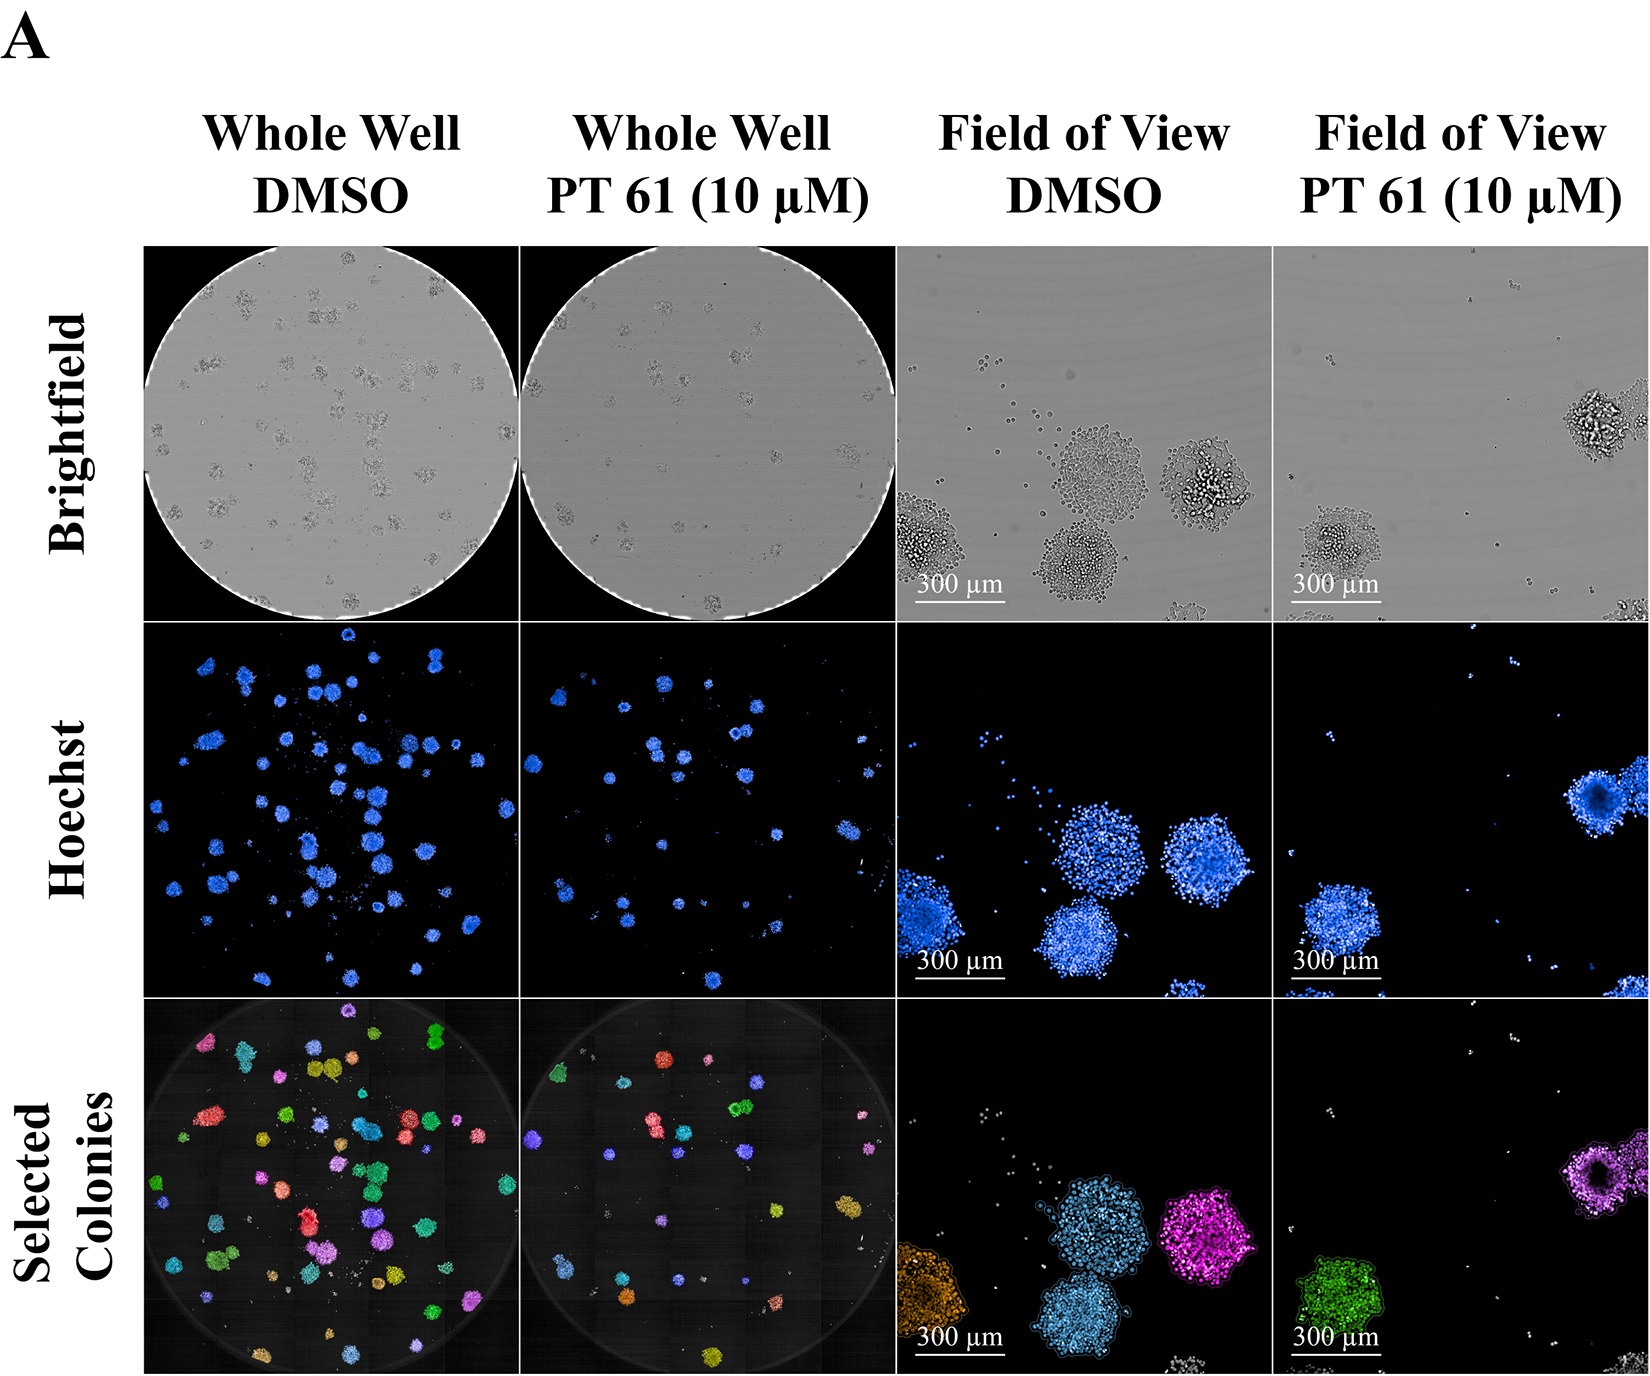
2D SW620 Colony Confocal Images Pretreated with Compound
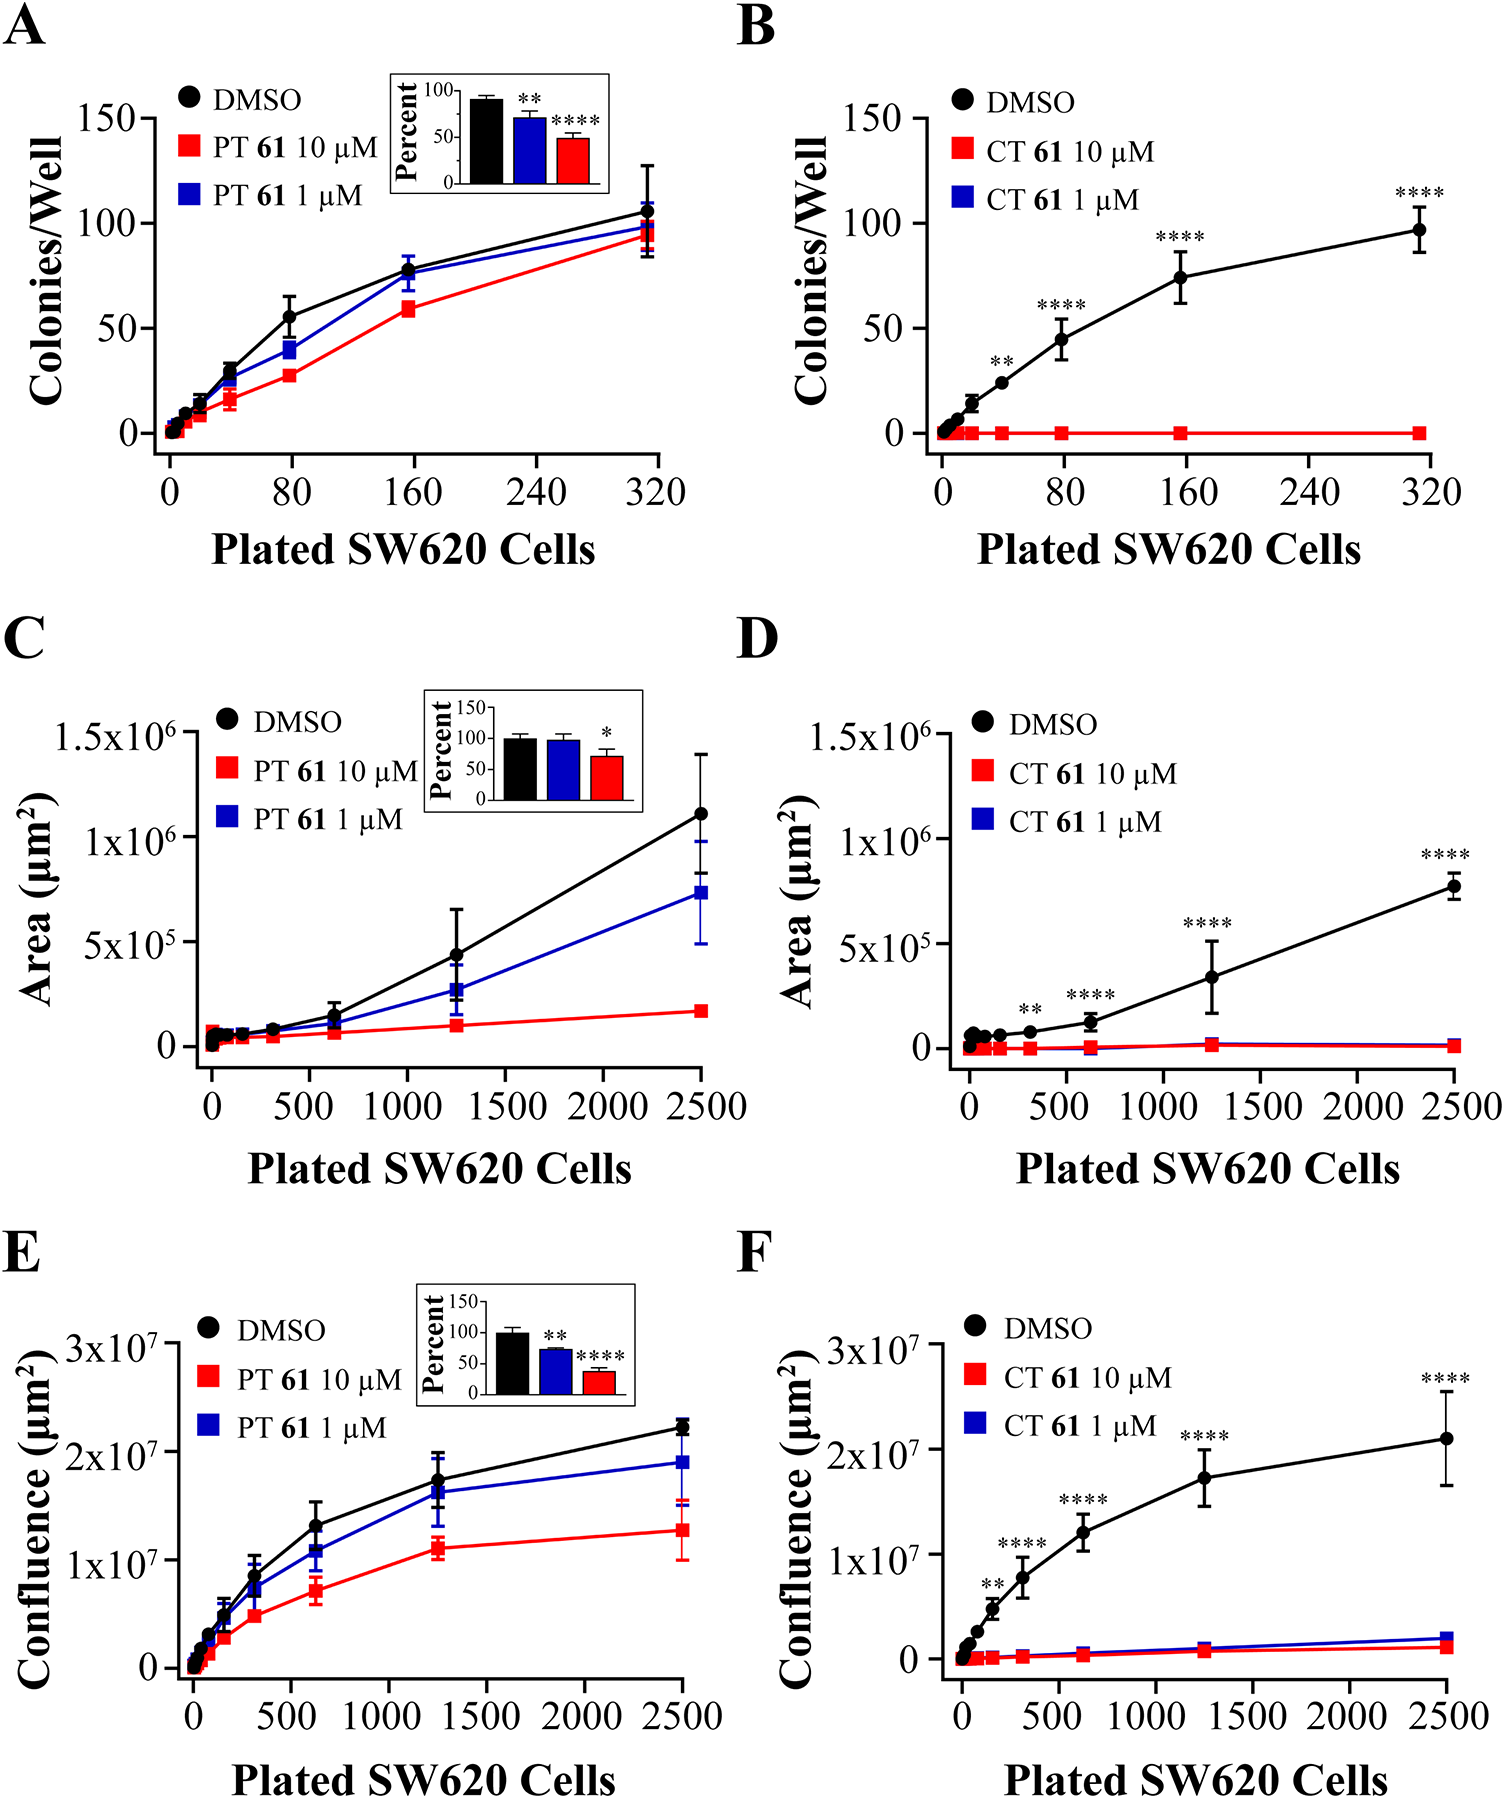
2D SW620 Colony Counts, Average Surface Area per Colony, and Whole-Well Confluence Quantification. (
Analysis Summary Detailing the Criteria to Locate, Segment, and Quantify Number, Surface Area, and Total Confluence of 2D SW620 Colonies.
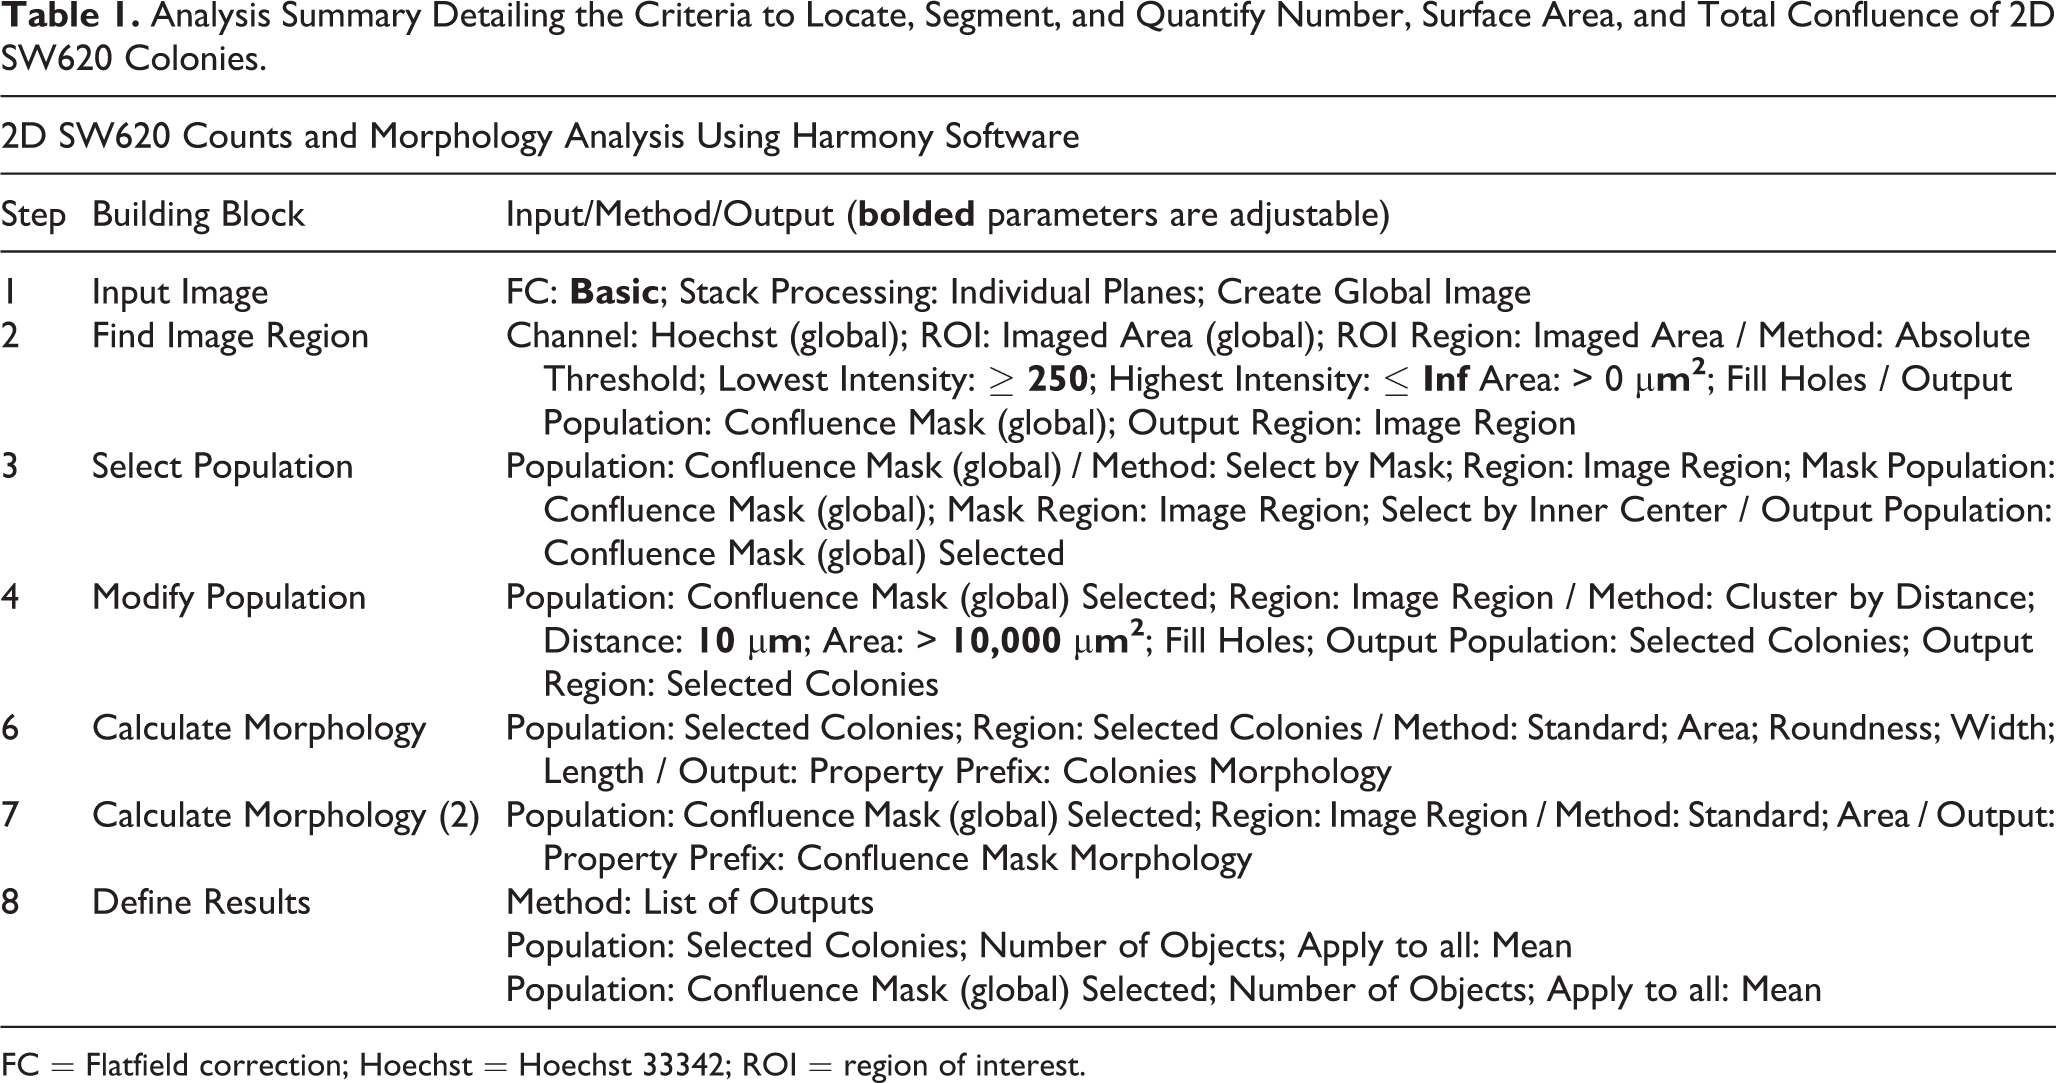
FC = Flatfield correction; Hoechst = Hoechst 33342; ROI = region of interest.
High-Content Imaging and Analysis Allow for the Accurate Quantification of 3D Colony Models
By serially diluting SW620 cells embedded in Matrigel, we observed the formation of distinct colonies (
Fig. 3A
). In addition, colony volumetric analysis was performed (
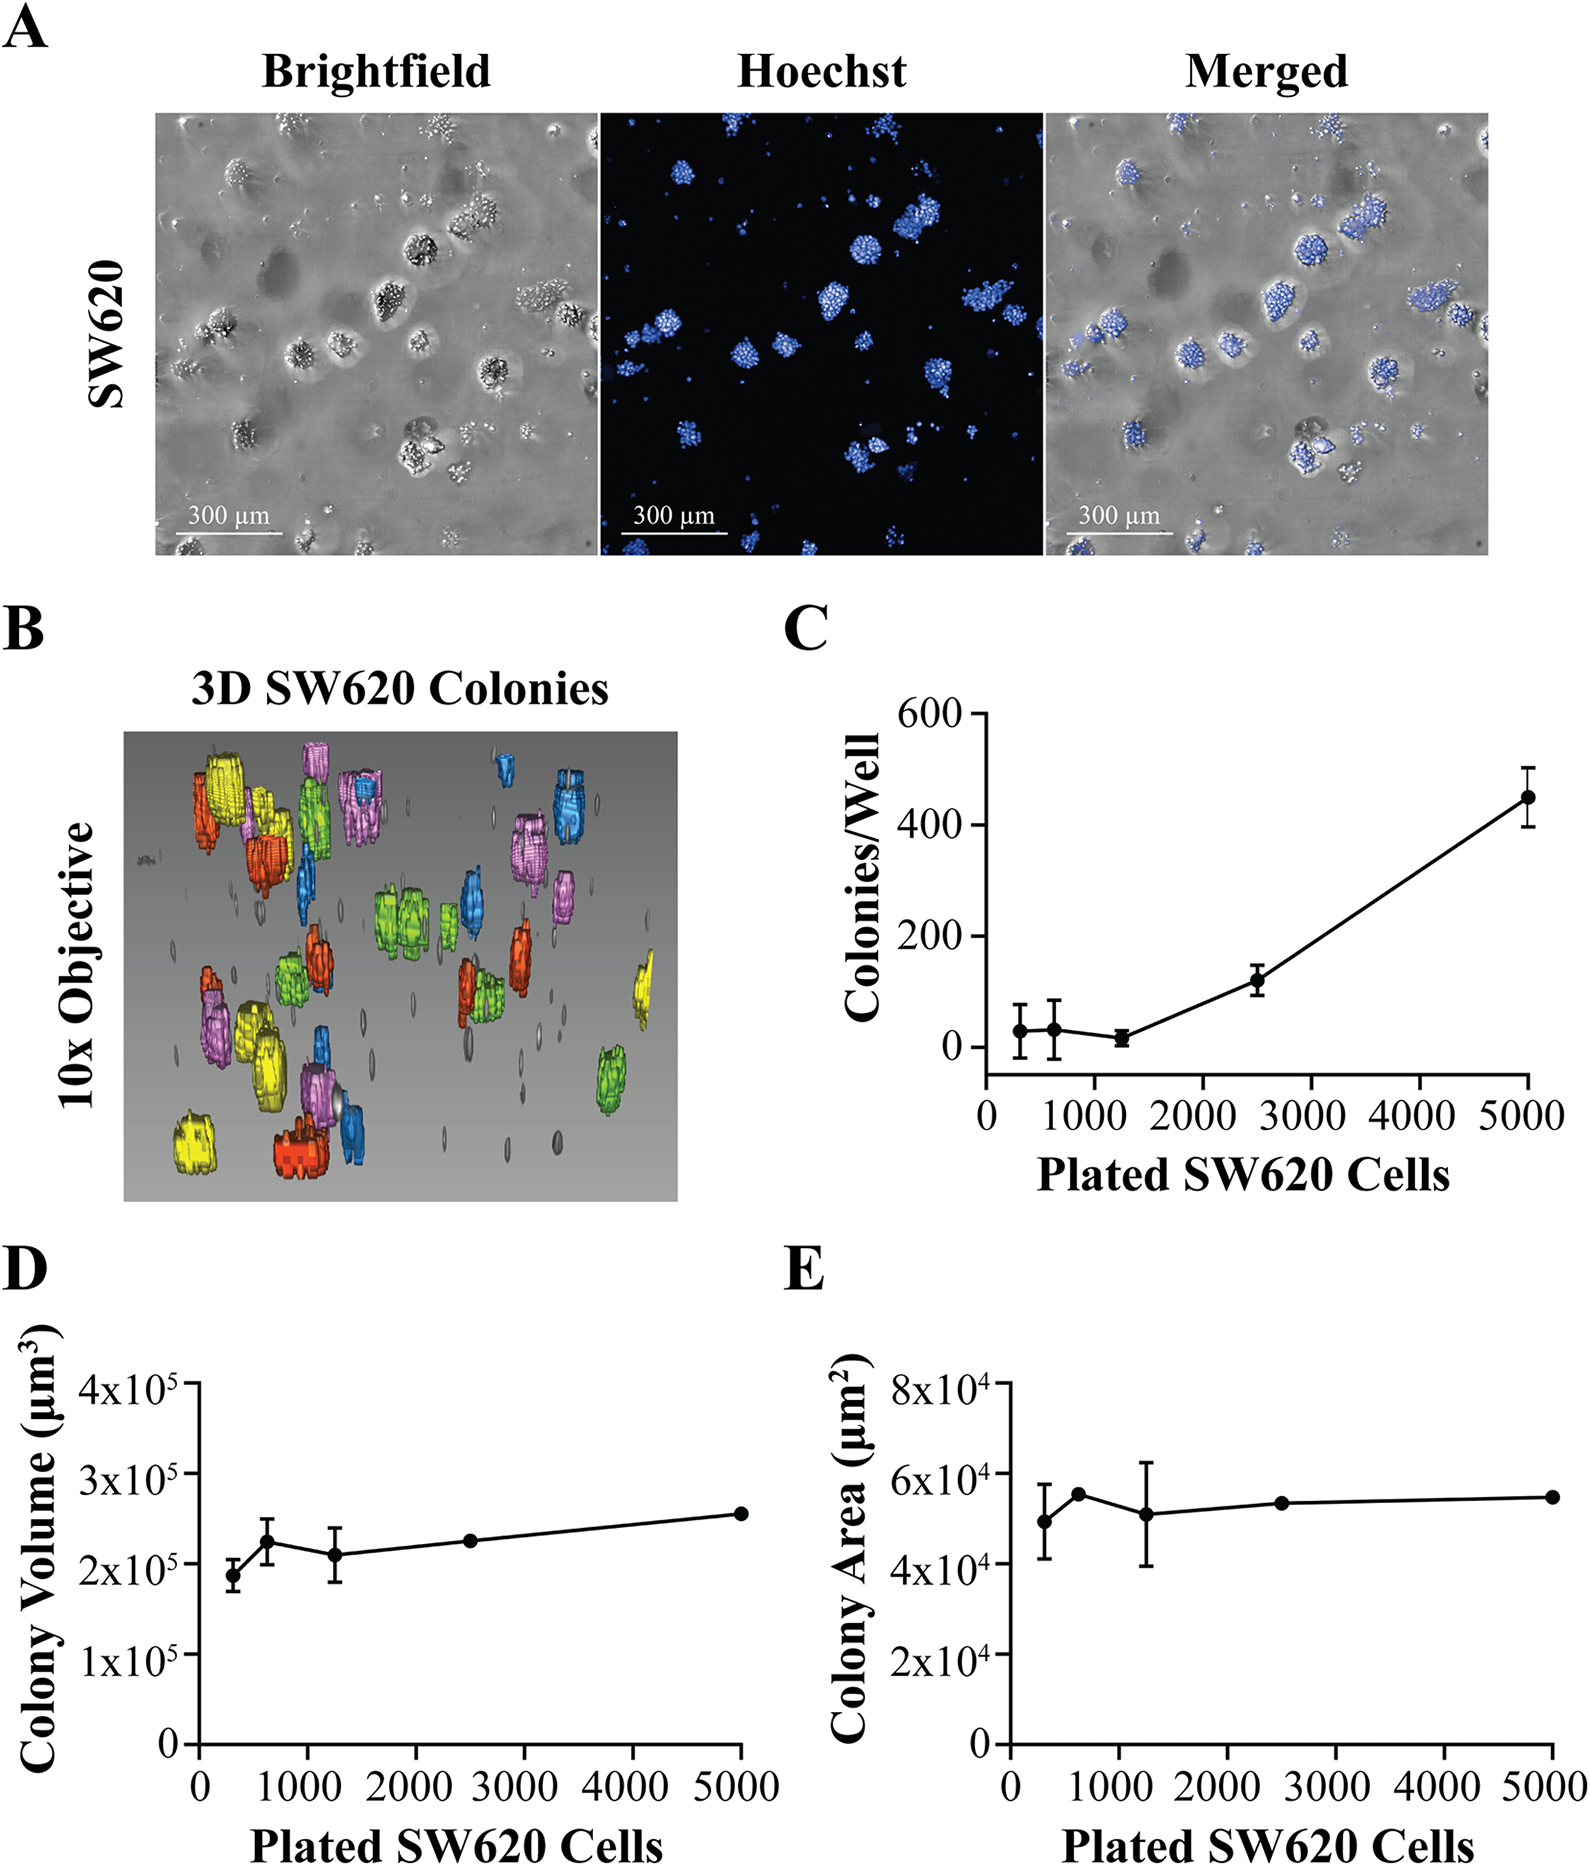
Matrigel-Embedded 3D SW620 Colony Counts and Morphological Analysis. (
Next, our goal was to demonstrate the utility of our approach in assessing different cellular morphologies from different tumor types. Thus, we chose to assess A549 lung cancer cells, which have a different cell morphology compared to SW620 colorectal cancer cells. Morphological analysis of A549 cells embedded in Matrigel revealed two colony populations with distinctly different morphologies, referred to as “circular” and “branched” (i.e., displaying protrusions). To assess these morphologies, we analyzed the morphological parameters in Harmony, including volume, surface area, equivalent ellipsoid axes (length, short vs. long axis ratio, medium axis length, shortest axis length, tilt, and orientation), sphericity, and maximum thickness (
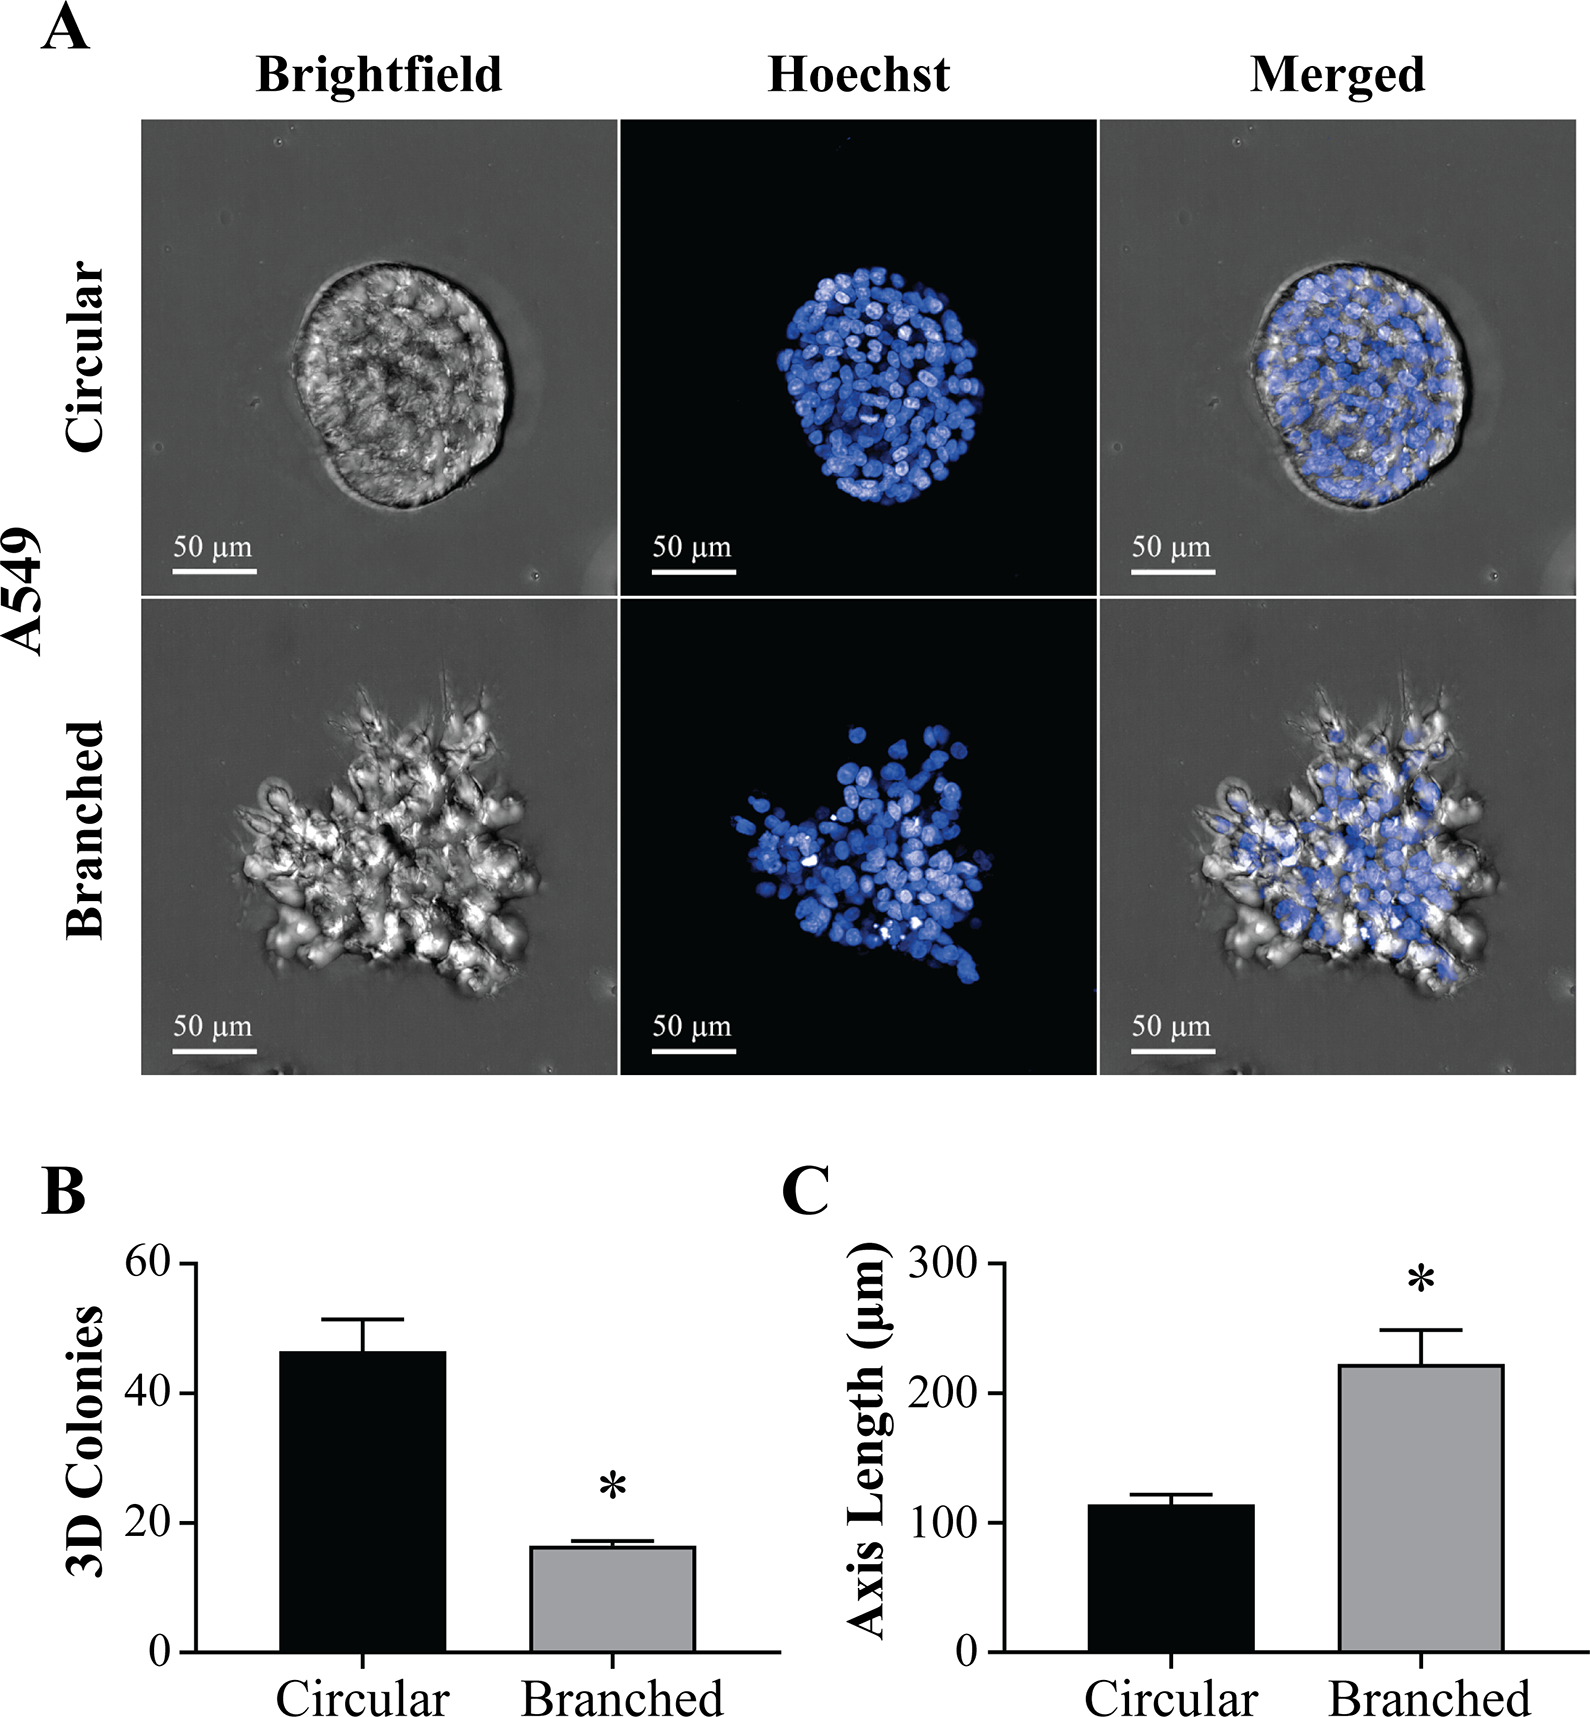
Morphological Analysis of Matrigel-Embedded 3D A549 Colonies. (
A Cell-Concentration-Dependent Increase in CD44 Expression Is Observed in SW620 Cells
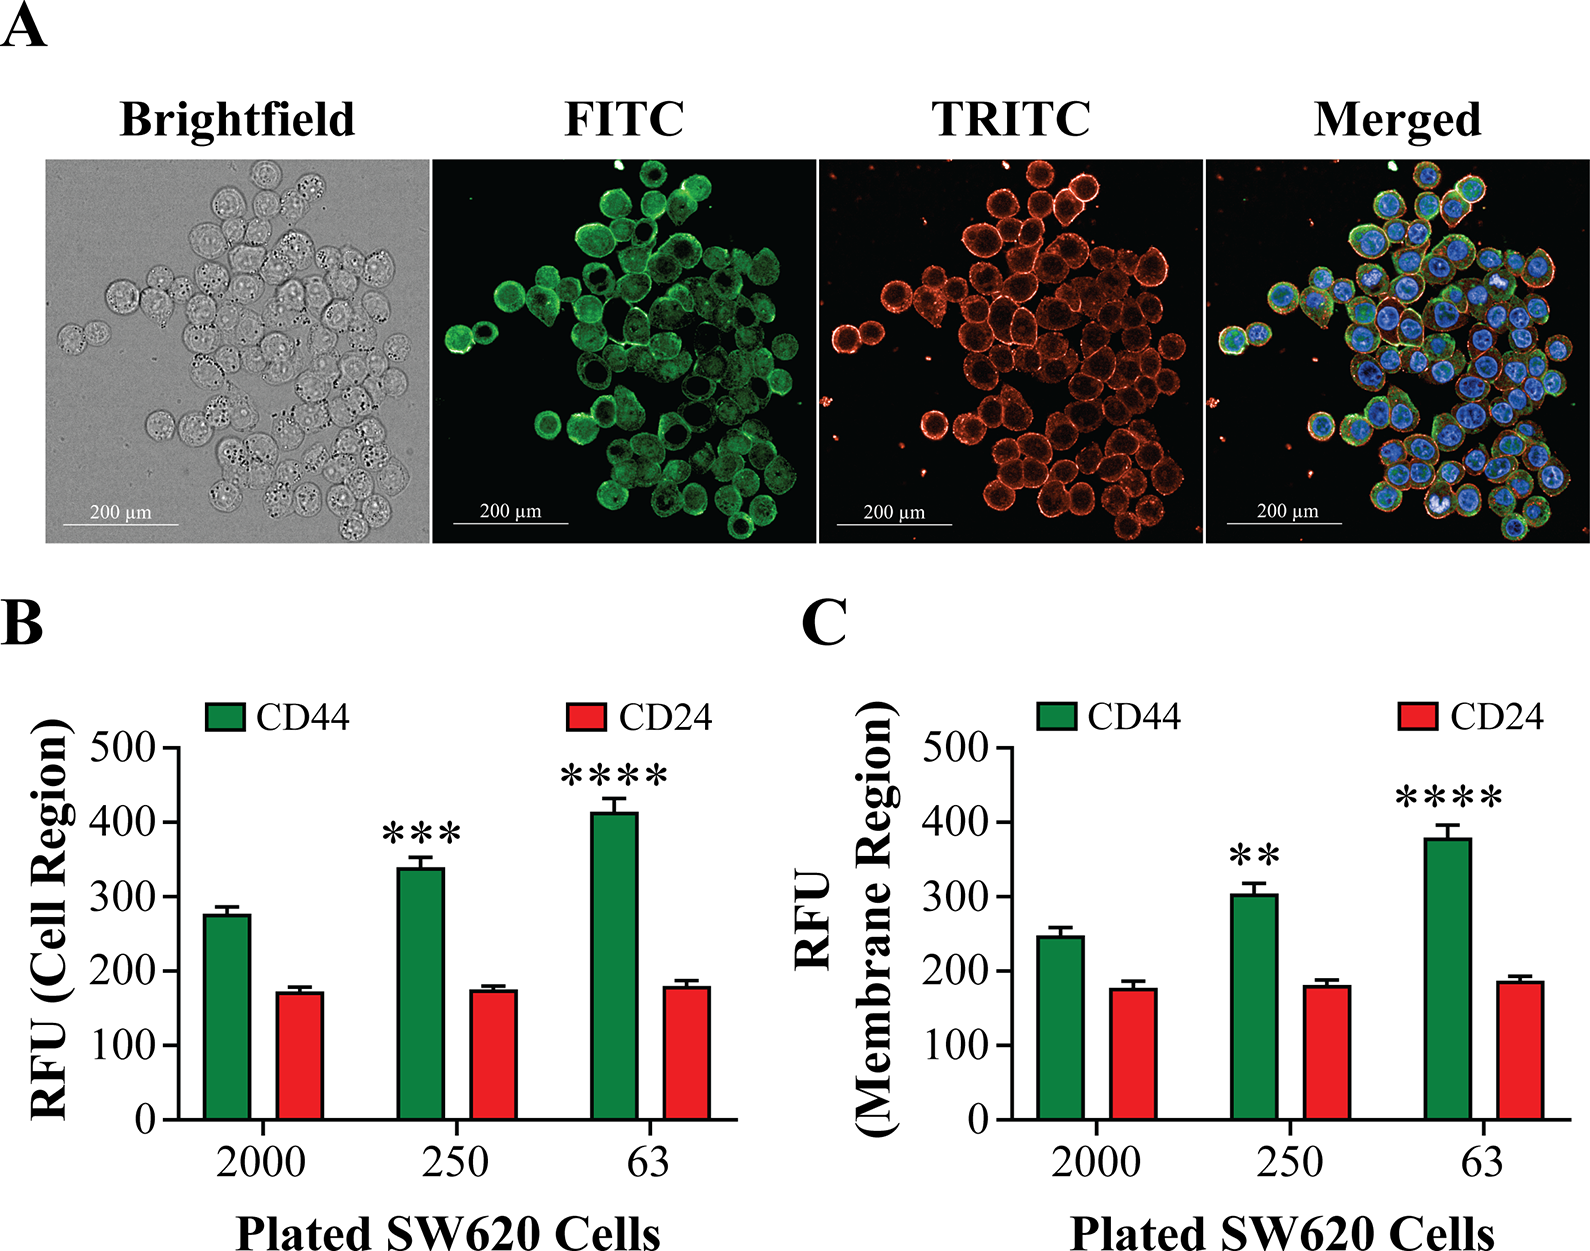
CSCs possess cell surface markers with characterized expression levels as high CD44 and low CD24. 20 -22 We examined CD44 and CD24 marker expression by immunofluorescence, then we imaged and located the colonies using a 10× air objective and re-imaged the entire colony using a 63× water objective for more detailed analysis of the membrane regions. An example of the obtained images is shown in Figure 5A with fluorescent channels FITC and TRITC for CD44 and CD24, respectively. The relative fluorescence units (RFUs) of each cell region were used to determine CD44 and CD24 expression ( Fig. 5B ). CD24 expression remained constant for all cell-plating concentrations, but as expected, CD44 expression increased as the cell number decreased. The mean fluorescence intensity at 2000 plated cells was 277.2 ± 86.65 (SD, n = 84), at 250 plated cells 339.7 ± 142.35 (SD, n = 115), and at 63 cells 414.4 ± 184.72 (SD, n = 108). CD44high/CD24low expression in cells is consistent with their stemness potential. 13,23 In addition, because CD44 and CD24 are cell surface markers, we analyzed fluorescence intensity only in the membrane region, and the results were similar to those of a whole-cell region analysis with slightly lower intensity values ( Fig. 5C ).
Immunofluorescence Staining of CD44 and CD24 in 2D SW620 Colonies. (
Discussion
Puck and Marcus set the initial groundwork to develop clonogenic assays for mammalian cells and determine the sensitivity to radiation. 1 Now, more than 60 years later, clonogenic assays are widely used to examine the effects of radio- and chemotherapies on many cell lines, estimate their stemness capacity, and study their tumorigenic potential in mice. 2,4,8,24 Importantly, CSCs play key roles in cancer development through self-regeneration, their ability to generate multilineage daughter cells, their metastatic potential, and their resistance to tumor microenvironment stress and conventional chemotherapies. 5,8,23 Thus, the increased complexity of CSCs requires more sophisticated experimental assays that enable the analysis of various features while also allowing for increased screening of therapies that eradicate or sensitize CSCs. Advances in HCS technology and data analysis now allow for expanding the number of endpoints, replicates, and screened drugs. Therefore, we can develop faster and more robust methods of quantifying colonies, their morphology, and their phenotypical characteristics. Herein, we present generalized methods to take advantage of HCS to analyze colonies. For example, our most basic experiment to evaluate the ability of monolayer SW620 cells to form colonies with or without the addition of a TOP2A inhibitor took about 56 min to acquire a 96-well plate using a 10× air objective and 25 fields of view (in confocal mode) for a whole-well image acquisition ( Fig. 1 ). It is worth noting that plating density is an important parameter to optimize for each cell line, and high plating densities tend to have an increased number of merged colonies providing inaccurate results. Thus, performing a serial dilution of the cells of interest can help determine both the endpoint and plating density to use in the experiments. Furthermore, some cell lines may not form proper colonies in 2D models, and additional plating methods may be required, such as 3D colonies, embedded in extracellular matrix (ECM) or using the soft agar method and feeder layers. 2
The evolving field of 3D cell culture systems prompted us to perform experiments using an ECM embedded cell model. ECM serves as a scaffold for cellular attachment, promoting cell–matrix interactions that induce gene expression, cellular signaling, and other mechanisms that recapitulate aspects of in vivo function. 25,26 Therefore, we sought to expand the applications of our analysis using 3D clonogenic assays. We outlined the analytical rationale to quantify colonies and assess their size, volume, and morphology. Moreover, these parameters can be used to detect more subtle changes in cells, such as changes in colony size and morphology. For example, the observed protrusions that formed the branched-shape A549 3D colonies seem to be correlated with the presence of invadopodia due to their similarity to the study performed by Wang et al. 19 Lamellipodia and filopodia are structural components of the cell that enable it to explore its surrounding environment. Invadopodia, similar to filopodia, have protease activity that is believed to enable cancer cells to invade other tissues by degrading the basement membrane and the surrounding ECM. 18,27,28
Finally, we have outlined the use of immunofluorescence to assess differential protein expression. Pairing immunofluorescence to clonogenic assays can facilitate the understanding of key mechanisms promoting CSC stemness, notably, drug resistance, pro- and anti-apoptotic mechanisms, and pathways involved in self-renewal. Herein, we have outlined a method to quantify the fluorescence intensity of CD44 and CD24, well-known markers of stemness, at the whole-cell level and within the membrane region. Furthermore, the segmentation of cellular regions and separation of populations of interest make this approach more versatile in capturing and quantifying complex mechanisms driving CSC biology.
In conclusion, the work presented in this article outlines the methods, algorithms, and workflow for 2D and 3D analyses of clonogenic colonies, which can be broadly adapted to other HCS instrumentation and imaging segmentation software. These advanced HCS methods can be applied to study the complex mechanisms promoting CSC stemness but also will have broad utility for HCS drug discovery, and to assess therapeutic potential of small-molecule drugs, biologics, and radiation therapy.
Supplemental Material
Supplemental Material, Supplemental_Material_for_Advanced_High-Throughput_Imaging_Applications_of_Clonogenicity_in_Cancer_by_Esquer_et_al. - Advanced High-Content-Screening Applications of Clonogenicity in Cancer
Supplemental Material, Supplemental_Material_for_Advanced_High-Throughput_Imaging_Applications_of_Clonogenicity_in_Cancer_by_Esquer_et_al. for Advanced High-Content-Screening Applications of Clonogenicity in Cancer by Hector Esquer, Qiong Zhou, Adedoyin D. Abraham and Daniel V. LaBarbera in SLAS Discovery
Footnotes
Acknowledgments
The authors would like to thank the University of Colorado Skaggs School of Pharmacy and Pharmaceutical Sciences HTS Drug Discovery and Chemical Biology Core Facility for their contribution to this work.
Declaration of Conflicting Interests
The authors declared no potential conflicts of interest with respect to the research, authorship, and/or publication of this article.
Funding
The authors received the following financial support for the research, authorship, and/or publication of this article: This work was supported, in part, by grants awarded to D.V.L., including the Department of Defense Peer Reviewed Cancer Research Program (W81XWH-18-1-0142) and The ALSAM Foundation Therapeutic Innovation Grant. The HTS Core has been supported, in part, by the State of Colorado Office of Economic Development and the Colorado Clinical and Translational Sciences Institute (NIH Grant UL1TR001082), The University of Colorado Anschutz Medical Campus.
Supporting Information
The supporting information (SI) contains SI data figures and tables, including the analysis to quantify and locate colonies in both 2D and 3D cell models and the fluorescent quantification of colonies.
Supplemental material is available online with this article.
References
Supplementary Material
Please find the following supplemental material available below.
For Open Access articles published under a Creative Commons License, all supplemental material carries the same license as the article it is associated with.
For non-Open Access articles published, all supplemental material carries a non-exclusive license, and permission requests for re-use of supplemental material or any part of supplemental material shall be sent directly to the copyright owner as specified in the copyright notice associated with the article.