
Abstract
The parallel microfluidic cytometer (PMC) is an imaging flow cytometer that operates on statistical analysis of low-pixel-count, one-dimensional (1D) line scans. It is highly efficient in data collection and operates on suspension cells. In this article, we present a supervised automated pipeline for the PMC that minimizes operator intervention by incorporating multivariate logistic regression for data scoring. We test the self-tuning statistical algorithms in a human primary T-cell activation assay in flow using nuclear factor of activated T cells (NFAT) translocation as a readout and readily achieve an average Z′ of 0.55 and strictly standardized mean difference of 13 with standard phorbol myristate acetate/ionomycin induction. To implement the tests, we routinely load 4 µL samples and can readout 3000 to 9000 independent conditions from 15 mL of primary human blood (buffy coat fraction). We conclude that the new technology will support primary-cell protein-localization assays and “on-the-fly” data scoring at a sample throughput of more than 100,000 wells per day and that it is, in principle, consistent with a primary pharmaceutical screen.
Keywords
Introduction
There is a compelling need for a high-throughput screening technology that implements protein localization imaging assays in flow, particularly on physiologically relevant primary cells.1–4 Applications include high-throughput assays for targeting immune checkpoint blockades on human T cells.5,6 Human T cells have traditionally been analyzed in single-stream flow cytometers that lack spatial information of internal biomarkers. However, adding imaging in flow can provide a highly specific class of screens based on spatial location of markers within the cell, such as nuclear translocation, factor internalization, and protein aggregation assays. Imaging cytometry instruments include the EMD Millipore ImageStreamX Mark II, 7 multi-field-of-view imaging flow cytometry, 8 temporal coded excitation, 9 STEAM, 10 FIRE, 11 and others. 12 The only commercially available image-based flow cytometer (EMD Millipore ImageStreamX Mark II) uses a sensitive time-delay integrator with extreme flow stability requirements that results in a maximum throughput of 20 samples/h. 13 Although two-dimensional (2D) assays, both in flow and with plate readers, have proven valuable in secondary screening and at low well numbers, these well-established methods have had limited penetration into high-sample-number primary screening. Our goal is to use parallel readout and automated real-time data scoring to relieve bottlenecks that currently exist at the sample loading and data analysis points when imaging assays are considered for large screens.
The parallel microfluidic cytometer (PMC) is designed to scale up flow imaging for applications in drug discovery through a strategy of streamlining both data collection and data processing. Small multicolor one-dimensional (1D) fluorescence images are collected from individual cells14,15 and then analyzed by methods adapted from microscope-based 2D high-content screening (HCS).16–20 The PMC operates at a ~2 µm spatial resolution over a network of parallel flow channels, which allows for high sample throughput and scalability. The approach has been proven 14 to obtain sufficient statistical information to replicate common 2D assays, many of which have much higher resolution but are burdened with excessive complexity and data reduction.21,22 The operational simplicity that is envisioned for the new methods, particularly for real-time and automated data reduction, has not yet been proven and is investigated below.
To these ends, we designed a statistical workflow that is self-normalizing for high sensitivity with minimal cell count (as few as several hundred cells). By selecting the most relevant features, our algorithm condenses the image data into a single merit function using multivariate regression. The regression model is converted into a pseudo-classifier for hit screening and is self-calibrating to the specific assay being used. The statistical pipeline exploits the smaller data structures of the simplified imaging and eliminates subjective operator biases and expert calibration steps. We have chosen to test the new methods using the nuclear factor of activated T cells (NFAT) as our readout. The blockage or reduction in translocation of NFAT is well known to be one of the key indicators of T-cell tolerance and exhaustion.23–28
In the sections below, we present the statistical pipeline in full and then apply the new data reduction to NFAT translocation in primary human T cells. We also show that the technology is resistant to common imaging artifacts,29,30 such as staining variability, edge/plate effects, compensation decomposition, image segmentation, and factors of operator subjectivity that limit the acceptance of existing 2D imaging assays. These are all corollary benefits of collecting less, but sufficient, imaging data, rather than collecting more data than using noisy data reduction methods.
Materials and Methods
Primary Cell Culture
Peripheral blood mononuclear cells were obtained using buffy coat leukapheresis from Boston Children’s Hospital, then purified using the SepMate system. RosetteSep CD3+ negative selection enrichment cocktail (Stemcell No. 15021) was added to the blood sample at a ratio of 50 µL of antibody cocktail to each milliliter of whole blood and then incubated for 30 min at 25 °C. Samples were diluted with equal parts phosphate-buffered saline (PBS) + 2% fetal bovine serum (FBS; Invitrogen No. 10082-139), then combined with DM-L density gradient (Stemcell No. 15705) into 50 mL SepMate tubes. Tubes were centrifuged at 1200g, and supernatant was collected. Cells were washed and resuspended in modified C10 media (RPMI 1640; Invitrogen No. 12633-012 supplemented with 2-betamercaptoethanol, HEPES, Glutamax, P/S, and 10% FBS) multiple times. To lyse red blood cells (RBCs), samples were combined with aluminum chloride for 10 min at 25 °C. Freshly purified cells were frozen immediately in standard freezing media (10% DMSO, 90% FBS) at 2 × 10⁷ cells/mL density and maintained in liquid nitrogen. Cells were characterized and found to consist of roughly 50% CD4+ and 50% CD8+ T cells; >95% viable and >95% CD3+, indicating a successful purification. Purified T cells were incubated at 3 × 10⁶ cells/mL density in 5% CO2 at 37 °C for at least 24 h before all experiments.
T-Cell NFAT Activation
Purified CD3+/CD4+/CD8+ cells were seeded at a density of 2 × 10⁶ cells/mL and rested overnight in modified C10 media with 20 U/mL rhIL-2 (eBioscience No. 14-8029). Cells were resuspended in 1.5 mL tubes in 100 µL of C10 for 30 min on ice. Various activation compounds were added depending on the application and the drug being tested. For the standard positive control, we used 10 mM of ionomycin (Sigma No. I0634) and 1 µg/mL phorbol myristate acetate (PMA; Sigma No. P8139). For the more physiological positive control, a two-step T-cell receptor cross-linking activation was used; 10 µg/mL mouse anti-CD3 OKT3 (eBioscience No. 16-0037) and 2.5 µg/mL mouse anti-CD28 (eBioscience No. 16-0289) were added and incubated with the chilled cells for 30 min on ice. Goat anti-mouse IgG (40 µg/mL, Invitrogen No. A16074) was added to cross-link the primary antibodies for another 30 min on ice. Both positive control samples were placed in a 37 °C water bath for 30 min to induce activation and translocation of NFAT. The negative control sample for both conditions was also placed in the water bath but did not contain any active induction.
Secondary assays were conducted to test the sensitivity of measuring spatial phenotypes during transient NFAT translocation. Using the same PMA/ionomycin induction, we submerged the cells in the water bath and removed them at 1 min intervals to obtain a temporal curve of NFAT translocation during the first 8 min of T-cell activation.
A dose-response curve was also generated to verify anti-CD3 and anti-CD28 antibodies used for T-cell activation of NFAT translocation. Varying concentrations of anti-CD3/CD28 were used to compare NFAT translocation relative to positive and negative controls.
Cell Staining and Flow Preparation
Cells were fixed with 3.7% formaldehyde (Sigma No. F8775) for 15 min on ice, washed in PBS, and then permeabilized with 0.1% Triton X-100 for 10 min. Cells were immediately centrifuged, aspirated, and resuspended in 10% goat serum (Abcam No. ab7481) in PBS. Two micrograms per milliliter of rabbit anti-NFAT1 (CST No. 4389) was added and incubated overnight at 4 °C. Cells were washed and resuspended in 1% bovine serum albumin (BSA; Fisher Scientific No. BP9703) in PBS. Ten micrograms per milliliter of anti-rabbit Alexa 488 (Invitrogen No. A11008), 1:100 propidium iodide, and 20 µg/mL of RNase A were added and incubated for 30 min at 37 °C. Cells were washed twice in PBS and fixed again in 3.7% formaldehyde for 3 min. After one final wash, cells were filtered with 40 µm mesh and resuspended at a density of 2 × 10⁶ cells/mL in custom flow buffer (1% BSA, 10 mM EDTA, 30% OptiPrep). For visual confirmation of NFAT translocation, cells were imaged separately using wide-field 2D microscopy and traditional antibody staining.
PMC Instrumentation
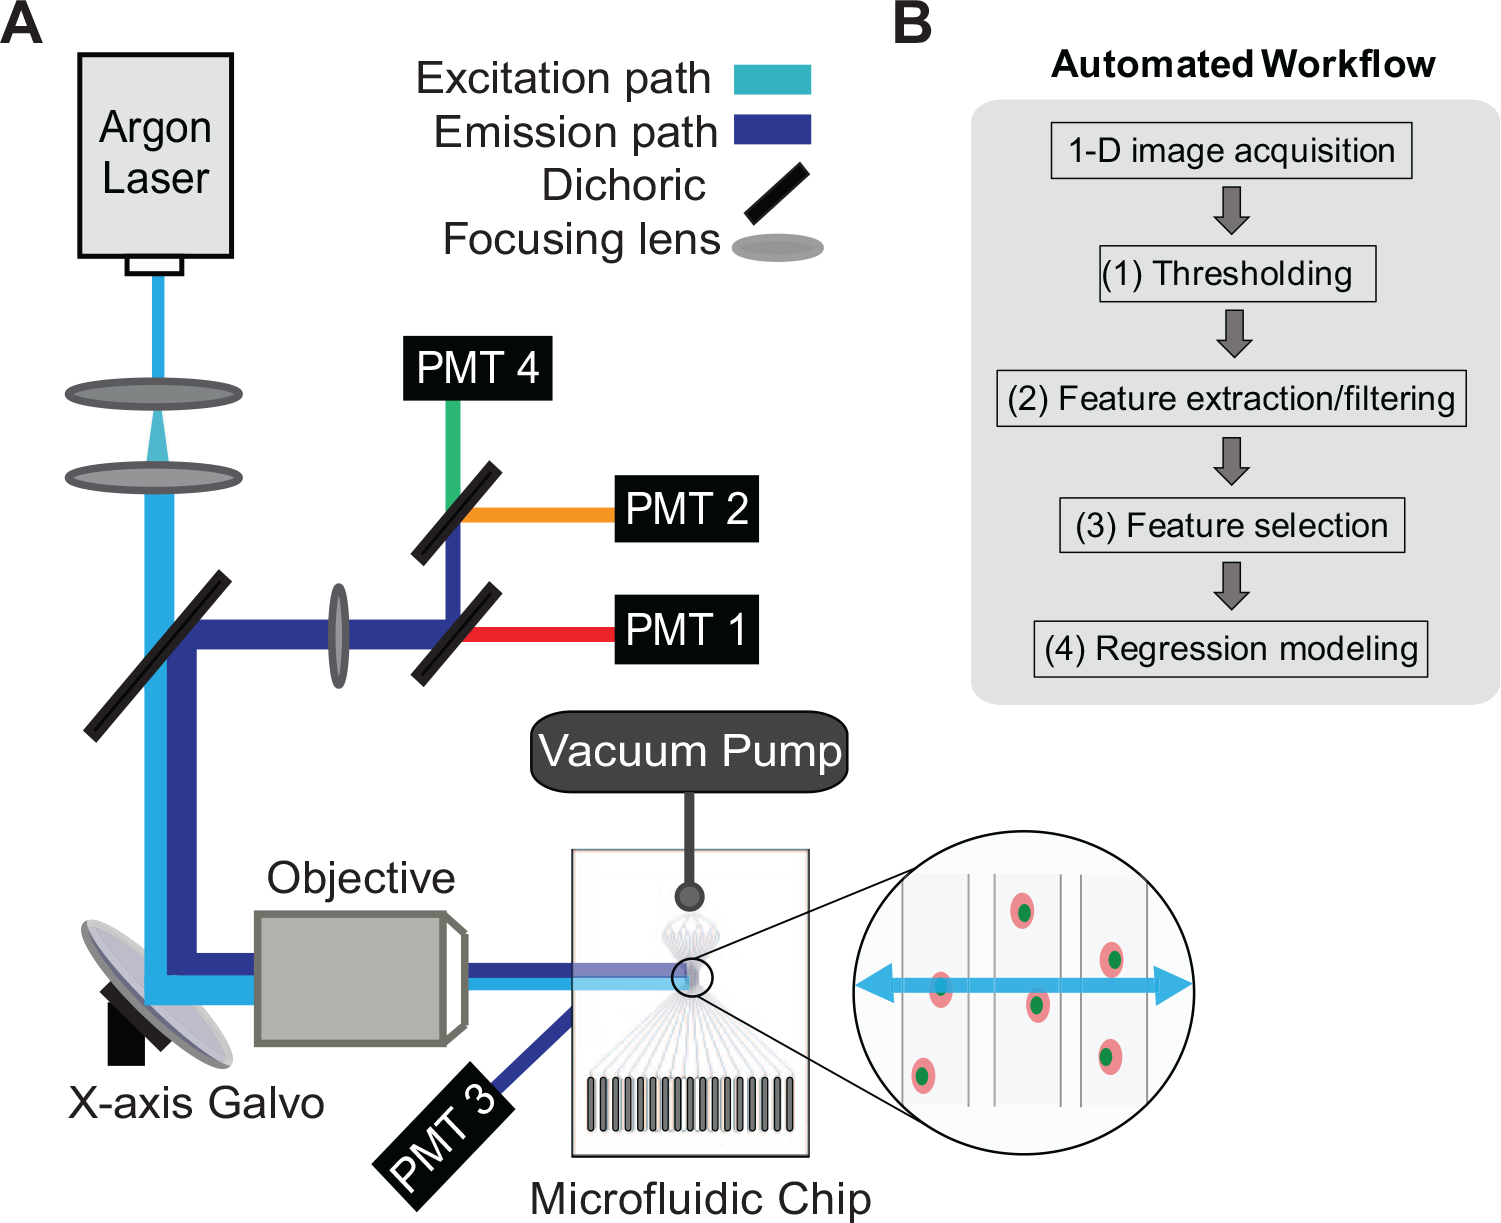
The scanning detector used in this study ( Fig. 1 ) was a custom-built 1D confocal microscope with a traditional galvanometer scanner (Cambridge Technology H6240H). A single-line 488 nm argon ion laser was focused to a nominal 2 µm diameter spot through a 50 mm focal length, 0.35 numerical-aperture mesoscopic objective. Out-of-focus cells were rejected by intensity-based thresholding after data collection. The data were acquired simultaneously on two photomultipliers (Hamamatsu H957-8) and digitized using a 14 bit analog-to-digital converter (ADC; Vertilon ISQP518, Vertilon Inc., Westfield, MA). The trigger rate was set by the user interface software (typical rate of 60,000 Hz). The scanning frequency of the galvanometer mirror was fixed to 12.5 scans/s.
(
The 16-lane microfluidic device was fabricated using photolithography and deep reactive-ion etching of 40 µm deep channels with near rectangular profile into a 4 inch diameter silicon wafer. A master was made by electroplating a nickel-chromium alloy into the silicon form, and the master was then used to emboss the fluidic network into poly(methyl methacrylate; PMMA) preforms. The PMMA structure was sealed with a removable acrylic tape. Each parallel channel had a width of 150 µm and a height of 40 µm. Other PMC prototypes have been built with as many as 384 fluidic lanes ( Suppl. A1 ).
PMC Operation
Each lane was loaded with 4 µL of sample volume at a density of 2 × 10⁶ cells/mL (8000 total cells per sample). A negative-pressure house-vacuum line (controlled by a custom solenoid valve) was connected to the chip outlet and was set to −0.10 PSI. This negative pressure corresponded to a volumetric flow rate of 0.02 µL/s in each lane. Even without sheath flow or hydrodynamic focusing, nonslip shear forces naturally focused the cells into the center of each fluidic channel, and there were minimal problems with settling and sticking. The microfluidic device was maintained by standard flow cytometry cleaning steps (sample filtration, water washes, and periodic detergent cycles). The microfluidic was deep cleaned approximately once a week by thorough washing and replacing of the adhesive acrylic tape.
For statistical significance, 14 we collected approximately 400 cell images per well out of 2500 scans at 12.5 scans/s (total scanning time of 200 s). This sparse sampling avoided overlapping cell images and constituted collecting data from about 5% of the total cells in the flow. For a two-color assay, each sample well generated around 400 to 500 KB of stored data ( Suppl. A2 ).
After completely pulling the samples through the microfluidic, wells were flushed with cleaning solution for 1 min, then reloaded with samples. The throughput was primarily limited by the manual loading steps, CPU speed, and Matlab code implementation (below).
Statistical Analysis
Overview
In our method, hundreds of features are extracted from each 1D image and normalized and filtered to those that indicate the highest discrimination of positive and negative controls. These select features are combined into a regression model to weight each feature and then reapplied back to each individual sample to obtain a single activity score. A generalized flow chart of the overall algorithm is shown in Figure 1B ; each section is numbered accordingly and is explained in detail below. Corresponding diagrams for each section are provided in Figure 2 . A detailed discussion of classifier performance is provided in Supplement B2 . Examples of specific feature calculations can be found in the supplementary data of our previous article. 14
Representative workflow of automated statistical pipeline. (
Thresholding
The new algorithm saves qualified cell events based on automated signal-to-noise thresholds using propidium iodide as the nuclear stain

where µ and σ are the mean and standard deviation of the background intensity. R2 is the coefficient of determination of a Gaussian curve fit to each 1D cell image.
Prefiltering and Feature Extraction
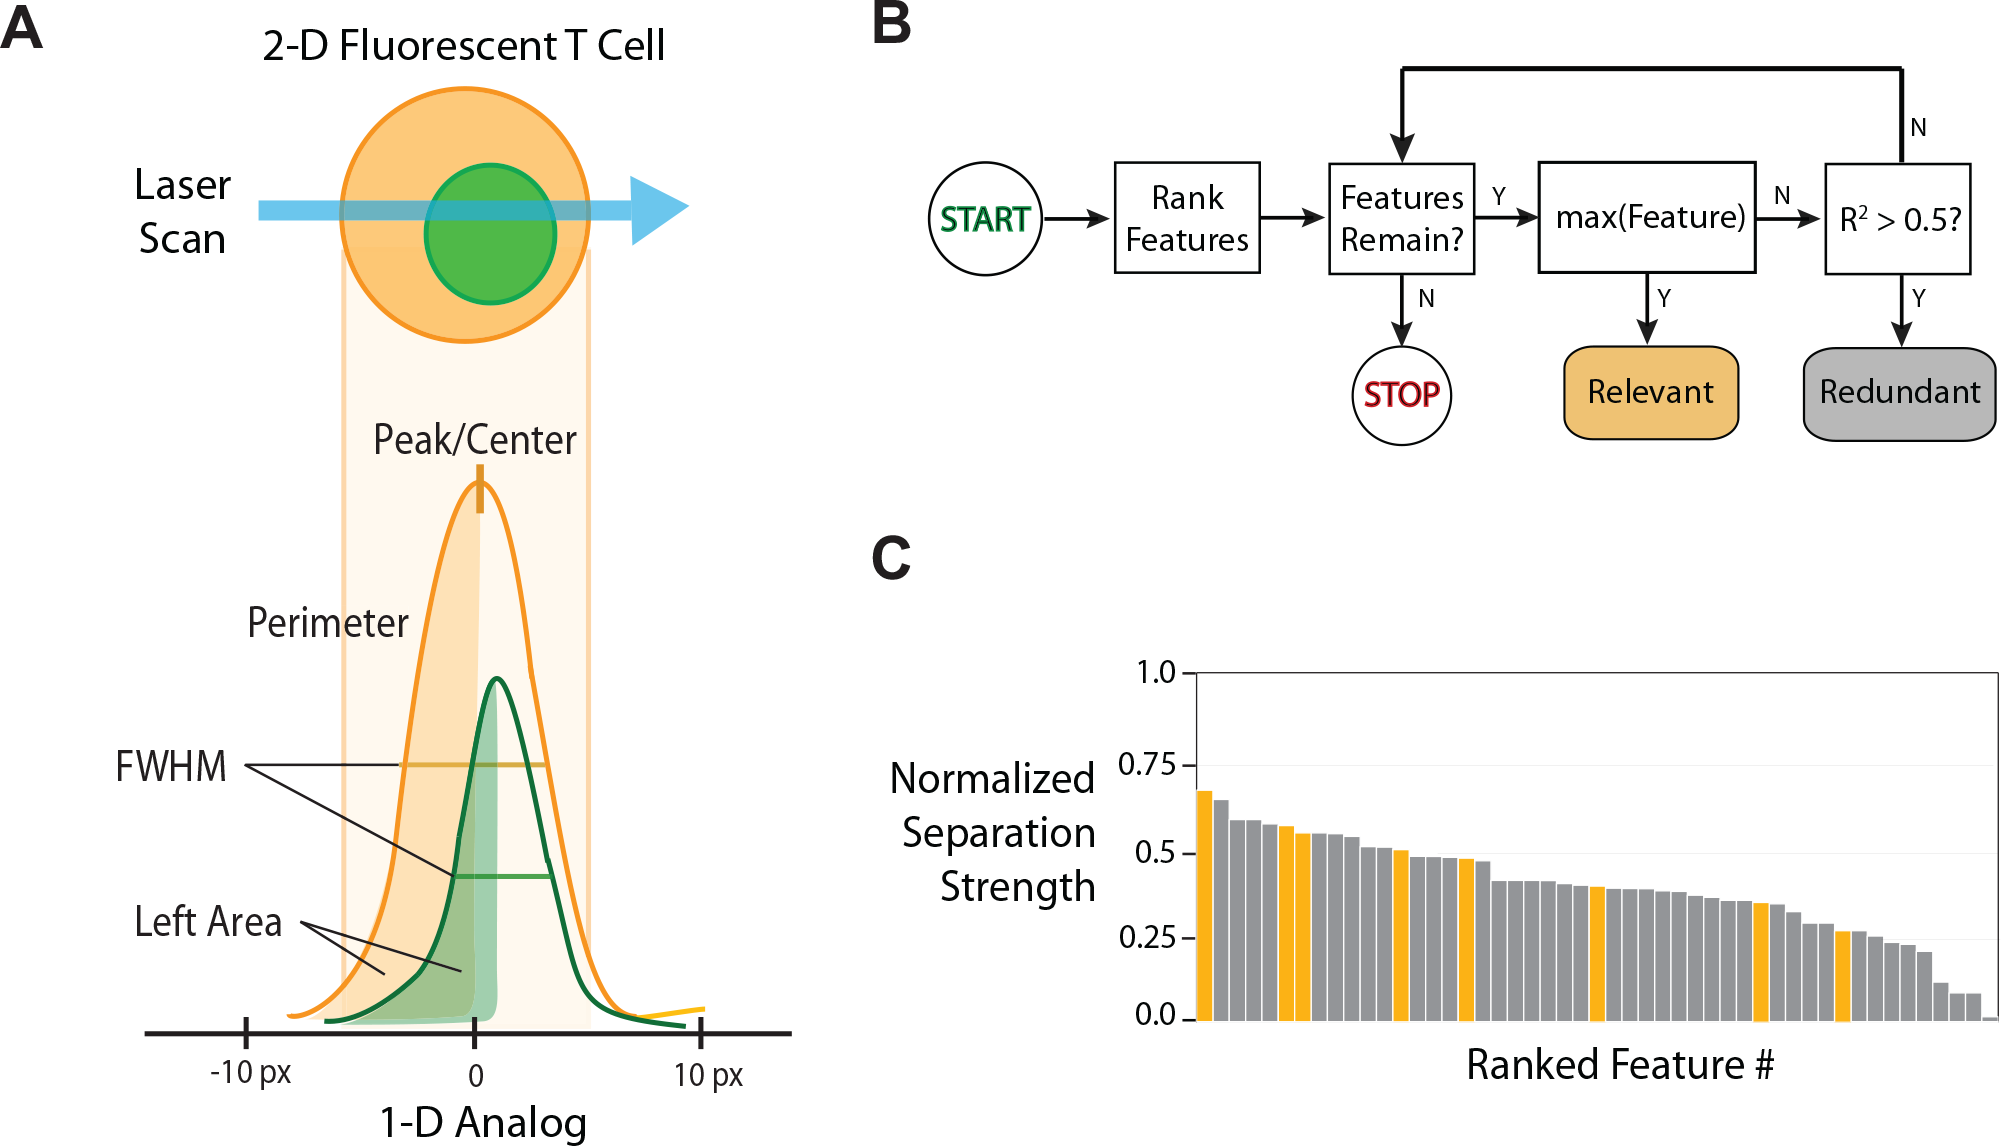
In the second step, features are calculated for each individual cell event and are filtered, then gated, based on predetermined thresholds. The statistical gating method uses hypothesis testing and preset p value thresholds that are immune to many sources of uncontrolled variability in cytometry staining and sample preparation (below). Morphological features are calculated from each event (
Fig. 2A
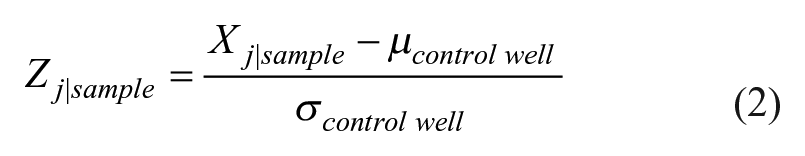

where µ and σ are the mean and standard deviation of the control well, for each individual cell, j. The calculated quantity “Sample” is the current experimental condition, where Z represents the mean Z-score for each separate feature i, and n is the total number of events per sample.
Feature Optimization and Selection
In the third step, each feature distribution is filtered to eliminate least-effective features that fail statistical significance thresholds. A normality test (one-sided Kolmogorov-Smirnov test) is applied to each feature to remove all nonnormal features at α = 0.05 with Bonferroni correction. In addition, a paired Student t test is applied to each negative control feature and its duplicate control feature at α = 0.001. Any negative control that fails the null hypothesis is removed from consideration.
After all least-effective features are removed, the algorithm selects a subset of the remaining features for regression modeling (step 4). Each feature is ranked according to the absolute value of the difference between the mean statistic of the positive and negative controls. Feature selection is implemented based on minimal redundancy maximum relevance (mRMR).
31
The algorithm
Activity Score: Logistic Regression Model
In the final step, the selected features that remain are used to generate a binomial logistic regression weighted classifier. This is a regression model that estimates the probability that a set of features belongs to a single binary dependent variable (in our case, a positive or negative control response) based on the weights of multiple independent predictors (these would be the selected noncorrelated maximum relevance features). By combining all relevant features using their corresponding weighted coefficients, logistic regression is well suited to the assembly of an activity score ( Eq. 4 ):

where xn represents each feature and β n represents the corresponding regression coefficient calculated by the model. In this way, a complex phenotypic response from a population of cells can be defined by a single readout, as often required for HCS. According to the standard logistic regression model, the activity score is the probability of the phenotypic response to match either a negative or positive control sample. We reinterpret this probability on a log scale that represents the activity, or drug response, of the experimental condition being tested. This dimensional reduction can be easily accomplished at the maximum rate of the data acquisition, to allow “on-the-fly” data scoring without buffering.
The goodness of fit is evaluated using Z′ and strictly standardized mean difference (SSMD):
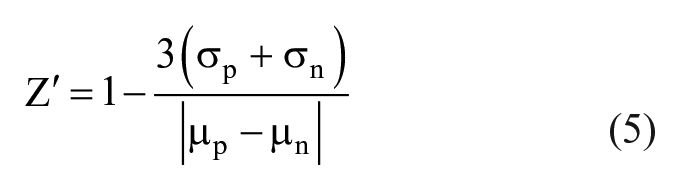
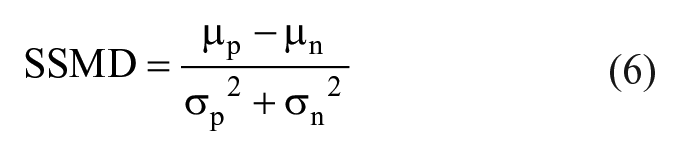
where µ and σ are the mean and standard error of the mean for either positive (p) or negative (n) control. A Z′ > 0.5 is generally used in assays with very strong positive and negative controls such as enzyme-linked immunosorbent assays, binding assays, and other similar chemical assays. 32 However, for imaging assays in which the results are much more complex and closer in phenotype separation, SSMD is preferred. In this case, for medium to strong controls, an SSMD > 6 is considered sufficient. 33 For weak controls with minimal separation, SSMD > 3 is considered sufficient. 33
Results
Normalization Testing
All fluorescence-based cytometers and plate readers are sensitive to local imaging artifacts such as dye aggregation, improper detector settings, debris contamination, and local evaporation. 18 To test the new self-normalizing algorithms, we simulated poor staining protocols by varying the photomultipier tube (PMT) gain of our instrument across an order of magnitude ( Fig. 3 ). As expected, the raw features scale directly with PMT gain because higher emission and staining intensity result in directly corresponding increases in intensity-dependent features. The accuracy of our normalization is confirmed for the intensity-independent feature groups, which show minimal change as the PMT gain is varied across an order of magnitude. The furthest deviation from the mean across all normalized features is ±10%.
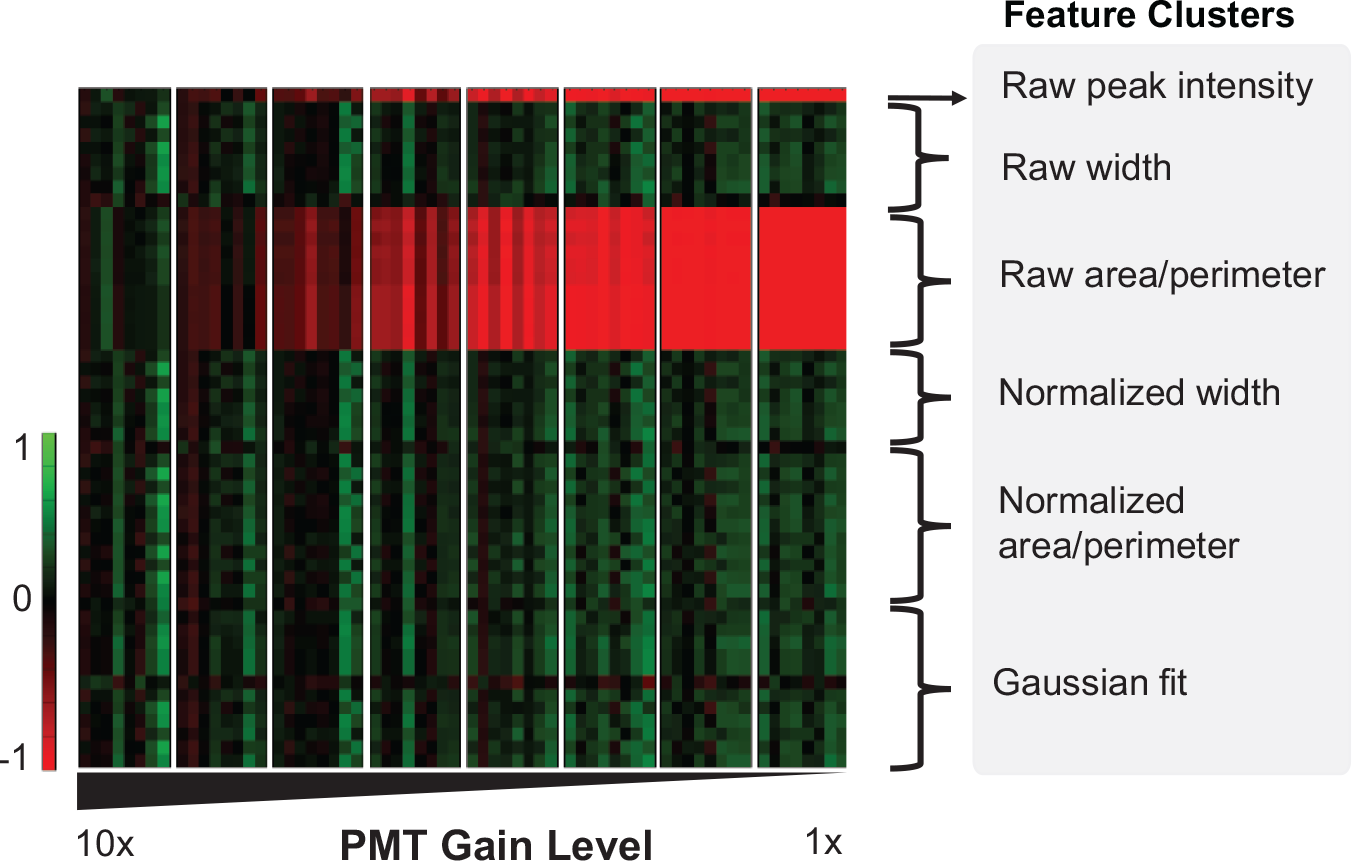
Heat map of normalized and unnormalized features for data taken over a 10-fold variation in PMT gain. These data simulate the uncontrolled differences in sample preparation and staining inconsistency, which is typical of real-world cell assays. Jurkat cells are stained with 1:1000 Sytox Green nucleic dye and fixed. Feature values are represented on the y-axis of the figure, with each row representing a different feature calculation. Individual features are grouped into similar categories based on how they are generated from one-dimensional image scans. The “raw” label indicates a feature or group of features that has no normalization applied.
NFAT Translocation in Human Primary T Cells
To directly assess the automated data reduction, we constructed an assay based on induction of NFAT1 translocation using primary human T cells and well-known activation pathways. We first purified CD3+/CD4+/CD8+ peripheral T cells from human donors as described. The cells were split into three different conditions: a negative control population with no NFAT translocation, a positive control population that used PMA/ionomycin as the induction agent, and another positive control population that used CD3/CD28 antibodies for induction. Each population was processed with 48 replicates using multiple fluidic channels of the PMC.
In the first condition, we first investigated the cellular response using a saturating concentration of PMA/ionomycin to induce maximal NFAT translocation (positive control) for a duration of 30 min. The negative control was obtained by omitting PMA/ionomycin. The normalized feature statistics are shown in Figure 4A . After data reduction, eight independent features were selected by the logistic regression algorithm ( Fig. 4B ). These features were selected based on the maximum separation between all the cumulative difference functions (CDFs) of the negative and positive controls using the previously described mRMR approach 31 ( Fig. 4C ). Using the regression model, individual activity scores were calculated for each sample well and combined in cumulative boxplots as shown in Figure 5A (left). We measured the SSMD and Z′ of our samples. Using images collected from all wells (N = 96), the Z′ = −0.39 and the SSMD = 2.92 ( Table 1 ). These numbers are not strong enough for a large-scale primary screen, although an SSMD of 3 is still acceptable for assays with weak positive controls.18,33 However, most of our variance comes from reproducible differences between parallel lanes—primarily optical aberrations across the scan field (see Suppl. C1 ). To address the lane-to-lane personality, we reapplied the same algorithm again but modeled each lane to apply separate base-lining to each lane individually. This compensates for reproducing lane-to-lane variability. We achieved an average Z′ of 0.55 and SSMD = 12.98 ( Table 1 ).
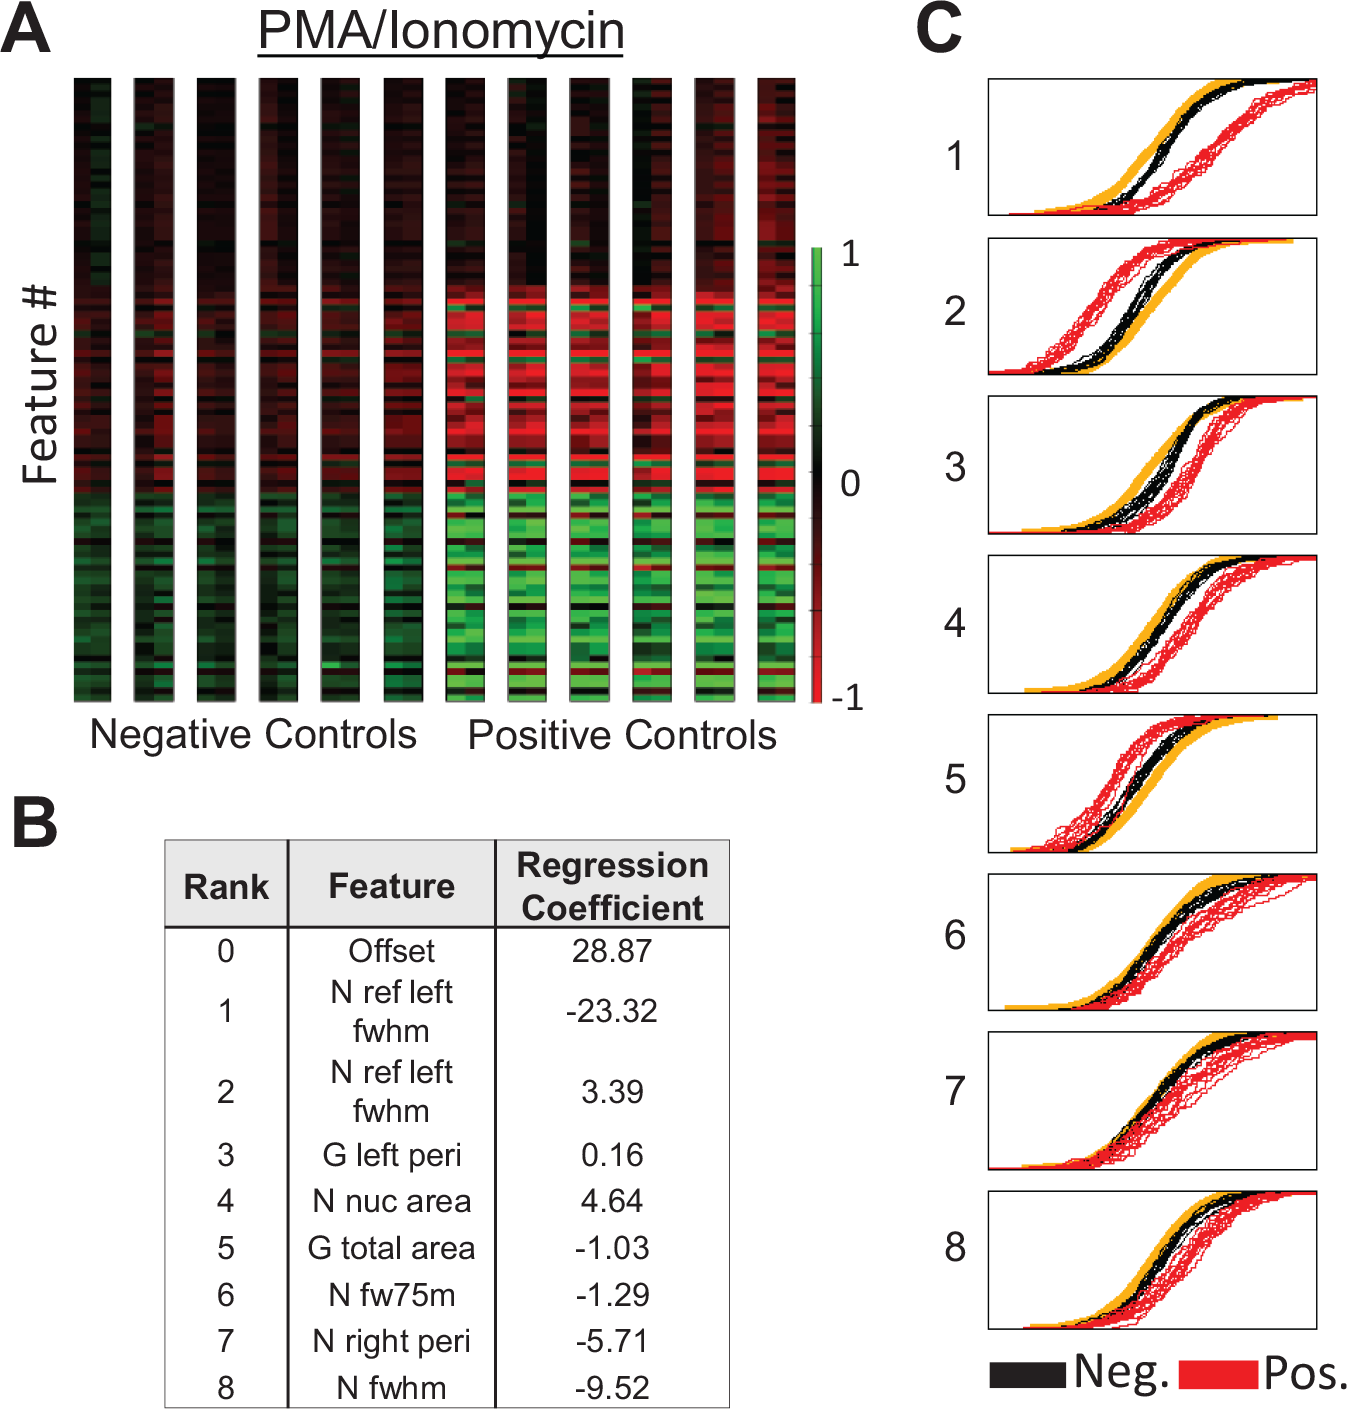
Data for nuclear factor of activated T cells translocation in primary human CD4+/CD8+ T cells using phorbol myristate acetate/ionomycin induction. (
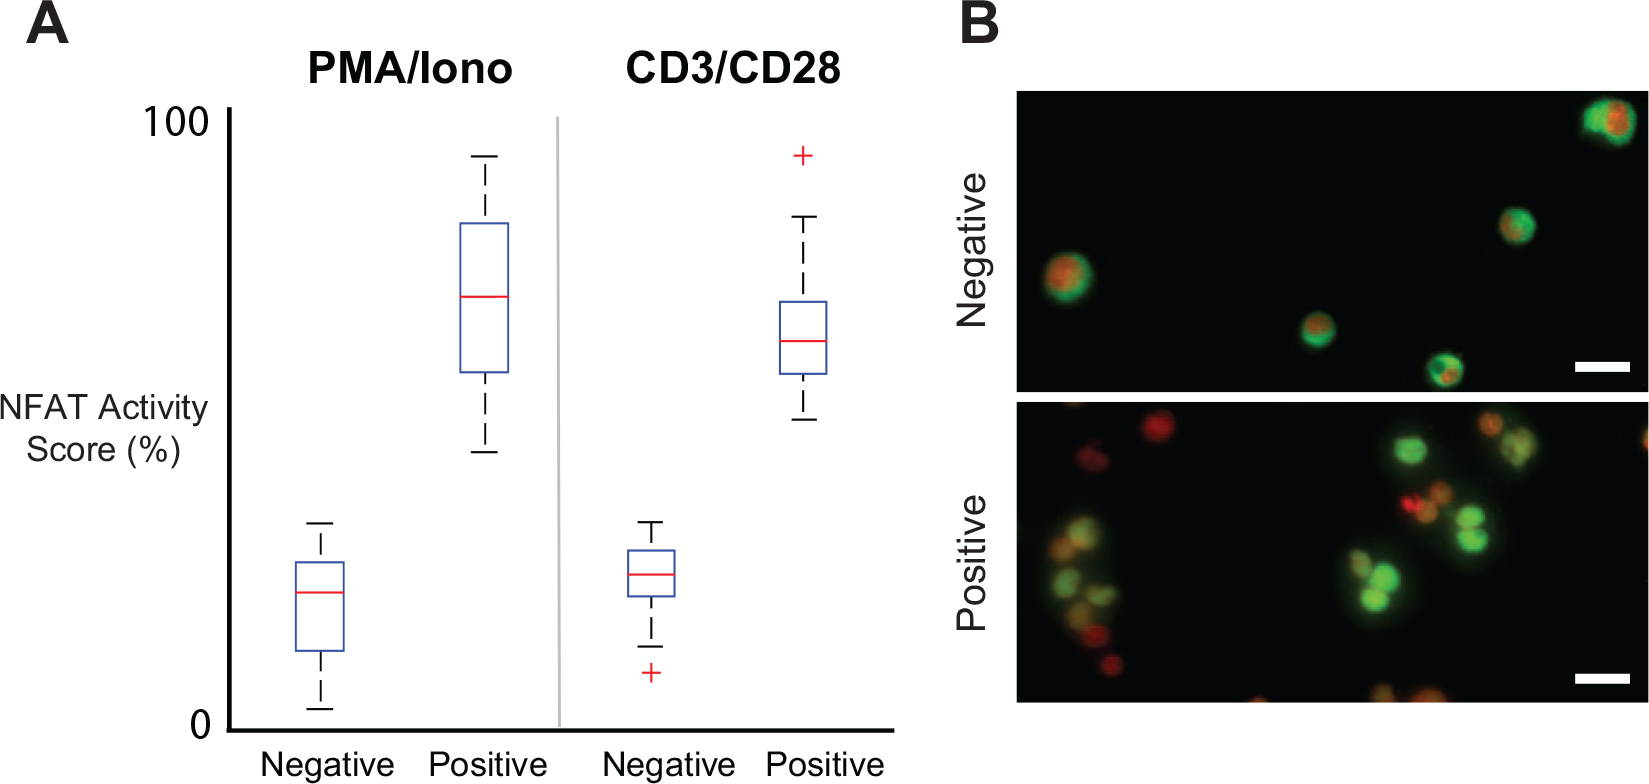
Drug activity boxplots generated from the statistical pipeline. CD4+/CD8+ T cells are purified from donor peripheral blood mononuclear cells, incubated in C10 media supplemented with 20 U/mL rhIL-2 and expanded using anti–T-cell receptor stimulation for 96 h. For the positive control, cells are induced with either phorbol myristate acetate (PMA)/ionomycin or CD3/CD28 antibodies for 30 min at 37 °C. Cells are then fixed, permeabilized, and labeled with immunofluorescence. (
Z′ and SSMD Values for Both PMA/Ionomycin and CD3/CD28 Induction NFAT Translocation Assays. a
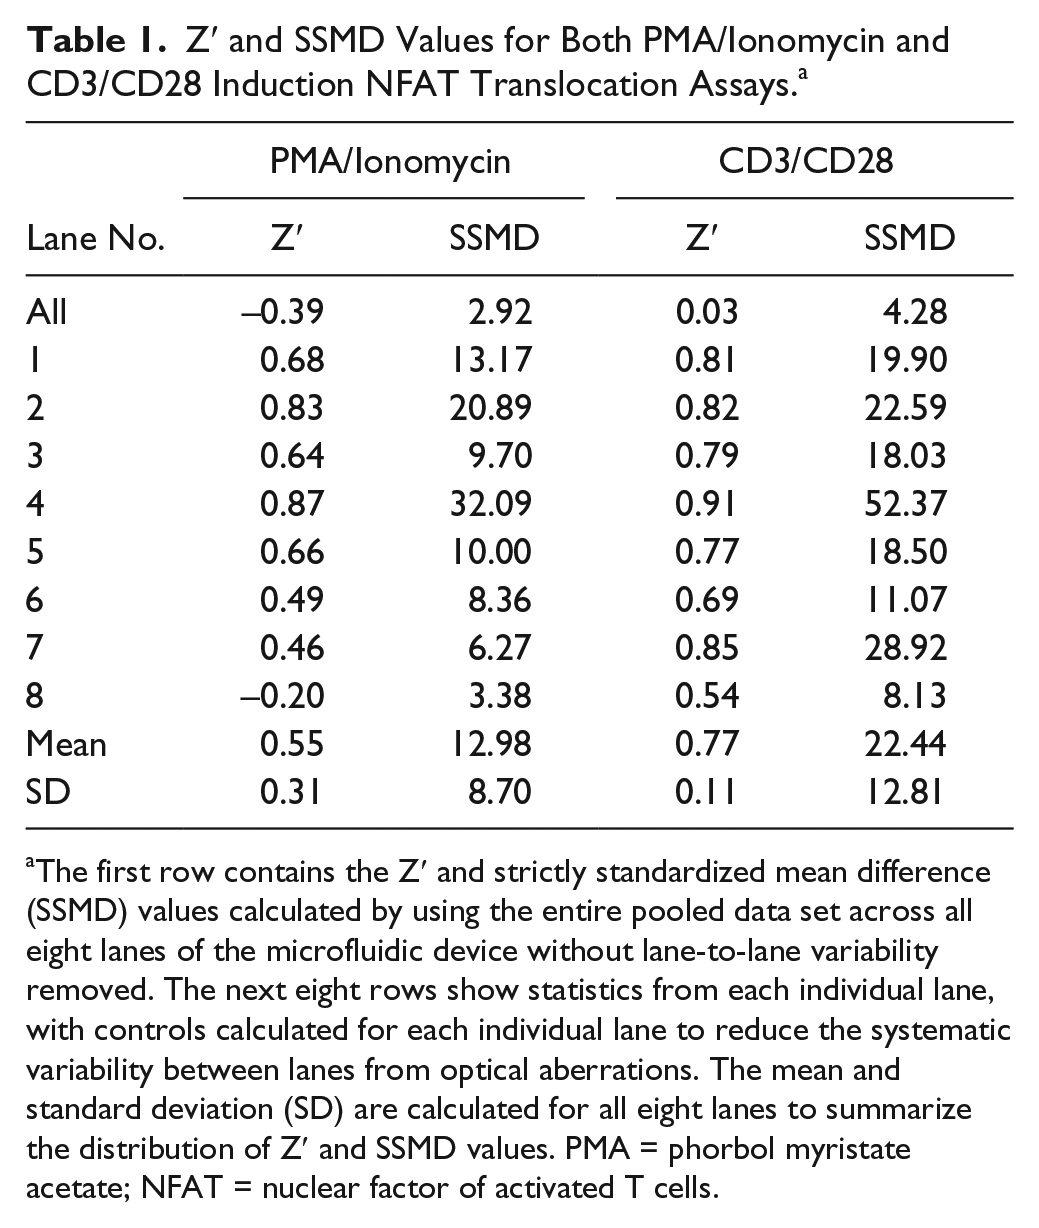
The first row contains the Z′ and strictly standardized mean difference (SSMD) values calculated by using the entire pooled data set across all eight lanes of the microfluidic device without lane-to-lane variability removed. The next eight rows show statistics from each individual lane, with controls calculated for each individual lane to reduce the systematic variability between lanes from optical aberrations. The mean and standard deviation (SD) are calculated for all eight lanes to summarize the distribution of Z′ and SSMD values. PMA = phorbol myristate acetate; NFAT = nuclear factor of activated T cells.
For the more physiological induction, we ran the assay again with the same NFAT translocation readout but with antibody activation. CD3/CD28 antibodies were incubated and cross-linked to induce NFAT translocation as described in the Methods section. We expected the antibody induction to trigger a weaker translocation phenotype for NFAT in comparison with ionomycin, because of inherent biological variance of antibody activation. Surprisingly, however, the activity score separation between the positive and negative controls was stronger (
Fig. 5A
,
To explore the sensitivity of our activity score, we performed both dose-response and temporal-response curves for NFAT translocation. As shown in Supplement C2 , our results conform to the expected anti-CD3/CD28 pathway activation. The EC50 of 0.3 µg/mL is consistent with the existing literature. 34 In the temporal response, the algorithm was able to differentiate between samples at 1 min time points ( Suppl. C3 ). The activity score at each time point represents the fractional phenotypic change during the NFAT translocation of the sample. The first and last time points were used as negative and positive controls for the regression model.
Volume and Cell Count Requirements
Volume efficiency is advantageous for primary cell assays. We operated with a 4 µL sample volume from each well at 2 million cells/mL density (8000 cells). In our protocols, 50 to 150 million purified CD3+ T cells were obtained from each individual donor (15 mL sample), and after staining and washing steps, we achieved 25 to 75 million usable cells, sufficient for a minimum of 3000 to 9000 separate wells from an individual donor.
Comparison with 2D HCS Quality Control Metrics
The high sensitivity of the PMC results from the well-engineered assembly of multiple features into a scoring algorithm and from reduced noise injection during data acquisition. This provides intrinsic advantage by avoiding segmentation and data reduction steps that are typically required with classical 2D HCS. Detailed comparisons with common quality control metrics of 2D imaging assays are discussed in Supplement B1 .
Discussion
One advantage of imaging cytometry (2D or 1D), when compared with classical flow cytometry, is that equivalent information is sometimes obtained with lower staining cost and complexity. A single marker can replace several, or even many, specific antibodies with more direct interpretation. However, the need for expert supervision, both to develop an assay and to maintain assay stability, has limited the acceptance of imaging assays. In this article, we have asked whether a new approach to data reduction can overcome some of the barriers to wider adoption of these methods. Requirements on custom data reduction, data buffering, and limitations on well throughput are all addressed with scalable solutions.
Our premise is that, when compared with raw intensity as used in classical flow cytometry, the intensity-normalized 1D feature calculations may be better in terms of assay stability (maintainable Z′ factor). Normalized features can mitigate uncontrolled sample preparation and instrument artifacts and permit statistically significant well scoring from lower cell counts. The new software provides automated statistical gating, which removes subjectivity and provides an automated calibration for each plate run. The approach is indifferent to the specific induction or the signaling pathway being studied and, with modification, can be applied to other methods, including 2D imaging cytometry analysis. With appropriate positive and negative controls, the regression model automatically generates the best coefficients to obtain maximal separation.
We applied automated statistical gating to a test case using physiological induction of NFAT in human peripheral T cells. The Z′ and SSMD values were sufficient, and large separations were achieved between positive and negative populations. Both NFAT inductions show potential for use in a high-throughput screen. Most important, there were no changes in the data reduction steps between any of the NFAT assays we tested. The statistical learning algorithm self-selected different weighting factors and different features to create a separate weighted classifier for each assay.
Previously,14,15 we examined the tradeoff between pixel count per image (optical resolution) and separating power for 1D imaging. We found that, purely from the point of view of data efficiency, an optimum exists at about 10 pixels per color channel per cell. Collection of more data per cell can add to the data storage requirement and increase downstream data reduction complexity and noise—without increasing separation capability—as further verified here.
In previous publications, we were able to show that the detector collection and signal-to-noise ratio were consistent with a throughput of ten 384-well plates per hour (accepted HCS merit measures).14,15 Advances in electronics are now sufficient to increase this digitization rate by eightfold, with an updated ADC (Vertilon IQSP518) with a maximum 390 kHz sampling rate. Using twin-device switching, as used in a previous DNA-sequencing system, 35 we could eliminate nearly 100% of the refresh time of sample loading and microfluidic recycling. Even at a 96-lane complexity, the system should be able to image across all parallel channels every 25 s, resulting in a throughput of ten 384-well plates every 17 min. We have constructed a pipeline for the statistical analysis that can be applied at this speed for on-the-fly continuous operation without significant data buffering. This would allow screening of more than 350,000 compounds per day on a single instrument.
The technology discussed here occupies an interesting middle ground between classical flow cytometry and established 2D imaging assays. The key aspects are a philosophy of parallel and minimum necessary image data collection, optimized assembly of image features to gain sensitivity in scoring, and new automation through statistical gating, which eliminates operator subjectivity and noisy data reduction steps. We conclude that this approach can be scaled to the speed and volume needed for primary screening.
Footnotes
Acknowledgements
We thank Dr. Wilson Wong for his generous help with T-cell signaling and ideas on research directions, and we thank Man Chin Cheung and Brian K. McKenna for help with data analysis and stimulating discussions.
Supplementary material is available online with this article.
Declaration of Conflicting Interests
The authors declared no potential conflicts of interest with respect to the research, authorship, and/or publication of this article.
Funding
The authors disclosed receipt of the following financial support for the research, authorship, and/or publication of this article: This work was funded in part by the National Institutes of Health under grant RO1 HG-01389.
References
Supplementary Material
Please find the following supplemental material available below.
For Open Access articles published under a Creative Commons License, all supplemental material carries the same license as the article it is associated with.
For non-Open Access articles published, all supplemental material carries a non-exclusive license, and permission requests for re-use of supplemental material or any part of supplemental material shall be sent directly to the copyright owner as specified in the copyright notice associated with the article.