
Abstract
Triple-negative breast cancer (TNBC) is a very aggressive form of breast cancer with few molecularly targeted therapies. We used a novel unbiased approach to identify higher-order synergistic or enhancer combinations of marketed kinase inhibitor drugs that inhibit cell viability of TNBC cell lines. We mixed all 33 kinase-targeted drugs on the market at the time of this study, which allowed for all possible combinations to exist in the initial mixture. A kinase inhibitor group dropout approach was used to identify active groups and then single active drugs. After only three rounds of deconvolution, we identified five single drugs to test further. After further testing, we focused on one novel subset consisting of three kinase inhibitor drugs: dasatinib, afatinib, and trametinib (DAT) that target src family kinases, HER2/EGFR, and MEK, respectively. The DAT combination potently inhibited the proliferation of three TNBC cell lines and modestly inhibited a fourth. However, it was not significantly more potent or synergistic than other two drug combinations of these drugs. The cytotoxic activities of all possible combinations of these three drugs were also analyzed. Compared with all two-way combinations, the three-way DAT combination generated the most cytotoxicity and the highest synergies for two of the four cell lines tested, with possibly mild synergy in a third cell line. These data indicated that the DAT combination should be evaluated for efficacy in an in vivo model of TNBC and may provide a novel combination of existing drugs for the treatment of a subset of TNBC cases.
Introduction
Approximately 15%–20% of breast cancers lack expression of the hormone receptors estrogen receptor (ER) and progesterone receptor (PR) and lack overexpression of the Her2 cell surface receptor and are referred to as triple-negative breast cancer (TNBC) due to lack of these clinical markers. 1 There is significant overlap between the basal molecular subtype and the clinical marker defined as TNBC, which is a very heterogeneous category. TNBC has the lowest 5-year survival rates compared with other subtypes of breast cancer. Currently, only one molecularly targeted therapy is approved by the Food and Drug Administration (FDA) for TNBC. This approval was based on a recent clinical trial showing improved progression-free survival and overall survival for a subset of TNBC patients treated with the combination of atezolizumab, a PD-L1 checkpoint inhibitor monoclonal antibody, and nab-paclitaxel. 2 Thus, more treatment options are needed for this subtype of breast cancer.
Most cancer treatments are combinations of drugs with different mechanisms of action that more effectively inhibit tumor growth and/or metastasis and possibly slow outgrowth of drug resistance. New combinations, especially synergistic ones, are needed for TNBC. Synergy can be determined and quantified based on the drug concentration–response data generated by testing each drug/compound on its own and in combination. One frequently used method of determining synergy was developed by Chou and Talalay based on the law of mass action, which was employed for the determination of a combination index (CI) value. 3,4 Using this method, CI values of <1 indicate synergy; 1, additivity; and >1, antagonism. The developers of this method and others have suggested that CI values of <0.1 indicate “very strong synergism”. 4,5 For valid CI calculations, all single compounds need to have measurable activity. When one compound has no activity by itself, but increases the activity of another active compound, it is referred to as a potentiator or enhancer, not synergy, and this effect can simply be quantified in fold or percentage increase of observed activity. Synergistic combinations are discovered in a number of different ways, including the testing of many two-way combinations of single active agents, random screening, rationale selection based on mechanisms, or computational determination.
There have been many reports of in vitro synergistic drug combinations for TNBC cell lines and other cancer types. Many of these synergistic combinations employ kinase inhibitor compounds or drugs. Most kinase inhibitor drugs on the market inhibit multiple kinase targets due to the high homology of the ATP binding pocket of kinases, where most kinase inhibitors bind. The marketed drug dasatinib has been approved for patients with Philadelphia chromosome-positive chronic myeloid leukemia (CML). Dasatinib inhibits the Abl kinase, which provides efficacy in CML, 6 but it has also been reported to potently inhibit src family kinases, such as Src and Lyn, and other kinases, such as DDR2. 7 -9 Dasatinib has potent activity in inhibiting the proliferation of many TNBC cell lines in vitro, 10,11 but failed to have activity against this cancer in monotherapy clinical trials. 12 EGFR/ErbB1 inhibitors, such as afatinib and lapatinib, have also been shown to have activity against breast cancer cell lines that overexpress EGFR, including some TNBC cell lines. 13 Trametinib and other MEK inhibitors (MEKi) have also been shown to have activity in inhibiting TNBC cell proliferation. 14 All two-way combinations of these agents or agents in the same target class have been reported to be synergistic for inhibiting TNBC cell line growth and include dasatinib and afatinib (or other HER2/EGFR inhibitors), 13 EGFRi and MEKi, 15 and dasatinib and a MEKi. 16
In this work, we sought to undertake an unbiased approach to identify novel combinations of kinase inhibitor drugs that synergistically inhibit cell proliferation and induce the cell death of TNBC cells. Of particular interest was the identification of higher-order combinations of drugs, that is, combinations of more than two drugs. Starting from a single solution of 33 kinase inhibitor drugs that had weak activity in a cell viability assay, we deconvoluted the observed inhibitory activity using a kinase inhibitor group dropout scheme until we identified single drugs. From this set of single drugs, we identified a triple combination of DAT that not only potently inhibited cell proliferation, but also enhanced the induction of cell cytotoxicity in two of four TNBC cell lines in a manner that was more synergistic than all the other two-way combinations in this group.
Materials and Methods
Materials
Common reagents such as DMSO were reagent grade or cell culture quality and were obtained from Thermo Fisher Scientific (Waltham, MA) or Sigma-Aldrich (St. Louis, MO). Cell culture media, fetal bovine serum (FBS), and supplements were purchased from Thermo Fisher Scientific. All FDA-approved kinase inhibitor compounds were obtained from Selleckchem (Houston, TX). Compounds were dissolved in 100% DMSO stock solutions and stored at –20 °C. Compound mixtures were created by mixing 1 mM compound stock solutions in 100% DMSO at the indicated ratios by volume.
Cell Culture
The HCC1143, HCC1806, MDA-MB-468, and BT-20 cell lines were obtained from American Type Culture Collection (ATCC, Manassas, VA) and cultured at 37 °C in an atmosphere of 5% CO2 and 95% humidity in growth media. ATCC authenticates cell line identity using short tandem repeat (STR) DNA profiles. The cells were passaged and assayed in growth media consisting of DMEM–high-glucose media supplemented with 10% FBS, 2 mM
High-Content Cell Proliferation and Cytotoxicity Assay
The high-content assay (HCA) method was based on and adapted from reports using the dyes Hoechst 33342 and YOYO-1 for nuclei enumeration and cell death determination, respectively. 17,18 For the 96-well version of this assay, cells (4000–6000 cells/well) in 100 µL of complete culture media were added to wells of a 96-well assay plate (black plate with clear flat bottom; cat. 3904; Corning, Corning, NY) using a Thermo Fisher Scientific Multidrop Combi reagent dispenser. The cell plate was then incubated on the benchtop for 45 min before putting it into the incubator. The D300 Digital Dispenser (Tecan, Morrisville, NC) with a T8 or T4 cassette was loaded with DMSO (solvent control) and 1 mM stock solutions of single compounds and premade compound mixtures in 100% DMSO. Compounds/DMSO were directly delivered to the assay plate containing cells following the manufacturer’s procedure for the instrument. The D300 was used to create 8-point half-log serial dilutions starting at a high final concentration of 0.3 or 1 µM, and DMSO was added to adjust all wells to the same final DMSO concentration of 0.1%. Control wells that only received DMSO were performed to determine maximum proliferation and baseline cell death. To determine the number of cells at the start of the assay, we also added 10 µM cycloheximide (CHX) to control wells at the same time as other compounds. CHX inhibits cell proliferation. The plate was then sealed with a sealing membrane (Breathe-easy; Sigma-Aldrich). The compound-treated plate was then incubated for 96 h in a standard incubator. After the 96 h, cytotoxic control wells were adjusted to 0.1% Triton X-100 in growth medium. Subsequently, a 6× dye mix consisting of normal growth media plus 3 or 6 µg/mL (depending on cell line) Hoechst 33342, 600 nM Yoyo1, and 24 mM HEPES was added to each well (20 µL/well). Thus, the final concentration from the dye mix was 0.5 or 1 µg/mL Hoechst 33342, 100 nM YOYO-1, and 4 mM HEPES. The plate was then incubated in a 5% CO2 incubator for 1–2 h and imaged on a Thermo Fisher Scientific CellInsight NXT high-content screening platform with a 4× objective lens. Total nuclei (Hoechst-positive objects) in the counted area for each well were normalized to the average nuclei count in DMSO control wells to generate a percent of control for cell counts, such that no inhibition of cell proliferation was represented as 100%. The percent of these cells with compromised membranes (dead cells) was identified by the instrument software as a percentage of Hoechst-positive objects that are also YOYO-1 positive, that is, above the background for green fluorescence from the YOYO-1 stain. Specific percent cytotoxicity was calculated by subtracting the background percent YOYO-1-positive cells in DMSO wells from treated wells. Dose–response data were analyzed using GraphPad Prism graphing software (La Jolla, CA). The 50% growth inhibition (GI50) values were calculated by using a four-parameter curve fit where the bottom was fixed to the cell number (as percent of control) obtained from the CHX control wells. The 384-well version of the HCA was performed similar to the 96-well assay, except for the following modifications. Compete media (25 µL) was added to a 384-well plate (Costar cat. 3712) first, followed by 25 µL of cells (900–1100 cells/well) in complete media using a Multidrop dispenser. After the addition of 10 µL of dye mix, the 10× objective on the CellInsight instrument was used to acquire images.
Resazurin-Based Cell Viability Assay
The resazurin-based 384-well assay was performed in a similar fashion to the 384-well HCA described above, except at the end of the incubation period (96 h), 6 µL of 10× resazurin solution (PrestoBlue; Thermo Fisher) was added with a Multidrop and the plate was incubated in the incubator. After 1 h, fluorescence was detected with the BMG Pherastar, using excitation/emission wavelengths of 485/525 nm. An additional control was performed where wells that just received media (no cells) were used to establish 0% viability and used along with DMSO controls to calculate the percent of control values. For GI50 determinations, no cell growth was determined using control wells where resazurin was added and read the same day as the compounds were added to the plate (0-day reading). Thus, DMSO and 0-day control wells were used to calculate the percent inhibition of cell growth and GI50 values.
Synergy Determinations
CI values were calculated using the method of Chou and Talalay 3,4 and the CompuSyn software program (www.combosyn.com) using only the HCA data. CI values for cell proliferation were determined by using fractional inhibition values (fraction affected, Fa values) from the percent of control nuclei counts at each compound/combination concentration. The CI value for an experiment was determined by averaging the CI values obtained at 50%, 70%, and 90% inhibition (if achieved) of cell proliferation, as suggested by Bijnsdorp et al., 5 based on DMSO (100% proliferation) and CHX (0% proliferation) controls. This average CI value for an experiment was then used to calculate the average for replicate experiments (n = 3 biological replicates, except where indicated) and reported as CI value ± standard deviation (SD) in this report. CI values for cell cytotoxicity were determined by using specific percent cytotoxicity (converted to fractional form) as Fa values for the tested concentrations. The actual CI values calculated by the software program for each concentration (30–1000 nM) were averaged to give an average CI value for each experiment, and then these CI values were averaged for n = 3 replicate experiments and presented with SD. CI values were not determined unless there was activity in all the single-compound treatments. However, in some cases, where one compound had no activity by itself, two-way combinations were treated as a single compound plus another active single compound in order to assess the synergy of a three-way combination.
Results
Drug Combination Discovery Approach
The goal of this study was to identify novel higher-order (i.e., more than two drugs) combinations of FDA-approved kinase inhibitors that may be useful in treating TNBC. Since it would not be possible to test all combinations of 33 drugs (∼8.7 × 10
36
combinations), we sought to test a novel scheme to identify synergistic and/or enhancer combinations using standard cell viability and HCA cell proliferation and cytotoxicity assays (
Fig. 1
). We began by mixing together, at equimolar ratios, all 33 kinase inhibitor drugs on the market at the start of this study (
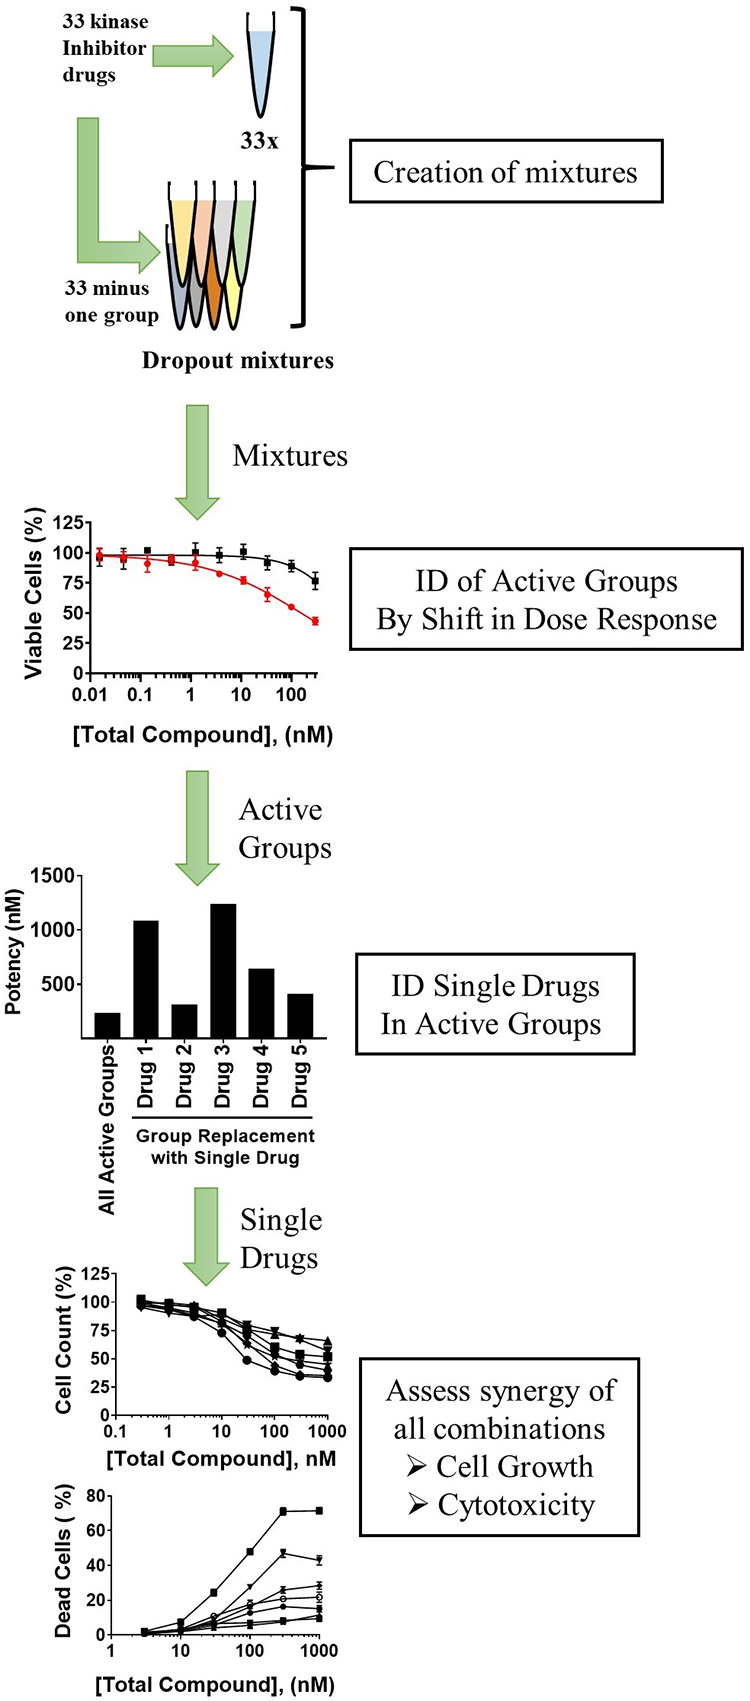
Drug combination discovery scheme. A solution consisting of an equimolar mixture of 33 kinase inhibitor drugs (33×) was created along with separate dropout solutions containing all drugs except for one group. These mixtures were tested in dose–response in a cell proliferation/viability assay. A shift by the dropout mixtures, compared with 33×, in potency and/or efficacy to reduced activity indicated that the excluded group contributed to the observed activity and was considered an active group. Active groups were deconvoluted to single drugs by substituting groups with one member of the group and testing for inhibition at a single concentration or in dose–response. Subsequently, all possible drug combinations from the pool of identified single drugs were assessed for potency/efficacy and synergy for inhibiting cell proliferation and inducing cytotoxicity using an HCA.
Three Rounds of Selection Led to a Pool of Four Single Drugs
We started the selection scheme using the basal-like TNBC cell line HCC1143 and a resazurin-based metabolic cell-based assay. We employed this assay in the 384-well format using the D300 digital dispenser to delivery compound mixtures and created dose–response wells. The 33× mixture of all kinase inhibitors produced an average absolute IC50 and GI50 of 165 and 66 nM, respectively (
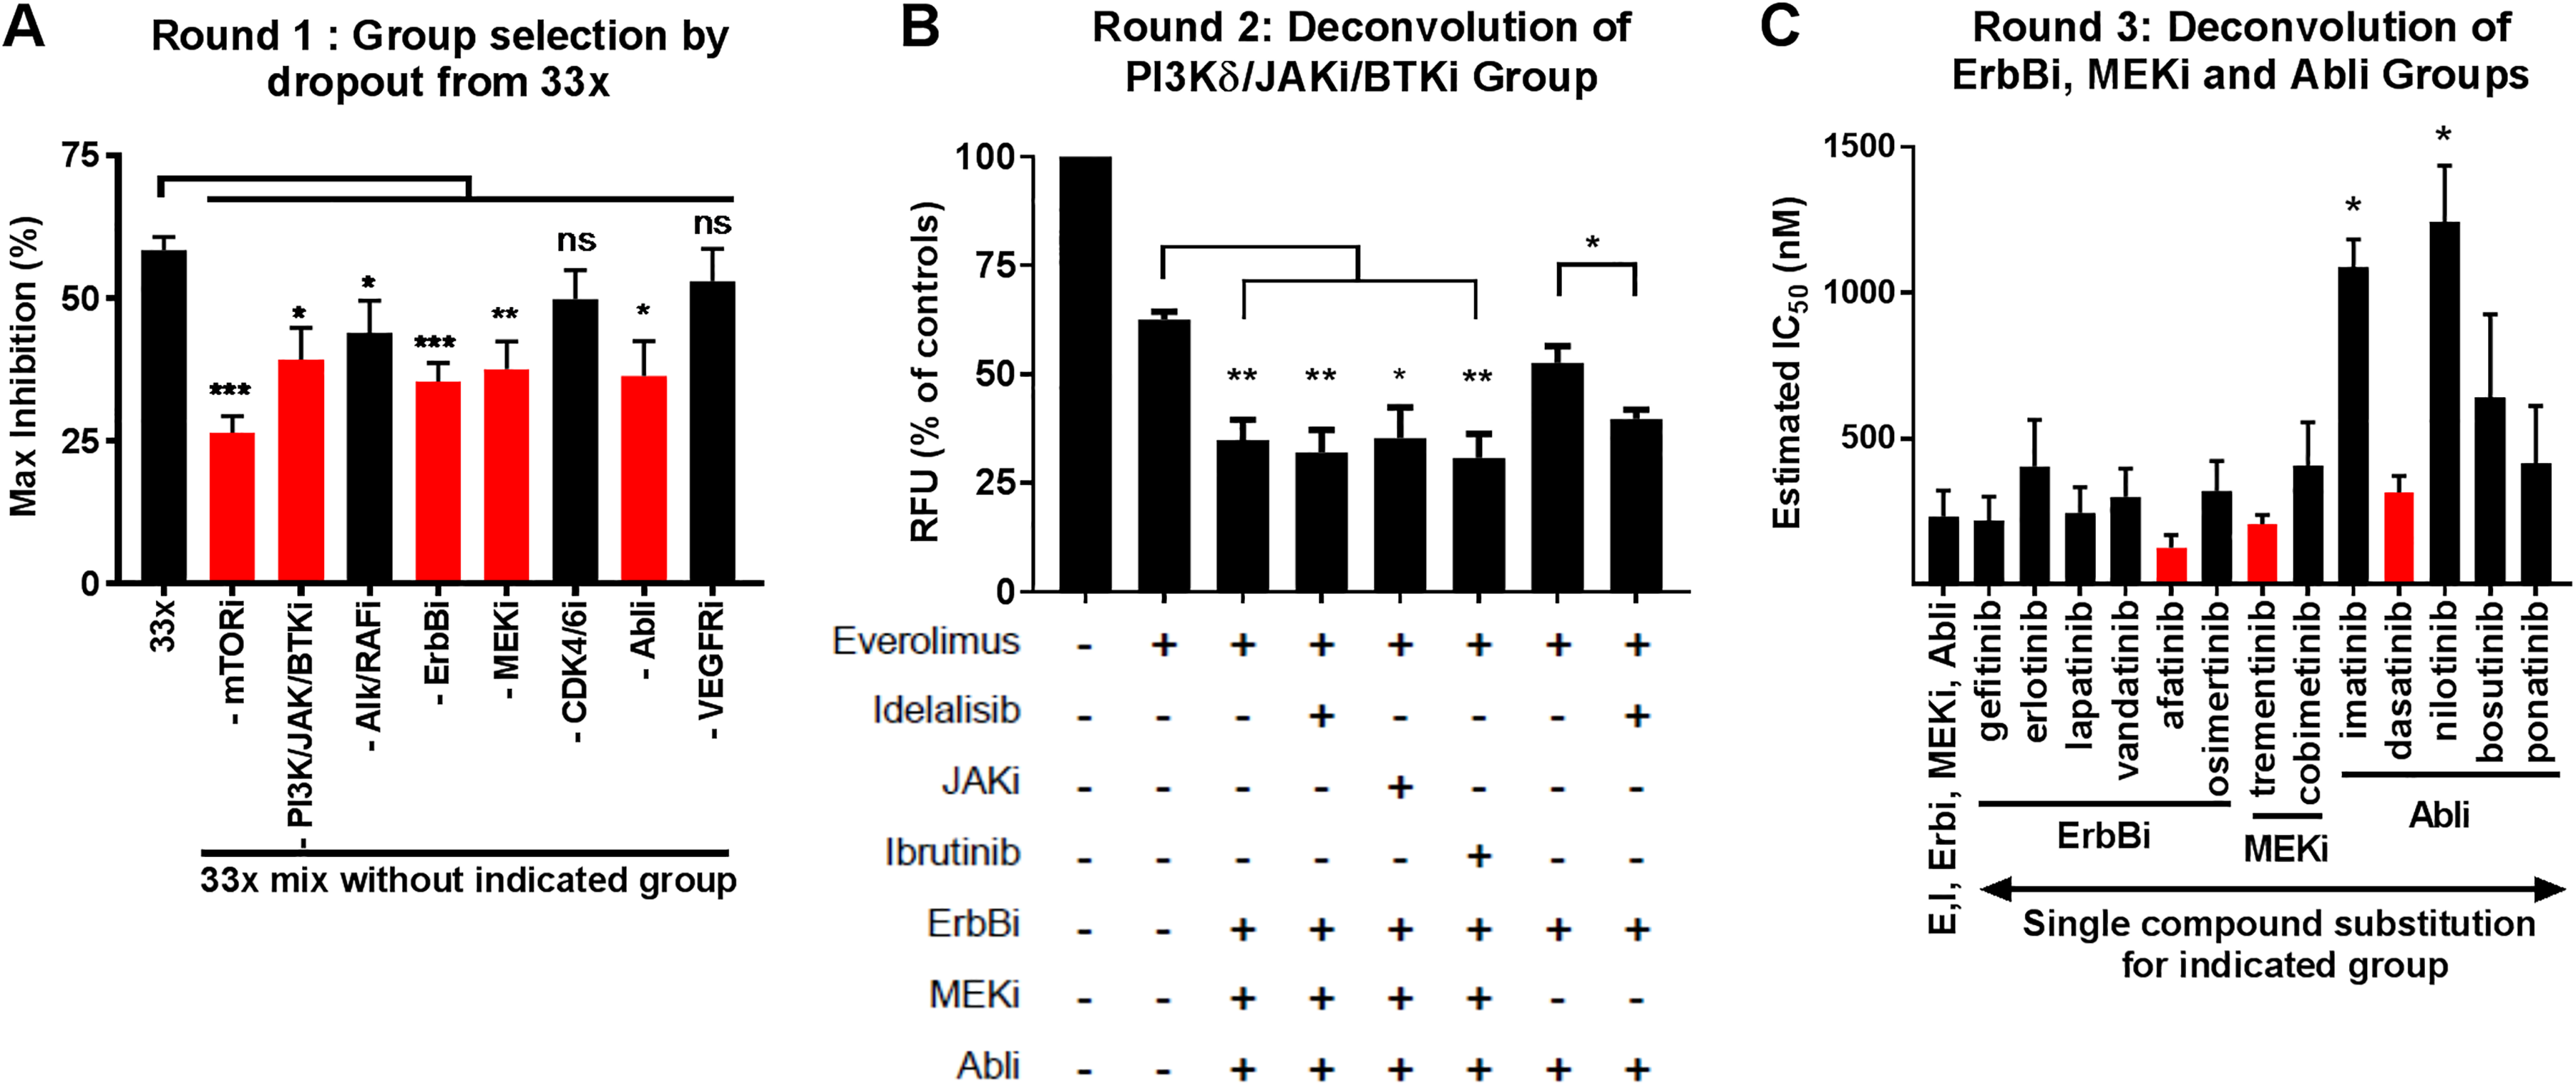
Summary data for three rounds of selection for active groups and pool of single drugs. Compound mixtures were assessed for activity in the resazurin-based cell viability assay. Compound concentrations were at an equimolar ratio to each other in the mixtures except in rounds 2 and 3, where the everolimus concentration was reduced a 1:30 ratio of everolimus to other compounds, respectively. (
In order to deconvolute super group B, mixtures were created from all the active groups, except super group B was replaced with individual compounds (idelalisib or ibrutinib) or group (JAKi) and inhibition was determined at 300 nM (total) ( Fig. 2B ). These initial data suggested that the PI3Kδ inhibitor idelalisib (I) may be active in the absence of MEKi, but none of the other compounds enhanced activity in this cell viability/proliferation assay. Next, we sought to deconvolute the other groups (ErbBi, Abli, MEKi) by creating mixtures consisting of E, I, and the ErbBi, Abli, and MEKi groups, except that one member of each group was tested to see if it could replace the whole group ( Fig. 2C ). Substitution with individual compounds for the groups resulted in little significant potency (IC50) differences within each group, except for imatinib and nilotinib, which shifted the mixture to significantly less potent when replacing the Abli group. Thus, we chose the one compound in each group that produced the lowest average IC50 value and most reproducible values (smallest SD), though not significantly different. We chose dasatinib (D) from the Abli group, afatinib (A) from the ErbBi group, and trametinib (T) from the MEKi group.
We tested all of the single identified compounds, EDAIT, individually and in all possible two-, three-, and four-way combinations, resulting in 31 combinations tested in dose–response in the resazurin cell viability assay (
Assessment of Antiproliferative and Cytotoxic Activities of All Combinations of EDAT
We retested all 16 combinations of the four remaining drugs, EDAT, using an HCA to measure both cell proliferation and cytotoxicity. This live cell HCA used Hoechst nuclei stain to identify and count cells and the membrane-impermanent YOYO-1 dye to determine the percentage of identified cells that are YOYO-1+, which were taken as dead cells. We tested the EDAT combinations using three basal-like TNBC cells lines, HCC1143, HCC1806, and MDA-MB-468 (
Figs. 3
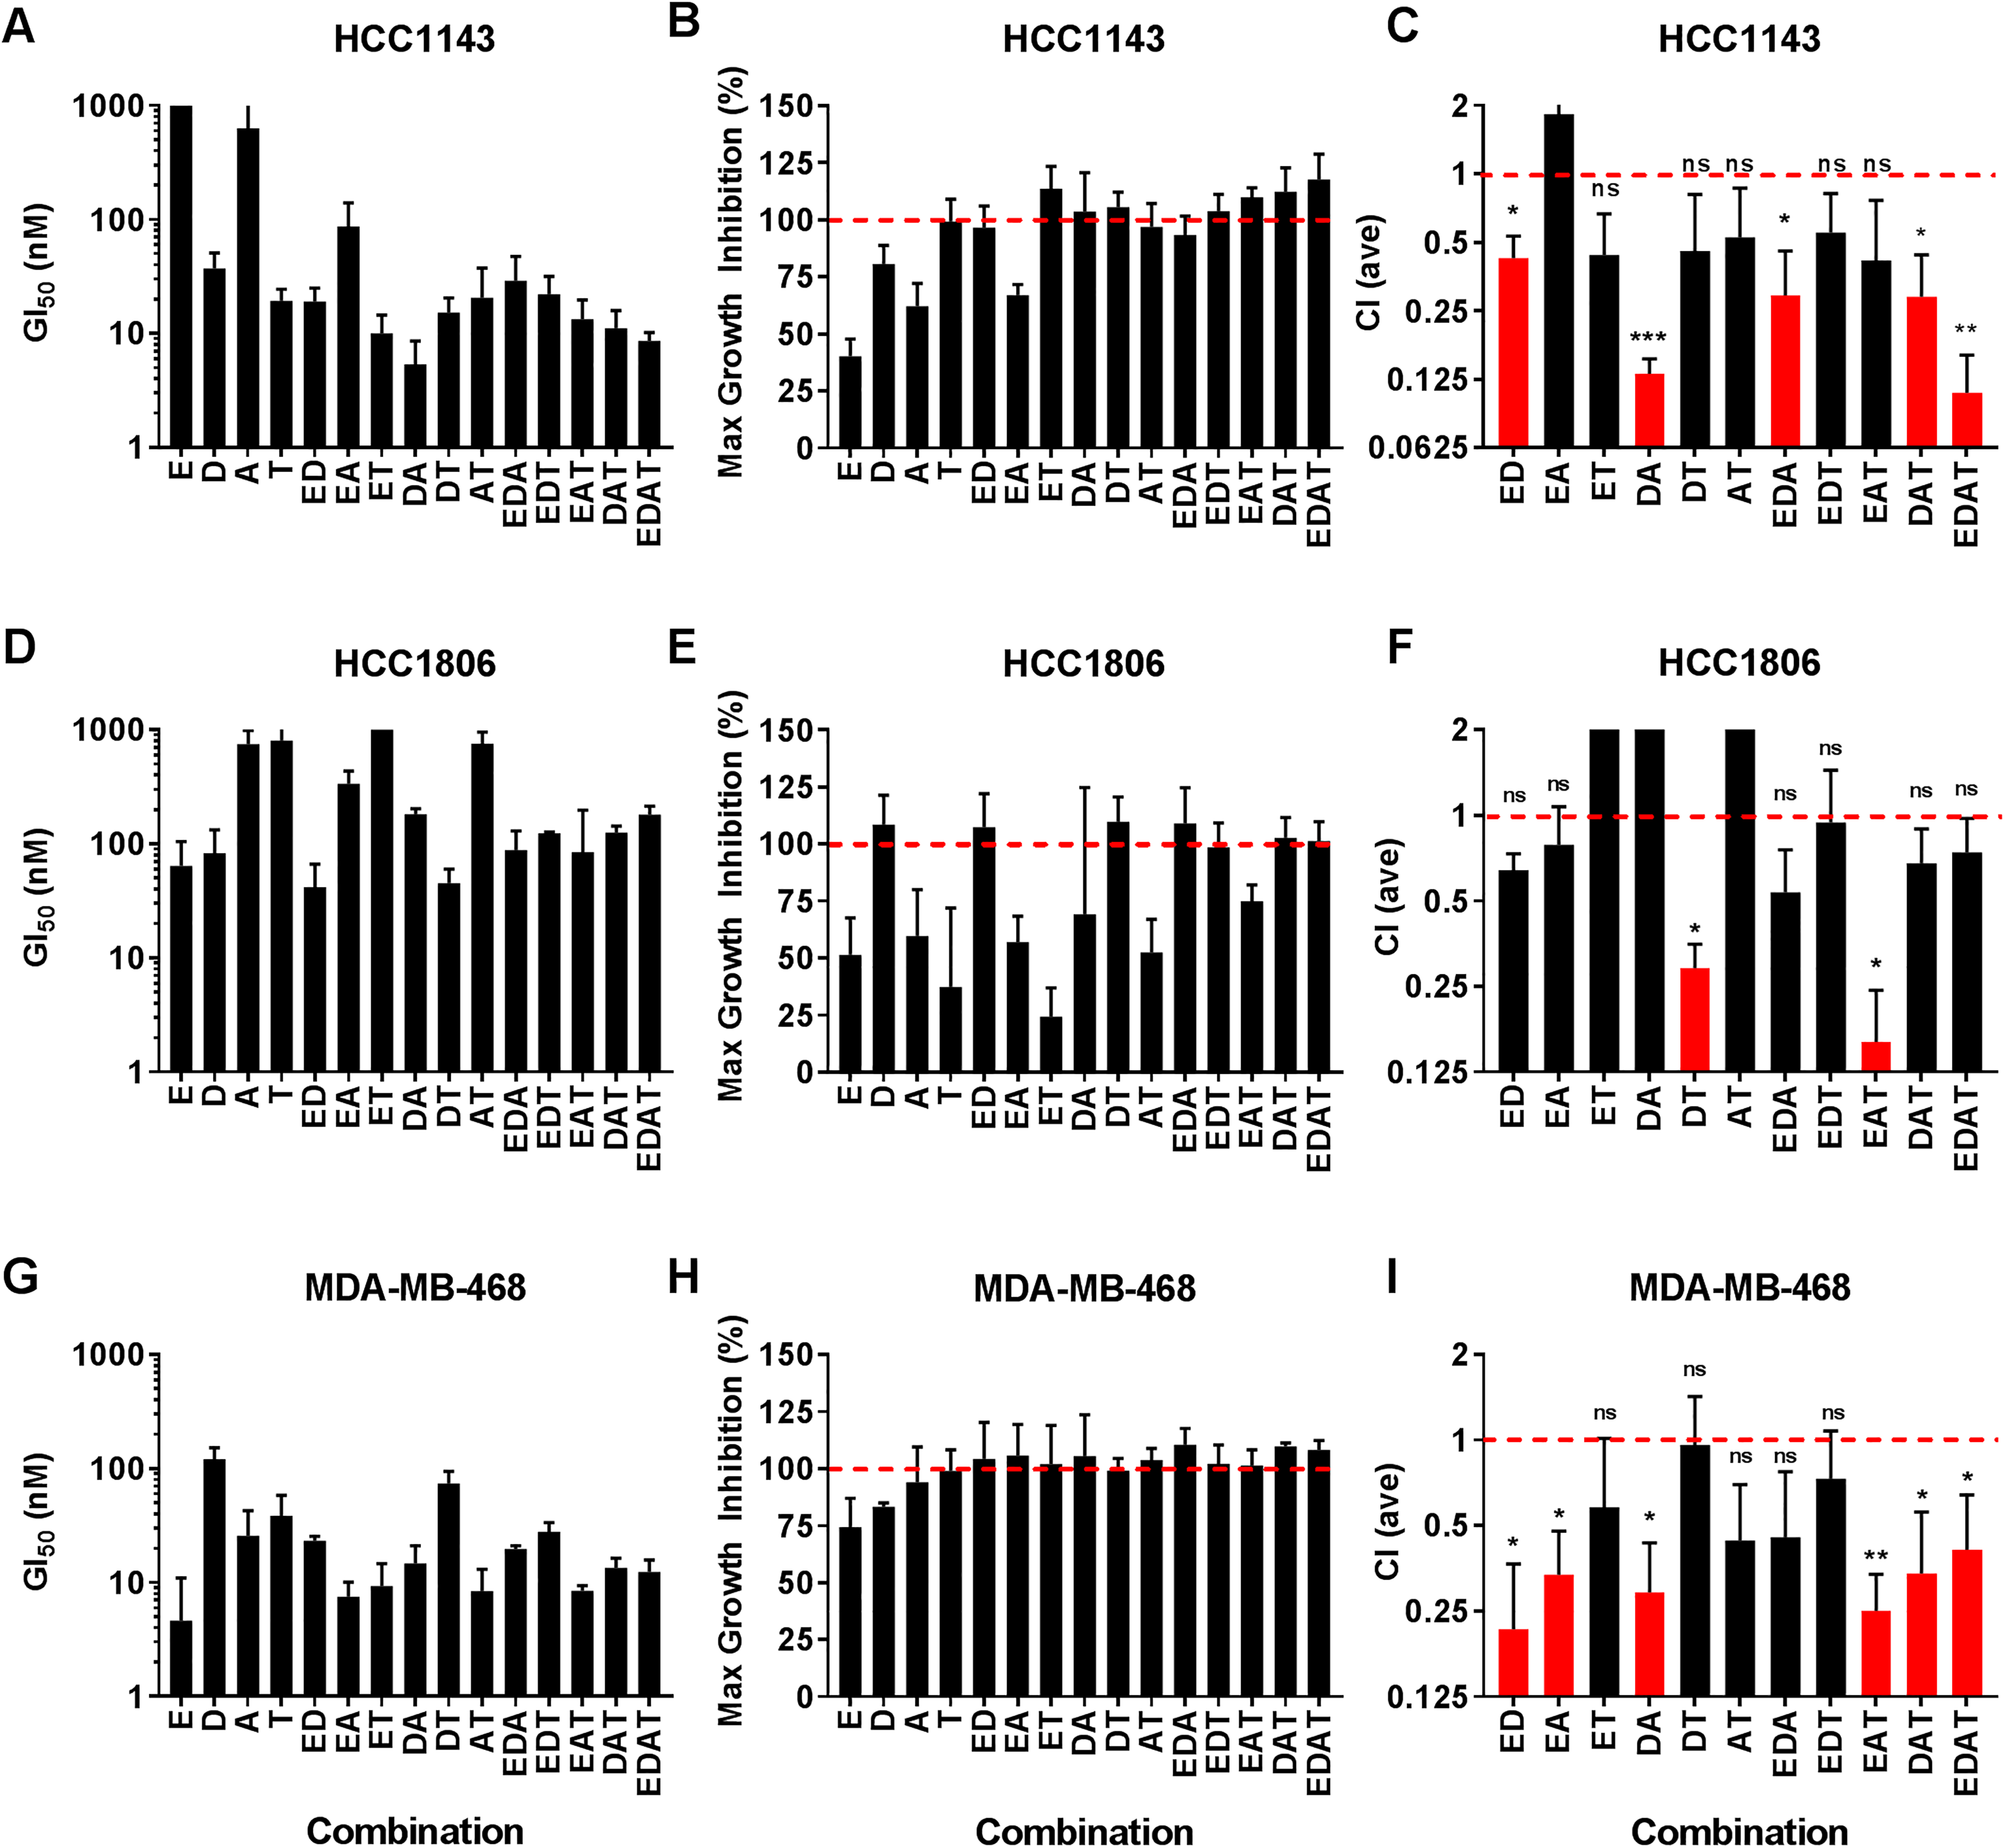
Potency, efficacy, and synergy of all combinations of the drugs EDAT for inhibiting cell proliferation. HCC1143, HCC1806, and MDA-MB-468 cell lines were treated with all combinations of EDAT, as indicated, in dose–response with a high concentration of 1 µM total compound. Compounds were at a fixed 1:1 ratio with each other except those combinations that included everolimus, where a 1:30 ratio of everolimus to other compounds was employed (e.g., EDAT was at 1:30:30:30, respectively). Cell number and proliferation were determined by the HCA method. (
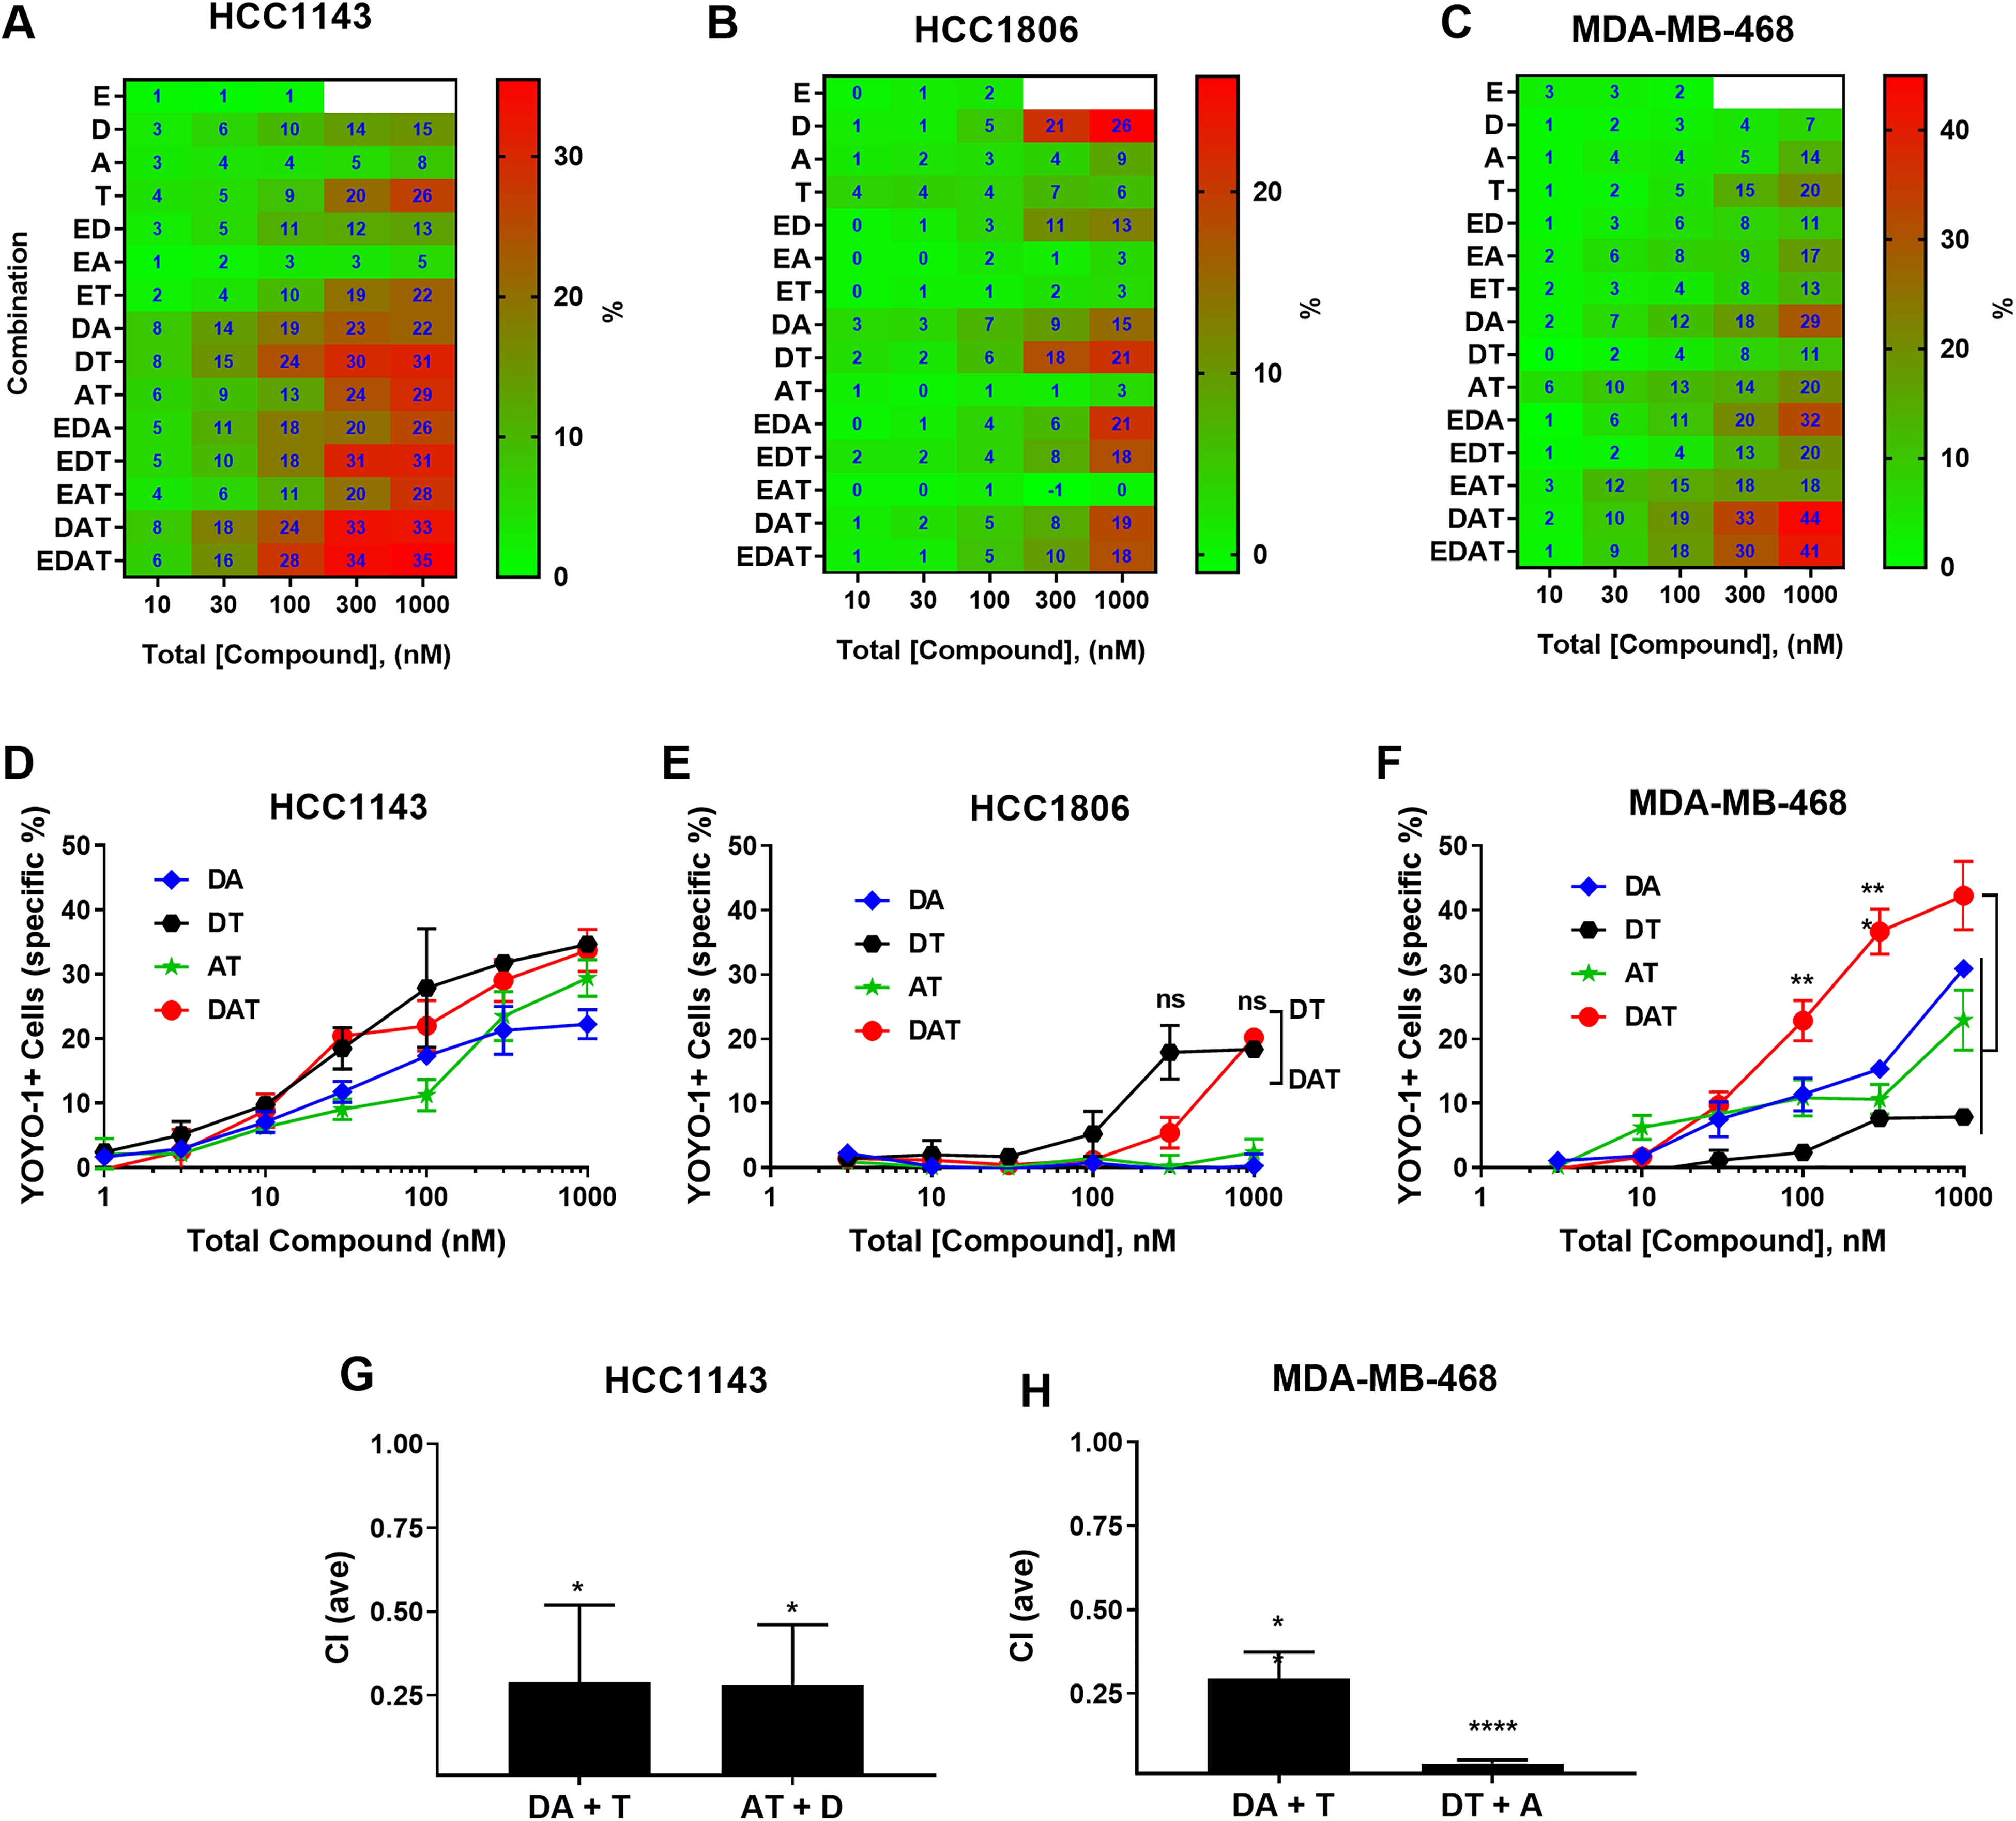
Potency, efficacy, and synergy of all combinations of the drugs EDAT for inducing cell death. HCC1143, HCC1806, and MDA-MB-468 cell lines were treated with all combinations of EDAT, as indicated, in dose–response with a high concentration of 1 µM total compound. Compounds were at a fixed 1:1 ratio with each other except those combinations that included everolimus, where a 1:30 ratio of everolimus to other compounds was employed (e.g., EDAT was at 1:30:30:30, respectively). Specific cytotoxicity was determined by the HCA method. (
We also analyzed the cytotoxicity data generated with the HCA as determined by calculating the percent of stained nuclei that are YOYO-1 positive ( Fig. 4 ). For the HCC1143 cells ( Fig. 4A ), enhanced cytotoxicity was observed for DA, DT, DAT, and EDAT combinations at lower concentrations compared with single drugs. HCC1806 ( Fig. 4B ) appeared relatively refractory to the induction of cytotoxicity with these combinations, with cytotoxicity only observed at concentrations of 300 and 1000 nM. Furthermore, all-way synergy/antagonism calculations were not possible with the HCC1806 cytotoxicity data set since E, A, and T single-compound treatments generated little to no cytotoxic activity and a requirement for synergy calculations is that each drug has activity on its own. D was the only one of the four compounds tested (E, D, A, T) to have significant activity on its own. Other than DT, all the combinations with D had reduced cytotoxicity compared with D alone. Since E, A, and T each had no activity alone, it was not possible to perform synergy calculations for the combinations to determine formal antagonism (CI > 1). Thus, other than DT, the activity of dasatinib in combinations in this cell line was reduced due to a dilution effect and/or inhibitor activity. For example, it appears that E is an inhibitor of D-induced cytotoxicity in the ED and EDT combinations, and this is not a dilution effect since E is present at low concentration (1:30 ratio with other compounds). In the MDA-MB-468 cell line ( Fig. 4C ), enhanced cytotoxicity was observed with several combinations compared with single compounds, especially with the DA, EDA, EDAT, and DAT combinations, which had the highest cytotoxicity. In comparing EDAT and DAT, they both induced similar levels of cytotoxicity in HCC1143 and MDA-MB-468, indicating no positive impact from E. In general, everolimus was potently antiproliferative, but with modest (incomplete) efficacy and no cytotoxicity in these cell lines, in agreement with Gautam et al. 20 In addition, no everolimus containing combination appeared to have enhanced cytotoxicity compared with the same combination without everolimus, with E containing combinations having similar values (e.g., DAT vs EDAT) or even an antagonistic effect (e.g., HCC1806, DT vs EDT). Furthermore, the antiproliferative EAT combination did not induce any cytotoxicity against any of the cell lines. Thus, we dropped the pursuit of E-containing combinations.
DAT Displayed Synergistic Antiproliferative and Cytotoxic Activities
DAT had synergistic antiproliferative activity in two of the three cell lines (HCC1143 and MDA-MB-468) and induced cytotoxicity in these same two cell lines, which was particularly enhanced in MDA-MB-468 compared with all the other single and two-way combinations for this cell line (
Figs. 3
Ratio-Optimized DAT Displayed Enhanced Synergy for Inducing Cell Death
We speculated that the molar ratio of 1:1:1 used for DAT may not be optimal, based on differences in observed potencies for the individual compounds. Switching to a 96-well format HCA, we screened a range of ratios against MDA-MB-468 at 100 nM total compound for both AT, one of the more potent two-way combinations, and DAT (
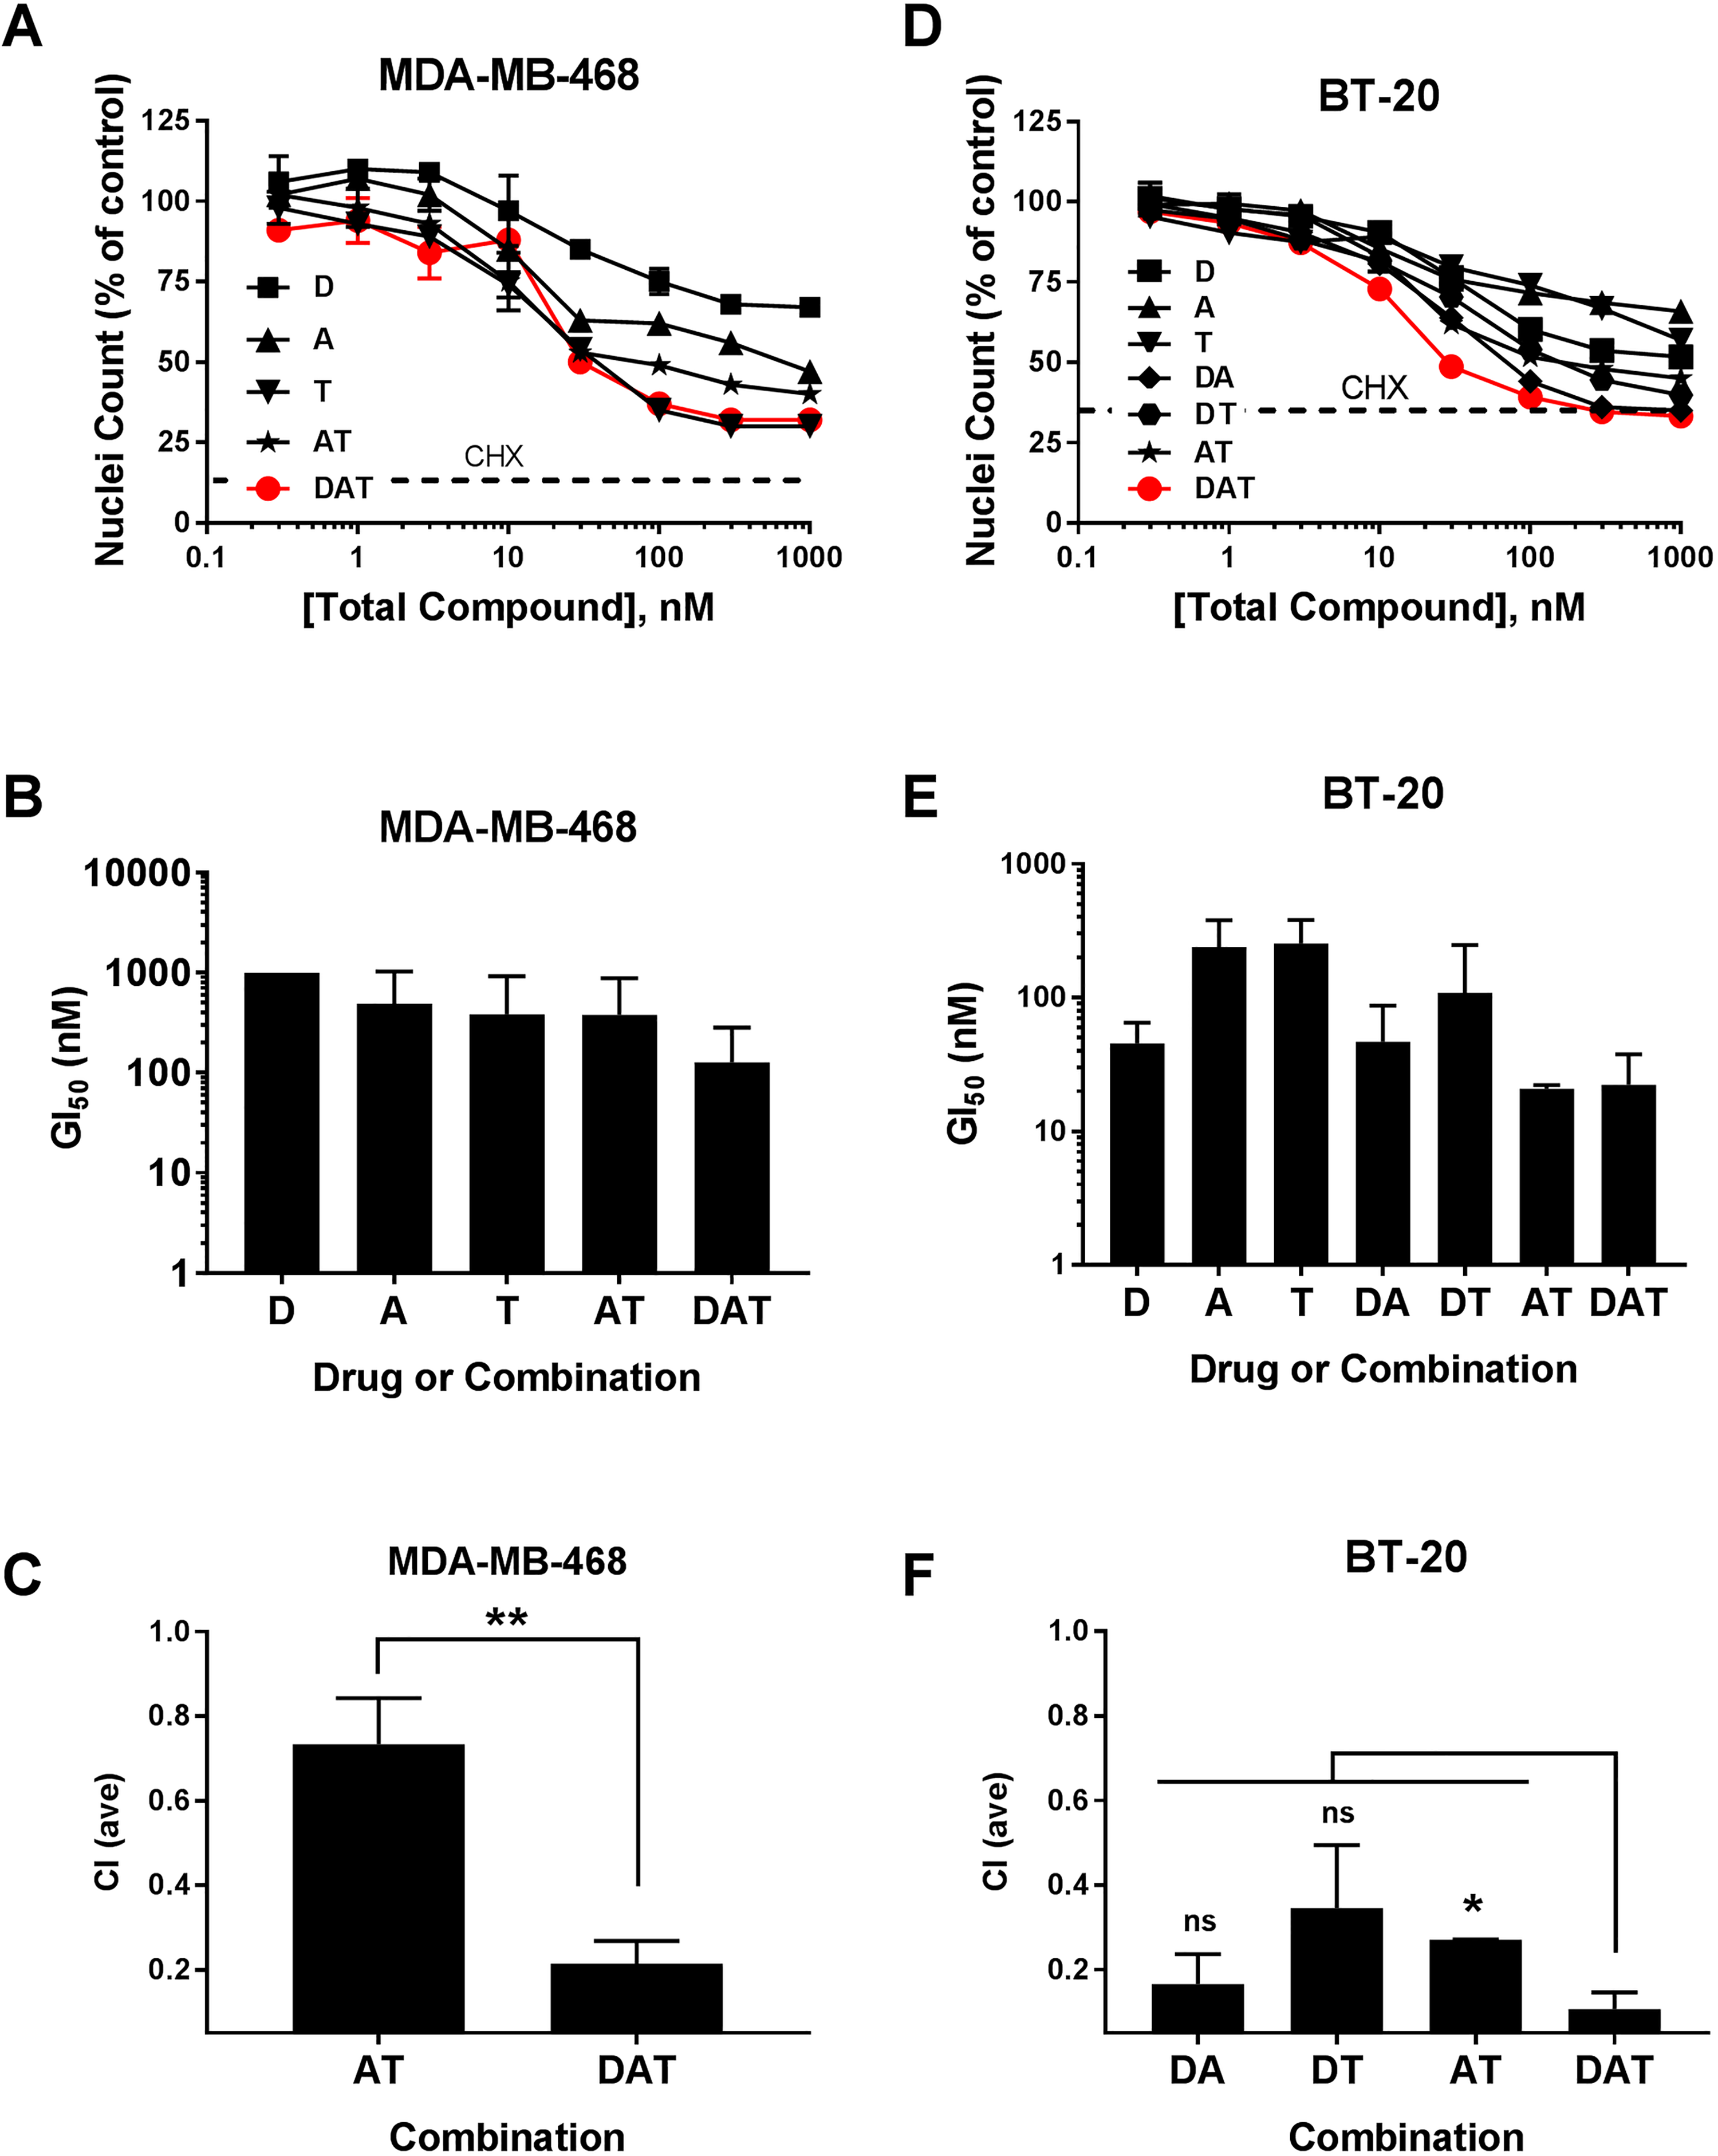
Antiproliferative activity of DAT combinations for two TNBC cell lines. The MDA-MB-468 and BT-20 cell lines were treated with single drugs and AT/DAT (MDA-MB-468) or all combinations of DAT (BT-20), as indicated, in dose–response with a high concentration of 1 µM total compound in 96-well format. The ratios for the combinations were fixed as follows: D:A, 4:3; D:T, 4:1; A:T, 3:1; and D:A:T, 4:3:1. Cell number and proliferation were determined by the HCA method. (
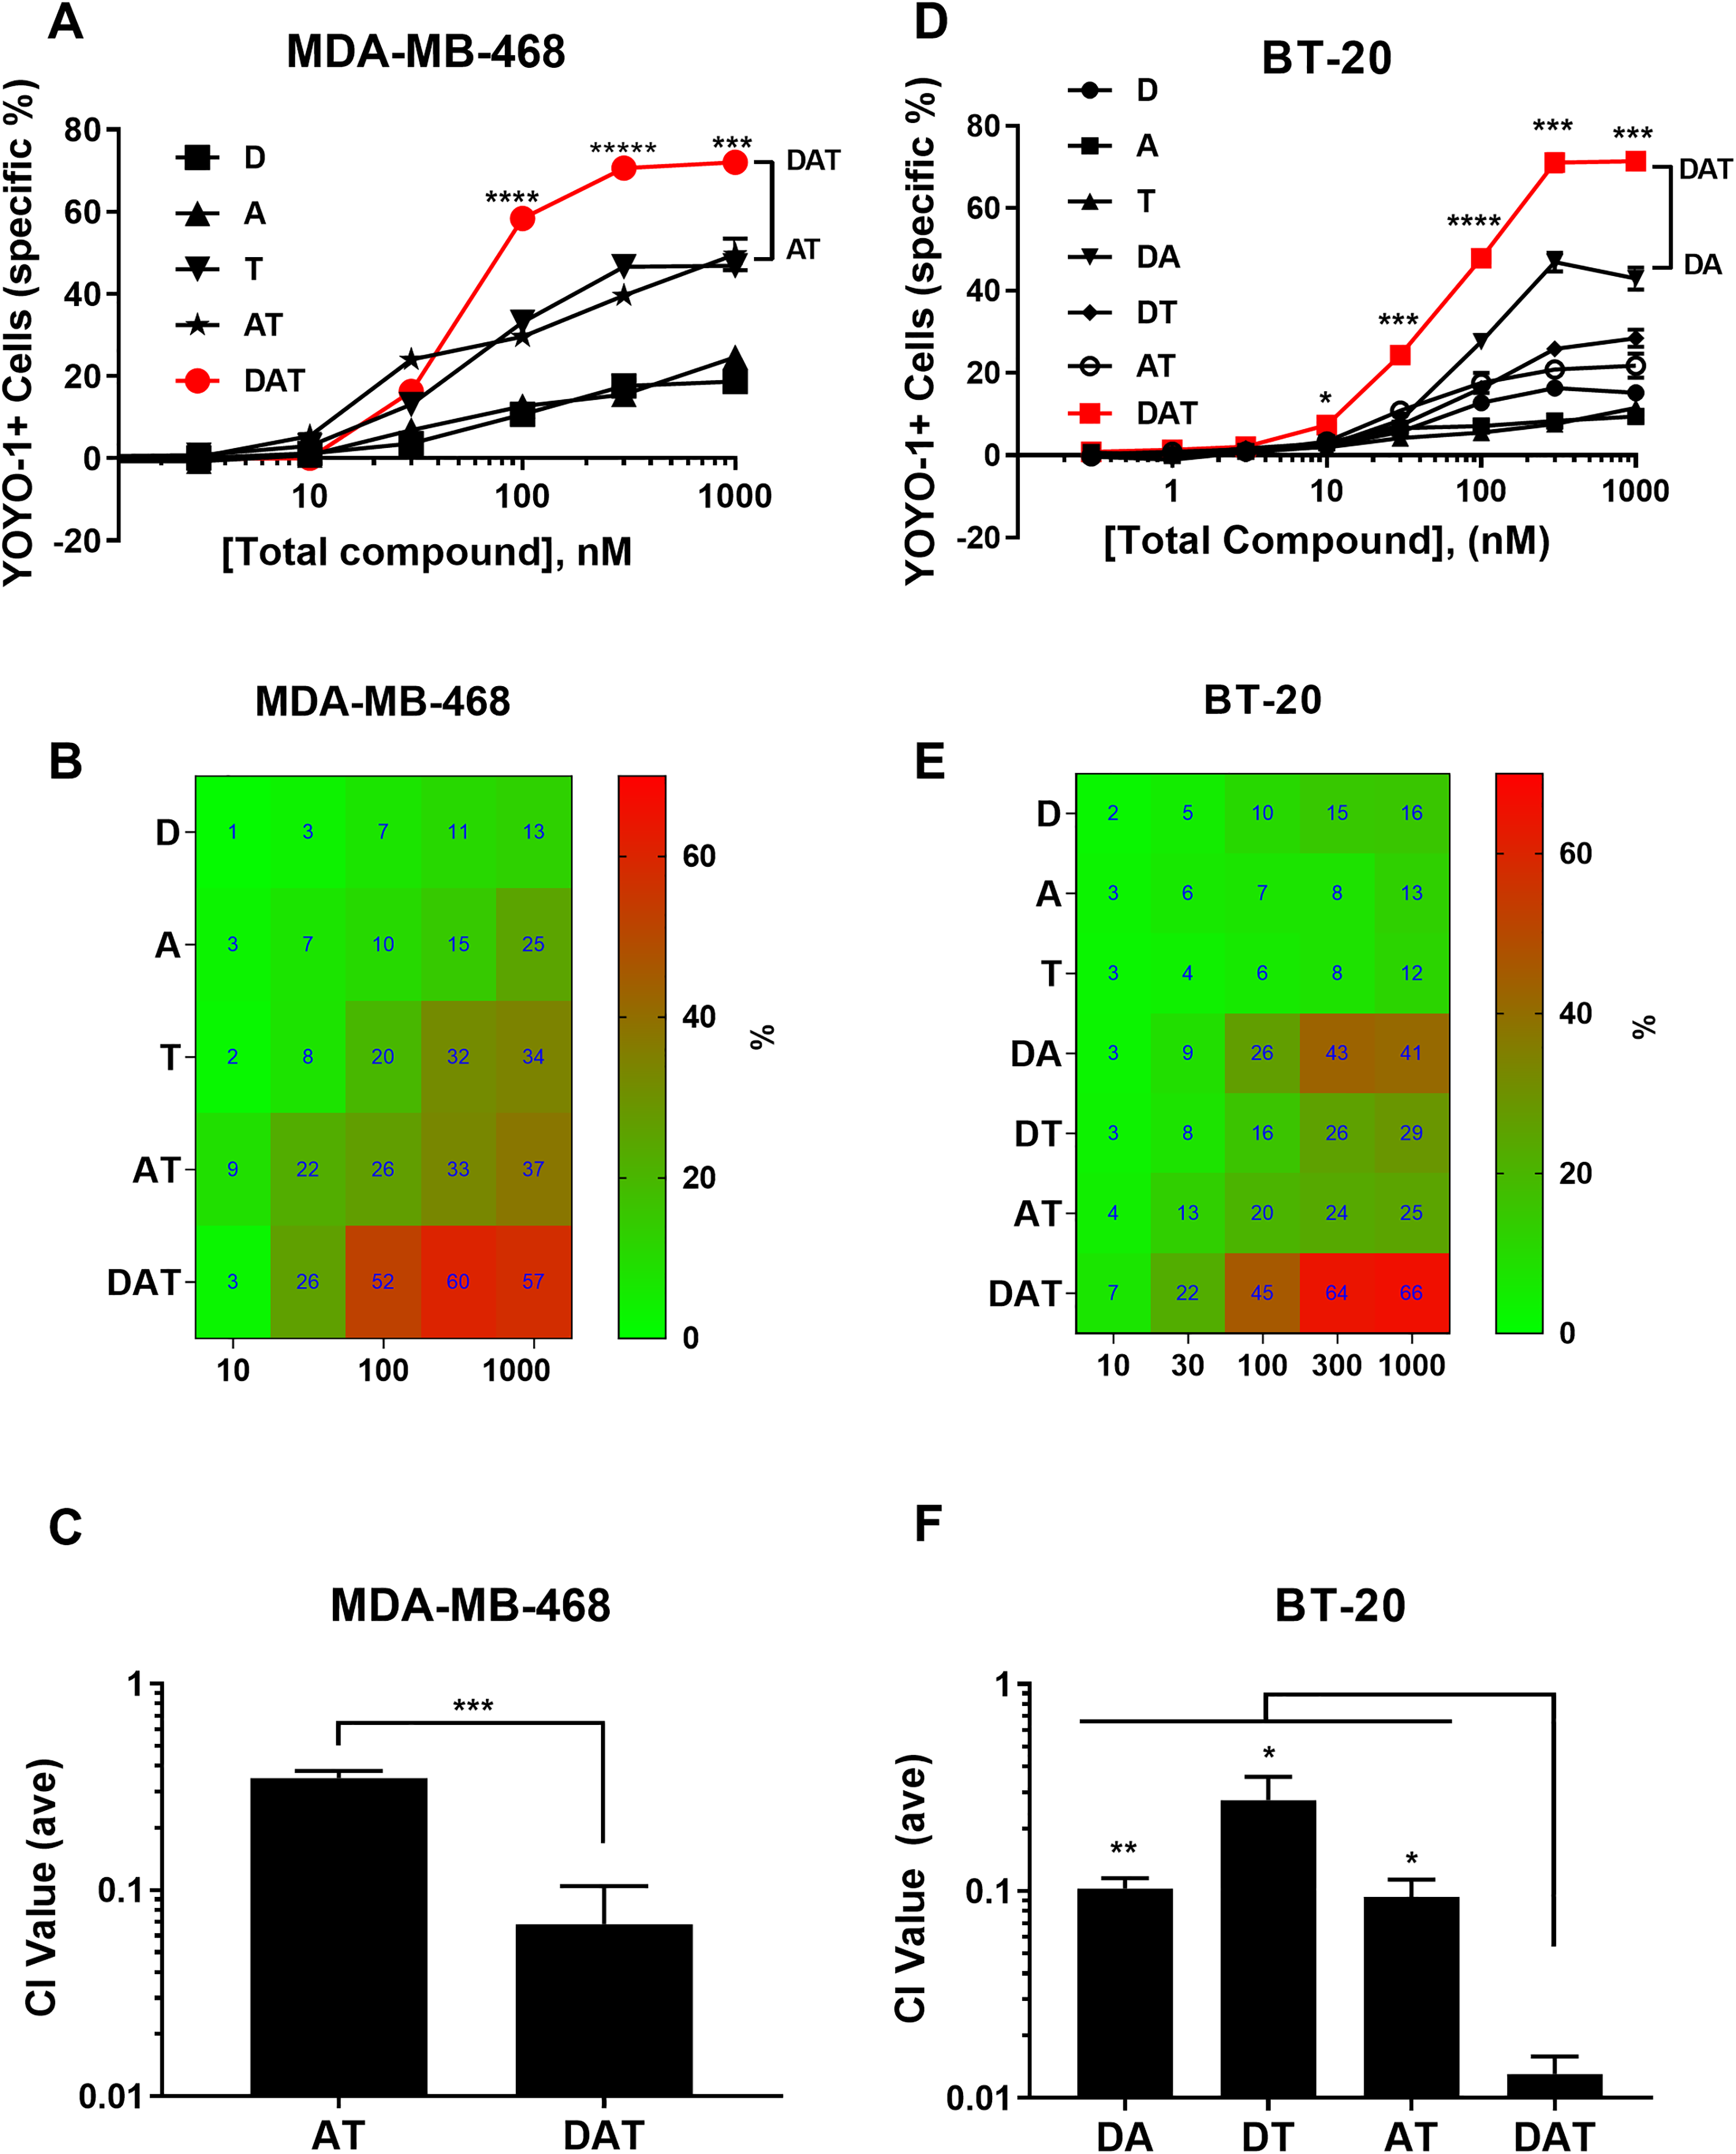
Cytotoxic activity of DAT combinations for two TNBC cell lines. The MDA-MB-468 and BT-20 cell lines were treated with single drugs and AT/DAT (MDA-MB-468) or all combinations of DAT (BT-20), as indicated, in dose–response with a high concentration of 1 µM total compound in 96-well format. The ratios for the combinations were fixed as follows: D:A, 4:3; D:T, 4:1; A:T, 3:1; and D:A:T, 4:3:1. Specific cytotoxicity was determined by the HCA method. (
We also examined the response of another TNBC cell line, BT-20, to all seven different combinations of D, A, and T. The proliferation data with this cell line indicated that the DAT combination had similar potency (GI50) to the two-way combinations, and synergy calculations based on nuclei count showed that DAT was synergistic (CI = 0.11), but not significantly more so than DA (CI = 0.17) and DT (CI = 0.34), but improved over AT (CI = 0.27) ( Fig. 5D–F ). In contrast, the analysis of the cytotoxicity data indicated that the DAT combination generated higher cytotoxicity than all the single and two-way combinations at 10–1000 nM total concentrations ( Fig. 6D,E ). Synergy calculations from single-compound data produced the following average CI values for the combinations: DA = 0.10, DT = 0.27, AT = 0.09, and DAT = 0.013 ( Fig. 6F ). The DAT CI value was significantly (p < 0.05) lower than all of the other two-way combinations, indicating enhanced synergy of the DAT combination for inducing cytotoxicity.
Summary of DAT Activities
In summary, the DAT combination (1:1:1 ratio) potently inhibited the proliferation of HCC1143 (average GI50 = 11 nM) and MDA-MB-468 (average GI50 = 13 nM), while modestly inhibiting HCC1806 (GI50 = 125 nM). DAT (at 4:3:1) also inhibited BT-20 proliferation (average GI50 = 22 nM). This combination also had significant synergy for inhibiting proliferation with CI values of 0.34 and 0.29 for HCC1143 and MDA-MB-468, respectively, while not synergistic for HCC1806. For HCC1143, the analysis of cytotoxicity indicated DAT induced similar cytotoxicity potency and efficacy to DT, but since individual compound concentrations are lower in the three-way combination (1/3 lower), there may be synergy or A may be an enhancer of DT in this cell line. With MDA-MB-468, DAT produced the highest cytotoxicity of all the combinations. DAT demonstrated enhanced synergy comparing DA + T (0.29) and DT + A (0.04), and in separate experiments, DAT (4:3:1) showed significantly better synergy at CI = 0.07, compared with AT (CI = 0.35). With BT-20, DAT (4:3:1) induced more cytotoxicity and was more synergistic than any of the two-way combinations of DA, DT, and AT. Taken together, the three-drug DAT combination demonstrated potent inhibition of proliferation and enhanced cytotoxicity with improved cytotoxic synergy for two of the four TNBC cell lines tested compared with all the other two-way combinations.
Discussion
We tested a novel approach to identify higher-order synergistic or enhancer combinations of FDA-approved drugs that inhibit proliferation with or without inducing cell death of TNBC cell lines. Most members of the kinase inhibitor class of drugs display multitarget activities; that is, they inhibit multiple kinase targets in the cell due to the challenging nature of targeting the highly conserved ATP binding pocket. We focused on kinase inhibitor drugs in part because of the multitargeted “poly-pharmacy” activities that may result in unpredictable interactions. We started our selection by mixing all 33 kinase inhibitor drugs on the market at the time of this study and used a dropout approach to identify active groups and then single drugs, initially using a simple cell viability assay based on resazurin metabolism. This scheme allowed for all possible combinations to exist in the initial mixture. After only three rounds of deconvolution, we had identified five single drugs (EDAIT) to further explore for synergy. This initial evaluation suggested that idelalisib had no activity in combinations and that cell death was being induced by some combinations. Therefore, we switched the cell assay to the HCA format that was capable of measuring both cell proliferation and cell death and with the additional advantage of obtaining actual cell counts. We used this HCA to assess synergies of all possible combinations of EDAT against three cell lines, and these data led to the focus on DAT as a novel combination. Since we measured two different cell parameters, we analyzed synergy separately for inhibiting cell proliferation and inducing cell death. The analysis of cell death specifically provided an additional and important way to analyze the effectiveness of combinations since it uncovered unrecognized activities of combinations, as has been reported. 20
In retrospective analysis, there were advantages, limitations, and opportunities to improve the described combination discovery approach. One advantage of this approach is that it allows for all possible combinations (and number of interacting drugs) in the mixture of drugs that cannot be readily screened by testing each of the large number of combinations. However, it also allows antagonism by other drugs, which could result in missed combinations. The selection method was inherently biased for more potent inhibitors since we started with such a large number of compounds (33 drugs). Therefore, unique activity contributions from one compound would have to be very potent to be detected. Thus, some combinations were almost certainly missed due to this dilution effect. This was also an advantage in one sense since many reported synergistic combinations employ concentrations that are nowhere near achievable in vivo. Another limitation is that a 1:1 ratio was employed for the initial 33× mixture and deconvolution. This 1:1 ratio may not be optimal for some combinations and may cause a bias resulting in the most potent inhibitors dominating the outcome of the dropout screen. One modification of the selection scheme to ameliorate this bias for the most potent compounds would be to initially determine the single-agent potency (GI50 or EC50 for cytotoxicity) for each of the 33 compounds against the target cell line. The ratios used in the 33× mixture would then be based on these activities; that is, the compounds would be mixed at their GI50/EC50 ratios. Inactive compounds would still be used in the mixture, since they may have enhancer or synthetic lethal-like activity in combination. These inactive compounds could be included at some maximal concentration that does not induce nonspecific cytotoxicity. Alternatively, they could be used at this concentration together with the other potent inhibitors in the same group, at their predetermined GI50, to equal the molar ratio of the other groups. In this way, the ratios would be experimentally determined and ensure that the selection scheme would not simply select for the most potent compounds. This modification of the selection scheme could result in the identification of more drug combinations. A further improvement to the described scheme would be to exclusively use the HCA throughout the screen. HCA is superior to the resazurin-based assay since the resazurin assay can be subject to multiple artifacts and limitations, while the HCA directly counts cell nuclei. Some compounds show a time-dependent inhibition of cell proliferation such that the GI50 will shift to a smaller value with longer incubation times. To avoid this potential discrepancy, one could use a fixed two-doubling time treatment time, instead of a fixed 4-day time, for each cell line. In this way, the differences in rate of cell proliferation between cell lines would be accounted for and allow for better direct comparison of GI50 values. Of note, the four cell lines used in this report had similar growth rates. We chose to design the groups by primary published target information as a means to eliminate groups of compounds without activity. The different number of compounds per dropout group is due to the different number of FDA-approved drugs against that target. An alternate approach to creating the initial mixture would be to randomize the compounds into groups with an equal number of compounds per group. This approach could reveal other combinations. Using the same combination selection scheme with a selection assay where the primary endpoint to follow from the beginning is cytotoxicity (e.g., by using the HCA described) could more directly lead to other cytotoxic or synthetic lethal combinations. Based on the different sensitivities observed just within these few cell lines, it is very likely that different combinations would have been identified if a different cell line were used for the initial combination discovery scheme. This scheme may also be useful for the identification of combinations for quadruple-negative breast cancer, which is TNBC that also lacks the androgen receptor.
Very different sensitivities to the EDAT combinations were observed in just three cell lines. In fact, no combination showed significant synergy in all three cell lines. The HCC1806 cell line was generally more resistant than the other two cell lines to inhibition of cell proliferation by these combinations, as well as more resistant to the induction of cell death. We identified only two combinations, DT and EAT, that showed synergy for inhibiting HCC1806 proliferation, compared with five or six in the other cell lines. Furthermore, no combinations displayed any dramatic enhancement of cytotoxic activity over dasatinib alone, which generated the most potent cytotoxicity, with the possible exception of DT, which produced comparable activity at the same total drug concentration as dasatinib alone, but at half the concentration of dasatinib. The combinations ED, DA, EAT, DAT, and EDAT were observed to inhibit cell proliferation in a synergistic fashion in two out of three cell lines. However, synergy of mTORi + D for breast cancer cell lines has been previously reported, 16 and we observed no enhanced cytotoxicity of ED over D alone. The DA combination also potently induced cell death in those same cell lines. This combination has been previously reported as a synergistic combination for TNBC cell lines. 13 Although the EAT combination showed synergy for inhibiting HCC1806 proliferation, it was a completely antiproliferative combination for this cell line, with no induction of cytotoxicity. For the other cell lines, MDA-MB-468 and HCC1143, EAT had similar cytotoxicity to AT. The ET combination has been previously reported to have synergistic activity against breast cancer and other cancer cell lines. 21,22 In a clinical trial of the ET combination for solid tumors, this combination resulted in enhanced side effects that were intolerable and only showed modest efficacy, though this may be due to the inability to use optimal dosing due to tolerability. 23 Addition of A to this combination would likely generate even more side effects. Interestingly, the ET combination in our study showed no significant antiproliferative synergy in any of the cell lines tested and moderate to no cytotoxicity, mirroring the lack of clinical efficacy of this combination. The EDAT combination displayed similar GI50 values, synergies, and cytotoxicity potency/efficacy to the DAT combination, leading to the conclusion that everolimus did not add significantly to the activity of DAT. Based on the cytotoxicity data, everolimus alone was not cytotoxic in TNBC cell lines, in agreement with Gautam et al. 20 It also generally did not appear to positively impact the cytotoxic activity of other drugs or combinations, even reducing cytotoxicity in some cases (e.g., ED vs D for HCC1806), consistent with conclusions reported by Gautam et al. 20 Thus, we chose to focus further follow-up studies on the novel DAT combination.
DAT synergistically inhibited the proliferation of three of four TNBC cell lines. It also generated enhanced cytotoxicity, with the highest synergy, compared with all two-way combinations of the same drugs in two of four cell lines tested, with possibly mild synergy or enhancement in a third cell line. These data indicated that an estimated toxicity for the DAT combination should be determined by maximal tolerated dose (MTD) studies in a mouse model. Based on these data, the DAT combination will be evaluated for in vivo efficacy in a mouse xenograft model of TNBC. Positive results in vivo may provide support for a clinical trial of these already marketed drugs in a subset of TNBC patients. At this point, it is unclear what made the two cell lines particularly responsive to the induction of cytotoxicity by the DAT combination. We speculate that DAT-induced cell death may be primarily due to simultaneous inhibition of the PI3K/AKT and ERK pathways leading to apoptosis. Afatinib may have inhibited EGFR, leading to decreased phosphorylated AKT (pAKT) levels, and pAKT levels were further decreased due to decreased levels of phosphorylated Src (pSrc) due to dasatinb. Src participates in the downstream signaling of multiple cell surface receptors. Phosphorylated ERK (pERK) levels would have been reduced by trametinib through inhibition of MEK1/2. Thus, the combined effect of the three drugs would be to inhibit both the PI3K/AKT and ERK pathways at sufficient levels to cause cell death. Of note, both of the most responsive cell lines (MDA-MB-468 and BT-20) were sensitive to the antiproliferative effects of all three drugs when used as single drug treatments. In order to better assess how broadly active (in terms of both efficacy and synergy) the DAT combination might be for TNBC, a larger and broader panel of TNBC cell lines needs to be profiled with this combination.
We analyzed the four cell lines used in this study for genetic mutations and biomarkers that are associated with sensitivity to the DAT combination and thus could be used to profile a subset of patients whose cancer is likely to respond to this combination. We used the Catalogue Of Somatic Mutations In Cancer (COSMIC) database (https://cancer.sanger.ac.uk/cosmic) 24 to obtain known cancer-associated gene mutations in all four cells lines, and then identified the ones that are common in the DAT-sensitive cell lines (MDA-MB-468 and BT-20), while not present in the resistant cell line (HCC1806). Since the HCC1143 was only modestly synergistic for cytotoxicity, we did not select genes based on this cell line. This analysis indicated that 12 genes (BRCA2, CAMTA1, CDKN2C, FANCA, FAT4, JAK1 or JAK2, LRP1B, MALT1, MYO5A, PIK3CA, TRIM24) were mutated in the two DAT-sensitive cell lines, but not in the resistant one. None of these genes were mutated in HCC1143. However, it is important to note that with so few cell lines, this list of genes is merely a preliminary list for future assessment and does not have the statistical power to identify correlations. A much larger set of cell lines would be needed to identify a potential set of genetic biomarkers that would predict response to the DAT combination.
Remarkably, both DAT-sensitive cell lines have been reported to have a copy number amplification of the EGFR gene, and proteomic analysis identified these two cell lines as having the highest EGFR protein expression level in a panel of 16 TNBC cell lines. 25 In this same study, EGFR protein expression level was correlated with sensitivity to the EGFR inhibitor lapatinib. Our data with afatinib and its impact on cell proliferation are generally consistent with this observation in that the afatinib/DAT-resistant cell line HCC1806 reportedly expresses a low level of EGFR, as does HCC1143, which was also afatinib resistant. 25 However, it is worth noting that afatinib, by itself, showed little to no cytotoxicity in any of the four cells lines that we tested. This potential association between EGFR expression level and sensitivity to DAT-induced cytotoxicity needs to be explored with a larger panel of cell lines. This same published study used hierarchical clustering of protein expression profiles to identify four subtypes of breast cancer cell lines based on proteomics. 25 MDA-MB-468, BT-20, and HCC1143 all grouped into one cluster, while HCC1806 fell into a different one. This grouping pattern is consistent with the former cell lines all generally displaying more sensitivity in response to single compounds and the combinations (including DAT), as well as multiple synergies. At the single pathway level, one study on the sensitivity of breast cancer cell lines to trametinib found no correlation between trametinib IC50 values and inhibition of ERK signaling. 21 Similarly, the dasatinib sensitivity of breast cancer cell lines does not correlate with SRC expression, but in vitro cell line sensitivity to dasatinib has been discovered to correlate with the expression level of a set of six marker genes (EPHA2, CAV1, CAV2, ANXA1, PTRF, and IGFBP2). 26 In order to determine clinically useful biomarkers for predicting DAT-induced synergistic cytotoxicity, a larger panel of cell lines needs to be profiled for DAT sensitivity and synergism coupled with determining correlations with genetic alterations and cell signaling pathway changes in response to the three-drug combination.
Despite the in vitro data that TNBC cell lines are highly sensitive to dasatinib, 11,12 dasatinib monotherapy failed to show efficacy for TNBC in clinical trials. 12 Additionally, clinical trials of dasatinib in combination with other chemotherapy or targeted agents for TNBC have been generally unimpressive. 27,28 Consistent with the clinical failure of dasatinib monotherapy, our data indicated that dasatinib by itself failed to induce significant cytotoxicity at the clinically achievable and tolerable concentrations of <100 nM. Therefore, it may be that the lack of efficacy is in part due to lack of cancer cell killing at the doses achievable in humans. In contrast, the DAT combination induced significant cytotoxicity in three of four TNBC cell lines at 30–100 nM total drug, where the concentration of dasatinib was 10–50 nM (in the 1:1:1 and 4:3:1 ratios). Importantly, these concentrations are in range of the geometric means for steady-state Cmin (trough) and Cmax (peak) and Caverage plasma concentrations achievable in humans, reported to be 5, 112, and 28 nM, respectively, for the recommended dosage of 100 mg once daily for CML. 29,30 The lack of cytotoxicity with the DAT combination against HCC1806 suggests that the DAT combination is not broadly and nonselectively cytotoxic and may be tolerable with selectivity for certain subsets of TNBC. While these three drugs have not been tested together in the clinic, the combination of dasatinib and afatinib has been tested in a phase I clinical trial for lung cancer and the combination had a manageable toxicity profile. 31 There have been no reports to date for clinical trials using dasatinib plus trametinib (nor any other MEKi). Dasatinib and EGFRi drugs (erlotinib and cetuximab) have been combined for several clinical studies. 32,33 This combination was tolerated with acceptable side effects in these studies of different types of cancer (not breast cancer), but efficacy has not been proven yet.
Dasatinib has recently been reported to synergistically enhance inhibition of tumor growth in response to anti-CTLA4 checkpoint inhibitor antibody treatment in a mouse model of head and neck squamous cell carcinoma. 34 In addition, dasatinib plus anti-PD-1 synergistically inhibited tumor growth in syngeneic tumor models using three different types of mouse cell lines. 35 Also of note, dasatinib was shown to be synergistic with a dendritic cell vaccine in a mouse model of metastatic breast cancer. 36 Thus, the DAT combination may also enhance the efficacy of immunotherapy such as checkpoint inhibitors.
Supplemental Material
Supplemental_Material_for_Identification_of_a_Triple_Drug_Combination_by_Ahmad_et_al - Identification of a Triple Drug Combination That Is Synergistically Cytotoxic for Triple-Negative Breast Cancer Cells Using a Novel Combination Discovery Approach
Supplemental_Material_for_Identification_of_a_Triple_Drug_Combination_by_Ahmad_et_al for Identification of a Triple Drug Combination That Is Synergistically Cytotoxic for Triple-Negative Breast Cancer Cells Using a Novel Combination Discovery Approach by Syed Ahmad, Qingping He, Kevin P. Williams and John E. Scott in SLAS Discovery
Footnotes
Acknowledgment
We thank Bridget McCaskill for her early proof-of-concept contributions to this study.
Declaration of Conflicting Interests
The authors declared no potential conflicts of interest with respect to the research, authorship, and/or publication of this article.
Funding
The authors disclosed receipt of the following financial support for the research, authorship, and/or publication of this article: This study was supported by a grant to J.E.S. from North Carolina Central University (https://www.nccu.edu, NCCU Mini-Grant) and grants to K.P.W. from the National Institutes of Health (NIH, https://www.nih.gov/, P20CA202924 and R15CA208651) and the Susan G. Komen Foundation (![]() , Graduate Training in Disparities Research Grant GTDR16377604).
, Graduate Training in Disparities Research Grant GTDR16377604).
Supplemental material is available online with this article.
References
Supplementary Material
Please find the following supplemental material available below.
For Open Access articles published under a Creative Commons License, all supplemental material carries the same license as the article it is associated with.
For non-Open Access articles published, all supplemental material carries a non-exclusive license, and permission requests for re-use of supplemental material or any part of supplemental material shall be sent directly to the copyright owner as specified in the copyright notice associated with the article.