
Abstract
The voltage-gated sodium channel Nav1.7 is a genetically validated target for pain; pharmacological blockers are promising as a new class of nonaddictive therapeutics. The search for Nav1.7 subtype selective inhibitors requires a reliable, scalable, and sensitive assay. Previously, we developed an all-optical electrophysiology (Optopatch) Spiking HEK platform to study activity-dependent modulation of Nav1.7 in a format compatible with high-throughput screening. In this study, we benchmarked the Optopatch Spiking HEK assay with an existing validated automated electrophysiology assay on the IonWorks Barracuda (IWB) platform. In a pilot screen of 3520 compounds, which included compound plates from a random library as well as compound plates enriched for Nav1.7 inhibitors, the Optopatch Spiking HEK assay identified 174 hits, of which 143 were confirmed by IWB. The Optopatch Spiking HEK assay maintained the high reliability afforded by traditional fluorescent assays and further demonstrated comparable sensitivity to IWB measurements. We speculate that the Optopatch assay could provide an affordable high-throughput screening platform to identify novel Nav1.7 subtype selective inhibitors with diverse mechanisms of action, if coupled with a multiwell parallel optogenetic recording instrument.
Introduction
Pain remains a major unmet medical need and is among the primary reasons why patients seek medical care. Chronic pain is difficult to treat and leads to significant morbidity, loss of productivity, and lower quality of life.1,2 Although opioid-based therapeutics are widely prescribed for pain, mechanism-based adverse effects involving respiratory, gastrointestinal, and central nervous system (CNS) function, along with tolerance and dependency issues, limit long-term use and have led to significant societal burdens and the current opioid crisis. 3 Gabapentinoids, carbamazepine, and certain nonsteroidal anti-inflammatory agents provide some relief but have suboptimal efficacy for a significant group of patients. 4 Despite the clear unmet medical need and significant research activity, few new nonopioid drugs for pain have appeared in the past decade.
Voltage-gated sodium channels are key components of sensory signaling, including pain transmission. 5 First-generation sodium channel blockers, including mexiletine and lamotrigine, are used as analgesics but provide limited efficacy for treating chronic pain due to adverse effects at high doses. These agents nonselectively block sodium channels, which leads to unwanted effects on cardiac and CNS function. Nonselective sodium channel blockers achieve a therapeutic window by preferentially acting on hyperactive neurons in pathological pain states. This functional selectivity is enabled by targeting specific channel states that occur when cells are depolarized (inactivated states) or firing rapidly (open states). The efficacy of compounds acting by this mechanism is limited by the extent of preferential occurrence of these states in pain conditions relative to normal physiological function in neuronal and cardiac tissues.
An alternative path to improved pain therapeutics is to target specific sodium channel subtypes. Human genetic data provide a clear rationale for targeting Nav1.75 (SCN9A). Gain-of-function mutations in SCN9A that enhance channel activity lead to severe forms of pain. 5 Key genetic evidence supporting Nav1.7 as a pain target is the identification of patients with congenital insensitivity to pain (CIP) who harbor-recessive loss-of-function mutations in SCN9A leading to loss of channel function. 6 The limited range of functional effects of mutations in Nav1.7 outside the pain landscape is consistent with expression data showing preferential expression in nociceptor and sensory cells. 7 These data provide a strong rationale for developing subtype selective inhibitors for Nav1.7.
Despite significant improvements in screening technologies over the past decade, progress in developing improved sodium channel blocking analgesics is still hindered by limitations of scalable assays of sodium channel and sensory neuron function. Optical and ion flux-based assays of sodium channel activity can be configured to support high-throughput screening (HTS) but afford limited temporal resolution and typically rely on pharmacological agents to facilitate channel opening. These triggering agents can modify the pharmacological properties of channels and bias sensitivity to nonselective inhibitor types.8–10 Automated electrophysiology platforms enable flexible and precise measurements of sodium channel function and pharmacology with the capacity to support HTS,11,12 but display reduced throughput and higher cost when compared with fluorescent assays.
We have developed all-optical methods for stimulating and recording electrical activity from excitable cells.13–15 The Q-state Optopatch approach affords the potential for high-throughput measurements along with the ability to precisely control and measure ion channel activity with high temporal resolution. In particular, when applied to HEK-293 cells expressing exogenous sodium channels (“Spiking HEK” cells), this all-optical assay presents an entirely novel way to investigate sodium channel pharmacology in a potentially high-throughput format. In the present study, we describe and compare the performance of the Optopatch Spiking HEK Nav1.7 assay to that of a commercially available automated patch clamp system. In particular, both assays were used to evaluate a small set of tool compounds, screen a set of >3000 diverse compounds, and confirm hit activity from the screen. The results demonstrate the feasibility and benefit of using the Optopatch assay for the discovery of novel sodium channel inhibitors.
Materials and Methods
Genetic Engineering of Nav1.7 Spiking HEK Cells
The generation of Nav1.7 Spiking HEK cells has been described in detail previously. 13 Briefly, CheRiff-GFP fusion protein was introduced into a parental cell line stably expressing Nav1.7 (gift from Dr. Bruce Bean at Harvard University) by lentivirus transduction and then enriched by cell sorting on a flow cytometer. Next, the monoclonal cell line with stable Nav1.7 and CheRiff expression was transiently transfected with pIREShyg-Kir2.1 plasmid using Lipofectamine 2000 (Invitrogen, Carlsbad, CA) to achieve a hyperpolarized membrane potential to support action potential-like waveform generation. The monoclonal line with the largest tetrodotoxin (TTX)-sensitive action potential-like waveforms was further expanded and used for all subsequent experiments. For Optopatch experiments under 8 mM bath potassium, Kir2.1 expression was introduced by lentiviral transduction. Lentivirus can transduce a variety of cell types with high efficiency and achieve high expression levels, while inducing low toxicity. 16 Lentivirus production protocols are described in detail in a previous publication from Q-State Biosciences. 16 During transduction, cells from the monoclonal Nav1.7 and CheRiff cell lines were mixed with Kir2.1 lentivirus for 24 h and then washed and replated onto 384-well plates. Cells were imaged approximately 48 h after transduction.
Nav1.7 Spiking HEK Cell Culture
The chosen monoclonal cell line stably expressing Nav1.7 and CheRiff was maintained in Dulbecco’s modified Eagle’s medium (DMEM) with 10% fetal bovine serum and supplemented with 2 mM GlutaMAX-I (Gibco, Carlsbad, CA) and MEM Non-Essential Amino Acids Solution (Thermo Fisher, Waltham, MA). Cells were maintained at 37 °C in a humidified atmosphere with 5% CO2. For experiments performed using a 6 mM potassium bath solution, 48 h prior to recording, cells were transiently transfected with pIREShyg-Kir2.1 plasmid (see above). Twenty-four hours prior to recording, the cells were replated into 384-well plates (789836; Greiner Bio-One, Monroe, NC) with cyclic olefin copolymer (COC) well bottoms at a density of 30,000 cells per well. Prior to cell plating, plates were treated with 0.02 mg/mL poly-
Nav1.7 Optopatch Spiking HEK Measurements in 384-Well Plates
Imaging experiments were performed 24 h after plating into 384-well plates when the cells formed a confluent monolayer. Prior to imaging, the cells were washed with Tyrode’s solution (containing, in mM, NaCl 125, KCl 6, CaCl2 3, MgCl2 1, HEPES 10, glucose 30, pH 7.3 with NaOH) using a PerkinElmer Janus Mini liquid handling robot, and then incubated with 70 nM BeRST1 dye 17 for 30 min at room temperature. The dye was washed out and the compounds were added to the cells using the Janus Mini. Imaging commenced 30 min after compound addition. For most experiments, the bath potassium concentration was 6 mM as stated above; 8 mM bath potassium was used in the assay improvement stage (see Fig. 6 ).
Experiments were performed on an inverted epi-fluorescence microscope equipped with an automated stage (Ludl Electronics MAC 6000 Ludl Electronic Products, Hawthorne, NY). Briefly, illumination from a red laser (635 nm, 5 W, DILAS Laser, Tucson, AZ) was expanded and focused onto the back focal plane of a 10× air objective (NA 0.4, UPlanSApo 10×/0.4; Olympus, Shinjuku City, Tokyo). Blue laser light for optogenetic stimulation was routed through the same objective (1220123, OBIS 488 nm LX 150 mW, Coherent Inc., Santa Clara, CA); fast intensity modulation was achieved by analog control of the driver for a blue laser. The blue laser intensity at the sample plane was 45 mW/cm2. The red illumination intensity at the sample was 18 W/cm2. Imaging was performed as described in a previous report 13 with the following additional improvements. To minimize direct optical crosstalk from blue light stimulation, an “Oreo” illumination configuration was used during imaging, where the recording region was sandwiched between stimulation regions. The recording area (2.4 × 0.5 mm) was illuminated only by the red laser, and blue stimulation regions (2.4 × 0.75 mm each) were located above and below the recorded region. In this configuration, cells are directly simulated on either side of the recorded region and resulting action potential waves will propagate into the central recorded region via gap junction conduction. BeRST1 fluorescence was filtered by a 710/100 nm bandpass filter and detected by a CMOS camera (ORCA-Flash4.0; Hamamatsu, Bridgewater, NJ). To achieve a frame rate of 500 frames/s, data were acquired with a center camera chip of 160 × 760 pixels at 4 × 4 pixel binning, which corresponds to the 2.4 × 0.5 mm recording area in the well. Scanning progressed from well A1 to well A24, then B24 to B1, then C1 to C24, and so on, in a column-wise serpentine pattern. Column 23 was typically treated with 0.5% DMSO serving as a negative control and column 24 was typically treated with 1 µM TTX serving as a positive control for sodium channel inhibition. TTX is a potent neurotoxin that acts as a pore blocker for Nav1.7. Each well was typically stimulated with a 10-pulse protocol consisting of eight short pulses (20 ms) of blue laser at 5 Hz, followed by a 500 ms long pulse, followed by a 20 ms short pulse (see Fig. 1 ). A complete 384-well plate required ~70 min to scan using this protocol.
Image Processing and Data Analysis
Following plate imaging, the resulting image stack (“movie”) was loaded into MATLAB for further processing. For each well, the kinetic fluorescent intensity waveform was generated by calculating the flat, whole-field mean pixel intensity for all frames. The resulting intensity waveforms were corrected for photobleaching by dividing the raw intensity time trace by the median filtered intensity, which tracks the baseline fluorescence when the median window is more than twice as long as the 500 ms stimulus. To reduce the well-to-well variability, the corrected trace was further normalized to the amplitude of the steady-state fluorescence plateau reached during the 500 ms long blue pulse, which is stable and insensitive to compound modulation. Next, a pseudoLDA (pseudo linear discriminant analysis) value is calculated that aggregates changes across time points. First, the signal resulting from current through the sodium channels was isolated by subtracting the residual signal in the presence of TTX. The signal that covaried with the vehicle condition was calculated with a dot product, and the value normalized so that it scaled from 0 (full block) to 1 (no block): pseudoLDA = dot((Intensity – TTXRef), (vehRef – TTXRef))/dot((vehRef-TTXRef), (vehRef-TTXRef)), where intensity is the time course fluorescent trace for each well, and vehRef and TTXRef are the mean time course fluorescent trace from the 16 vehicle control wells and 16 TTX-treated wells, respectively. For each plate, a Z′ factor was defined as Z′ = 1 – 3(σp + σn)/│(μp – μn)│, where σp is the standard deviation of the TTX-positive controls, σn is the standard deviation of the vehicle-negative controls, μp is the mean of the positive controls, and μn is the mean of the negative controls.
IonWorks Barracuda Automated Patch Clamp Assay
Human Nav1.7 currents were recorded in population patch clamp mode with the IWB automated electrophysiology system (Molecular Devices, LLC, Sunnyvale, CA). Spiking HEK cells (without Kir2.1 transfection) were cultured and prepared for recordings as previously described for IonWorks Quattro testing.
18
The external solution consisted of the following (in mM): NaCl 140, KCl 5, CaCl2 2, MgCl2 1, HEPES 10, and glucose 11, pH 7.4, with N-methyl-
Results
A HEK-293 cell line stably expressing Nav1.7 voltage-gated sodium channels and a modified channelrhodopsin (CheRiff
14
) was transiently transfected with a plasmid encoding an inwardly rectifying potassium channel (Kir2.1). Kir channel expression was necessary to maintain the negative resting membrane potential required to maintain sodium channels in a non-inactivated state at rest. Additionally, expression of Kir channels in the HEK-293 cells enables control of the cell membrane potential by bath potassium concentrations.
19
One of the limitations of the previous report
13
is the requirement of 400 W/cm2 red light intensity to illuminate the genetically encoded voltage sensor, QuasAr2, which induced heating effects in the small volume used for 384-well plates. Additionally, a high-power red laser is required, which is not available in many labs. To overcome this limitation, cells were loaded with a bright far-red fluorescent membrane potential sensor, BeRST1,
17
immediately prior to imaging to provide a rapid and linear fluorescent readout of cell membrane potential, which requires more than 20-fold lower red laser intensity (18 W/cm2) during imaging.
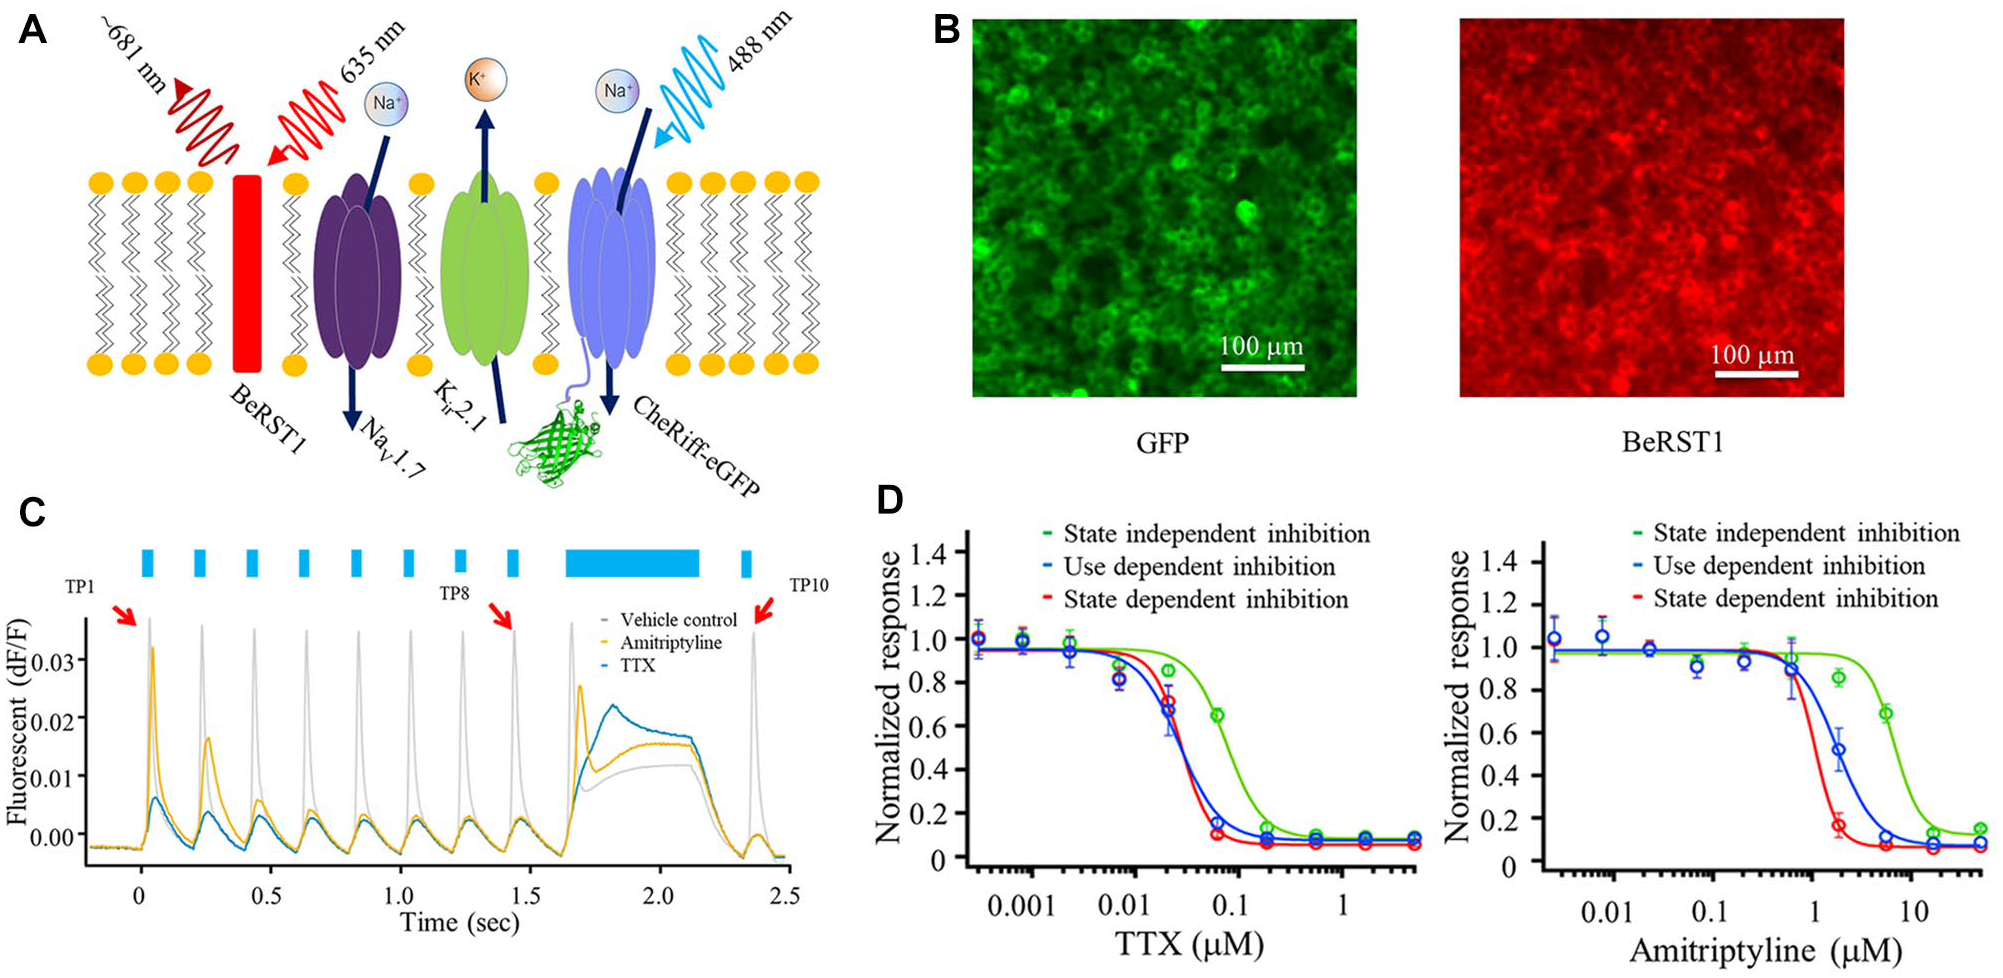
Basic components of the Optopatch Spiking HEK cell assay and sensitivity of the Spiking HEK cell assay to multiple blocking mechanisms. (
Optopatch Spiking HEK Assay Optimization and Stimulus Protocol
Prior to compound evaluation and screening, various assay parameters were optimized, including the composition of the imaging solution, cell plating and transfection conditions, plate materials, BeRST dye loading protocol, imaging geometry and methods, and blue light stimulation protocol. Some of the more critical optimizations of plate materials, imaging geometry, and stimulation protocols are described below. Glass-bottom 384-well plates generated less background fluorescence but provided less consistent cell adhesion. Typical polystyrene-bottom multiwell plates provided more consistent cell adhesion but suffered from high background fluorescence. We identified COC as a suitable surface material available from commercial vendors that is compatible with HEK cell growth and affords background fluorescence lower than that of standard glass. The imaging geometry was configured to provide blue light stimulation at the upper and lower margins of the field of view, and red light illumination in the central imaging area. This Oreo configuration leads to reduced blue light-mediated crosstalk in the red imaging channel, while still allowing efficient stimulation of cells in the center of the field through signal spread across the cells via electrotonic coupling.
The blue light stimulation protocol shown in Figure 1C was designed to detect multiple mechanisms of block in a single brief scan. The pharmacological profiles of known sodium channel inhibitors displaying multiple mechanisms of channel inhibition including preferential block of resting, open, and inactivated channels were evaluated in a series of validation experiments (not shown). The complexity and duration of the protocols were constrained by the need to use a protocol that displayed excellent stability across each plate and enabled completion of plate scans within a duration compatible with HTS. The selected stimulus protocol consisted of 10 stimulus pulses as shown in Figure 1C : a train of eight 20 ms test pulses (TPs) delivered at 5 Hz (TP1–TP8), followed by a 500 ms pulse (TP9), followed by a final 20 ms pulse (TP10). TP1 provides a measure of block of resting Nav1.7 channels; TP8 assesses a use-dependent block of primarily open channels, while TP10 follows a sustained stimulus to assess a block of inactivated channels. TTX displays only a moderate shift in IC50 values for blocks at TP1 (0.08 µM), TP8 (0.028 µM), and TP10 (0.028 µM), as shown in Figure 1D . In contrast, amitriptyline displayed a state-dependent block with a preferential block of TP8 (1.9 µM) and TP10 (1.1 µM) over TP1 (7.2 µM) ( Fig. 1D ). These results demonstrate the assay’s ability to readily detect multiple mechanisms of Nav1.7 inhibition in agreement with published values for Nav1.7 block by TTX 10 and amitriptyline 20 using electrophysiological and fluorescent assays. In addition to evaluating compound effects at a single test pulse, a scalar score (pseudoLDA) that reflects total Nav1.7 block is also calculated from each waveform (see Materials and Methods). The pseudoLDA analysis uses information from every point of the trace, rather than single extracted features such as peak amplitude. It provides a comprehensive and robust evaluation of compound effects, but it is not intended to differentiate compounds based on mechanism of inhibition.
In order to assess baseline assay performance and stability, Spiking HEK cells were plated in 384-well plates and subjected to the stimulation protocol described in
Figure 2
in standard recording solution. One of the challenges in quantitative analysis of optical electrophysiology stemmed from the fact that neither QuasAr2 nor BeRST1 is an absolute voltage sensor. The same absolute voltage change can result in variable amplitudes of ΔF/F0 measurements across different wells. To reduce well-to-well variability and improve the Z′ factor in optical electrophysiology measurements, we developed an internal normalization method (overall trace normalized to CheRiff plateau amplitude) based on the assumption that the resting potential and CheRiff plateau potential during the 500 ms long pulse are resistant to compound modulation (
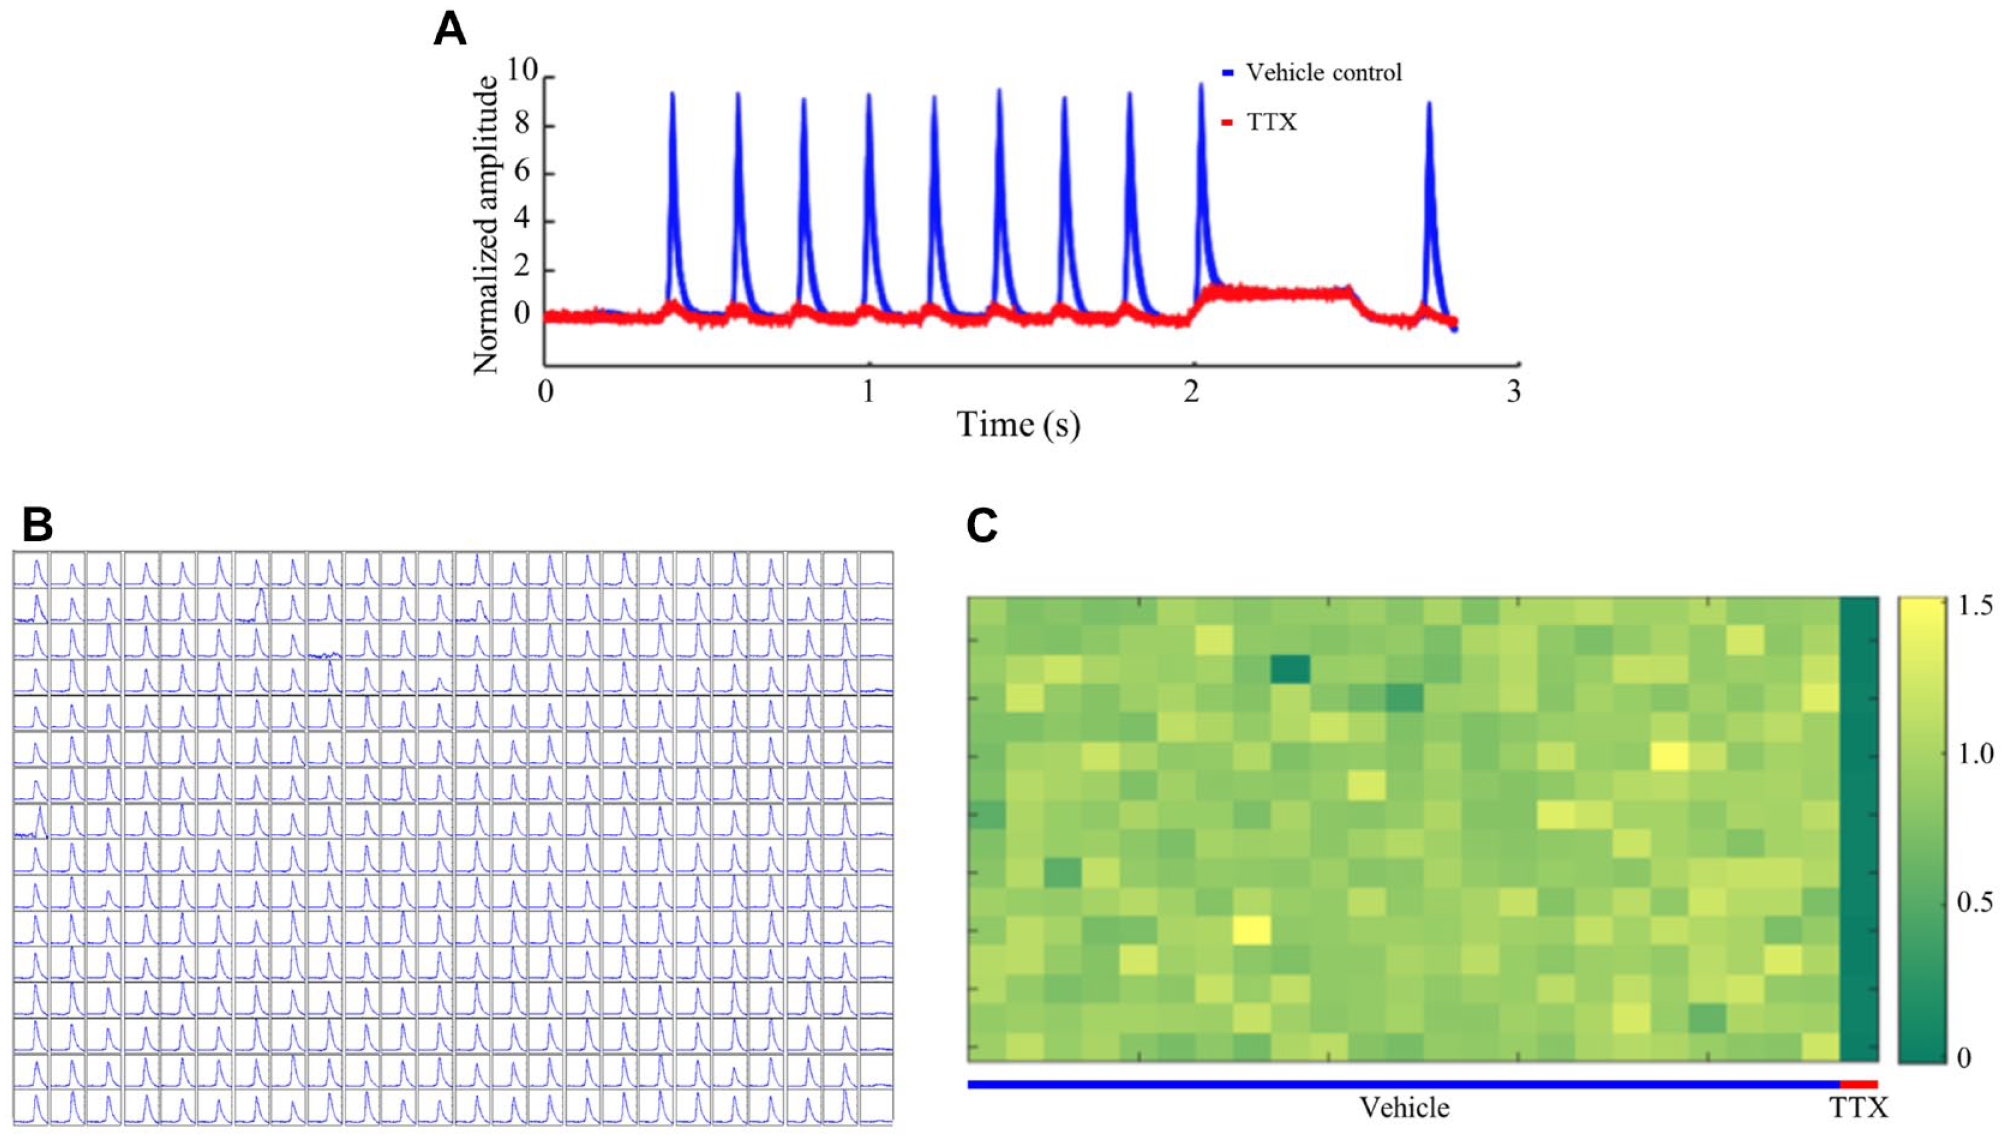
Sample data from Spiking HEK assay on 384-well plates. (
IonWorks Barracuda Assay
An automated electrophysiology patch clamp assay was developed at Amgen on the IWB 384-well platform using the population patch clamp mode where currents from up to 64 cells in each well are averaged. The IWB assay for Nav1.7 had an average plate Z′ of 0.6, with 99.2% of all wells passing criteria of a minimum 25 MΩ seal resistance and ≥0.5 nA peak current size cutoff. Reported Nav1.7 automated electrophysiology assays on the IWB,
21
IWQ,
11
Qube,
12
and SynchroPatch
22
utilized variations of a two-pulse protocol to measure compound activity at closed and/or inactivated states. Another Nav1.7 automated electrophysiology assay on the IW-HT platform used a use-dependent voltage protocol where cells were repeated depolarized to 20 mV.
23
In our study, the IWB assay depicted in
Platform Evaluation with Tool Compounds
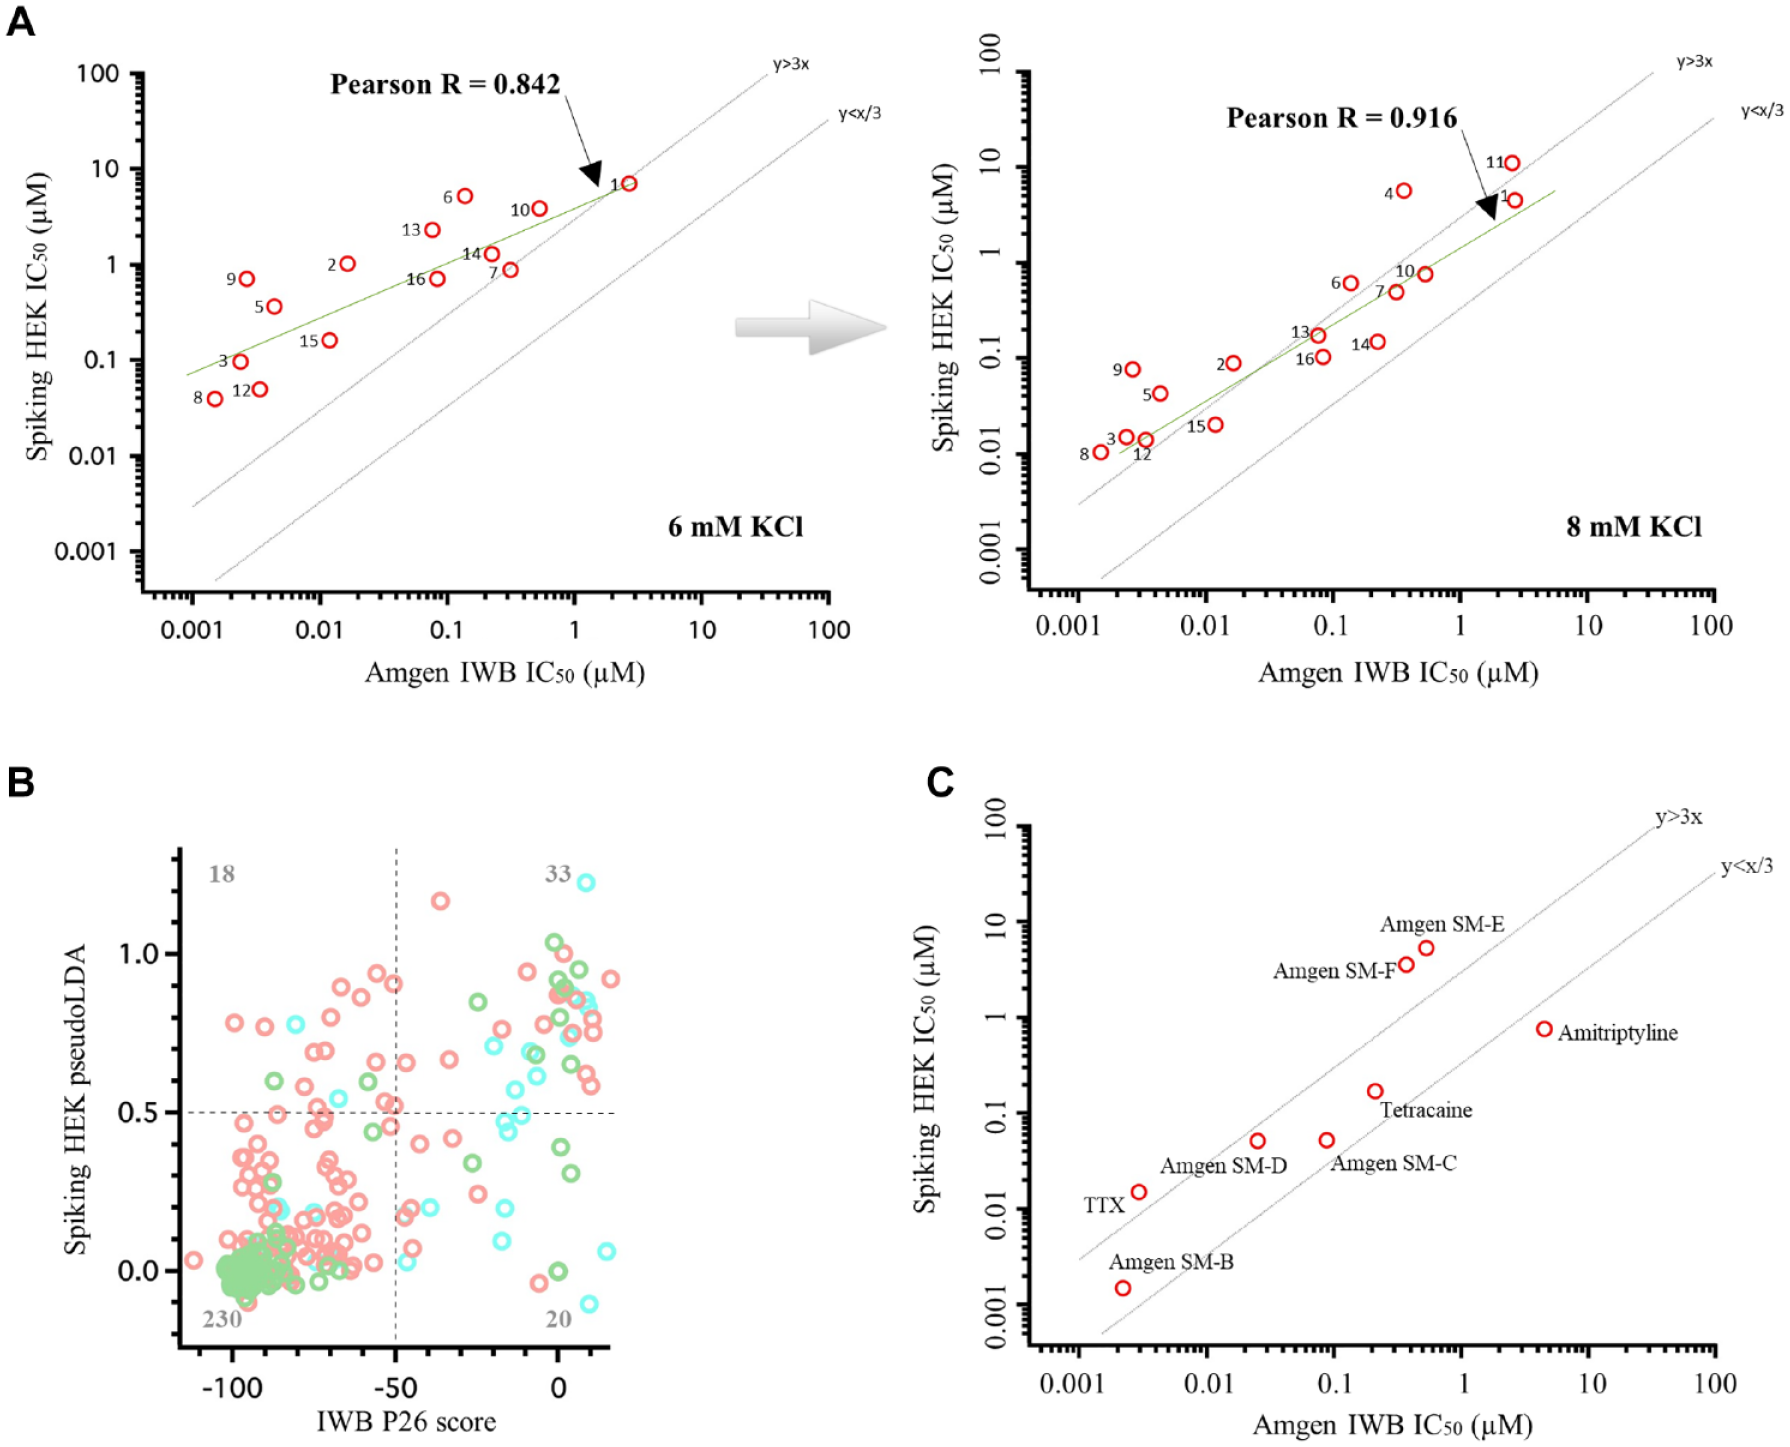
We selected 10 sodium channel inhibitors as tool compounds for the purpose of comparing the performance of the two assay platforms. They comprise three well-described, small-molecule inhibitors, five proprietary small-molecule inhibitors from Amgen’s internal discovery programs, and two peptide inhibitors. The table in Figure 3 summarizes the mechanisms of action for the 10 benchmark compounds used in the Optopatch and IWB assay platforms. Compounds with diverse binding sites (pore, local anesthetic site, D2S—peptide, D4S—sulfonamide) and mode of channel block were included in this set, including closed-state stabilizers ProTx-II and Amgen peptide-A ([Ala5] GpTx-124), aryl sulfonamides Amgen SM-B (AMG837918) and Amgen SM-C (AMG838018), acyl sulfonamide Amgen SM-D, and slow inactivated stabilizers Amgen SM-E and Amgen SM-F (piperazine amide chemotype, compound 1425). Each compound was tested in concentration–response format on the Optopatch Spiking HEK assay and on the IWB assay. Nav1.7-blocking activity was observed for each compound on both platforms. Observed potency, measured as IC50, was well correlated between the platforms ( Fig. 3A ; Pearson R = 0.77). Five compounds scored within threefold potency across platforms. Of the other five, four were significantly less potent in the Optopatch assay. One of those four compounds is TTX, whose IC50 is 85 nM in the Optopatch assay, which is closer to the literature-reported value (36 nM) 26 than the IWB assay result (2.9 nM). The other three compounds are Amgen small molecules. In the IWB assay, cells are clamped to −20 mV for a period of 4 min to transition channels to a slow inactivated state. Reduced potency in the Optopatch Spiking HEK assay with these compounds may be attributable to preference for a slow inactivated state (Amgen SM-E and Amgen SM-F). Or it could be due to the slower binding kinetics of acyl sulfonamide, 27 such as Amgen SM-D.
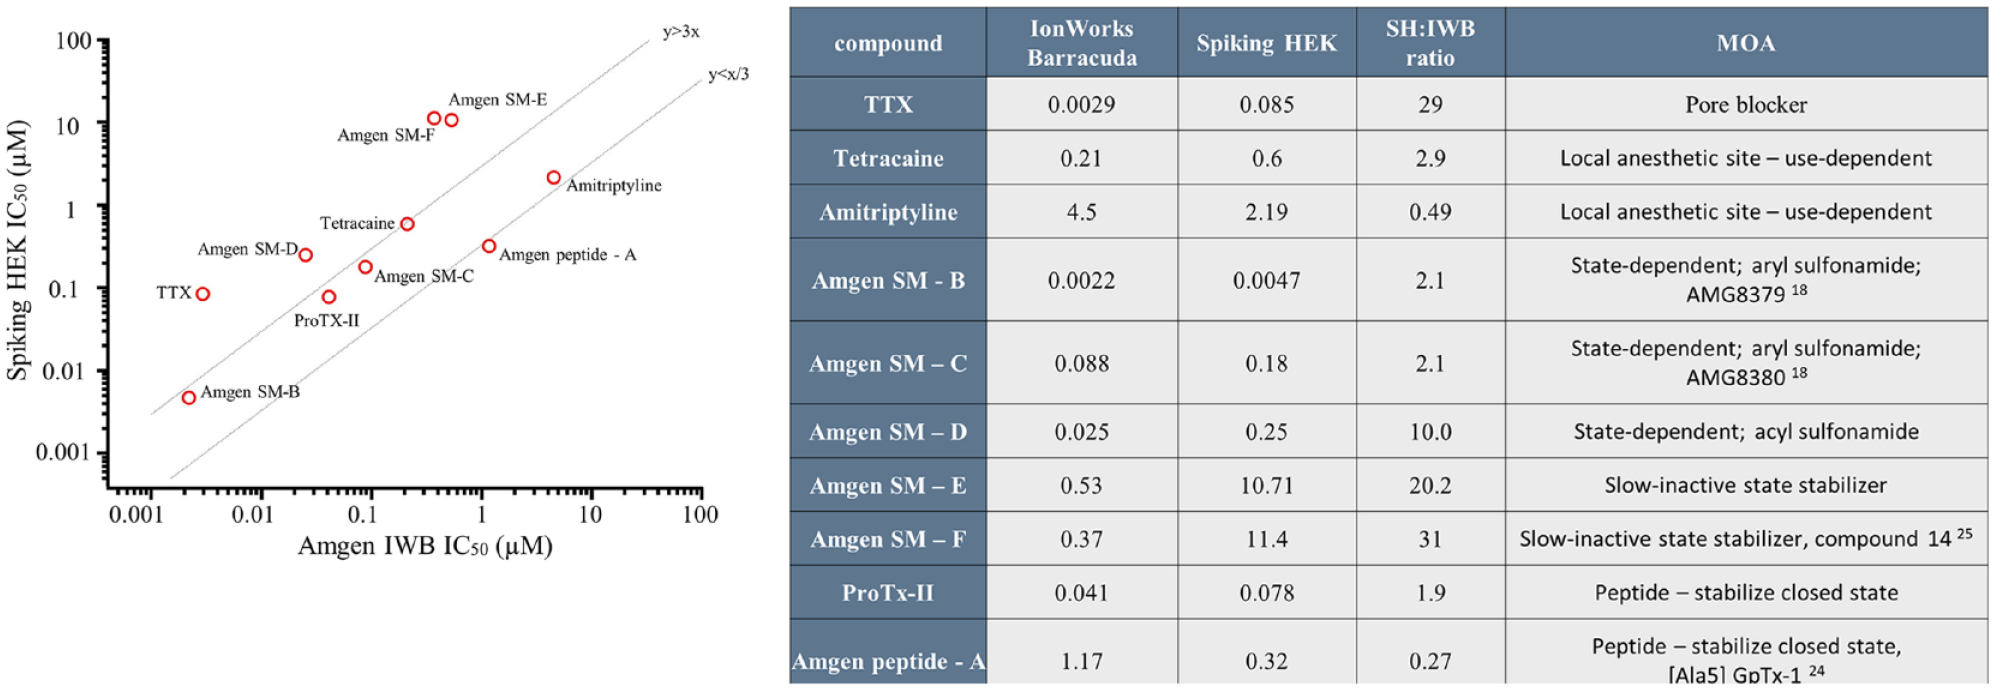
Comparison of potency measurements for reference compounds made on both Optopatch Spiking HEK (SH) and IWB platforms. Ten reference compounds were tested in concentration–response format. Each point represents the IC50 of one compound as determined on the Optopatch Spiking HEK assay (y axis) and IWB assay (x axis). Plotted values are shown in the table. The mechanism of action (MOA) for each compound is also shown in the table.
Optopatch Spiking HEK Assay Pilot Screen
Having established acceptable assay performance, we next used the Optopatch Spiking HEK assay to screen 3520 compounds drawn from Amgen’s small-molecule library. These were arrayed on ten 384-well compound plates (designated plates 1–10; eight plates represented compounds with maximum diversity from Amgen’s small-molecule library and two plates represented known Nav1.7 blockers with various potencies). Each compound plate was screened in duplicate using replicate compound and assay plates at a 5 µM compound concentration. The results of the screen are summarized in Figure 4A , which shows mean pseudoLDA scores across duplicate measurements for each compound. Each screening plate contained one column of 16 negative control wells (green circles) exposed to the screening vehicle (0.5% DMSO) and one column of 16 positive control wells exposed to 1 µM TTX (black circles). A hit threshold was set at pseudoLDA = 0.5, resulting in 174 screening hits (blue circles). Note that two plates (plates 2 and 3) exhibited more hits than the other plates. These plates were enriched with a selection of known Nav1.7 blockers. The positive and negative controls are well separated and display low relative variance on all plates, yielding a Z′ value of ≥0.5 that was maintained across all but one of the 20 assay plates ( Fig. 4B ) and indicating excellent assay performance. In comparison, the Z′ value for the IWB assay averaged 0.5. Replicability across paired assay plates was high, as demonstrated by a strong correlation between the first and second replicates of each compound pair across the entire screen ( Fig. 4C ). Some compounds appeared to produce distinct alterations in waveforms ( Fig. 4D ), suggesting the potential of this assay not only to function as a one-dimensional measure of Nav1.7 blockade but also to enable distinctions between different mechanisms of action.
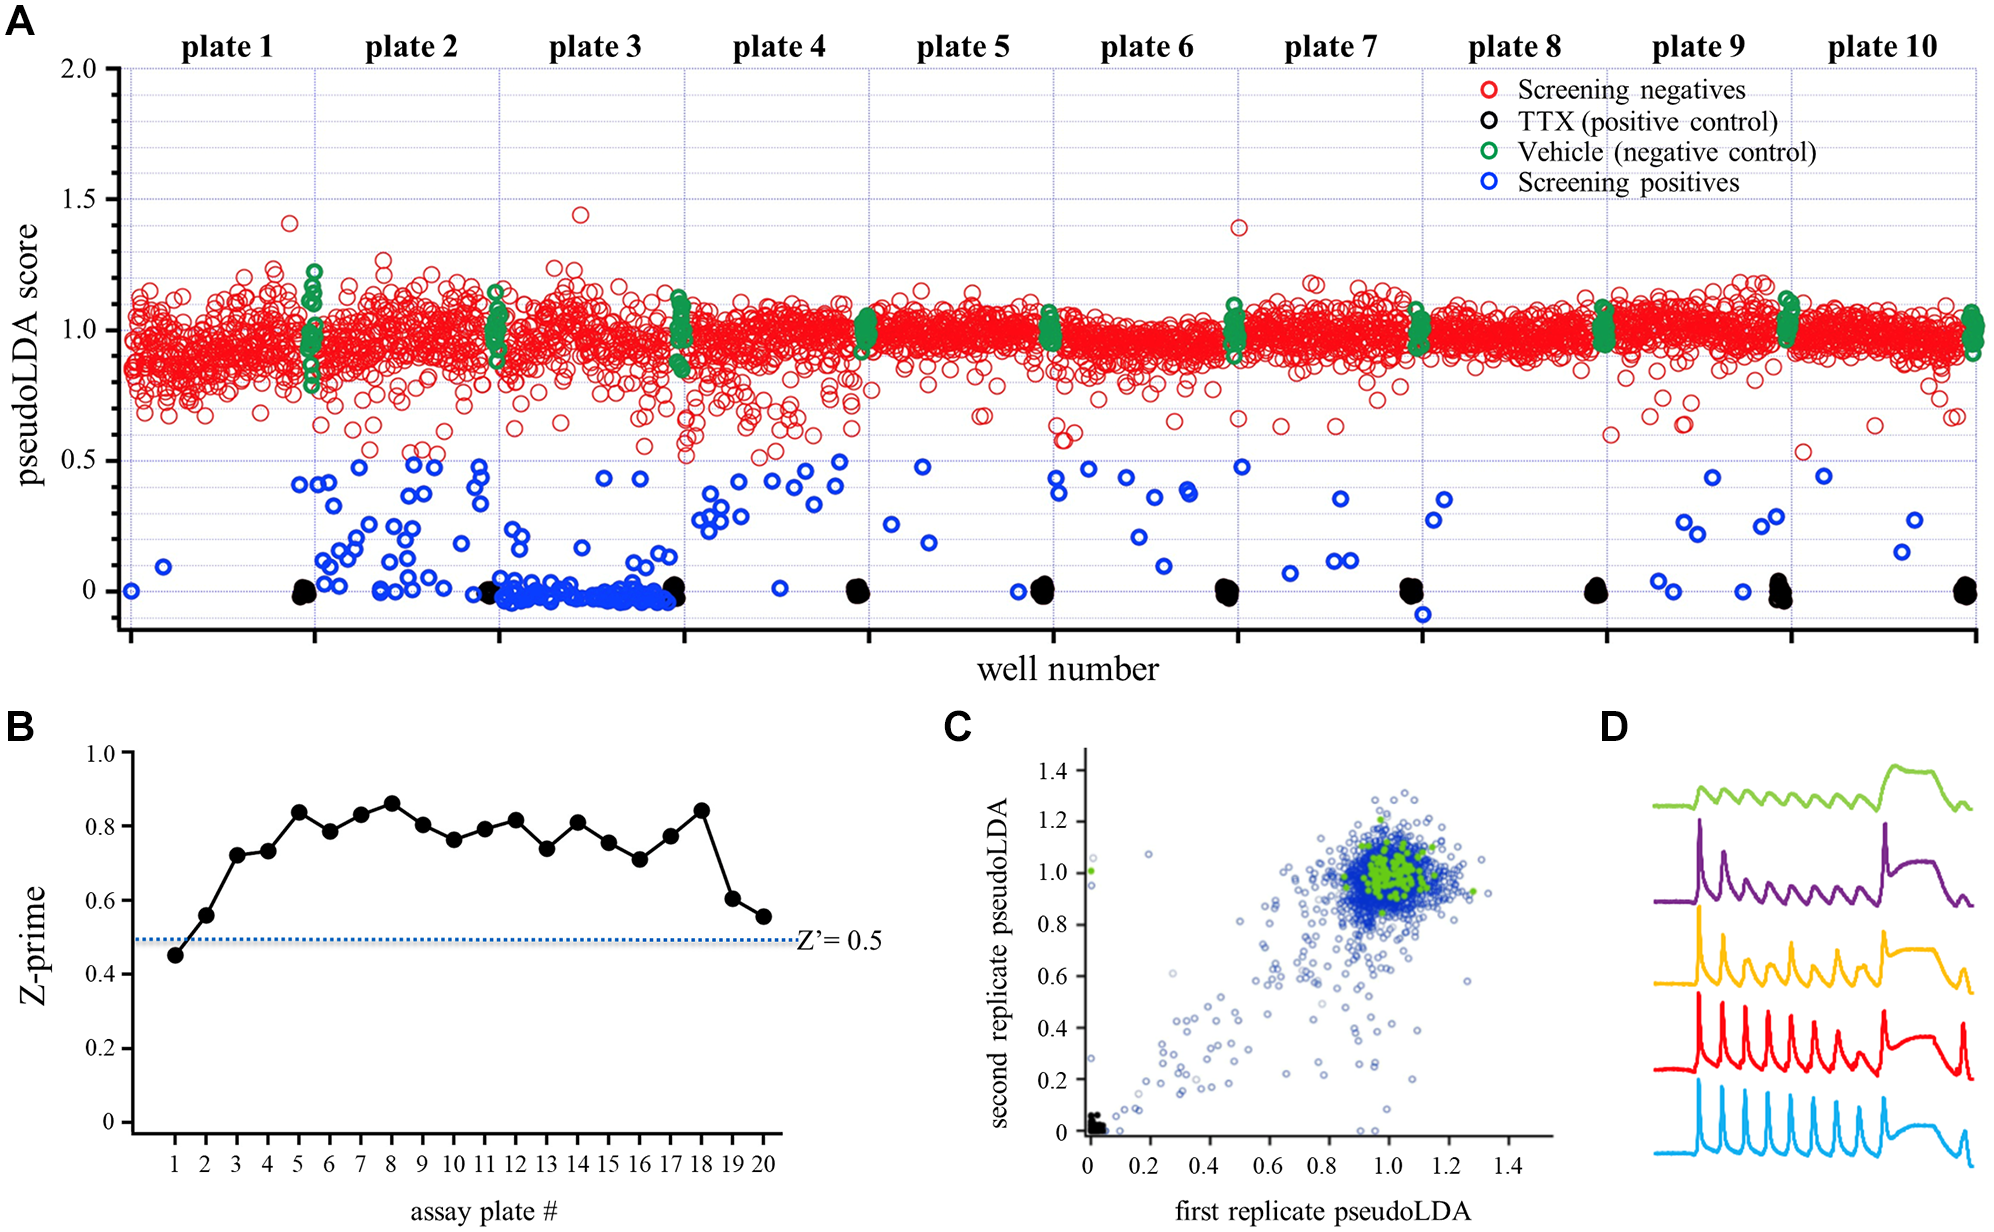
Results and quality control metrics from pilot screen of 3520 compounds screened on the SH platform. (
To enable direct comparison of the Optopatch platform to a commercially available, automated patch clamp platform, the same 3520 compound library was run on the IWB platform using replicates of the same source plates. Screening hits were called on both platforms by imposing a 50% inhibition cutoff (i.e., pseudoLDA < 0.5 for Spiking HEK platform; P26 inhibition < 50% for IWB platform). This resulted in 174 hits on the Spiking HEK (SH) platform and 277 hits on the IWB platform ( Fig. 5A ). Since 143 of these hits were common to both platforms, a total of 308 hits were identified. The difference in number of hits identified by SH and IWB assays could be due to the fact that the SH platform is less sensitive to compounds preferentially acting on the slow inactivated state or compounds with slow binding kinetics ( Fig. 3 ).
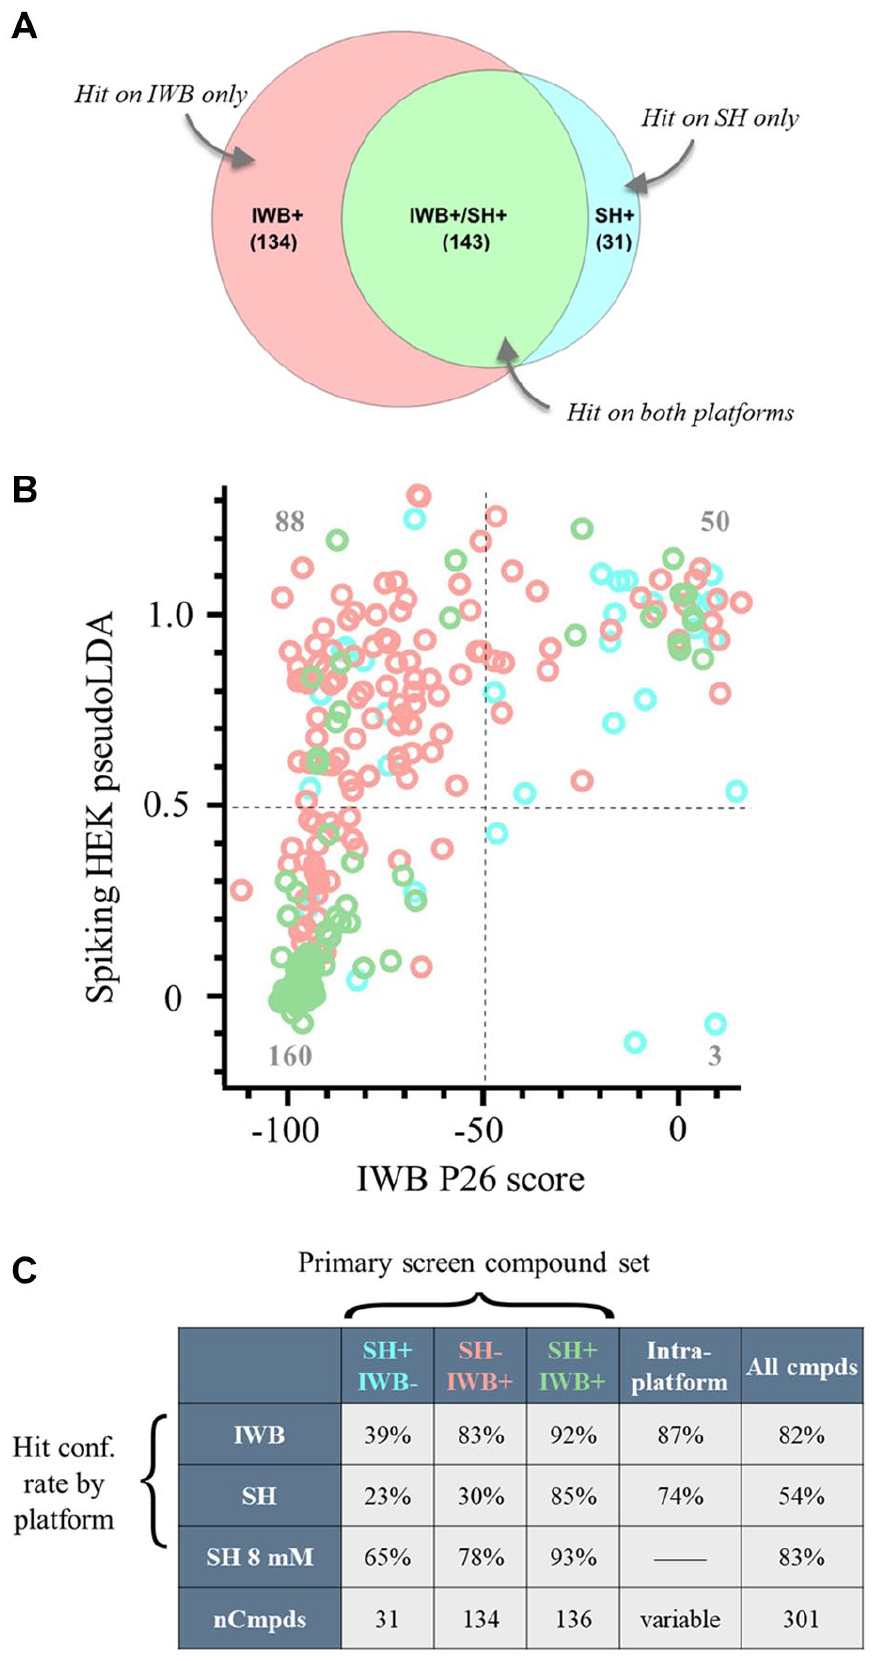
Single-point hit confirmation at screening concentration from SH and IWB assays. (
Optopatch Spiking HEK Assay Hit Confirmation
To further establish the fidelity of the Optopatch Spiking HEK assay, we obtained new batches of 301 of the 308 hit compounds identified in the primary screen. These compounds were retested at 5 µM (the screening concentration) on both the Optopatch and IWB platforms. Through use of a hit confirmation threshold of 50% inhibition, the same threshold applied to the primary screening phase; 160 compounds, or just over half, were confirmed by both platforms ( Fig. 5B , bottom left quadrant). Fifty compounds, or just under one-sixth, were not confirmed by either platform. Since compound potency on IWB correlated well with manual patch clamping for Nav inhibitors, 21 we conclude that the Optopatch platform has lower sensitivity but retains high specificity. Sensitivity is here defined as the proportion of active hits that are correctly identified as such in the assay, while specificity is defined as the proportion of negative compounds that are correctly identified as such in the assay. Overall, the sensitivity to the Nav1.7 blockade was higher for the IWB than the Optopatch platform as evidenced by the higher number of screening hits not confirmed by the Optopatch platform ( Fig. 5B , upper left quadrant) as compared with the IWB platform. As discussed further below, Optopatch Spiking HEK assay sensitivity was improved by running the assay in 8 mM bath K+ rather than 6 mM K+. In addition, the Optopatch assay demonstrates high specificity with a very low false-positive rate, because after hit confirmation, only three compounds appear to be Optopatch positive but IWB negative ( Fig. 5B , bottom right quadrant).
The table in Figure 5C provides a summary of hit confirmation activities for platform comparison. Both platforms showed a high intraplatform confirmation rate: 87% of hits identified in the primary screen on the IWB were confirmed on the IWB platform, and 74% of hits identified in the primary screen on the Optopatch were confirmed on the Optopatch platform. Confirmation rates were even higher for compounds identified by both platforms in the screening phase: 92% for the IWB assay and 85% for the Optopatch Spiking HEK assay. In general, the Optopatch assay run in 6 mM K+ performed well but with less sensitivity than the IWB assay. Rerunning hit confirmation on the Optopatch assay in 8 mM K+ improved sensitivity, effectively equalizing the sensitivity of the two assays (see below).
Increasing Assay Sensitivity by Tuning Extracellular Potassium Concentration
Sixteen compounds that were confirmed hits on both assay platforms were selected for further investigation, including concentration–response curve determinations (22-point, 2× dilution series with top concentration 30 µM).
Figure 6A
demonstrates a strong correlation in IC50 values for the two platforms, as was observed for tool compounds (
Fig. 3
). However, again, as with the tool compound analysis, IC50 values determined by the Optopatch Spiking HEK assay were consistently less potent than those determined by the IWB assay. We hypothesized that this might be a result of lack of sustained depolarization (e.g., 4 min depolarization to −20 mV in the IWB assay) in the Optopatch Spiking HEK assay. It has been reported that some Nav1.7 subtype selective blockers have very slow binding kinetics27,28 or preferentially act on the slow inactivated state.
25
For these compounds, it can take very long periods of depolarization (i.e., >30 s) to achieve steady-state inhibition. This condition is satisfied by the long prepulse used in the IWB assay protocol, but not in the Optopatch protocol, where sustained depolarization induced by blue light stimulation will drastically reduce assay throughput because wells are measured serially. Previous studies
19
suggest that it is feasible to mimic a sustained depolarization in an Optopatch-based assay by increasing bath potassium concentration, thereby shifting the resting membrane potential to more depolarized values. Based on these considerations, we raised the bath potassium concentration from 6 to 8 mM and repeated IC50 value determination. At 8 mM potassium, the assay becomes more sensitive to precise levels of Kir2.1 expression; for this reason, we began to introduce Kir2.1 via lentivirus, which allows for more consistent expression levels than transient lipofection. The fluorescent trace under 8 mM potassium is shown in
Increased buffer KCl concentration increases Spiking HEK assay sensitivity. (
Discussion
The gene SCN9A encodes the Nav1.7 voltage-gated sodium channel and remains one of the few genetically validated molecular targets for pain, and thus a possible avenue for development of new nonaddictive pain medications. Humans with homozygous loss-of-function mutations in SCN9A display profound insensitivity to painful stimuli (CIP) 6 in a context of mostly normal CNS function. Although it is possible that the mechanistic basis of CIP involves long-term developmental effects, 29 the validity of Nav1.7 as a pain therapeutic target is strongly supported by a recent study demonstrating that insensitivity to pain develops in mice with an adult-onset Nav1.7 deletion. 30 Despite a strong rationale for this target, progress to develop SCN9A selective therapeutics has yielded limited clinical success. PF-05089771 is a potent and selective sulfonamide Nav1.7 blocker that was well tolerated but failed to show efficacy in painful diabetic neuropathy. 31 The reasons that this compound failed to replicate CIP are unknown or not disclosed, but may include inadequate exposure in the target tissue or a mechanism of channel block that does not replicate CIP in nociceptor signaling in painful diabetic neuropathy. In order to address these concerns, it may be necessary to develop SCN9A blockers based on alternative structural scaffolds and displaying different pharmaceutical and pharmacological properties.
Previous screening and medicinal chemistry efforts have produced a variety of SCN9A inhibitors derived from multiple structural classes. 32 Progress in identifying novel blockers will be directly linked to available screening technologies and capabilities. The first successful medium- to high-throughput assays for sodium channel modulators utilized ligand binding or tracer flux methods. 33 These have been generally superseded by fluorescence-based assays measuring changes in membrane potential 34 or ion flux. 35 These fluorescent assays are high throughput but provide limited mechanistic information, exhibit low temporal resolution, and typically require use of chemical agonists, which can perturb pharmacological sensitivity of targeted channels. The development of high-throughput, automated electrophysiology instruments provides a transformative technology that offers a linear readout of SCN9A function while allowing flexible control of channel activity to model electrical excitability and channel states in nociceptors during pain signaling. However, high cost and limitations in throughput currently present challenges to use of automated electrophysiology instruments in HTS settings and generate a need for additional complementary approaches. Optogenetic approaches have opened new routes for neuroscience drug discovery. 36 Both optogenetic 13 and electrical field stimulation 37 coupled with fluorescent readouts provide nonpharmacological methods to trigger sodium channel activity in HTS-compatible formats. In this study, we have optimized and tested an optogenetic method (Optopatch) to screen for SCN9A inhibitors described in a previous report, 13 which has great potential to satisfy the need for cost-effective, high-throughput Nav channel assays. In contrast to traditional kinetic fluorescent assays, 10 which show reduced sensitivity to compounds binding to voltage sensor domains (VSDs) and have limited temporal resolution, in this study, we demonstrate a fluorescent-based assay that displays sensitivity to a group of diverse compounds.
An initial step in benchmarking a new assay technology is to perform a comparison study with established methods. In this study, we compared results from a pilot screen of 3520 compounds across 10 plates using the Optopatch Spiking HEK assay and an automated electrophysiology instrument, the IWB. Eight plates represented compounds with maximum diversity from Amgen’s small-molecule library and two plates represented Nav1.7 blockers with various potencies previously discovered by Amgen using automated electrophysiology screening campaigns. The IWB enables complex stimulation protocols to probe diverse compound mechanisms in 384-well format and provides a well-characterized reference source for evaluating the performance of the Optopatch Spiking HEK assay. Overall, the Optopatch performance was comparable to that of the IWB. With 8 mM K+ in the bath solution, for 4 of 8 reference compounds potency measurements fell within three times those measured by the IWB ( Fig. 6C ). For the other four compounds, amitriptyline is more sensitive in the Optopatch Spiking HEK assay. And for the remaining three compounds, the Optopatch showed around 5- to 10-fold lower sensitivity than the IWB. However, for one of these, TTX, the Optopatch-measured potency was closer to published values than the IWB value. For the other two compounds (Amgen SM-E and Amgen SM-F), we speculate that the very strong preference toward the slow inactivated states or slow binding kinetics may explain the discrepancies. In the pilot screen, both platforms picked up a large number of hits from a 3520-compound library screen. Through use of a hit threshold of 50% reduction in Nav channel activity, the IWB scored 277 hits, of which the Optopatch Spiking HEK assay picked up just over half ( Fig. 5A ). Eighty-five percent of the compounds that hit on both platforms were confirmed on the Optopatch platform. After stabilizing Kir channel expression in the Spiking HEK cells using lentivirus Kir2.1 transduction and raising the K+ concentration in the assay buffer from 6 to 8 mM to raise the resting membrane potential, the Optopatch assay sensitivity closely matched that of the IWB for both reference compounds and screening hits ( Fig. 6B ). In addition, based on the hit confirmation results after the pilot screen, the Optopatch assay demonstrated high specificity, because the vast majority of the hits identified by Optopatch are confirmed by IWB. However, it remains possible that the hits identified in the Optopatch platform are false-positive hits due to effects on Kir2.1 channels, CheRiff, or gap junctions, all of which could impact regenerative optical spikes in the assay. To eliminate false positives due to these effects, a secondary assay could be run as described in an early publication, 13 in which the optical readout in the presence of TTX is compared with the optical readout in the presence of TTX plus compound. If the modulator acts on a target other than Nav1.7 in the system, one would observe a difference in the waveforms between these two conditions.
Despite the demonstrated potential offered by Nav1.7 Optopatch screening platform, the current assay format still offers limited throughput, owing to its serial (one well at a time) measurement mode. Currently, it takes 70 min to finish a single 384-well plate, resulting in an overall throughput of around 2000 wells per day. One strategy to increase throughput would be to switch to a parallel measurement mode in which multiple wells are measured simultaneously. We are actively developing a next-generation fast plate reader, which allows simultaneous recording from 24 wells in 384- and 1536-well compatible formats, and which covers a wide range of fluorescent sensors. By using this instrument, we have collected preliminary data that demonstrate a successful simultaneous recording of Nav1.7-mediated waveforms from 24 wells (data not shown). This next-generation plate reader could boost throughput of the Optopatch assay by an order of magnitude, such that time on instrument no longer limits throughput. The increased throughput would also allow implementation of more complicated protocols for compound mechanism studies. 13
Supplemental Material
Supplemental_Material_for_Optopatch_VS_IWB_Nav1.7_screen_final – Supplemental material for Correlation of Optical and Automated Patch Clamp Electrophysiology for Identification of NaV1.7 Inhibitors
Supplemental material, Supplemental_Material_for_Optopatch_VS_IWB_Nav1.7_screen_final for Correlation of Optical and Automated Patch Clamp Electrophysiology for Identification of NaV1.7 Inhibitors by Hongkang Zhang, Bryan D. Moyer, Violeta Yu, Joseph G. McGivern, Michael Jarosh, Christopher A. Werley, Vivian C. Hecht, Ryan J. Babcock, Kevin Dong, Graham T. Dempsey, Owen B. McManus and Chris M. Hempel in SLAS Discovery
Footnotes
Acknowledgements
We thank Jesse Mohn and Jane Jacques for technical assistance, Adam Barnett for software engineering support, and Adam Cohen and Jason Luther for helpful discussions. This work was supported by Amgen Inc.
Supplemental material is available online with this article.
Declaration of Conflicting Interests
The authors declared the following potential conflicts of interest with respect to the research, authorship, and/or publication of this article: Hongkang Zhang, Christopher A. Werley, Vivian C. Hecht, Ryan J. Babcock, Kevin Dong, Graham T. Dempsey, Owen B. McManus, and Chris M. Hempel are or were employed by Q-State Biosciences, and their research and authorship of this article was completed within the scope of their employment with Q-State Biosciences. Bryan D. Moyer, Violeta Yu, Joseph G. McGivern, and Michael Jarosh are or were employed by Amgen Inc., and their research and authorship of this article was completed within the scope of their employment with Amgen Inc.
Funding
The authors received no financial support for the research, authorship, and/or publication of this article.
References
Supplementary Material
Please find the following supplemental material available below.
For Open Access articles published under a Creative Commons License, all supplemental material carries the same license as the article it is associated with.
For non-Open Access articles published, all supplemental material carries a non-exclusive license, and permission requests for re-use of supplemental material or any part of supplemental material shall be sent directly to the copyright owner as specified in the copyright notice associated with the article.