
Abstract
Production of small RNAs by ribonuclease III Dicer is a key step in microRNA and RNA interference pathways, which employ Dicer-produced small RNAs as sequence-specific silencing guides. Further studies and manipulations of microRNA and RNA interference pathways would benefit from identification of small-molecule modulators. Here, we report a study of a fluorescence-based in vitro Dicer cleavage assay, which was adapted for high-throughput screening. The kinetic assay can be performed under single-turnover conditions (35 nM substrate and 70 nM Dicer) in a small volume (5 µL), which makes it suitable for high-throughput screening in a 1536-well format. As a proof of principle, a small library of bioactive compounds was analyzed, demonstrating potential of the assay.
Introduction
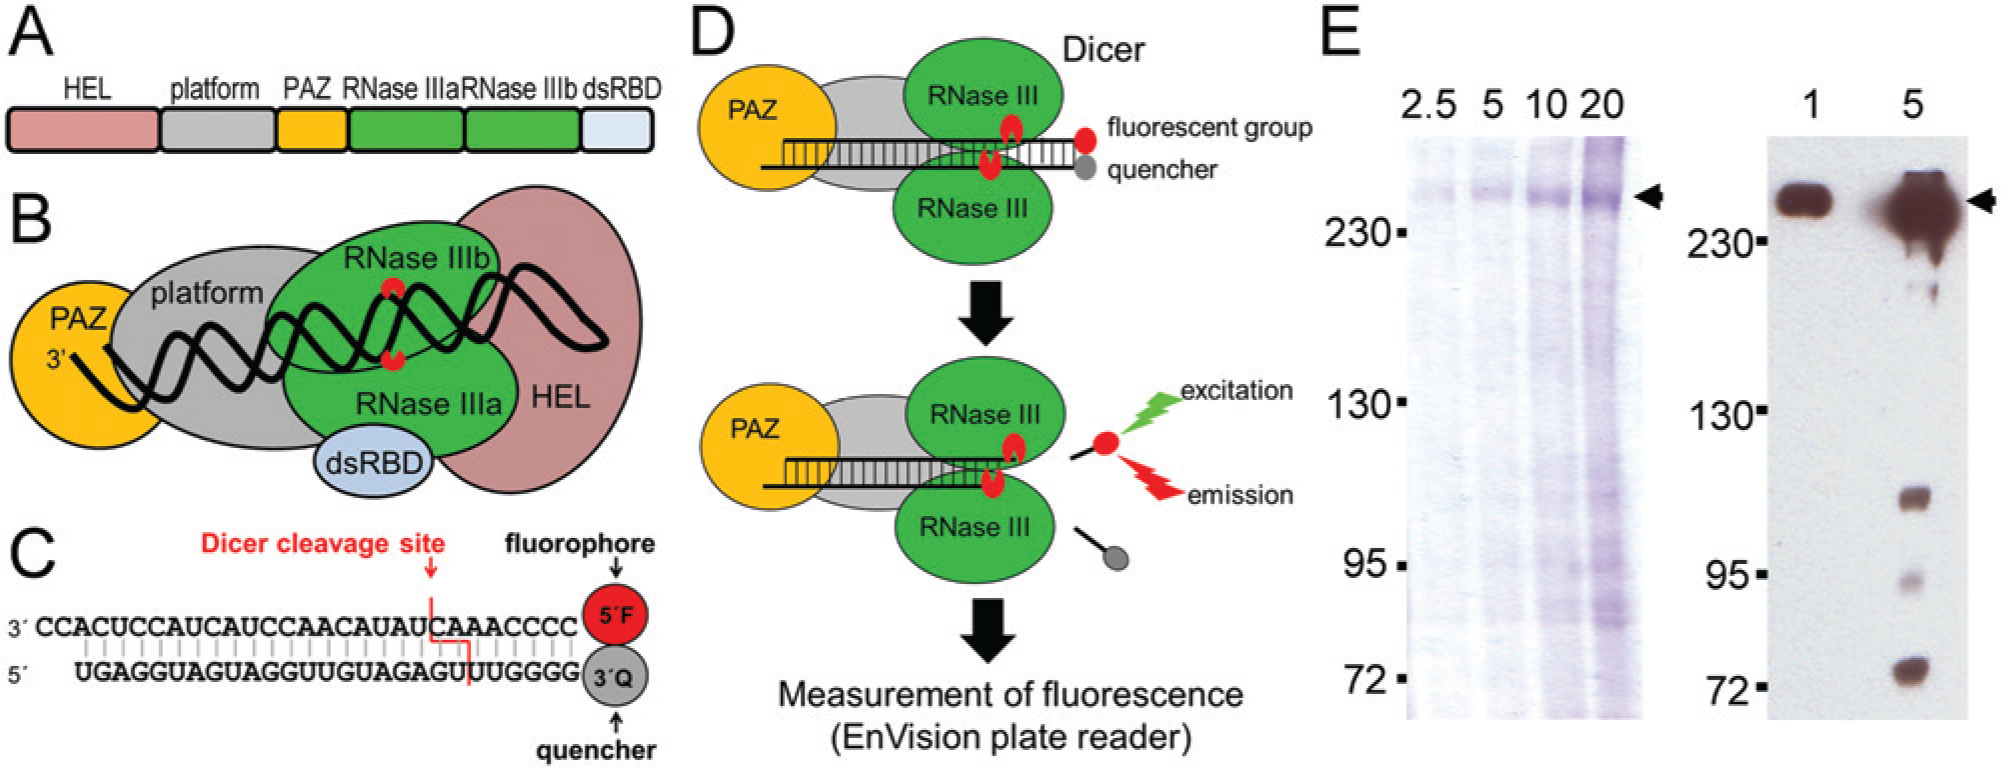
Mammalian RNA inteference (RNAi) and microRNA (miRNA) pathways are posttranscriptional silencing mechanisms of high importance in biomedicine and biotechnology. Both pathways are initiated by different RNA molecules but employ a single Dicer ribonuclease III (RNase III) producing small RNAs, which function as silencing guides (reviewed in Jinek and Doudna 1 and Ketting 2 ). A single mammalian Dicer gene encodes a large (~215-kDa) multidomain protein ( Fig. 1A ). Structural analyses of the human Dicer revealed an L-shaped structure comprising the head, body, and base.3 –5 The head is formed by the PAZ (piwi/argonaute/zwille) domain having a high affinity for a 3′ protruding two-nucleotide overhang.6 –8 A “platform” separates the PAZ domain from the Dicer cleavage site formed by two RNAse III domains that are localized in the “body.” RNAse III domains form a single processing center where each RNase III domain cleaves one strand of the RNA duplex. Near the RNase III catalytic site is a double-stranded RNA (dsRNA) binding domain. The base of Dicer carries an N-terminal DExD/H-box helicase domain forming a clamp-shaped structure. 3 The helicase domain of the human Dicer facilitates recognition of pre-miRNA loops, and moving of the long dsRNA substrate through the enzyme can be facilitated by Dicer helicase. 3 During cleavage, Dicer functions as a molecular ruler and defines the ~22-bp length of the product as a distance between the PAZ domain and the RNase III domains ( Fig. 1B ).7,8 Dicer cleavage is magnesium dependent. Unlike Dicer in Drosophila, the mammalian Dicer cleaves the dsRNA substrates without the need for adenosine triphosphate (ATP). 9
Fluorescent in vitro Dicer cleavage assay: (
Different factors can affect Dicer kinetics, efficiency, and specificity. Although mammalian Dicer cleaves both imperfectly base-paired hairpins of pre-miRNAs and perfect RNA duplexes, processing of pre-miRNA duplexes is more that 100 times faster than perfect long dsRNA under multiple turnover conditions. 10 Apparently, the rate of substrate cleavage is attenuated by the Dicer helicase domain. 11 Deletion or mutation of the helicase domain increases the activity of the human Dicer up to 65-fold compared with intact enzyme. 11 It has been suggested that the helicase domain inhibits Dicer until its interaction with other proteins, such as TAR-binding protein 2 (TRBP2). TRBP2 physically interacts with the helicase domain 11 and stimulates cleavage of both pre-miRNA and long dsRNA substrates by ~5-fold under multiple turnover conditions, presumably through stabilization of Dicer-substrate complexes. 10
A highly efficient, low-cost, safe, and robust assay is a prerequisite for successful high-throughput screening (HTS). Until now, several assays for monitoring Dicer activity in vitro were developed.12 –14 In vitro cleavage assays employed different Dicer substrates, such as perfect RNA duplexes of various lengths (30–150 bp) with or without 3′ overhangs9,13,14 or substrates mimicking pre-miRNA structure. 12 Cleavage assays have typically been based on processing of radiolabeled dsRNA substrates by recombinant Dicer and detection of cleaved products by electrophoresis.9,14 However, this type of assay is not suitable for HTS. A conceivable solution is an assay yielding fluorescence upon cleavage by Dicer12,13 where cleavage of a substrate carrying fluorescent and quencher groups in close proximity results in separation of a fluorophore and a quencher.
Here, we present development and use of a fluorescent cleavage Dicer assay for screening chemical compound libraries. This assay has been validated in HTS in terms of its affordability, safety, robustness, adaptability to low volumes, and suitability for automation using a library of 2816 small bioactive compounds.
Materials and Methods
Protein Expression and Purification
pDEST-Dicer-HisC vector for expression of C-terminally His6-tagged human Dicer was kindly provided by Witold Filipowicz. 14 Bacmids for insect cell transformation and recombinant virus expressing tagged human Dicer for insect cell infection were generated according to Bac-to-Bac Baculovirus Expression System (Invitrogen, Carlsbad, CA) manufacturer’s recommendations. Approximately 2 × 10⁹ Sf9 insect cells were infected with recombinant baculovirus (multiplicity of infection ~1.0). Cells were grown at 28 °C in TNM-FH insect medium supplemented with 10% fetal calf serum (Invitrogen), penicillin (100 U/mL; Invitrogen), streptomycin (100 mg/mL; Invitrogen), and 0.1% Pluronic (Sigma-Aldrich, St. Louis, MO) and harvested 72 h after infection. Cells were gently pelleted by centrifugation and divided into eight batches, which were consecutively processed as follows: cells were resuspended in 20 mL of ice-cold binding buffer (20 mM Tris-HCl [pH 7.5], 100 mM NaCl, 1 mM MgCl2, 10% glycerol, 0.5% Triton X-100, EDTA-free protease inhibitor mixture [Roche, Basel, Switzerland], and 2 mM PMSF [Sigma-Aldrich]) and disrupted by five passages through a 20-gauge needle followed by five passages through a 26-gauge needle. The lysate was cleared by centrifugation at 12,000 g for 1 h at 4 °C. The supernatant was mixed with 5 mL of binding buffer–equilibrated Talon affinity resin (BD Biosciences Clontech, Palo Alto, CA), washed alternately with binding buffer and washing buffer 800 (binding buffer containing 800 mM NaCl), and eluted with ~10 mL of elution buffer (binding buffer containing 40 mM imidazole). Fractions containing Dicer were pooled and dialyzed in 10,000 MWCO Slide-A-Lyzer Dialysis Cassettes (Thermo Scientific, Waltham, MA) against 1 L of dialysis buffer (20 mM Tris-HCl [pH 7.5], 100 mM NaCl, 1 mM MgCl2, 50% glycerol, and 0.1% Triton X-100) 14 overnight. All purification steps were carried out at 4 °C. Protein concentration was determined using a Bio-Rad Protein Assay (Bio-Rad, Hercules, CA), and the proteins in dialysis buffer were stored at −80 °C. The purity and concentration of recovered Dicer were analyzed by electrophoresis on 6% sodium dodecyl sulfate–polyacrylamide gel electrophoresis (SDS-PAGE) gel followed by the Coomassie brilliant blue staining and by Western blotting ( Fig. 1E ). For Western blotting analysis, the purified Dicer was resolved on 6% SDS-PAGE and semidry-transferred onto a PVDF membrane. The membrane was stained at 4 °C overnight with the mouse monoclonal anti–poly-Histidine Peroxidase Conjugate antibody (A7058-1VL, 1:2000; Sigma-Aldrich). The signal was developed using SuperSignal West Pico Chemiluminescent Substrate (Thermo Scientific).
dsRNA Substrate Preparation
To prepare fluorescent dsRNA substrate, fluorophore-labeled (2 pmol from 100-µM stock in RNase-free water) and quencher-labeled (2.2 pmol from 100-µM stock) RNA strands were mixed in annealing buffer (100 mM NaCl, 50 mM HEPES, pH 7.4) in a final volume of 100 µL. Annealing was performed by heating the mix at 90 °C for 10 min followed by a slow (1 °C/90 s) cooling to 4 °C. The annealed dsRNA was diluted in Dicer assay buffer to the working concentration.
Fluorescent In Vitro Dicer Assay
Dicer assays were carried out in the Dicer assay buffer (30 mM Tris-HCl [pH 8], 50 mM NaCl, 3 mM MgCl2, 0.25% Triton-X100, and 15% glycerol) in black, flat-bottom, polystyrene 384-well or 1536-well microplates (Corning, Inc., New York, NY). Typically, the assays were performed as single turnover with the Dicer enzyme in molar excess over the substrate. Specific concentrations of annealed fluorescently labeled RNA substrate and recombinant Dicer are indicated in the text. Samples were incubated at 37 °C and 100% humidity to minimize evaporation. Fluorescence of the reaction mixture was measured at indicated time points using the EnVision multilabel reader (PerkinElmer, Waltham, MA) equipped with a Bodipy TMR (PerkinElmer, Waltham, MA) optimized filter set (excitation filter = 647 nm and emission = 665 nm for fluorophore Cy5 and excitation filter = 494 nm and emission = 519 nm for fluorophore 5(6)-FAM).
HTS of a Chemical Library
For screening, we have used a library of 2816 bioactive compounds, which contained compounds from the following libraries: Sigma LOPAC 1280, National Institutes of Health Clinical Collection, and Prestwick Chemical Library. The library was stored in DMSO in 384-well polypropylene plates, and its screening was carried out on a fully automated robotic platform cell::explorer (PerkinElmer) in a 1536-well format. First, recombinant Dicer was diluted to the working concentration of 70 nM in the Dicer assay buffer. Dicer solution was dispensed (4 µL/well) into black polystyrene 1536-well plates (Corning, Inc.) by a Multidrop Combi liquid dispenser (Thermo Scientific). The plates were immediately stored in an incubator at 4 °C until the screen was initiated. When the screen started, the compounds were transferred from the 384-well compound stock plates to the 1536-well assay plate on a Janus Automated Workstation (Perkin Elmer) integrated to the cell::explorer and equipped with a 384 pin tool (V&P Scientific, San Diego, CA). Three consecutive transfers of 25 nL of each compound solution were made to achieve the 15-µM final concentration of the screened compounds. After adding compounds, the plate was shaken for 30 s on the Variomag plate shaker (Thermo Scientific) and then incubated for 30 min at 37 °C to allow binding of potential inhibitors to the enzyme. Following the incubation, 1 µL of the 175-nM substrate in the Dicer assay buffer was dispensed to each well, the plate was briefly shaken, and fluorescence intensity was recorded with the EnVision (PerkinElmer) multimode plate reader equipped with a Bodipy TMR optimized filter set (excitation filter = 647 nm and emission = 665 nm). The plate was then incubated at 37 °C and periodic measurements of the fluorescent intensity were carried out every hour for the following 24 h.
HTS Data Analysis
The data from the kinetic screen were stored in an internal database and analyzed with in-house–developed algorithms and by Knime (Zurich, Switzerland). First, the autofluorescent compounds were filtered out, and then the recorded data were normalized to the background fluorescence of each sample at time = 0 h and to the fluorescence intensity generated by control samples treated by no compounds. These samples were present on each plate in one separate column. Moreover, each row was normalized independently to the control samples to remove artifacts introduced by uneven performance of individual tubes in the Multidrop dispenser, resulting in slight differences in reagent dispensing. JKlustor was used for clustering and diversity analysis of validated hits (JChem 5.11.5, 2013; ChemAxon, Hungary, Budapest).
Results
Principle of the Fluorescent In Vitro Dicer Assay
The fluorescent in vitro Dicer assay is based on cleavage of a 27-nucleotide-long perfect RNA duplex containing a 2-nucleotide 3′ overhang at one terminus and a blunt end at the other one. At the blunt end, one RNA strand carries a fluorescent group and the other strand a quencher ( Fig. 1C ). During cleavage by Dicer, the two-nucleotide 3′ overhang is recognized by the PAZ domain, and the cleavage releases a short duplex carrying the fluorophore and the quencher. Subsequent separation of the fluorophore from the quencher yields fluorescence ( Fig. 1D ).
Selection of an Optimal Fluorescent Dicer Substrate
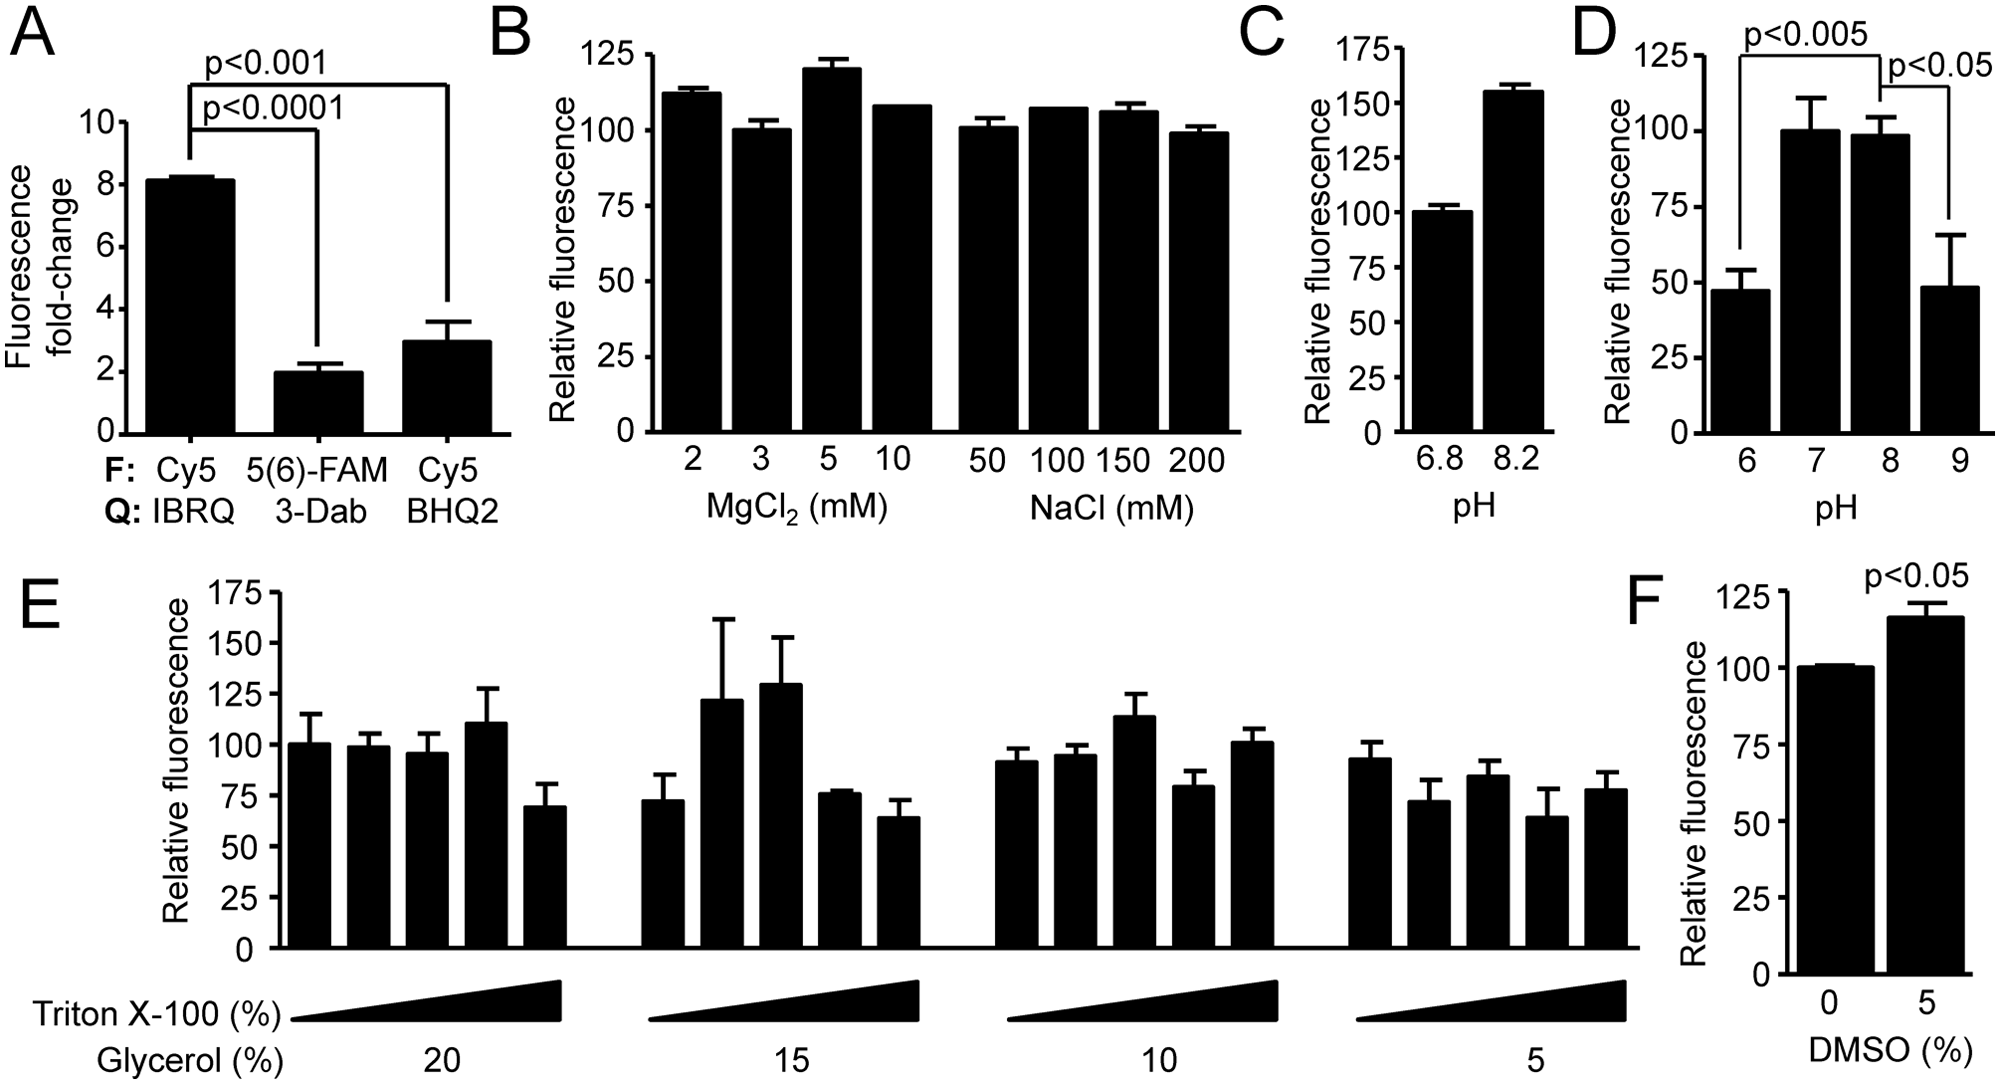
To produce an optimal substrate with minimal background activity and maximal fluorescence intensity upon Dicer cleavage, we tested substrates with different combinations of fluorescent and quencher groups selected based on recommendations of providers and the literature. 13 Initially, we tested 5(6)-FAM fluorescent donor and 3-Dab quencher-labeled strands (5(6)-FAM/3-Dab; Exiqon, Vedbaek, Denmark). Although this combination sufficiently demonstrated feasibility of the assay, two additional combinations of fluorescent and quencher groups were evaluated for HTS. These included Cy5 fluorescent donor and BHQ2 quencher-labeled strands (Cy5/BHQ2; Sigma-Aldrich) and Cy5 fluorescent donor and IowaBlackRQ quencher-labeled strands (Cy5/IowaBlackRQ; Integrated DNA Technologies, Coralville, IA), where the latter combination has been published previously. 13 Dicing assays were performed under single-turnover conditions, in which Dicer is present in molar excess (233 nM) over the substrate (33 nM). Under these reaction conditions, the rate of product formation is not limited by product release, since each enzyme molecule reacts at most with one substrate molecule. Interestingly, the different combinations of fluorophore and quencher yielded different ranges of the assay ( Table 1 and Fig. 2A ). While the fluorescence released after Dicer cleavage of the substrate labeled with Cy5/BHQ2 or 5(6)-FAM/3-Dab increased only 2-fold after 3 h, the combination Cy5/IowaBlackRQ achieved an 8-fold increase of fluorescence ( Fig. 2A ). Since Cy5/IowaBlackRQ yielded the best result, it was used for further experiments.
Comparison of Substrate Performance with Fluorophore and Quencher Combinations.
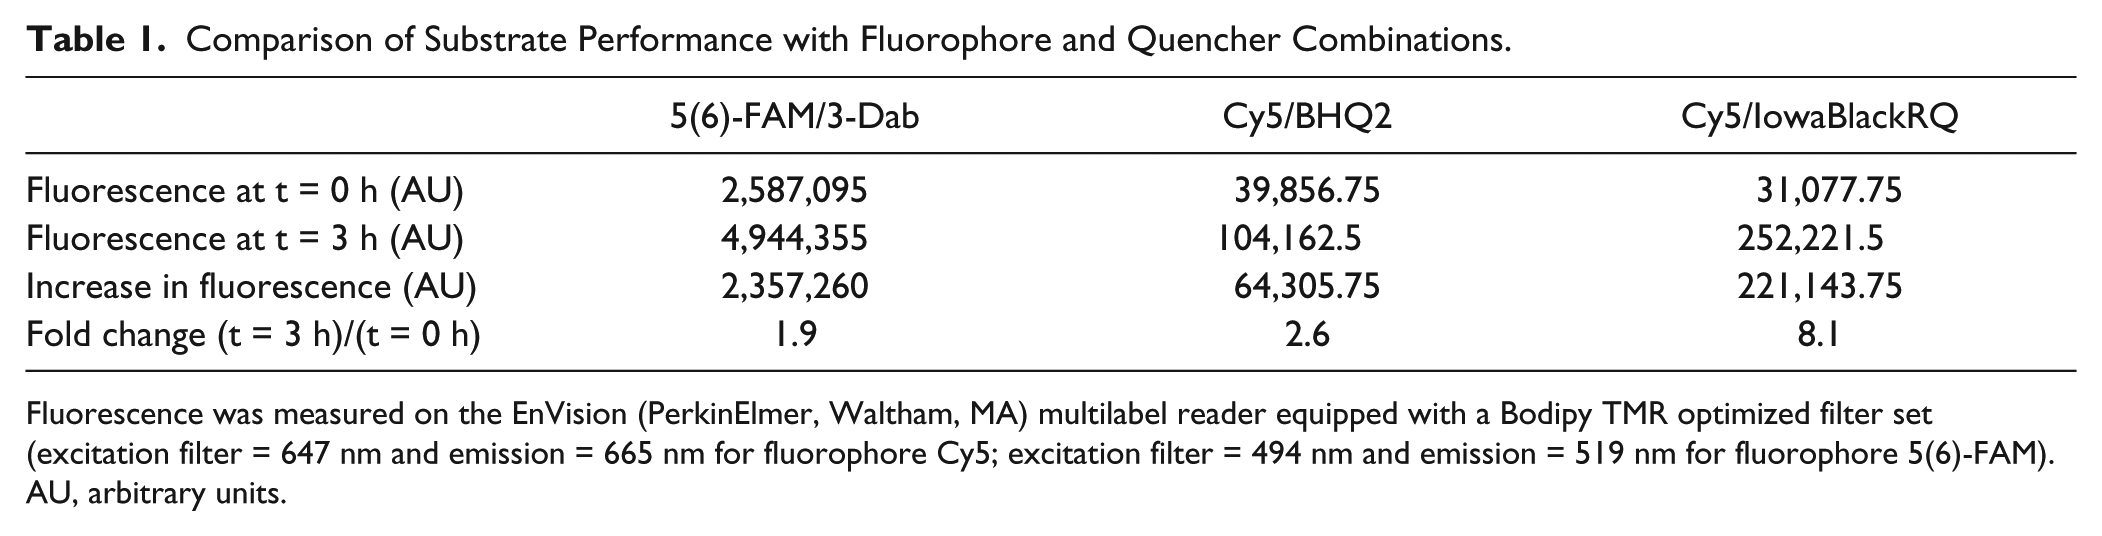
Fluorescence was measured on the EnVision (PerkinElmer, Waltham, MA) multilabel reader equipped with a Bodipy TMR optimized filter set (excitation filter = 647 nm and emission = 665 nm for fluorophore Cy5; excitation filter = 494 nm and emission = 519 nm for fluorophore 5(6)-FAM). AU, arbitrary units.
Assessments of the cleavage assay reaction buffer. (
Optimization of Assay Conditions—pH, Mg2+, and Effect of Additives
To test optimal conditions of the assay, we assessed the influence of pH, Mg2+, and several additives under the single-turnover conditions. As a starting assay buffer, we adopted the Dicer assay buffer (30 mM Tris-HCl [pH 6.8], 50 mM NaCl, 3 mM MgCl2, 0.1% Triton X-100, and 15%–20% glycerol) published by Kolb et al. 14 We made an initial assessment of different concentrations of MgCl2, NaCl, and pH 6.8 and 8.2 in a simple duplicate single-turnover assay (33 nM substrate, 233 nM Dicer, 1-h time point—approximately equal to t1/2). For MgCl2 and NaCl, we did not see any apparent deviations ( Fig. 2B ). Thus, we decided to perform all subsequent experiments with 3 mM MgCl2 and 50 mM NaCl as in the original buffer. 14 On the other hand, pH 8.2 yielded higher relative fluorescence at the 1-h time point ( Fig. 2C ), which prompted more detailed analysis. We used reaction conditions closer to the screening conditions (35 nM substrate, 23 nM Dicer, 3-h time point—approximately equal to t1/2) and examined pH range from 6.0 to 9.0 ( Fig. 2D ). Under these conditions, we did not see any significant difference between pH 7.0 and pH 8.0. At the same time, reactions at pH 6.0 and 9.0 yielded a significant, 2-fold lower fluorescence value relative to pH 7.0 and pH 8.0 ( Fig. 2D ). Considering these results and the fact that DiNitto et al. 13 used a slightly different Dicer assay buffer with pH 9.0 (100 mM Bis-Tris propane [pH 9.0], 150 mM NaCl, and 2 mM MgCl2), we decided to perform subsequent experiments at pH 8.0.
Combinations of glycerol (up to 20% v/v) and Triton X-100 (up to 1% v/v) at reaction conditions similar to the screening conditions (35 nM substrate, 23 nM Dicer, 3-h time point) had only mild effects on mean fluorescence ( Fig. 3E ). In particular, final concentrations of Triton X-100 exceeding 0.75% and glycerol concentrations below 10% reduced mean Dicer activity by tens of percent. However, most of these changes were statistically insignificant. In the end, we decided to use 0.25% Triton X-100 and 15% glycerol for screening conditions. The rationale was that we wanted to use the lower limit of glycerol concentration (15%) from the original Dicer assay buffer, 14 but the combination of 0.1% Triton X-100 and 15% glycerol (lower glycerol range of the original buffer) yielded a lower mean fluorescence than 0.1% Triton X-100 and 20% glycerol (lower glycerol range of the original buffer). Although the difference was statistically insignificant (p = 0.106), we opted for a minimal increase of Triton X-100 to 0.25%.
Optimization of substrate and Dicer concentrations. (
Since DMSO is the most frequently used solvent for chemical libraries, we examined how the addition of DMSO affects Dicer activity in a single-turnover assay (33 nM substrate, 233 nM Dicer, 1-h time point). Addition of up to 5% (v/v) of DMSO into the reaction buffer caused a slight (statistically significant) increase in mean fluorescence at 1 h ( Fig. 2F ). However, DMSO would not interfere with the detection of inhibitory compounds since the final DMSO concentration does not exceed 1% (v/v) under screening conditions.
Enzyme and Substrate Concentrations
Several parameters influenced selection of the substrate concentration for HTS—namely, the dynamic range, sensitivity, the cost, available amount of recombinant Dicer, the conversion rate of the substrate, and the feasibility of the kinetic measurement in the HTS mode.
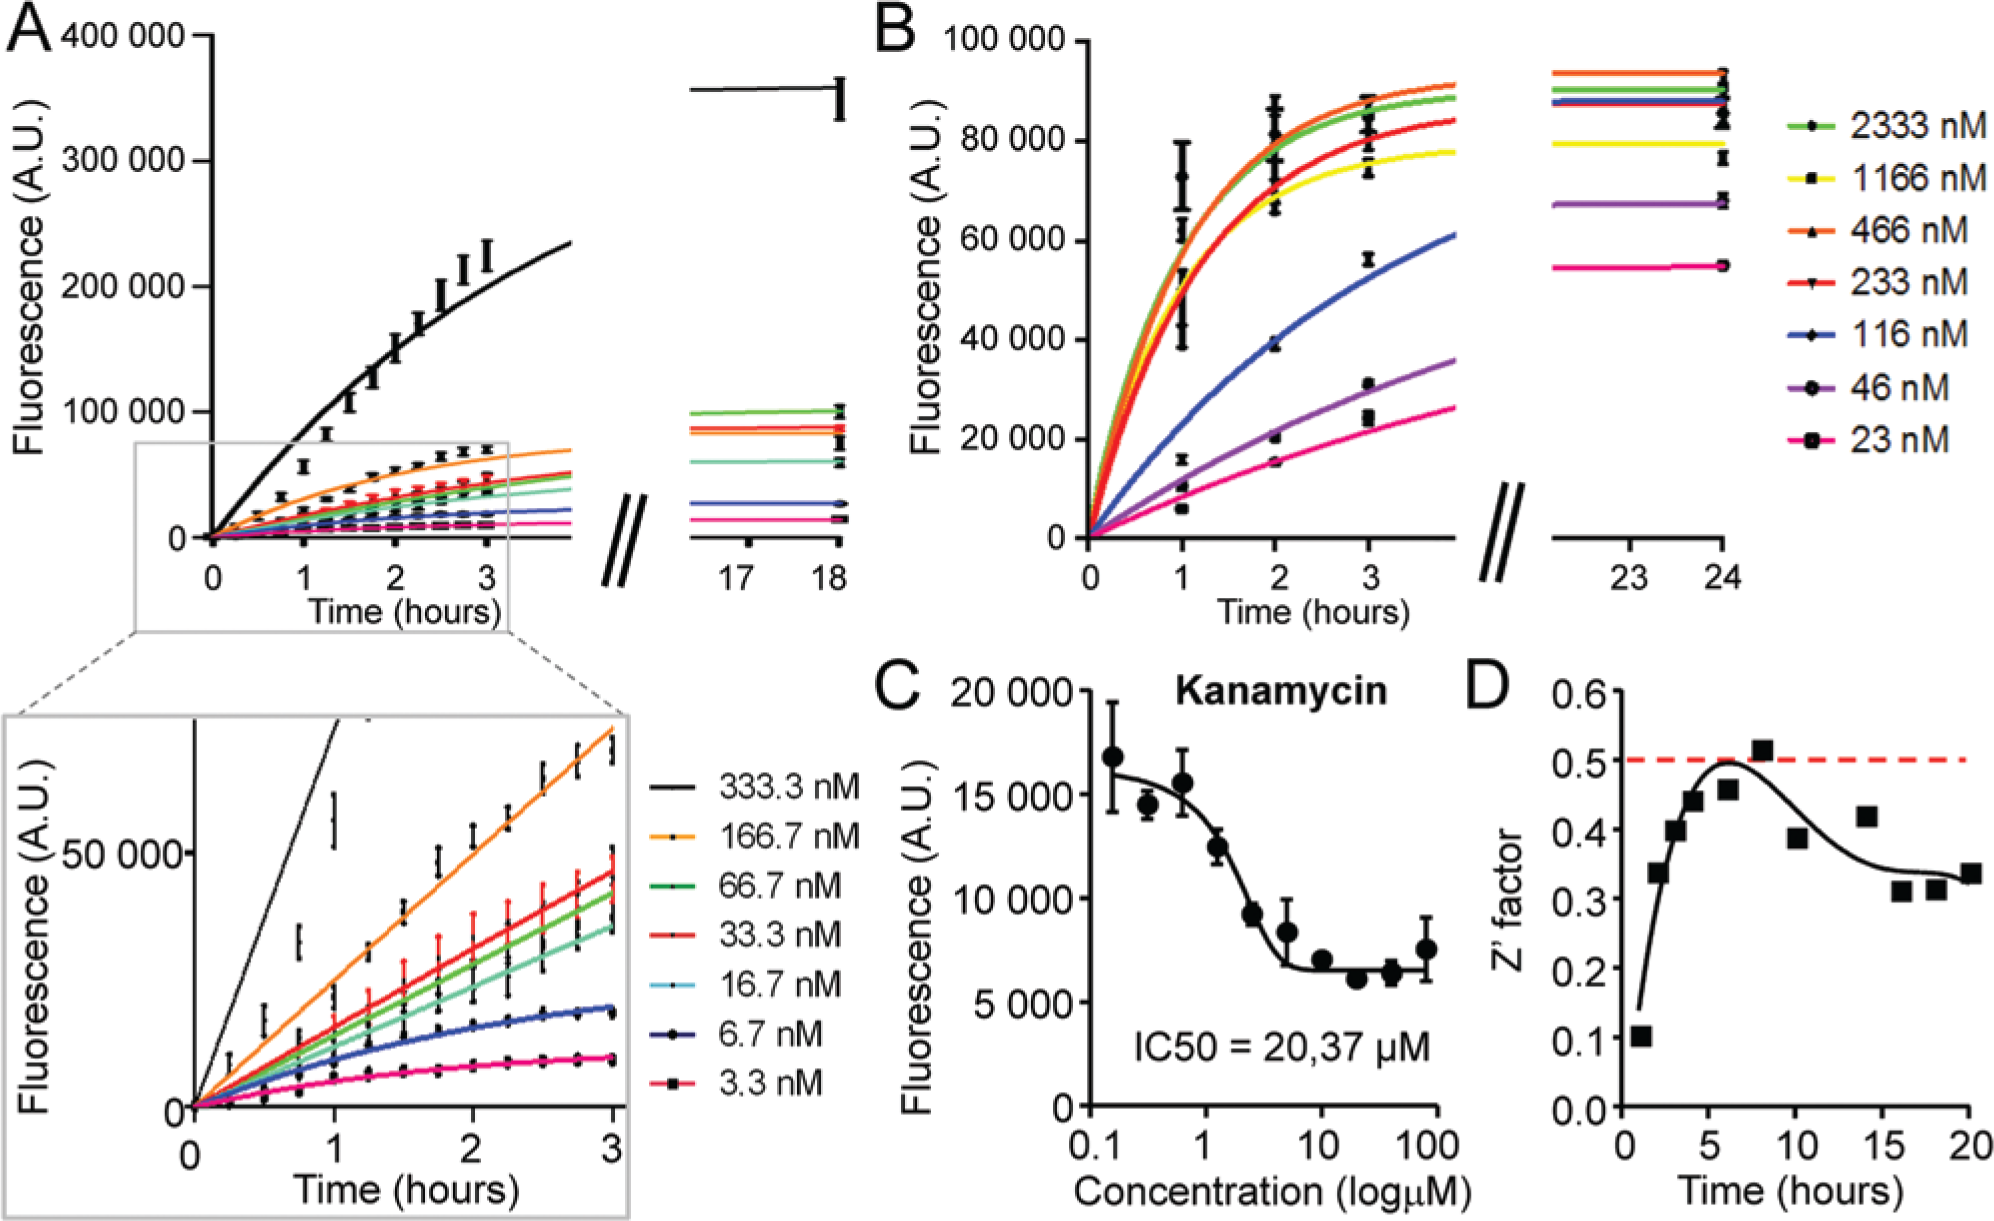
First, we analyzed the range of substrate concentrations giving an acceptable signal-to-noise ratio by processing different concentrations of fluorescently labeled dsRNA substrate by excess of Dicer. In particular, 3 to 333 nM of the dsRNA substrate was processed with 230 nM Dicer, and the fluorescent product was recorded for several hours until the reaction rate decreased to minimum ( Fig. 3A ). Since the sensitivity of the assay is dependent on the concentration of the substrate, we were looking for the lowest acceptable concentration of the substrate in the reaction. Starting from the ~15 nM initial substrate concentration, the reaction generated acceptable signal at 50% of substrate conversion ( Fig. 3A ). When the reaction was carried out to further higher levels of substrate conversion, substrate concentrations below ~15 nM generated acceptable signal at later time points as well. Although the measurement at relatively high levels of substrate conversion improves the dynamic range of the assay, it sacrifices sensitivity at the same time. 15 While the lowest acceptable substrate concentration was determined as 15 nM, 35 nM substrate was used in the later assay development to balance the quality and sensitivity of the assay.
The optimal Dicer concentration was determined by titrating a fixed concentration of the dsRNA substrate (35 nM) with different Dicer concentrations from 23 nM to 2.3 µM ( Fig. 3B ). The concentration of the purified recombinant Dicer was estimated as total protein content in the recombinant Dicer batch, and hence recombinant Dicer concentrations reported in this article should be considered the upper limit, while the concentration of the active recombinant Dicer is presumably the lower limit. At the highest concentrations, the Dicer was present in a large molar excess over the substrate, and the reaction was carried out under the single-turnover conditions, where the reaction rate was not limited by the product release and enzyme recovery. At these concentrations, the reaction progression was fast (t1/2 ~45 min), and the intensity of the fluorescent signal quickly reached the maximum level corresponding to complete substrate conversion ( Fig. 3B ). At an equimolar concentration of Dicer to substrate, the reaction rate was considerably slower (t1/2 ~3–4 h). We also observed that the fluorescent signal did not reach the maximum when the reaction rate declined to zero ( Fig. 3B ). To use the full dynamic range of the reaction at a given substrate concentration and keep the Dicer concentration as low as possible at the same time, we selected 70 nM as the optimal concentration for Dicer in the assay.
To evaluate assay conditions, we used kanamycin, which has been shown to inhibit Dicer activity in vitro. 12 We were able to detect inhibitory effects of kanamycin with IC50 = 20.37 µM ( Fig. 3C ). Results obtained at the 100-µM concentration were comparable to previous results. 12
Adaptation for HTS
To meet specific requirements for the fully integrated HTS robotic station, we downscaled the assay to a total volume of 5 µL per well suitable for 1536-well microplates. To assess the stability and quality of the assay over time, we ran the kinetic experiment for 24 h with previously determined concentrations of substrate (35 nM) with or without 70 nM Dicer and measured the Z′ factor for different times of the reaction ( Fig. 3D ). The Z′ factor reached the maximum around 6 h of the reaction time and subsequently declined. This drop in the quality of the assay at later hours of the reaction was presumably due to the instability of the annealed fluorescent dsRNA substrate, which resulted in increasing fluorescent background signal over time in the absence of Dicer even when RNase inhibitors were added. However, the measurement of the reaction progression should be done at lower substrate conversion points, preferentially before 50% of the substrate is converted, corresponding to a reaction time of ~4 h. At this time, the effect of the increased background fluorescence is minimal and does not strongly affect the quality of the assay.
HTS Screen of Dicer Inhibitors
We performed a kinetic HTS with a bioactive collection of 2816 compounds. The screen was carried out in 1536-well plates and in the kinetic mode for 24 h. The compounds were tested at the final concentration of 15 µM. Data were normalized and analyzed as described in Materials and Methods. The values were normalized to the background fluorescence at time = 0 h and to the control samples where no compounds were added. To identify Dicer-inhibiting compounds, we analyzed the normalized values from the measurements corresponding to 4 h of the reaction time and took only compounds that inhibited the assay by at least 50% ( Fig. 4 ). Furthermore, strongly autofluorescent compounds were removed from the analysis as strong autofluorescence prevailing over fluorescence from the cleavage reaction would impair data quality. Using these criteria, we have found 40 potential inhibitors. Our results did not show any overlap with previous analyses of small compound modulators of RNA silencing. For example, our library of bioactive compounds contains kanamycin A and enoxacin, two compounds previously implicated as modulators of RNA.12,16 Neither of these compounds was found to modulate Dicer at the 15-µM final concentration used in HTS.
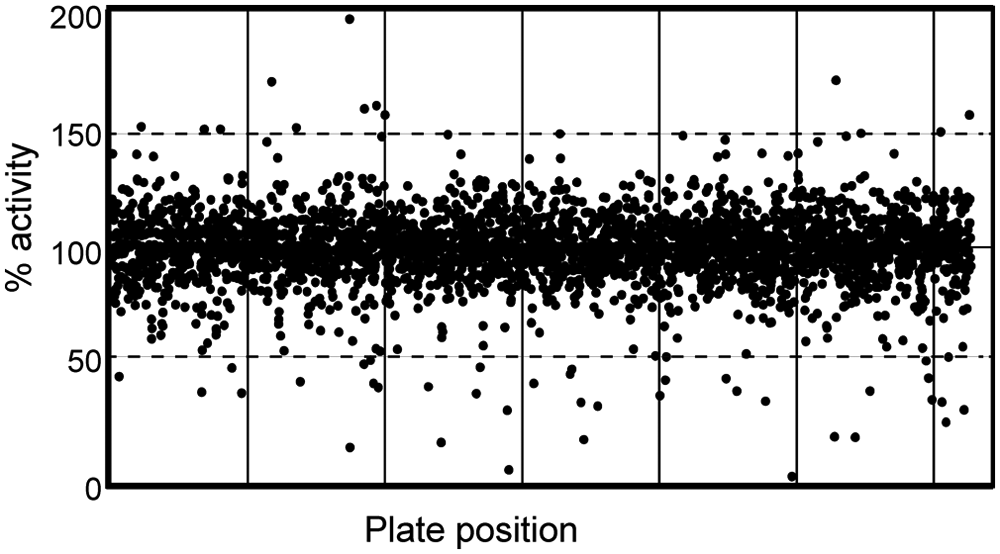
High-throughput screen of Dicer inhibitors. Distribution of activities of 2816 tested compounds. The activity of all tested compounds from the kinetic screen was measured after 4 h from the initiation of the assay, and normalized values were plotted as a function of their respective position in the screened library.
To validate the result of the screen, we cherry-picked all 40 potential inhibitor compounds and performed a dose-response validation experiment in the concentration range from 200 nM to 20 µM under the same conditions as those used in the screening. Twenty-two compounds revealed reproducible dose-response inhibitory activity in the tested concentration range. The remaining 18 compounds did not show a clear dose response or the inhibition effect did not reach 50% of the inhibition in the tested concentration range. The potency of the validated hits was in the range from 0.5 µM to higher concentrations.
Validated compounds showed diversity in terms of the structure and annotated pharmacokinetic properties. Since no established Dicer inhibitor was available, we had only limited means to assess the specificity of the identified potential inhibitors of Dicer. First, we performed structure analysis of 22 validated compounds using JKlustor (ChemAxon). The analysis revealed three scaffolds present in 11 validated hits ( Table 2 ). The other half of compounds did not share any obvious structural similarity. Compounds in clusters I and II are highly related both structurally and functionally. They belong to the same class of biologically active compounds, and the finding that these scaffolds were enriched in the set of validated hits suggests that the described Dicer assay enables one to reproducibly detect specific scaffold-containing small molecules with inhibiting activity. However, the exact mechanism of how these compounds interfere with the assay remains to be elucidated.
Structural Analysis of the Validated Hits.
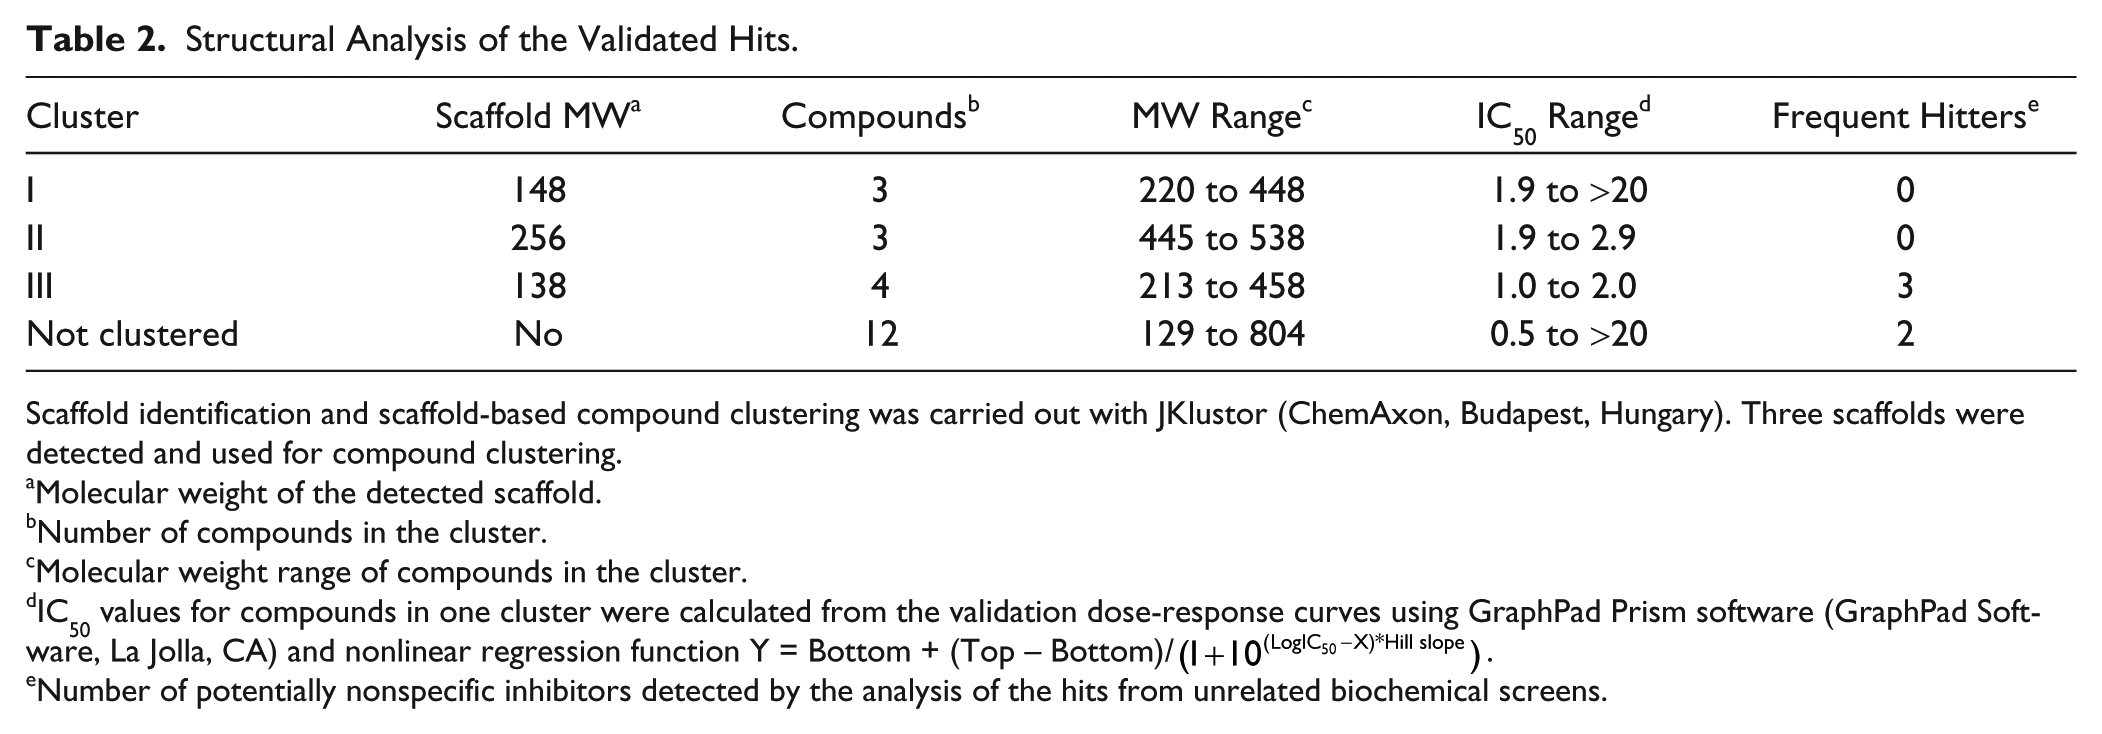
Scaffold identification and scaffold-based compound clustering was carried out with JKlustor (ChemAxon, Budapest, Hungary). Three scaffolds were detected and used for compound clustering.
Molecular weight of the detected scaffold.
Number of compounds in the cluster.
Molecular weight range of compounds in the cluster.
IC50 values for compounds in one cluster were calculated from the validation dose-response curves using GraphPad Prism software (GraphPad Software, La Jolla, CA) and nonlinear regression function Y = Bottom + (Top − Bottom)/(1+10(LogIC50−X)*Hill slope).
Number of potentially nonspecific inhibitors detected by the analysis of the hits from unrelated biochemical screens.
Second, we have compared 22 validated hits from the Dicer screen with a list of validated hits from several unrelated enzymatic screens. We have found five compounds that were active in the Dicer assay and at the same time in at least 70% of all unrelated screens, suggesting that these compounds modulate enzymatic activity of Dicer by a nonspecific manner ( Table 2 ). Interestingly, none of these frequent hitters overlapped with compounds in clusters I and II. On the other hand, compounds from the cluster III were repeatedly found active in other unrelated screens too, which makes them unlikely candidates for specific Dicer inhibitors.
Discussion
We developed high-throughput assay for Dicer activity and used it to screen a compound library. The assay is adapted for HTS in several aspects. Typically, Dicer is processing miRNA precursors, and the kinetics of processing is accelerated by additional protein factors, such as TRBP2. 10 Under single-turnover conditions in vitro, Dicer alone cleaves small hairpin miRNA precursors relatively fast (t1/2 <5 min), 10 which would be unfavorable for HTS. For HTS, a long perfect RNA duplex is a more suitable substrate, since its processing is considerably slower (t1/2 ~80 min in a single-turnover assay with >25-fold molar excess of Dicer for a 35-bp duplex with two-nucleotide overhangs at both ends). 10 Furthermore, a perfect RNA duplex can be easily modified into a substrate, which produces fluorescence upon cleavage. Therefore, although it would be possible to prepare a substrate resembling a structure of a natural pre-miRNA similar to that done previously, 12 we opted for a short (27-nucleotide) RNA duplex, which was easy to synthesize and resembled an artificial siRNA structure described earlier. 17 The sequence of the substrate was derived from a well-characterized human let-7a miRNA, hence allowing for combining our assay with other tools developed for let-7 analysis.
An important feature of the substrate is the optimal combination of the fluorophore and the quencher. We tested three combinations: (1) 5(6)-FAM fluorescent donor and 3-Dab quencher, (2) Cy5 fluorescent donor and BHQ2 quencher, and (3) Cy5 fluorescent donor and IowaBlackRQ quencher. The Cy5/IowaBlackRQ combination was clearly superior. Numerous factors could contribute to the worse performance of Cy5/BHQ2 and 5(6)-FAM/3-Dab substrates. It could be a consequence of suboptimal compatibility of fluorescent and quencher group interactions. The 5(6)-FAM/3-Dab substrate from Exiqon had the highest background fluorescence, which could contribute to the low fluorescence increase during the experiment. It is not clear what was the cause of the different results obtained with Cy5/BHQ and Cy5/IowaBlackRQ substrates, which carry the same fluorophore, yet the relative fluorescence released by Dicer was ~4-fold higher with the Cy5/IowaBlackRQ substrate while the background fluorescence of both substrates was similar. It is not clear whether BHQ2 would affect Dicer binding or whether labeling efficiency and BHQ2 quenching activity could contribute to the lower increase in fluorescence. Notably, a similar substrate design was independently developed for fluorescence-based Dicer assay by DiNitto et al. 13 Their fluorescent substrate is one nucleotide longer, carries a different sequence, uses UU dinucleotide as a 3′ overhang, but carries the same fluorophore/quencher combination and yields comparable results. 13
Reaction buffer for our in vitro Dicer assay was adopted from Kolb et al. 14 with only minor modifications. For HTS, the reaction was downscaled to 5 µL, and we decided for using 35 nM substrate and 70 nM Dicer. This combination yields an acceptable signal-to-noise ratio and relatively slow substrate processing rate (t1/2 ~4 h), which provides enough flexibility for robust monitoring of a large number of reactions at multiple time points in a continuous assay. It should be noted that because we aimed at using lower substrate concentrations, the assay described here is primarily aimed to screen for Dicer inhibitors and may be suboptimal for analyzing Dicer stimulators.
The initial screen of a library of 2816 bioactive compounds identified 40 compounds, which significantly inhibited the assay. A subsequent dose-response assay validated 22 compounds. Interestingly, three common scaffolds were found among the validated compounds, suggesting that some common themes exist in how compounds interfere with the assay. Inhibitory compounds could interfere with Dicer processing in many ways. At this point, it is difficult to discern between compounds specifically inhibiting Dicer and compounds, which affect the assay but are not Dicer-specific inhibitors—for example, protein denaturing or aggregating compounds and compounds affecting substrate structure (intercalating compounds) or interfering with fluorescence. Compounds generally affecting enzymes could be filtered through comparison with results from other enzymatic assays. Indeed, we identified five such compounds among 22 validated hits. Remarkably, some of these compounds overlapped with one of the three identified scaffolds, while none overlapped with the other two. That quenching by compounds can yield false positives is exemplified by ruthenium red, which showed IC50 = 6.2 µM and reached 100% of Dicer inhibition at the 20-µM concentration. Ruthenium red is a hextapositive complex cation, which stabilizes DNA and RNA helices against thermal denaturation, 18 and hence it was an interesting candidate for a Dicer inhibitor. Because ruthenium red has its absorption maximum (534 nm; Sigma-Aldrich) well below that of the Cy5 label used in the screen (excitation maximum = 646 nm/emission maximum = 664 nm), fluorescent quenching was unlikely. However, when ruthenium red (2.5–10 µm) was added to a completed fluorescent cleavage assay (at the 22-h time point), we observed up to 56% lower fluorescence. This shows that ruthenium red reduces fluorescence produced by Dicer cleavage and not Dicer activity per se. Therefore, we recommend including analysis of quenching activity of putative Dicer inhibitors by running a standard fluorescent cleavage assay to completion followed by adding putative Dicer inhibitors and monitoring their quenching effects on fluorescence in a completed Dicer assay.
Regarding Dicer-specific compounds, further experiments are needed to validate them and to delineate their mode of action. Dicer is a multidomain protein, and hence numerous independent modes of inhibition are possible. For example, compounds binding the PAZ or helicase domains may interfere with substrate binding, and compounds binding to RNase III domains may interfere with substrate cleavage. To further classify compounds identified by the Dicer cleavage assay described here, additional assays need to be developed. For example, it is possible to replace the PAZ domain with RNA-binding spliceosomal protein U1A, which binds a loop of specific sequence, which can replace the two-nucleotide overhang of the current substrate. 19 Such Dicer would cleave such hairpin substrate at a stable distance from the loop and would be resistant to inhibitors binding the PAZ domain.
The fact that our results did not show any overlap with previous analyses is not surprising. While we used a biochemical assay directly aimed at compounds modulating Dicer, the previous screens were mainly cell based and monitored performance of an entire RNA silencing pathway. 20 In addition, our assay would poorly detect inhibitors with IC50 > 15 µM, exemplified by kanamycin.
Taken together, our data show that the fluorescence-based Dicer cleavage assay can be readily adapted for HTS and successfully used for identifying candidate modulators of a key step in miRNA and RNAi pathways.
Footnotes
Acknowledgements
We thank Witold Filipowicz for the Dicer clone and Radek Malík for technical assistance and helpful discussions.
Declaration of Conflicting Interests
The authors declared no potential conflicts of interest with respect to the research, authorship, and/or publication of this article.
Funding
The authors disclosed receipt of the following financial support for the research, authorship, and/or publication of this article: This research was supported by GAUK grant 18110 to KP, LC06077 and LM2011022 (MEYS) to PB, and GACR grant 13-29531S and EMBO SDIG program to PS.