
Abstract
GluK1, a kainate subtype of ionotropic glutamate receptors, exhibits an expression pattern in the CNS consistent with involvement in pain processing and migraine. Antagonists of GluK1 have been shown to reduce pain signaling in the spinal cord and trigeminal nerve, and are predicted to provide pain and migraine relief. We developed an ultra-high-throughput small-molecule screen to identify antagonists of GluK1. Using the calcium indicator dye fluo-4, a multimillion-member small-molecule library was screened in 1536-well plate format on the FLIPR (Fluorescent Imaging Plate Reader) Tetra against cells expressing a calcium-permeable GluK1. Following confirmation in the primary assay and subsequent counter-screen against the endogenous Par-1 receptor, 6100 compounds were selected for dose titration to assess potency and selectivity. Final triage of 1000 compounds demonstrating dose-dependent inhibition with IC50 values of less than 12 µM was performed in an automated whole-cell patch clamp electrophysiology assay. Although a weak correlation between electrophysiologically active and calcium-imaging active compounds was observed, the identification of electrophysiologically active compounds with a range of kinetic profiles revealed a broad spectrum of mechanisms of action.
Introduction
GluK1 is a calcium-permeable ionotropic glutamate receptor belonging to the kainate family (KAR) of ionotropic glutamate receptors. 1 Of these receptors, GluK1–3 can form functional homomeric channels or heteromers, whereas GluK5 and GluK6 can only form heteromers with the GluK1-3 subunits. 2 The KARs are part of the larger family of ionotropic glutamate receptors, which includes the AMPA receptors (AMPARs; GluA1–A4) and the NMDA receptors (NMDARs; GluN1-GluN3). GluK1 is highly expressed throughout the central and peripheral nervous systems, most prominently in dorsal root ganglion (DRG) neurons, trigeminal neurons, the cerebellum, the hippocampus, and the retina. 3 Within the DRG, GluK1 is localized in small-cell-diameter, IB4+ neurons. 4 Importantly, GluK1 seems to be the only AMPA–kainate type glutamate receptor expressed within the DRG. 5 Its expression pattern suggests that GluK1 plays a role in mediating the transmission of pain signals from the periphery to the brain. Consistent with this role, GluK1 mRNA in the spinal cord is upregulated in response to hindpaw inflammation, and selective antagonists of GluK1 can attenuate several preclinical pain behaviors. 6 Semiselective GluK1 antagonists were efficacious in reversing capsaicin-evoked mechanical allodynia when administered intracisternally 7 and were shown to significantly reduce the second phase of the formalin response. 8 In addition, GluK1 knockout mice have been shown to be deficient in capsaicin-induced licking and formalin-induced pain behaviors, but still develop mechanical allodynia in response to complete Freund’s adjuvant (CFA). 9 Taken together, these results suggest that antagonism of GluK1 might provide relief in inflammatory pain.
In addition to its expression in DRG, GluK1 is also found in areas corresponding to the ascending trigeminovascular pathway. Elevated levels of glutamate have been measured in migraineurs and in preclinical models of migraine. Levels of glutamate in cerebrospinal fluid also have been reported to correlate with mean headache scores in migraineurs. 10 Central sensitization, a feature of some migraine attacks, involves glutamate signaling. 11 Similar to the results in preclinical pain models described above, semiselective glutamate receptor antagonists were efficacious in several preclinical models of migraine. 12 These same molecules were also taken into clinical trials with migraineurs and found to provide pain relief to 50–54% of patients. 13 Finally, some genetic evidence has linked elevated glutamate signaling with the familial hemiplegic migraine subtype. 14
We set out to develop an ultra-high-throughput screen (uHTS) to identify antagonists of GluK1. Taking advantage of the calcium permeability of GluK1 homotetramers, we used the calcium-detecting dye fluo-4 and the Molecular Devices Fluorescent Imaging Plate Reader (FLIPR; Molecular Devices, Sunnyvale CA) Tetra system in a 1536-well plate format to screen 2×10⁶ compounds. Subsequent steps in the screening plan were designed to remove artifacts and identify true active compounds. This approach included a counter-screen against the GluN2b receptor. Last, we developed an automated whole-cell patch clamp assay to identify compounds with a variety of mechanisms of action on the target.
Materials and Methods
Chemicals
Kainic acid (KA), glutamic acid, DNQX, NBQX, CNQX, glutamate, glycine, ketamine, probenecid, dexamethasone, and MK-801 were all purchased from Sigma-Aldrich (St. Louis, MO). UBP302 was purchased from Tocris (Minneapolis, MN). Concanavalin A (ConA) was purchased from MP Biomedicals LLC (Solon, OH). Par-1 agonist H-Ser-Phe-Leu-Leu-Arg-Asn-OH SFLLRN-mmide was purchased from Peptides International (Louisville, KY).
Cell Preparation
All tissue culture media were purchased from Life Technologies (Grand Island, NY). Human embryonic kidney (HEK) cells stably transfected with human GluK1(Q)1a were obtained from Sophion Bioscience (North Brunswick, NJ). Cells were maintained in Dulbecco’s Modified Eagle Medium (DMEM) with Glutamax, 10% fetal bovine serum, and 1× penicillin/streptomycin (all from Life Technologies), and kept in a 37 °C, 5% CO2 incubator. Cells were harvested with TrpLE (Life Technologies) and centrifuged at 100×g for 5 min. Cells were resuspended in growth media, and the cell density was adjusted to 1.75×10⁶ cells/ml for delivery.
For automated electrophysiology, cells were harvested with Accutase (Life Technologies) from T175 flasks (70–80% confluent) following a wash with divalent ion–free Dulbecco’s Phosphate Buffered Saline (DPBS). Cells were triturated in 293 SFM II (Life Technologies) with 20 mM HEPES and spun in a clinical centrifuge. The cells were resuspended in fresh 293 SFM II with HEPES at ~3×10⁶ cells/mL, transferred to the QStir inside the QPatch-HT, and allowed to recover for 25–45 min prior to the start of the experiment. Cells were used for up to 6 h.
L(tk−) cells stably transfected with GluN2b 15 were grown in DMEM with high glucose and pyruvate, 10% fetal bovine serum, 1× penicillin/streptomycin, 2 mM glutamine, and 1 mg/mL geneticin (all from Life Technologies) . Cells were maintained at 37 °C, 5% CO2.
Calcium-Imaging Assays
All cell plating, washing, and dispensing used the GNF bottle valve washer (Genomics Institute of the Novartis Research Foundation, San Diego, CA). The washer included a 64-tip aspirating head aligned to remove medium from two columns at a time, and an eight-tip angled fluid dispenser that dispensed liquid to a 1536-well plate by row. HEK293 cells stably transfected with GluK1 were seeded into black-walled, clear-bottomed, 1536-well poly-D-lysine (PDL)-coated microplates (plate supplied by Aurora Biosciences, San Diego, CA; custom coated by BioMed Tech, Tampa, FL) (7000 cells/well in 4 µL growth media) and kept in a 37 °C /5% CO2 incubator overnight. On the day of the experiment, the growth media were washed off two times using Hank’s Balanced Salt Solution (HBSS; Life Technologies) with Ca/Mg and containing 20 mM HEPES (Sigma-Aldrich), pH 7.4 (wash buffer), with a final residual well volume of 2 µL. The cells were loaded with 4 µL/well fluo-4 dye buffer (final concentrations 4 µM fluo-4 dye, 0.02% pluronic acid, and 1 mM TR40 [all from Life Technologies] in wash buffer) and incubated at 37 °C, 5% CO2 for 1 h. The dye buffer was washed off two times with wash buffer containing an additional 8 mM CaCl2 (Sigma-Aldrich) (assay buffer), with a final residual well volume of 2 µL. An additional 2 µL of assay buffer containing a final concentration of 1 mg/mL ConA was added to each well and incubated at ambient temperature for 10 min. Test compounds or controls were added via a 30 nL pintool (8 µM final test compound concentration, 0.42% final DMSO concentration) and incubated at ambient temperature for 5 min. The microplate was then read on the FLIPR Tetra (Molecular Devices) illuminated at 490 nm, and fluorescence emission was recorded at 525 nm with a gain setting of 80, an 0.4-s exposure, and an excitation intensity of 60%. After a 5-s baseline read, 3 µL of kainate stimulus prepared in assay buffer was added to the microplate, followed by an additional 100-s read time with a read interval of 1 s. Fluorescence results were calculated as the ratio of the maximum fluorescence signal after kainate stimulus (Max) over the fluorescence signal before the addition of kainate (Min).
Par-1 (Proteinase-Activated Receptor) Counterscreen Method
HEK293 cells stably transfected with GluK1 were prepared for reading on the FLIPR Tetra as described above except that Par-1 agonist was used instead of kainate to stimulate the cells. Fluorescence results were calculated as the ratio of the maximum fluorescence signal after the Par-1 agonist stimulus over the fluorescence signal before addition of the Par-1 agonist.
GluN2b Counter-Method
L(tk−) cells stably transfected with GluN2b were seeded into black-walled, clear-bottomed, 1536-well poly-D-lysine-coated microplates (7000 cells/well in 4 µL growth media containing 10 nM dexamethasone and 500 µM ketamine, both from Sigma-Aldrich) and kept in a 37 °C, 5% CO2 incubator overnight. On the day of the experiment, the growth media were washed off 4× using HBSS without Ca/Mg and containing 20 mM HEPES, 2 mM CaCl2, 0.1% BSA, and 250 µM probenecid, pH 7.1 (wash buffer), with a final residual well volume of 2 µL. The cells were loaded with 4 µL/well fluo-4 dye buffer (final concentrations: 4 µM fluo-4 dye, 0.02% pluronic acid, and 500 µM ketamine in wash buffer) and incubated at 37 °C, 5% CO2 for 1 h. The dye buffer was washed off 4× with wash buffer with a final residual well volume of 2 µL, and an additional 2 µL of assay buffer was added to each well. Test compounds or controls were added via a 30 nL pintool and incubated at ambient temperature for 5 min. The microplate was then read on the FLIPR Tetra illuminated at 490 nm, and fluorescence emission was recorded at 525 nm with a gain setting of 80, and 0.4-s exposure, and an excitation intensity of 60%. After a 5-s baseline read, 3 µL of stimulus containing 10 µM glycine and 10 µM glutamine prepared in wash buffer was added to the microplate, followed by an additional 150-s read time with a read interval of 1 s. Fluorescence results were calculated as the ratio of the maximum fluorescence signal after glycine/glutamine stimulus over the fluorescence signal before addition of glycine/glutamine.
Data Analysis
IC50 values for inhibition in the FLIPR assays were determined according to the Hill equation from concentration–response curves by a nonlinear regression analysis, in which all parameters were left unconstrained. To evaluate the quality of the FLIPR assay, the Z’ factor 16 was calculated using the following equation: Z’ = 1 − ((3 × SDc + SDn) / (C − N)), where SDc and SDn are the standard deviations (SDs) of the DMSO control group (c) and the group in the presence of a control compound inhibiting 100% activity (n); and C and N are the means of the two groups, respectively.
Automated Electrophysiology
For automated electrophysiology, external solution (EC) contained the following (in mM): 140 NaCl, 3 KCl, 1 CaCl2 with 2H2O, 1 MgCl2, 5 HEPES, 5 MES, and 20 TEA-Cl, pH to 7.4 with NaOH. The internal solution (IC) contained (in mM): 140 CsF, 10 NaCl, 10 EGTA, and 10 HEPES, pH to 7.3 with CsOH.
Results
Assay Development
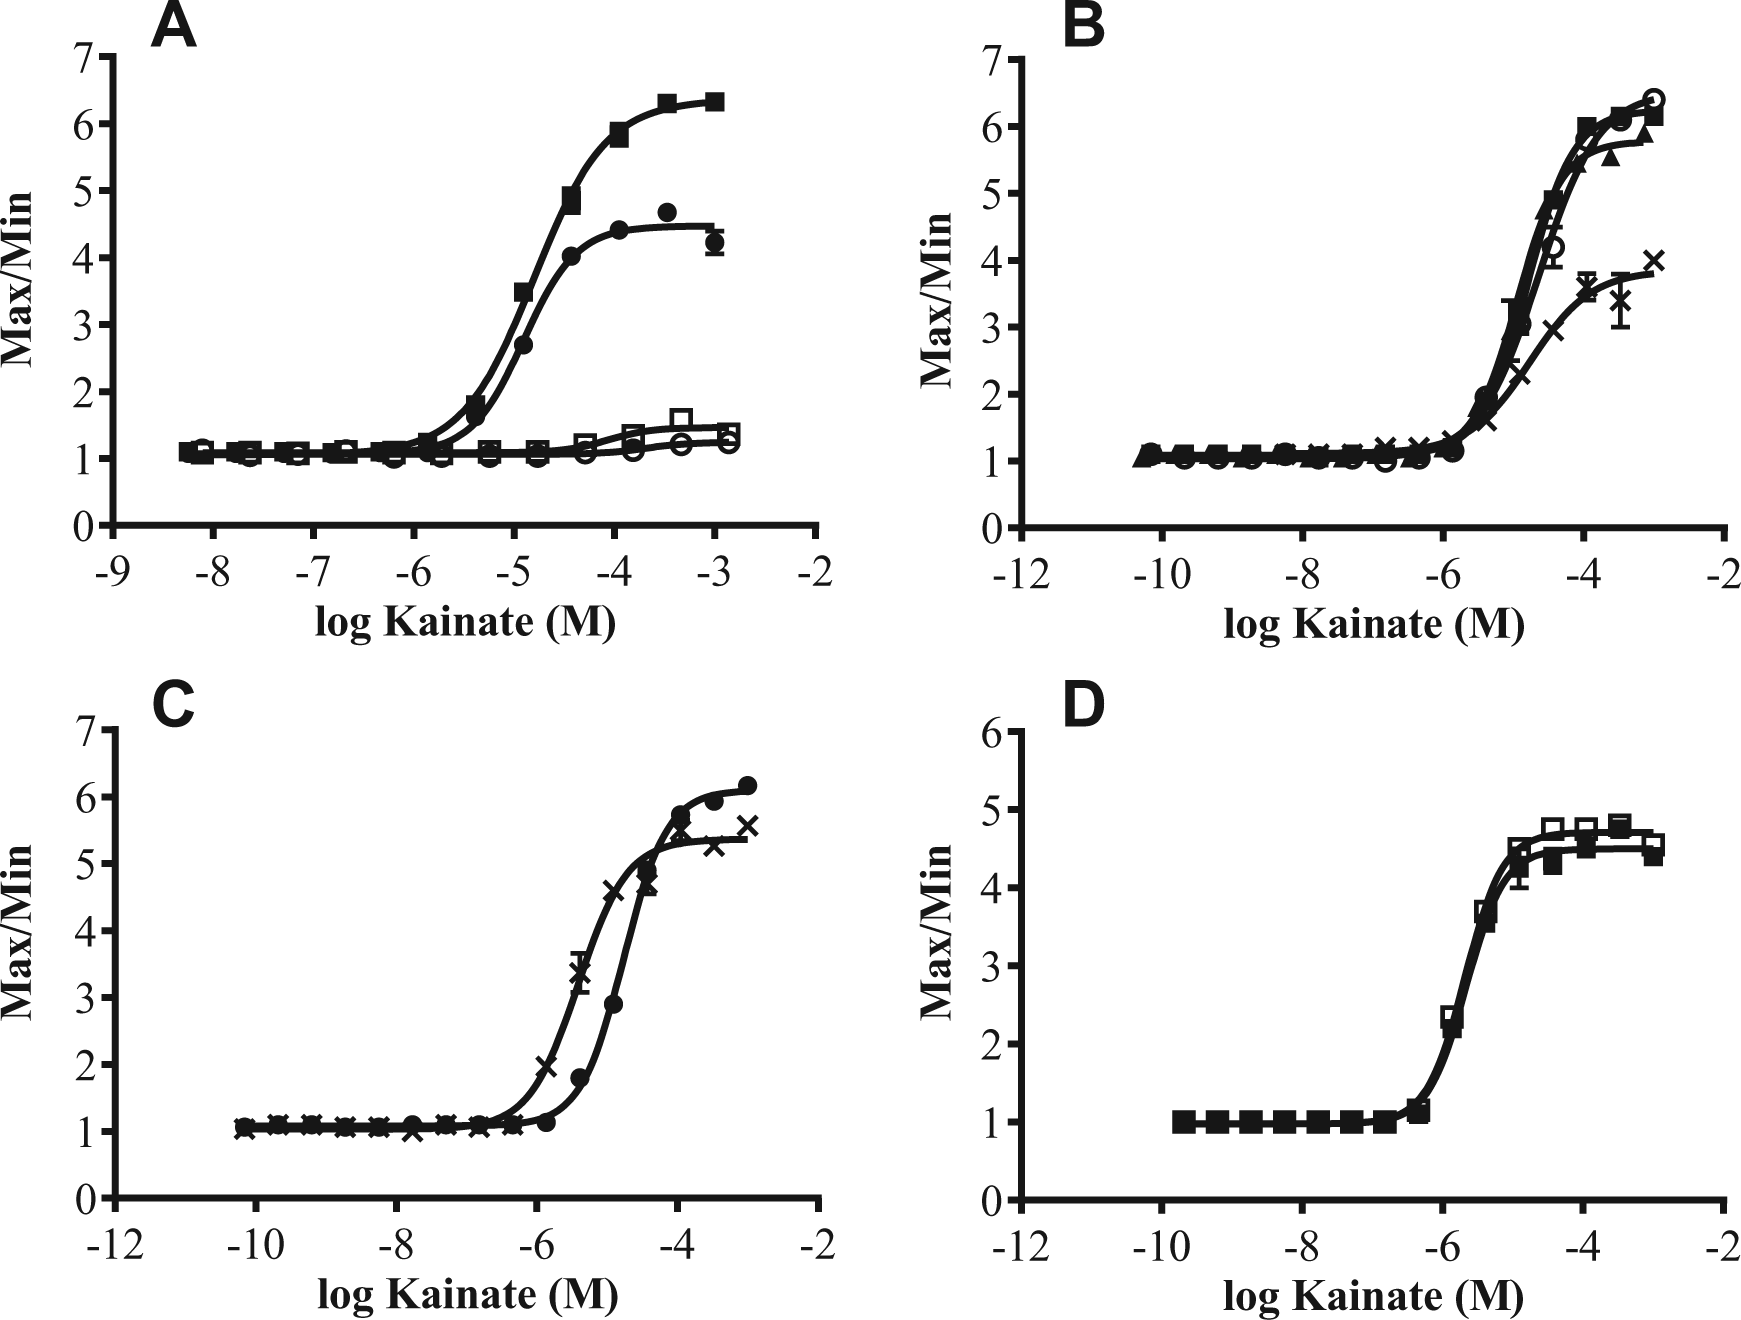
Initial development of the GluK1 FLIPR assay focused on optimizing the wash protocol. Cells were dispensed to multiple 1536-well format plates, as described in Methods. The following day, one set of plates followed a dye washout protocol, in which fluo-4 dye was dispensed directly over the cell monolayer, incubated, and then washed out of the wells and replaced with a ConA-containing buffer. Another set of plates followed a media/dye washout protocol, in which an additional wash step was added prior to the fluo-4 dye addition, to remove the growth media. Both sets of plates received a titration of the agonist kainate in the FLIPR. (Preliminary data indicated it was necessary to incorporate at least one wash step in the assay protocol to remove media from the well prior to agonist stimulation, likely due to desensitization caused by accumulation of glutamate.) 1 Automation of wash steps in a 1536-well plate required aspiration with a straight-tip aspirator and an angled-tip dispenser of wash buffer. A 2 µL residual volume was needed in the wells during the wash steps to prevent the cells from being aspirated from the plate; therefore, a series of steps in which the well was filled with 10 µL wash buffer and aspirated was repeated multiple times to ensure efficient removal of growth media or dye buffer. ConA is a kainate receptor modulator known to decrease the rate of desensitization of the channel to agonist stimulation. 17 Because GluK1 channels desensitize very quickly in response to kainate, ConA was essential for achieving a sufficient assay window ( Fig. 1A ). In addition, the media/dye washout protocol further increased the assay window ( Fig. 1A ) relative to the dye washout assay protocol. EC50 values of the agonist were 15 µM and 12 µM, respectively, in the two wash protocols. Following establishment of the basic protocol for the FLIPR assay, the calcium chloride concentration was optimized. Increasing calcium concentration in the wash buffer following dye incubation increased the assay window ( Fig. 1B ), with 10 mM of calcium chloride chosen for use in the dye washout buffer for subsequent experiments (kainate EC50 value of 16 µM).
Assay development: (
Previous reports 18 implemented the use of probenecid in the dye buffer and subsequent wash buffer for a HEK–GluK1 cell-based assay. Probenecid is generally incorporated into assays with Chinese hamster ovary (CHO) cell types to block the anion transporter in the cell membrane responsible for transporting dyes back to the extracellular solution. 19 Not only does preparation of the sodium hydroxide soluble probenecid stock add steps to screening campaigns, but also sodium hydroxide can be caustic to cells. Water- or buffer-soluble probenecid is now available from a major vendor, making buffer preparation easier; however, it is costly to use in a screening campaign of this size. Because the anion transporter is not problematic in a HEK cell, 19 we looked to eliminate the use of probenecid in the assay. Removal of probenecid from the dye and wash buffer caused a left shift in kainate potency, from 17 µM to 3.8 µM, while maintaining the assay window ( Fig. 1C ). Eliminating probenecid from the assay likely increased the sensitivity of the assay by allowing the use of a lower agonist concentration stimulation to detect antagonists.
Having established an assay protocol with freshly harvested cells, we explored the possibility of using cells thawed immediately from frozen stock vials. A large batch of cells was trypsinized from flasks and frozen down at high density (2×10⁷ cells/mL). On the day of cell plating, vials of cells were quickly thawed, diluted to the appropriate plating concentration (1.75×10⁶ cells/mL), and immediately dispensed to microplates. In an ultra-high-throughput screening campaign when volumes of up to 1 L are required for cell plating per day, preparing a just-in-time, freshly trypsinized batch of cells is time-consuming and inefficient. In addition, the passage number of the cells may increase throughout the screening campaign, possibly introducing variability to results as receptor expression levels change. A frozen cell assay ensures a low, consistent passage number throughout the campaign and reduces cell culture preparation time. Frozen and fresh cell assays compared simultaneously resulted in near-identical assay windows and agonist potencies, 2.1 µM and 2.2 µm, respectively ( Fig. 1D ).
Next, the pharmacology of four standard antagonists was evaluated in the assay. The quinoxaline-derived compounds—DNQX (a selective non-NMDA antagonist), NBQX (a selective, competitive AMPA–kainate antagonist), CNQX (a competitive AMPA–kainate antagonist, and an NMDA receptor antagonist at glycine site), as well as a willardiine compound, UBP-302 (a selective GluK1 antagonist)—were characterized.18,20 Compounds were added to microplates in titrations via pintool and incubated at ambient temperature for 5 min prior to the addition of an EC80 (20 µM) concentration of kainate agonist in the FLIPR. Concentration–response curves were generated for each compound, and IC50 values were calculated using fresh and frozen cell assays (
Fig. 2A
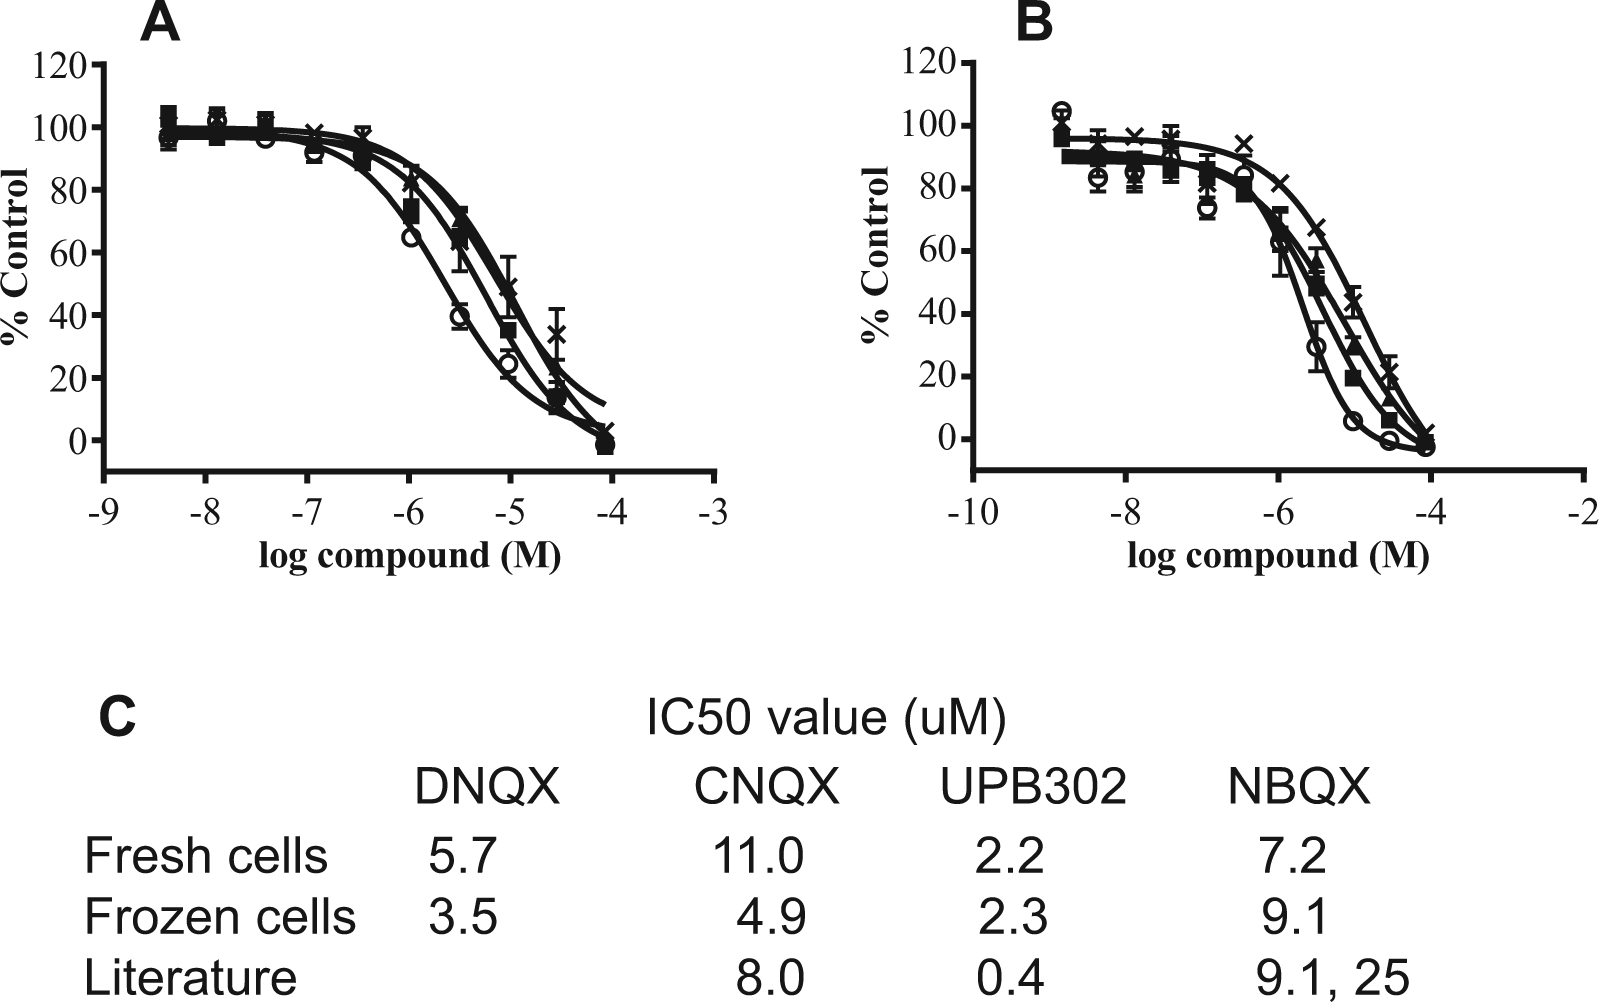
Pharmacology. (
Final validation of the 1536-well plate assay included evaluation of signal consistency across a whole plate. Figure 3A shows the long view of a plate with DMSO vehicle added to all wells in place of a compound addition, and stimulated with a submaximal (EC80) concentration of kainate to stimulate calcium flux or buffer control in the FLIPR. There is a 4.7-fold difference in stimulation between the kainate stimulation and buffer addition (S:B), and a Z prime value of 0.75. The wells containing agonist show a coefficient of variation (CV) of 7.4%. A plate containing 30 nL of test samples added via pintool was evaluated to determine an approximate hit rate in the assay ( Fig. 3B ). Using a median plus three SDs of the compound region (3-sigma) as a cutoff, the hit rate was 1.6%, which is acceptable for an ultra-high-throughput assay. These data indicate that the assay was robust and sensitive enough to identify antagonists for GluK1 activity in a fully automated screen.
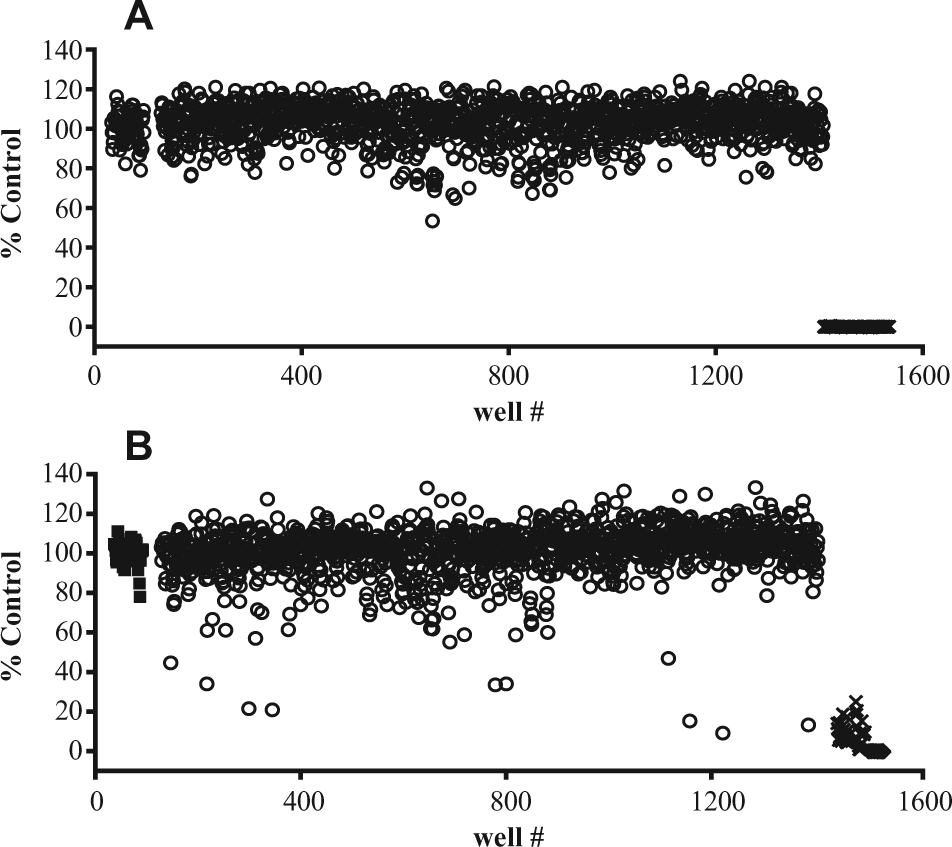
A 1536-well plate assay, long view. (
HTS
The developed 1536-well plate format GluK1 assay was used to evaluate a 1.8-million-member small-molecule library on a robotic system. The goal of the screening campaign was to find functional inhibitors of the GluK1 receptor, and several assays were used for this goal as outlined in Figure 4 . The primary screening assay completed evaluation of the entire library in 14 days as an n of 1, with each compound being tested at a single concentration of 8.5 µM. The overall S:B for the screen was 4.3-fold, with an average Z’ value of 0.5. Each compound calculated a % Inhibition value, using the plate’s EC80 control as 0% Inhibition and 85 µM of UBP302 as 100% Inhibition. All wells on the plate contained the same concentration of DMSO (0.34%).
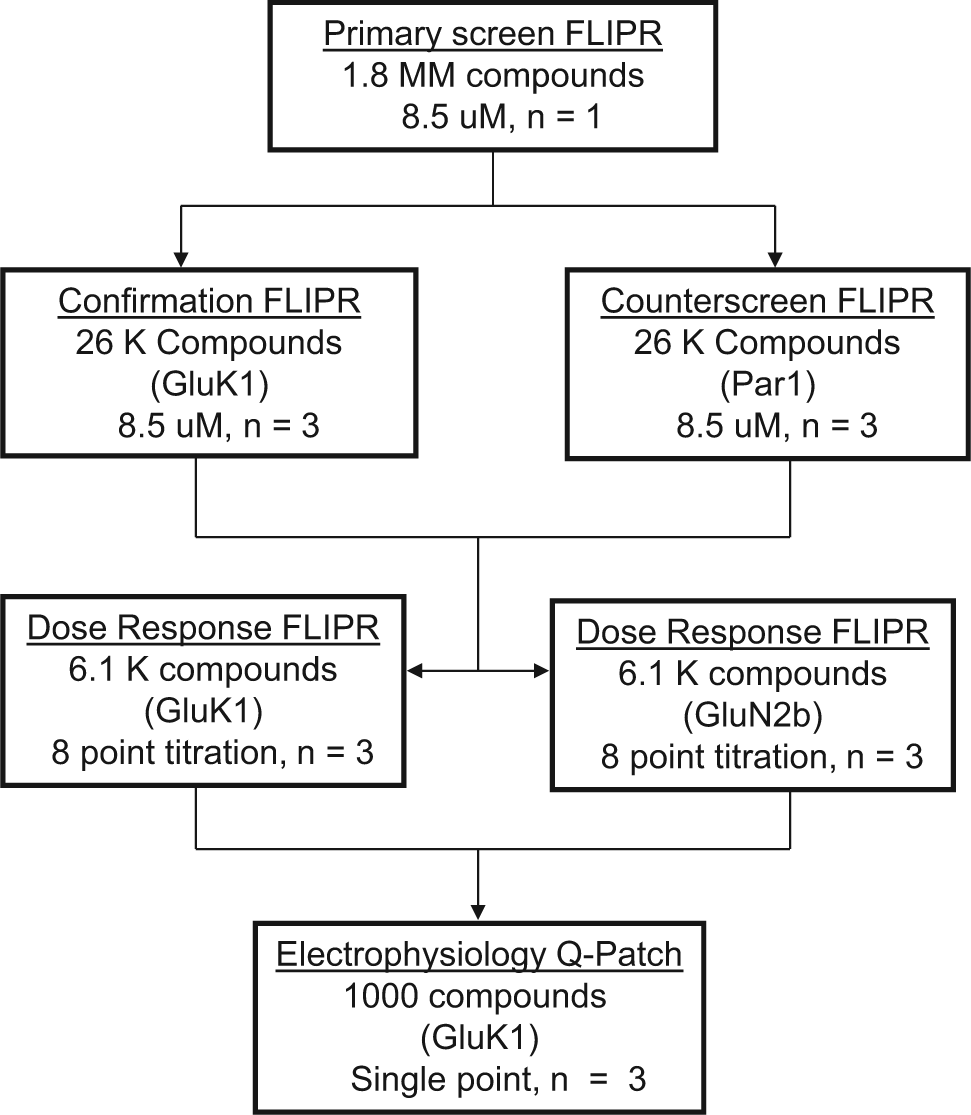
Screening strategy. All steps in the screening strategy were performed on a fully automated robotic system except for the QPatch assay.
Following the primary screen, compounds were selected for confirmation studies. For each 1536-well plate in the screen, the mean plus 3 SDs of the compound field (3-sigma) were calculated and used as a cutoff. In addition to any compound having greater than 50% inhibition, any compound on the plate displaying greater % Inhibition than the 3-sigma cutoff was selected for further studies. Because this calcium flux protocol included a dye washout step, compounds were added via pintool prior to a FLIPR read, and it did not use a fluorescence quencher such as TR40, there was a possibility of picking up fluorescent or agonist-like compounds as hits. A compound would display fluorescence or agonist-like activity on the receptor as a high level of relative fluorescence units (RFUs) prior to the kainate stimulus. Because the percentage inhibition is calculated directly from the maximum/minimum ratio, a high minimum value and subsequent high maximum value would calculate as a low ratio, and thus a high percentage inhibition value or a false positive. Neither fluorescent nor compounds displaying agonist-like responses were desired for this project; therefore, a % Inhibition value and a % Baseline value were calculated for each. The % Baseline value was calculated for each compound compared to the average baseline value of the DMSO controls on that plate. As such, any of the initially selected compounds that had a calculated % Baseline greater than 200% of the DMSO control was removed from the primary hit list. The 26,000 compounds meeting the % Inhibition and % Baseline requirements were cherry-picked into new 1536-well source plates. These compounds were tested in triplicate at 8.5 µM in the primary screening assay protocol (confirmation) as well as a counter-screen protocol.
A Par-1 counter-screen was used to detect compounds that decreased a fluorescent signal evoked by a GluK-independent mechanism. In addition, this assay could also detect agonists of any Gq-coupled GPCR (G protein-couple receptor) that resulted in a release of calcium and therefore heterologous desensitization of all calcium release. The counter-screen protocol used the same HEK–GluK1 cell line, dye-loading, and wash protocols; however, the cells were stimulated in the FLIPR with an EC80 concentration of a Par-1 peptide instead of kainate. The Par-1 peptide stimulates a calcium signal by the activation of endogenous Par-1 receptors on the surface of HEK cells. Of the 26,000 compounds tested in the confirmation assay, 11,000 compounds maintained activity in the GluK1 assay (a median of n = 3), a 42% confirmation rate. Of the confirmed compounds, approximately 4300 compounds showed activity in the Par-1 counter-screen assay, again defined as having % Inhibition values greater than the median 3-sigma value of the EC80 control on that plate.
Following the confirmation and counter-screen assay, compounds were selected for dose titration assays. First, compounds having a % Inhibition value greater than 25% inhibition and a % Baseline value less than 200% in the GluK1 confirmation were selected. From this list, compounds that had less than a twofold ratio in GluK1/Par-1 activity and had less than a 20-point difference in inhibition values in the two assays were eliminated ( Fig. 5A ). Finally, compounds with undesirable chemical structures were removed, resulting in 6100 compounds selected for further evaluation in dose titration. The selected compounds were tested in triplicate in two dose–response assays consisting of an 8-point curve with 1:3 serial dilutions beginning at 34 µM. First, the potency of the compounds was determined in the GluK1 assay, using the same protocol as the primary screen. Of the compounds tested, 3400 had a maximum inhibition value of 70% or greater, indicating significant inhibition of the receptor. Following dose-titration analysis and IC50 value determination, more than 2000 individual compounds displayed potency values of less than 1 µM.
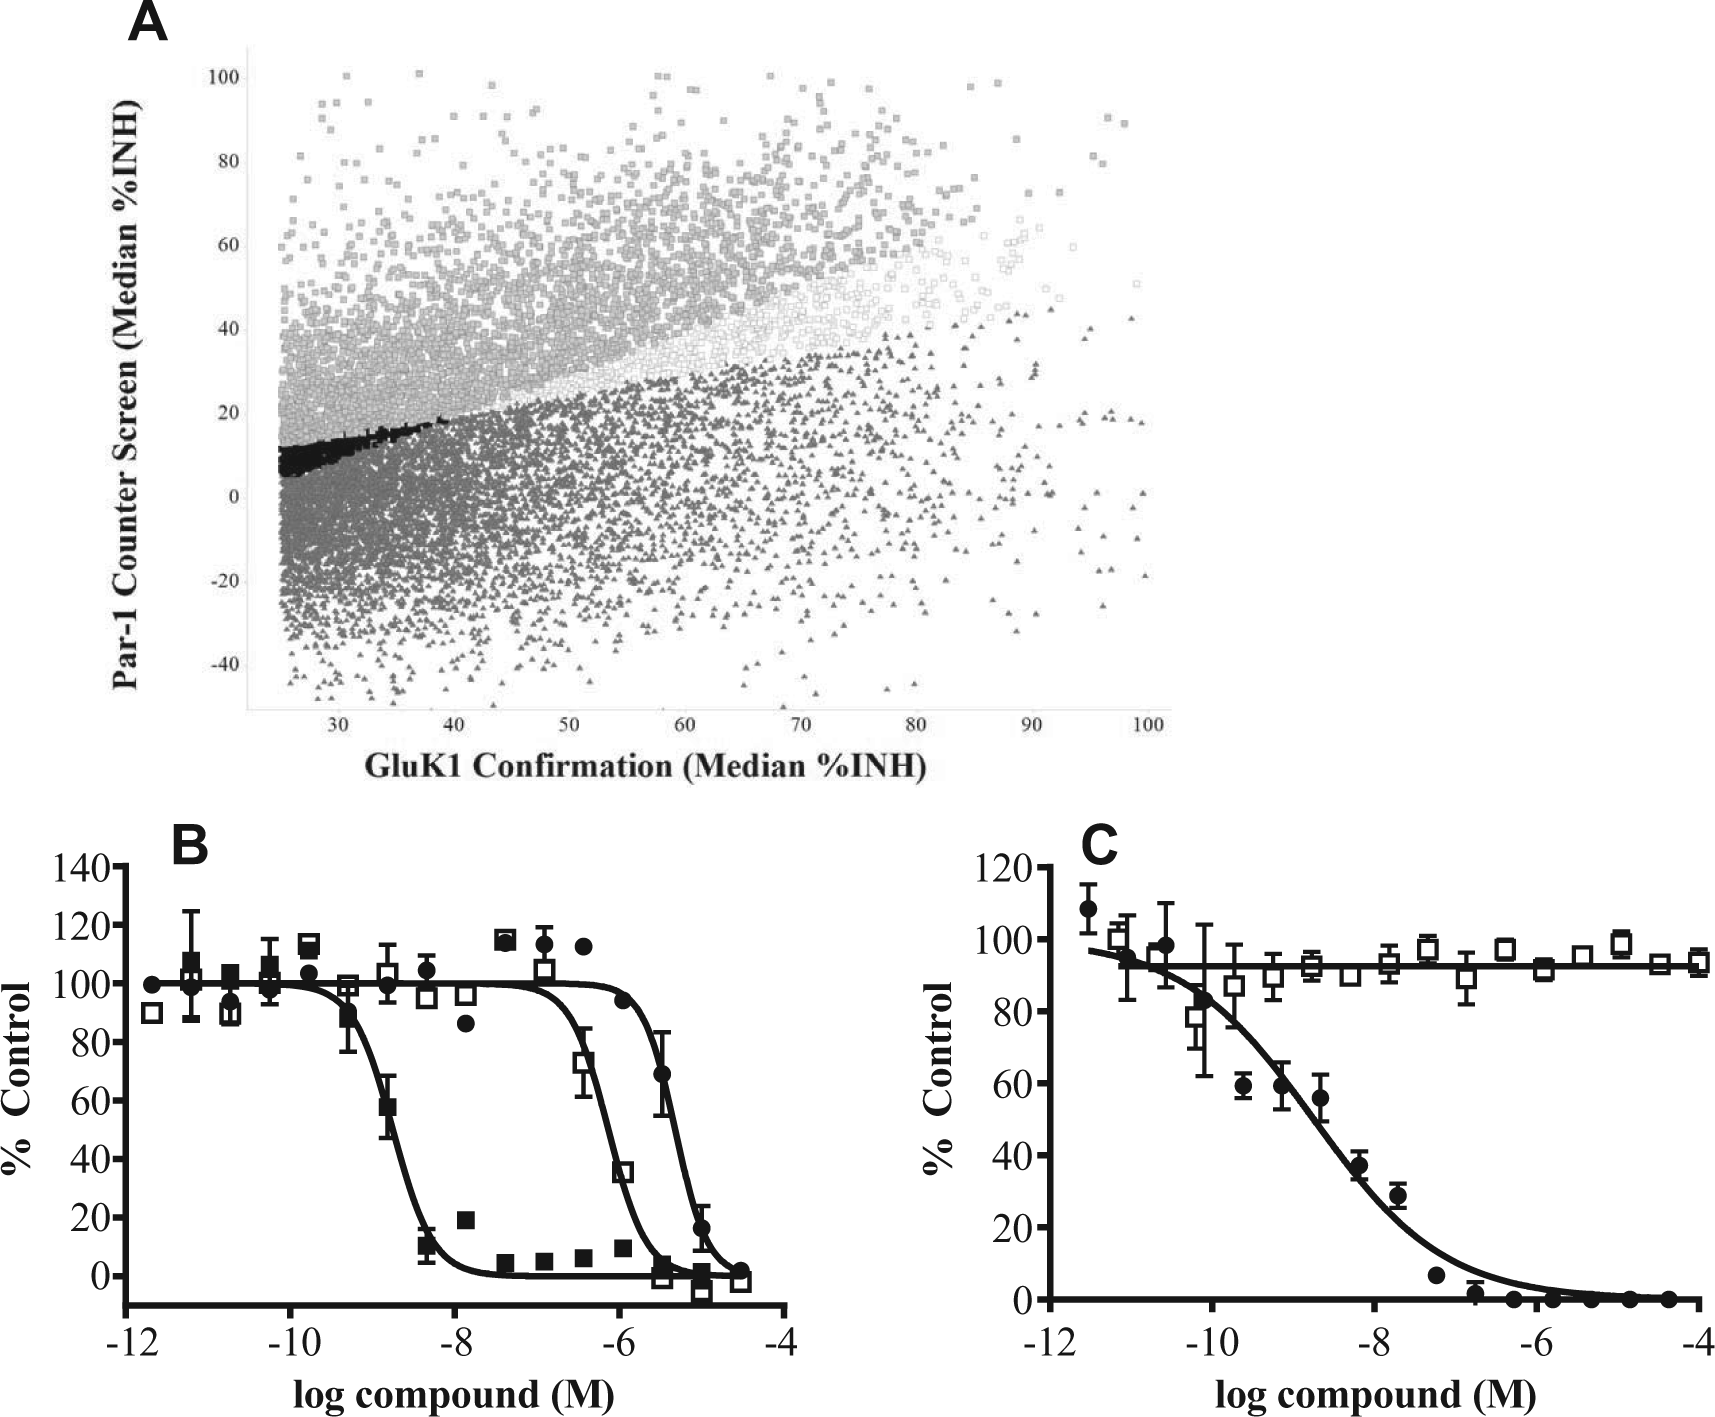
Par-1 and GluN2b counter-screens. (
All 6100 compounds were evaluated as well in dose titration in a GluN2b assay for selectivity. GluN2b is also an ionotropic glutamate receptor, although not in the kainate family. Two reference compounds (LY235959 and LY466195) were not selective for the GluK1 receptor and had some GluN2b activity, which might have contributed to the reported adverse effect of cloudy vision.12,13 Our GluN2b dose titration assay was developed to identify competitive antagonists such as those tested above, as well as a GluN2b selective noncompetitive antagonist, Compound 1, to establish selectivity compared to GluK1 antagonists. Both the selective and nonselective compounds were active in the GluN2b assay; however, only LY466195 was active in the GluK1 assay (
Fig. 5B
Following both dose response assays on 6100 compounds, a set of filters was applied to select compounds for an electrophysiology functional assay on the QPatch. Compounds having activity in the GluN2b assay, confirmed activity in greater than six previous HTS assays, a compound purity of less than 90%, as well as undesirable substructures were eliminated. From the remaining list, 1000 compounds were selected for QPatch follow-up that had GluK1 IC50 values less than 12 µM in the FLIPR titration assay with good curve statistics.
Validation of Automated Electrophysiology Assay for GluK1
To obtain electrophysiological validation of a significant number of compounds from the primary screen, an assay for detecting antagonists of GluK1 was developed on the QPatch-HT. Based on initial experiments examining the concentration response for KA in the presence of ConA (data not shown), 0.5 mM ConA was selected because it generated the most reliable current levels in a high percentage of cells. For example, over an 8-day period, 95.6% of cells exhibited inward currents less than −25 pA (n = 1043 cells). However, the current amplitudes exhibited a high degree of variability with a mean±SD of −135 ± 115 pA (%CV = 85). To mitigate the high level of cell-to-cell variability in peak current, the protocol was designed to provide an intracellular control in which each cell was challenged with two pulses of KA, P1 (pre-compound) and P2 (post-compound) application. For each cell, the % P2/P1 was determined and could be compared to controls receiving buffer alone (see Methods). In the vehicle control cells (n = 67) tested over the same 8-day period mentioned above, the mean P1 current was −133 ± 100 pA (%CV = 76), and the mean %P2/P1 = 119 ± 43 (%CV = 36).
Using this two-pulse assay, we tested a set of published GluK1 inhibitors with differing chemotypes, specificities, and mechanisms of action. The nonspecific AMPA/kainate-type glutamate receptor antagonist CNQX and the partially GluK1 selective inhibitor LY466195 inhibited KA-evoked currents in a concentration-dependent manner with IC50 values of 1.3 and 0.024 µM, respectively (
Fig. 6A
), consistent with their effects in the fluorescence assay (
Figs. 2
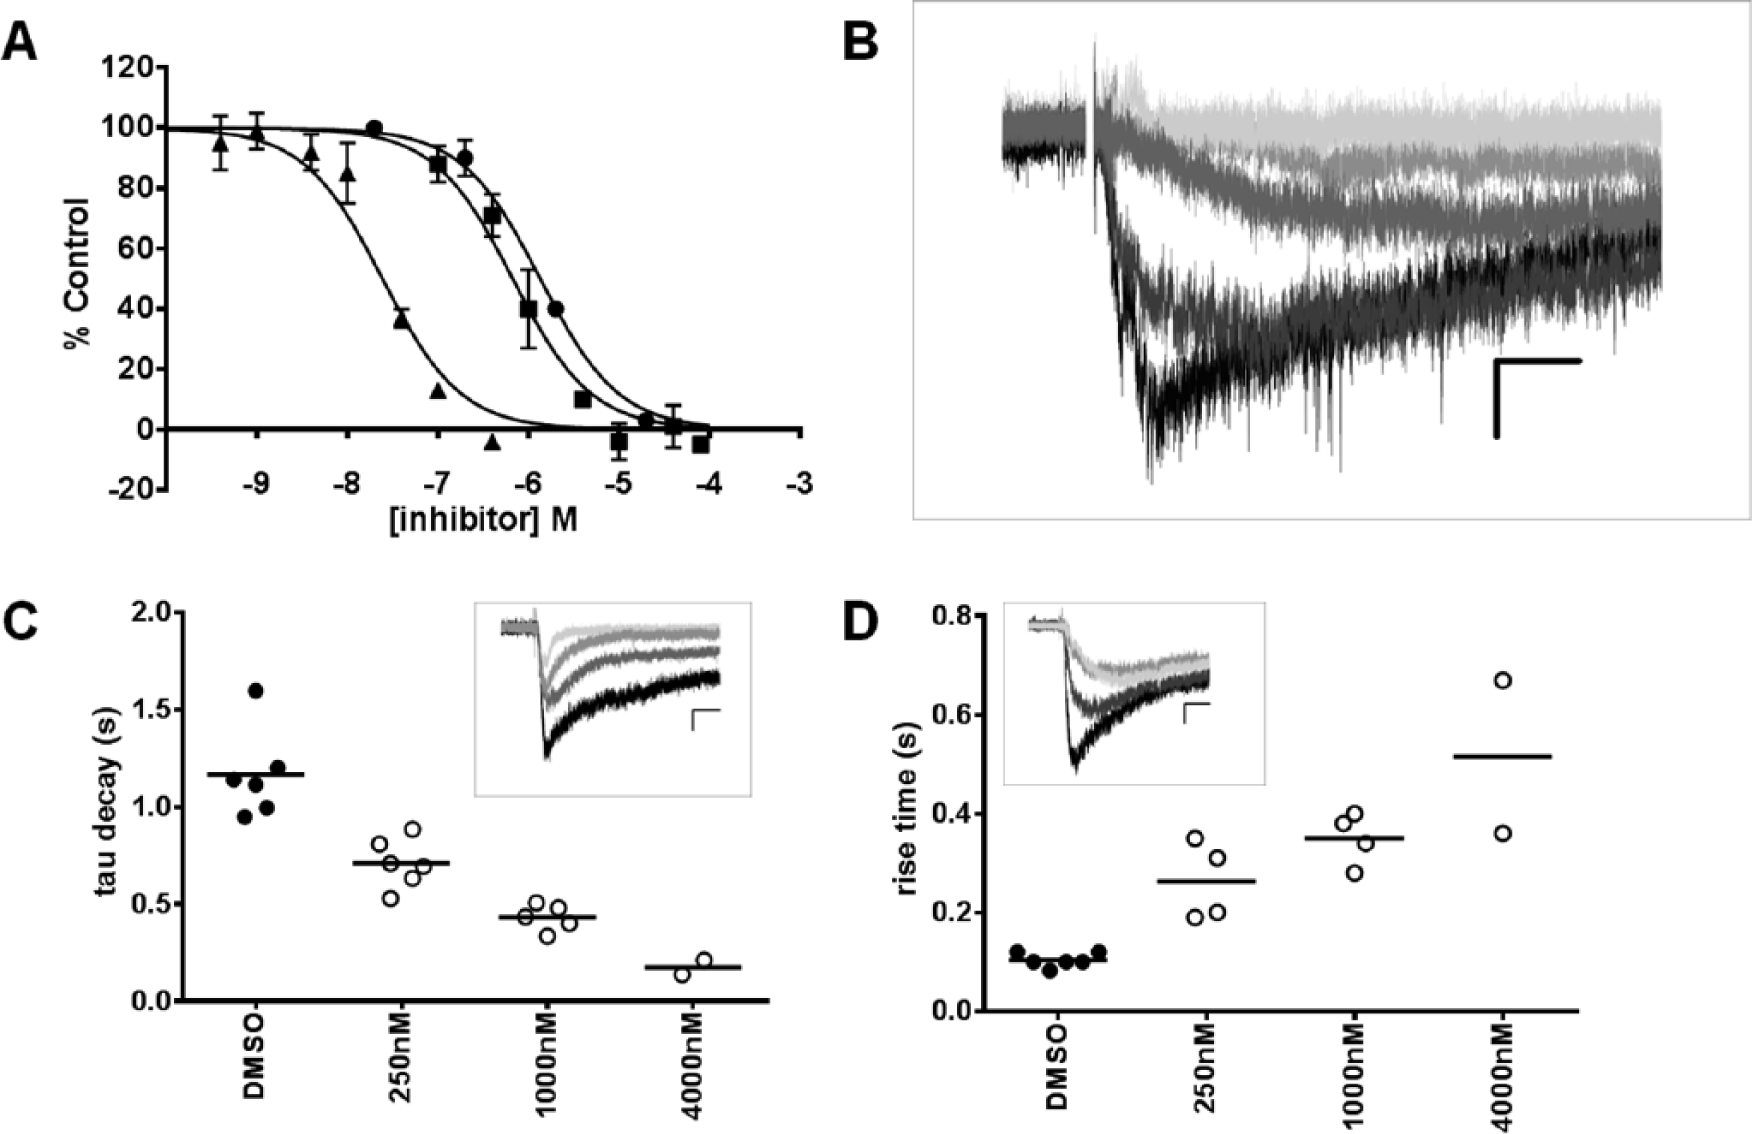
Electrophysiology assay. (
Automated Patch Clamp Confirmation Screen
Following dose titration in the GluK1 and GluN2b calcium-imaging assays, 1000 compounds were prioritized for additional follow-up with automated whole-cell electrophysiology. The assay was designed to incorporate sufficient redundancy to achieve multiple tests of the same compound, with at least two cells per compound successfully completing an experiment (a median of four cells per compound). Throughout the 22 days of screening, the median P1 current on each day ranged from −75 to −133 pA. A median of 42 compounds were screened per day (range, 16 to 82) with a median of 3 cells per compound tested on a particular screening day (range, 2.5 to 4.6). To determine the reproducibility of run-to-run data, 35 compounds with a range of %P2/P1 (−1 to 108%) were selected to be retested under the same conditions. This set of compounds exhibited a strong positive correlation in %P2/P1 comparing the initial values to the retest (data not shown, R2 = 0.71). Despite the reproducibility of the compounds to inhibit kainate-evoked currents, the correlation between QPatch HT and FLIPR results was poor (R2 = 0.014) when comparing the full set of hits tested in QPatch. Focusing on the more efficacious hits (%P2/P1 <25%) improved the correlation slightly (R2 = 0.16). Of the 1000 compounds tested in the QPatch HT assay, 218 had %P2/P1 ≤75% (i.e., 25% inhibition), representing a 20% confirmation rate. Initial follow-up of confirmed electrophysiologically active compounds showed dose-dependent decreases in current levels. Most intriguingly, these active compounds could be subdivided into different phenotypes based on the kinetic profile of inhibition. Although the majority of electrophysiologically active compounds appeared to inhibit the peak response without altering the kinetics (89%), a subset of compounds either delayed the onset of the kainate response (10 compounds, 5%) or induced a rapid decay in the kainate response (13 compounds, 6%). These effects were concentration dependent (
Fig. 6C
Discussion
High-throughput electrophysiology screening for small-molecule inhibitors of ion channels presents a significant problem in terms of throughput and cost compared to the gold standard electrophysiological assays. New automated whole-cell patch clamp platforms have emerged that provide increased throughput, although costs per data point are still quite high. For very large screening collections, high-throughput screens still rely on imaging-based detection of ion flux or membrane potential. Herein, we described a FLIPR screen of a multimillion-member small-molecule compound library using a calcium-permeable GluK1 expressed in HEK cells. Our screening funnel used off-target assays to narrow the focus toward compounds that are true actives on GluK1, with a Par-1 assay to eliminate assay-specific artifacts at the confirmation/counter-screen stage. In addition, at the dose titration stage, an off-target assay was developed to detect compounds that inhibit GluN2b, an NMDA receptor found to mediate some of the activity of other known GluK1 antagonists such as LY466195.12,13 Despite these efforts to enhance our ability to identify on-target activity and reduce fluorescence-dependent artifacts, we found a poor correlation between whole-cell patch clamp and fluorescence assays (e.g., a 20% confirmation rate and an R2 = 0.16 between assays). A possible explanation for this poor correlation may involve the timing of test compound incubation in each assay format. In the fluorescence assay, compounds were incubated for 5 min with the cells prior to the addition of kainate. Then, the activity of the compounds plus kainate was measured for 100 s. In contrast, in the electrophysiology assay, compound incubation was only 10 s, and the recording of the effect was 16 s. Any compounds that exhibited slow activation on the receptor or required more than 10 s to achieve equilibrium would have been identified in the fluorescence assay but not the electrophysiology assay. We did try to extend the compound incubation in the electrophysiology assay; however, any significant extension of compound pre-incubation time significantly reduced the number of cells with good seal quality (data not shown). Another explanation for the discrepancy between assay formats may involve the total number of cells being exposed to test compounds. Although the FLIPR assay measured the effect of the compounds on many cells (7000 cells/well) in a monolayer, the Q-Patch was only measuring the effect of the compound on a single cell. The summed response of a larger number of cells may ultimately be more sensitive to weaker compounds compared to individual cells measured in the electrophysiology assay, consistent with the improvement in correlation when compounds with at least 25% inhibition were examined. Use of a “population patch” chip might help to alleviate this issue.
Despite the lack of correlation, the fluorescence assay did identify a number of hits that were electrophysiologically active. Furthermore, compounds that were active in the electrophysiology assay had a variety of potential mechanisms of action that would not be detected in the fluorescence assay. For example, we could distinguish UBP302 from either CNQX or LY466195 based on the effects of the two compounds on the kinetics of the KA response, with UBP302 demonstrating a prolonged delay in the rise time at roughly half-maximally effective concentrations. Recent crystallographic work has identified an array of structurally different states of the GluK1 when bound to different antagonists. Although the willardiine derivatives UBP310 and UBP302 appear to bind in the ligand-binding domain of GluK1, there exist significant differences in binding modes relative to other competitive antagonists such as DNQX 22 or LY466195. 23 Whether these structural differences affect the functional effects observed on KA-evoked response kinetics is yet to be determined. In contrast to the delay in KA response onset, we observed compounds that enhanced the decay of the KA response in a dose-dependent manner. This observation is consistent with compounds that require an agonist to first open the channel to give access to the pore, such as was observed for philanthotoxin and pentobarbital in GluK2 channels.24,25 However, we cannot rule out the possibility that these compounds are altering desensitization. Further work is needed to determine the precise mechanism by which these novel GluK1 antagonists act, but our results demonstrate that automated electrophysiology can discern a variety of mechanisms of action for compounds identified in higher-throughput functional imaging-based ultra-high-throughput screening.
Footnotes
Acknowledgements
The authors wish to acknowledge the contributions of Carissa Quinn and Jason Cassaday for conducting the fluorescence assays on the robotic system.
Declaration of Conflicting Interests
The authors declared no potential conflicts of interest with respect to the research, authorship, and/or publication of this article.
Funding
The authors received no financial support for the research, authorship, and/or publication of this article.