
Abstract
Protein turnover is highly regulated by the posttranslational process of ubiquitination. Deregulation of the ubiquitin proteasome system (UPS) has been implicated in cancer and neurodegenerative diseases, and modulating this system has proven to be a viable approach for therapeutic intervention. The development of novel technologies that enable high-throughput studies of substrate protein ubiquitination is key for UPS drug discovery. Conventional approaches for studying ubiquitination either have high protein requirements or rely on exogenous or modified ubiquitin moieties, thus limiting their utility. In order to circumvent these issues, we developed a high-throughput live-cell assay that combines the NanoBiT luminescence-based technology with tandem ubiquitin binding entities (TUBEs) to resolve substrate ubiquitination. To demonstrate the effectiveness and utility of this assay, we studied compound-induced ubiquitination of the G to S Phase Transition 1 (GSPT1) protein. Using this assay, we characterized compounds with varying levels of GSPT1 ubiquitination activity. This method provides a live-cell-based approach for assaying substrate ubiquitination that can be adapted to study the kinetics of ubiquitin transfer onto a substrate protein of interest. In addition, our results show that this approach is portable for studying the ubiquitination of target proteins with diverse functions.
Introduction
The ubiquitin proteasome system (UPS) is an essential pathway in eukaryotes, and disruptions in this system have been associated with disease etiologies of cancer, diabetes, and immune and neurodegenerative pathologies. 1 The UPS has emerged as an attractive druggable node and small molecules have been developed to modulate every step of the ubiquitination cascade. 2 Ubiquitin is an ubiquitously expressed, 8.5 kDa protein that is appended to ε-NH2 groups of lysine side chains of target proteins in a single or covalently-linked chain form (monoubiquitin and polyubiquitin form), leading to diverse outcomes.3,4 Ubiquitination is dependent on an enzyme cascade. 5 The E1-activating enzyme catalyzes ATP hydrolysis to form a ubiquitin-adenylate intermediate that is attached to the E1 enzyme via a thioester linkage. The ubiquitin-loaded E1 enzyme transfers the activated ubiquitin to the E2-conjugating enzyme through a transesterification reaction. In the case of the RING family of E3 ligases, the E2-ubiquitin moiety binds the E3 ligase, which recruits the substrate protein, and ubiquitin is transferred directly from the E2 onto the substrate protein. 6 Repeated cycles of ubiquitination of the same substrate lead to polyubiquitination, which is required for proteasome recognition and substrate protein degradation. Upon proteasomal degradation of the substrate, the ubiquitin chain is cleaved by deubiquitinase enzymes and recycled in the cell. 7 In addition to targeting substrate proteins for degradation,8,9 ubiquitination of substrate proteins has also been implicated in many other cellular processes, such as signal transduction, endocytosis, DNA repair, and transcription.10,11
There are many successful examples of small molecules that target the UPS as well as other ubiquitin-like proteins. For instance, an E1-activating enzyme of the ubiquitin-like protein Nedd8 contributes to activation of Cullin scaffold proteins, and inhibition of this Nedd8 Activating Enzyme 1 (NAE1) by MLN-4924 has been shown to induce apoptosis in tumor cells. 12 The proteasome inhibitor bortezomib, which inhibits the degradation of proteins, has received approval for clinical use in multiple myeloma treatment, 13 and deubiquitinase inhibitors like VLX1570 have been tested for oncology indications. 14 Since the UPS is a cascade with fewer E1 and E2 enzymes in comparison with E3 ligases, substrate specificity increases further down the cascade, and as a result, targeting E3 ligases is hypothesized to provide more specificity in modulating UPS activity than targeting E1 or E2 enzymes or the proteasome.15,16 Immunomodulatory imide drugs (IMiDs), binders of CRBN E3 ligase receptor, induce degradation of neo-substrate proteins, such as IKZF1, IKZF3, and CK1a, by altering the binding surface of the E3 ligase, thereby creating new protein–protein interactions (PPIs).17–19 In addition CC-885, an IMiD analog, induces degradation of the G to S Phase Transition 1 (GSPT1) translation termination factor by CRL4-CRBN (CUL4 RING ligase-CRBN) E3 ligase. 20 These compounds illustrate the ability to directly modulate E3 ligase substrate specificity, providing a unique approach to target “undruggable” proteins with nonenzymatic function via the UPS. Technology that measures ubiquitination, the most immediate functional consequence of compound-induced protein recruitment to an E3 ligase receptor, could prove impactful to identifying such E3-modulating compounds.
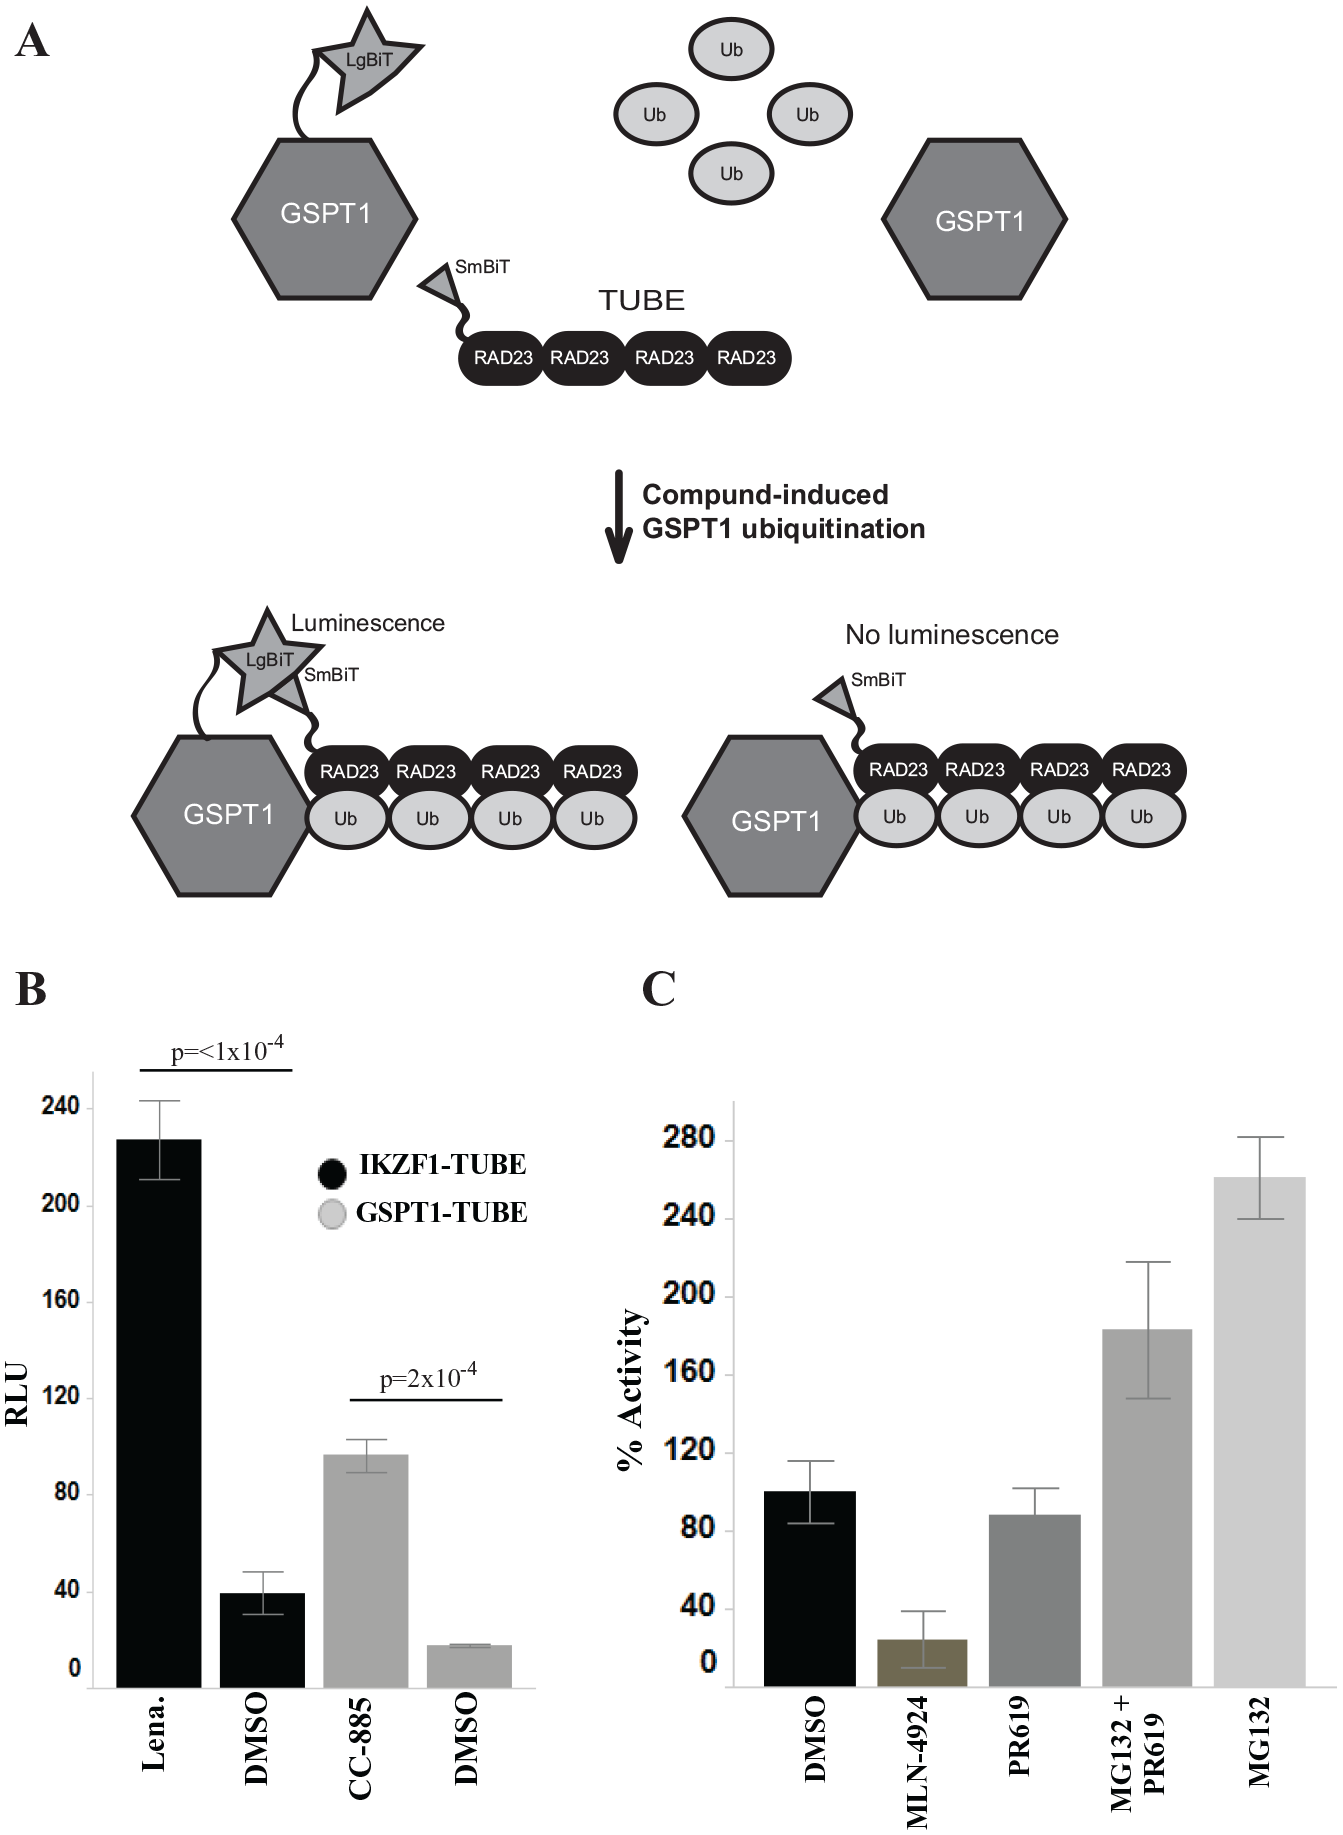
However, studies of protein ubiquitination have been indirect and low throughput in nature. A common approach that combines protein immunoprecipitation and antiubiquitin immunoblotting requires high amounts of input protein, 21 making it unamenable for high-throughput screening (HTS). Other methods for studying ubiquitination rely on biochemical reconstitution of the UPS, which may not recapitulate its complex cellular context.22–24 A previously reported high-throughput time-resolved Förster resonance energy transfer (TR-FRET) cellular assay for monitoring posttranslational modifications, including ubiquitination, relies on the use of cell-impermeable probes, impeding their use for live-cell analysis of ubiquitination. 25 To address these issues, we aimed to develop a live-cell assay able to detect the ubiquitination of a specific protein in a kinetic manner. We used the commercially available, highly sensitive NanoBiT, nanoluciferase protein complementation technology, due to amenability to measure PPIs in a live-cell context. 26 Initially, we attempted to introduce the smaller NanoBiT fragment (SmBiT) tagged to ubiquitin with the larger fragment (LgBiT) tagged to a substrate protein, but we were unable to increase the signal-to-background ratio (data not shown). In order to reduce competition with endogenous ubiquitin, we used tandem ubiquitin binding entities (TUBEs) as a reader for ubiquitination ( Fig. 1A ). The TUBE comprises multiple ubiquitin binding association domains of the RAD23 protein (also known as HR23A), which have higher affinity for K48 and K63 tetraubiquitin chains over monoubiquitin and protect the polyubiquitin chain from deconjugation.27,28 LgBiT is appended to the substrate protein and SmBiT is appended to the TUBE. Upon addition of a compound that induces substrate protein ubiquitination, the polyubiquitin chain of the exogenous LgBiT-tagged substrate protein binds to the TUBE. This causes complementation of LgBiT and SmBiT into the functional nanoluciferase enzyme, which catalyzes a luminescence reaction. In the absence of polyubiquitination or either of the NanoBiT fragments, luminescence is not observed. Here, we show the validity of using a split-enzyme approach in combination with a ubiquitin reader (i.e., TUBE) to identify compounds that cause ubiquitination of GSPT1. This approach can be used to study the ubiquitination of other targets besides GSPT1 and provides a high-throughput method to study protein ubiquitination in live cells.
NanoBiT-TUBE assay development. (
Materials and Methods
Vectors and Cloning
TUBE DNA was designed based on Hjerpe and colleagues’ RAD23 UBA domains 28 such that four RAD23 UBA domains were placed in tandem with a 7 Gly linker between each domain with either a N- or C-terminal smBiT linkered by 16-Gly/Ser and a FLAG epitope on the opposite terminal as the smBiT ( Suppl. Fig. S1 ). To generate the TUBE SmBiT-expressing vectors, either C- or N-terminally tagged TUBE gBlock gene fragments (Integrated DNA Technologies, Coralville, IA) were synthesized with 5′ HindIII and 3′ XbaI restriction sites. gBlocks were cloned into the pNL1.1.CMV (N1091, Promega, Madison, WI) using standard restriction cloning methods. LgBiT-tagged vectors were generated by ordering Open Reading Frame (ORF) clones in the pFN21A vector from Promega (GSPT1 FHC10854; IKZF1 FHC05503; β-catenin FHC07714) and cloning into pFC34K (C-terminal LgBiT) or pFN33K (N-terminal LgBiT) (N2015, Promega) using the Promega Flexi cloning system (C8640).
Cell Culture
HEK293T cells (CRL-3216, American Type Culture Collection [ATCC]) were used for all experiments. The cells were cultured in media containing Dulbecco’s modified Eagle’s medium (DMEM) (11965-084, ThermoFisher Scientific, Waltham, MA), 10% fetal bovine serum (1500-500, VWR, Radnor, PA), and PenStrep (100 units/mL penicillin and 100 μg/mL streptomycin) (15140-122, ThermoFisher Scientific, Waltham, MA). Cells were maintained at 30%–90% confluency in a sterile incubator at 5% CO2 and 37 °C.
NanoBiT-TUBE Assay Development and HTS
Cells were transiently transfected with LgBiT and smBiT DNA vectors using the Fugene HD (E2311, Promega) reverse transfection protocol where Fugene HD and DNA are co-incubated in OptiMEM (11058-021, ThermoFisher Scientific, Waltham, MA) at a 3:1 ratio, before being added to lifted HEK293T cells at a concentration of 4 × 10⁵ cells/mL. The transfected cells were incubated for 16–24 h, lifted with TrypLE Express (12605-028, ThermoFisher Scientific, Waltham, MA), and plated in 1536-well plates (782086, Greiner, Kremsmunster, Austria) at 5 μL/well and 2000 cells/well (for all experiments unless stated otherwise) using a Bottle Valve Dispenser (GNF Systems, San Diego, CA). Plated cells were incubated for an additional 16–24 h before compound addition.
Plated cells were pretreated for 1 h with either proteasome inhibitor MG132 (474787, MilliporeSigma, Burlington, MA), deubiquitinase inhibitor PR619 (S19619, Life Sensors, Malvern, PA), Neddylation Activation Enzyme 1 (NAE1) inhibitor (MLN-4924, 15217, Cayman Chemical, Ann Arbor, MI) (all at a 10 μM final concentration), and/or DMSO at 0.1% final concentration added to the assay plates using an Echo 555 Liquid Hander (Labcyte Inc., San Jose, CA). Following pretreatment, compound treatment of CC-885 (19966, Cayman Chemical), lenalidomide (synthesized in-house), or other stated compounds (all synthesized in-house) were dispensed into assay plates at the stated final concentrations in 100% DMSO using an Echo 555 Liquid Dispenser (Labcyte, San Jose, CA). The cells were incubated for 1–8 h until readout timepoint. A 6500-compound diversity set was screened in singlicate at a final concentration of 15 μM. Compounds were plated in an Echo Qualified 1536-Well COC Microplate (LP-0400, Labcyte) in columns 1–44, and columns 45–48 were empty to allow transfer of control compounds from a separate plate with CC-885 in column 45 and 100% DMSO in columns 46–48. For both screens, cells were plated at 2700 cells/well, the DNA ratio was 1:2 of GSPT1-LgBiT to SmBiT-TUBE, and the treatment was MG132 for 1 h, followed by 1 h of compound treatment.
The Nano-Glo Live Cell Assay System (N2012, Promega) was used for this assay. The luminescent reagent mix was prepared as follows: Nano-Glo LCS Dilution Buffer and Dulbecco’s phosphate-buffered saline (DPBS) (14190-144, ThermoFisher Scientific, Waltham, MA) were mixed at a ratio of 1:1 and the Nano-Glo Live Cell Substrate was added at a 1:40 dilution. Assay plates were incubated at room temperature for 15 min, 5 μL of reagent mix was added to wells with angled tips using a bottle valve dispenser (GNF Systems, San Diego, CA), and luminescence was read using a 40 s exposure on the ViewLux uHTS Microplate Imager (PerkinElmer, Houston, TX).
Data Analysis and Hit Selection
For all compound screens performed, control-based normalization was used to ensure relative comparisons of compound activity to CC-885 active control (AC) and DMSO neutral control (NC).

For the 10,000 diversity screens, 5 standard deviations of the mean percent activity was used as the cutoff parameter for hit calling.
All data analysis was carried out using Spotfire V6.5 (Palo Alto, CA) and GraphPad Prism7 (La Jolla, CA). Z′ was calculated as follows: 29
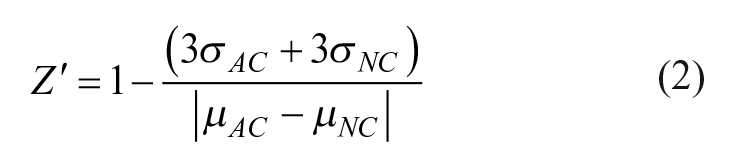
where σAC and σNC are the standard deviations and µAC and µNC are the mean values of the active control and neutral control, respectively. For RZ′ (robust Z′), median absolute deviation and median values were substituted for standard deviation and mean values. MoA-box compound curve analysis was performed using HELIOS (Novartis internal client software capable of performing plate-based normalizations and curve fitting) 30 using eq 1 for normalization.
Western Blot and Immunoprecipitation
HEK293T cells (1 × 10⁶) were plated for 16 h and treated with respective compounds at 1 μM for 6 h, followed by lifting and pelleting cells. Cell pellets were lysed (RIPA lysis buffer, 89901, Thermo Scientific; protease inhibitors, 11836170001, Roche; phosphatase inhibitors, 04906837001, Roche, Basel, Switzerland; and 1 mM PMSF, 93482, MilliporeSigma, Burlington, MA) and protein was visualized using standard electrophoresis and immunoblotting methods (anti-GSPT1 1:1000 dilution, 14980, Cell Signaling Technology, Danvers, MA; anti-actin 1:10,000, A5441, MilliporeSigma, Burlington, MA; in 3% milk in TBST). For analysis of protein ubiquitination, TUBE immunoprecipitation was used. HEK293T cells (10 × 106) were pretreated with MG132 and respective samples with MLN-4924, also for 1 h, followed by compound for 4 h, lifted, pelleted, and lysed (50 mM Tris HCl, pH 7.4, 150 mM NaCl, 1 mM EDTA, 1% NP-40, 10% glycerol, 10 μM PR619, 10 μM N-ethylmaleimide, protease, and phosphatase inhibitors). Pulldown was performed using TUBE2 agarose beads (UM402, Lifesensors) with a 2 h, 4 °C incubation period. Protein was visualized using standard electrophoresis and immunoblotting methods (anti-GSPT1 1:1000, 14980, Cell Signaling Technology).
Results
Assay Optimization and Validation
To evaluate the ability of the NanoBiT-TUBE assay to detect ubiquitination of target proteins, we measured compound-induced, CRBN-mediated ubiquitination of IKZF1 and GSPT1. HEK293T cells were transfected with either IKZF1-LgBiT/smBiT-TUBE or GSPT1-LgBiT/smBiT-TUBE at a 1:2 ratio and treated with either lenalidomide or CC-885, respectively. We determined that compound-induced ubiquitination of IKZF1 and GSPT1 could be observed using the NanoBiT-TUBE assay with a 5.8-fold (p = <1 × 10⁻⁴) (IKZF1) and 5.5-fold (p = 2 × 10⁻⁴) (GSPT1) increase in ubiquitination signal within 1 h of compound addition ( Fig. 1B ). Given the availability of robust structure–activity relationships around published GSPT1 degraders, 31 we chose to focus optimization of the ubiquitination assay on GSPT1 as a proof of concept to demonstrate the utility of this approach.
Next, we utilized known UPS modulators to confirm that the luminescence signal observed is ubiquitination dependent. HEK293T cells were transiently transfected with GSPT1-LgBiT and SmBiT-TUBE constructs at a 1:2 ratio; cells were then pretreated for 1 h with DMSO, 10 μM MLN-4924, 10 μM PR619, and/or 10 μM proteasome inhibitor MG132. After pretreatment, cells were treated with 10 μM CC-885 or DMSO for 1 h ( Fig. 1C ). MG132 pretreatment caused the most significant increase in GSPT1 ubiquitination, while addition of both PR619 and MG132 increased signal compared with DMSO, but to a lesser extent. In addition, GSPT1 ubiquitination was impeded upon addition of MLN-4924. The fact that inhibiting neddylation, which is required for multiple cycles of ubiquitin transfer, causes a decrease in signal validates that the signal observed upon compound addition is polyubiquitination dependent. Given that MG132 pretreatment provides Z′ values >0.5 ( Table 1 ) with a signal increase >2-fold over DMSO pretreatment, we carried these parameters forward.
Z′ Values for Assay Optimization Experiments.
Values that are within the threshold of 0.5 and 1.
In order to test the optimal configuration for tagging the TUBE protein with the smBiT fragments, we co-transfected cells with either C- or N-terminal-tagged TUBE constructs and a C-terminal-tagged GSPT1-LgBiT construct at a ratio of 1:2 (GSPT1:TUBE). Transfected cells were pretreated for 1 h with 10 μM MG132 followed by 10 μM CC-885 treatment for 1 h. In a similar experiment, we optimized the orientation of the LgBiT fragment on GSPT1 and observed that the N-terminal-tagged TUBE construct in conjunction with the C-terminal-tagged GSPT1 construct has an optimal luminescence value ( Suppl. Fig. S2 ).
Next, given that the process of ubiquitination is dynamic, we aimed to identify the optimal timepoint for observing GSPT1 ubiquitination using this approach. Under the optimized conditions outlined above, we performed a time course post-CC-885 treatment over an 8 h period, determining that the optimal timepoint to observe ubiquitination of GSPT1 using this method is between 1 and 2 h, with a fivefold signal increase in CC-885 over DMSO-treated samples ( Suppl. Fig. S3 ). To further confirm that the increased luminescence observed upon CC-885 addition is not due to nonspecific compound-induced signal, we transfected cells with smBiT-TUBE and either GSPT1-LgBiT or LgBiT-β-catenin, pretreating either with DMSO or MG132, followed by CC-885 for 1 h. We only observed CC-885-induced signal in the GSPT1-TUBE-transfected cells and not in the β-catenin-TUBE-transfected cells, suggesting that the signal observed is specific to GSPT1 ( Suppl. Fig. S4 ).
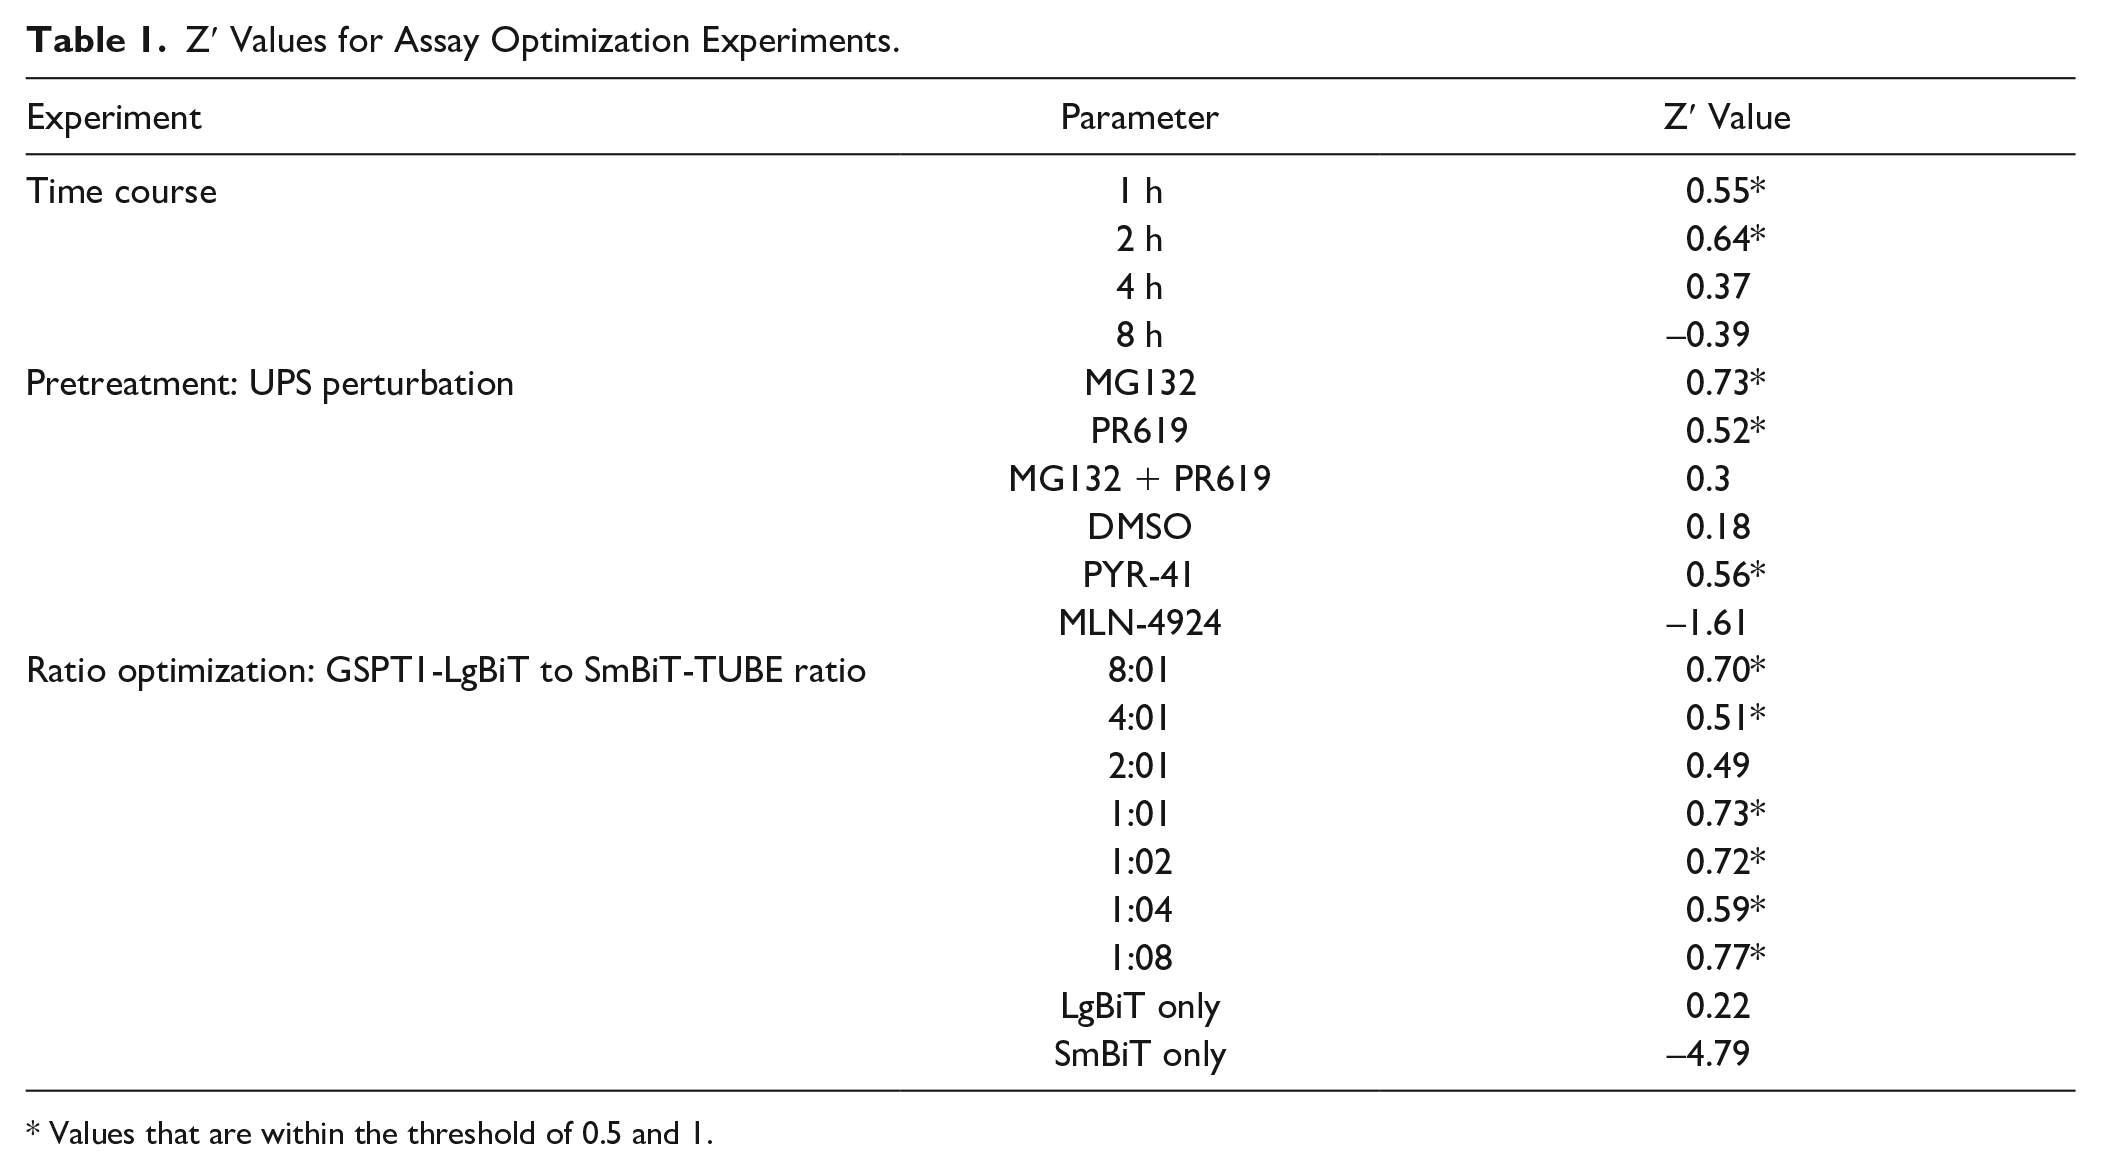
In order to determine the optimal protein expression ratio of GSPT1 and TUBE, HEK293T cells were transfected with various ratios of GSPT1-LgBiT to SmBiT-TUBE DNA and treated with MG132 and an 11-point log dilution of CC-885. Luminescence fold change was calculated based on 1 μM CC-885 and values of 4–5 were observed with Z′ values over 0.5 ( Fig. 2A ). With increased luminescence signal, we also observed a corresponding increase in background signal. The optimal ratio of GSPT1-LgBiT to SmBiT-TUBE DNA was determined to be 1:2, due to the highest Amax curve and fold-change values.
NanoBiT-TUBE assay optimization. (
To determine if we could utilize the NanoBiT-TUBE assay for ubiquitin kinetic studies, HEK293T cells transiently expressing the GSPT1-LgBiT and SmBiT-TUBE constructs were pretreated with 10 μM MG132 for 1 h. CC-885, at 10 μM, was added immediately, followed by Nano-Glo Live substrate addition. Luminescence readout was recorded every 15 min for 2 h, with the first reading immediately following substrate addition. The highest luminescence signal was observed at 30 min and signal decreases after 90 min ( Fig. 2B ), as expected based on the manufacturer’s specifications of the substrate stability in solution. In order to further validate the observed increase in signal, we tested the ability of our method to detect ubiquitination of GSPT1 at varying concentrations of CC-885. Using various pretreatment conditions and an 11-point log dilution of CC-885, we observed a dose-dependent increase in signal, with the exception of the MLN-4924 condition, which ablated signal ( Fig. 2C ). Prior reports determined the EC50 value of GSPT1 degradation by CC-885 to be 1 nM. 31 In this assay, we observed an EC50 value of GSPT1 ubiquitination by CC-885 of 1.49 nM. In addition, the minimal CC-885 concentration required for an observable signal increase over background was determined to be 500 pM, demonstrating the sensitivity of this assay.
HTS and Hit Validation
Once we determined that the optimal assay parameters, we set out to screen a larger structurally diverse set of 6500 compounds. We included CC-885 and compound 1 (a glutarimide compound shown to be unable to degrade GSPT1) 31 in the sample area for this screen. These compounds were screened at 30 μM to identify novel chemical matter that induces GSPT1 ubiquitination. Out of the 6500 compounds screened, only four hits were identified with a mean percent activity cutoff of +5 SD (0.062% hit rate)—CC-885 and compounds 1, A, and B—which were identified as potentially novel compounds that cause ubiquitination of GSPT1 ( Fig. 3A ). The low number of hits demonstrates the specificity of the assay and the low potential for off-target hits.
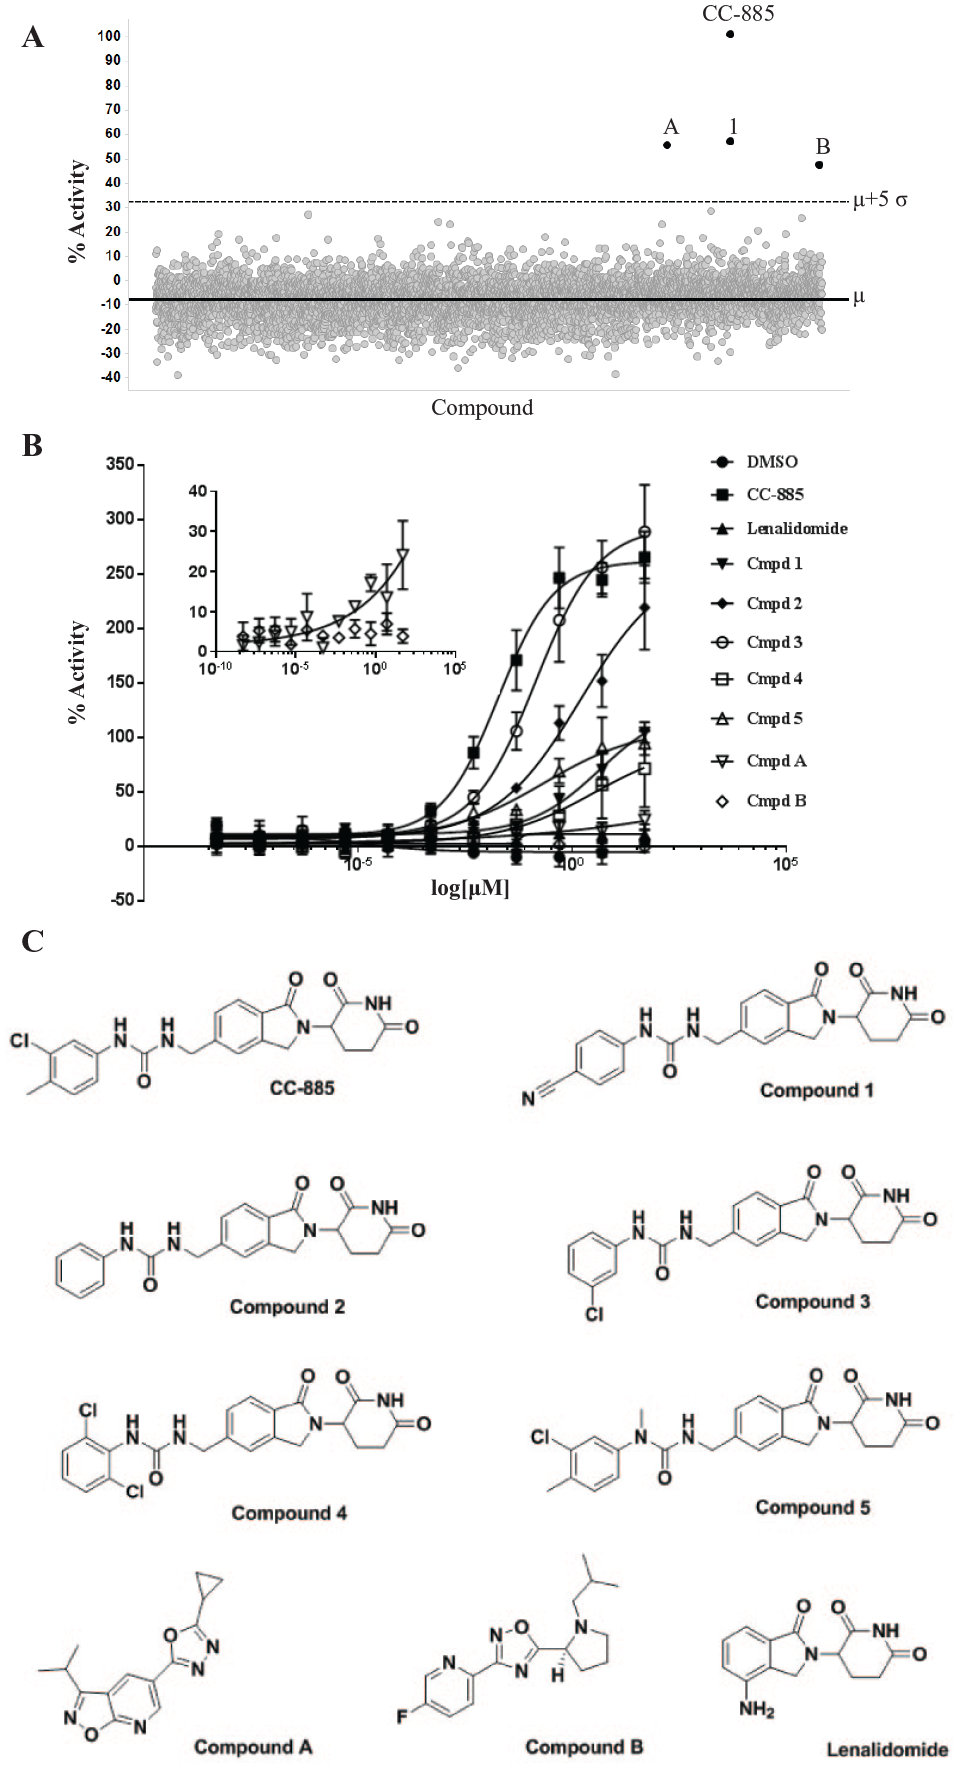
Screening for modulators of GSPT1 ubiquitination. (
To validate these hits, compounds 1, A, and B were screened in dose–response along with a set of CC-885 analog glutarimide compounds from published structure–activity relationship expansion 31 ( Fig. 3B,C ) to show differential ubiquitination activities on GSPT1. In general, there is a strong correlation between the Amax values of ubiquitination in the NanoBiT-TUBE assay and previously reported Ymax values for GSPT1 degradation 31 ( Table 2 ). Upon testing the CC-885 analogs with varying degradation activities on GSPT1, we observed that compound 3 showed robust ubiquitination of GSPT1 at a level comparable to or higher than CC-885. Compound 2 also showed increased ubiquitination of GSPT1, albeit at a lower level than compound 3, while compounds 1 and 5 induced weak, but measurable, ubiquitination of GSPT1. Surprisingly, the ubiquitination Amax values for compound 4 were lower than expected based on published Ymax degradation values. Compound A also showed weak ubiquitination of GSPT1 in a dose-dependent manner, but with an Amax of 25 at 50 μM compared with the percent activity score of 55 at 30 μM in the primary screen ( Fig. 3C inset). We could not confirm the activity of compound B in dose–response ( Fig. 3C inset).
Comparisons between Ubiquitination and Degradation Data of NanoBiT-TUBE, Published Ymax Values, and Low-Throughput Follow-Up Assays for Glutarimide Analogs.
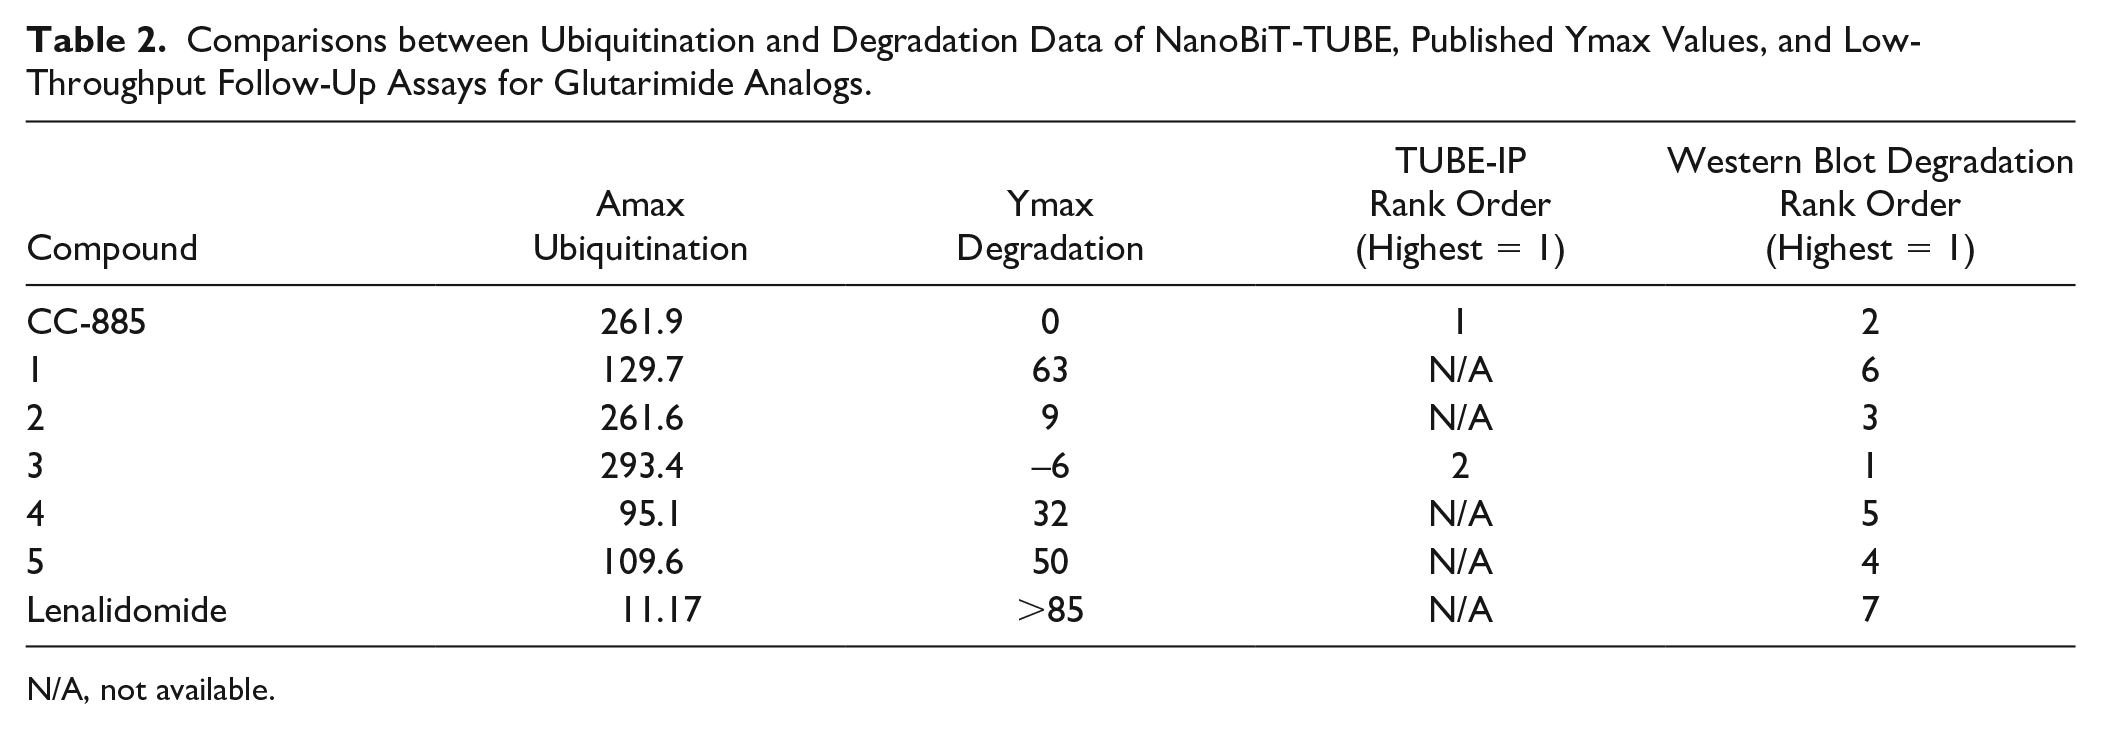
N/A, not available.
To compare the ubiquitination assay to well-established and widely published ubiquitination and degradation methods, we employed TUBE immunoprecipitation (TUBE-IP) and Western blot in untransfected HEK293T cells treated with CC-885, compounds 1–5, lenalidomide, and compounds A and B. To perform the TUBE-IP, all samples were treated with MG132 and some samples were also co-treated with MLN-4924 for 1 h, followed by compound treatment for 4 h before performing the immunoprecipitation. Consistent with the NanoBiT-TUBE results, the TUBE-IP confirmed that CC-885 exerts the highest increase in GSPT1 ubiquitination, but surprisingly, compound 3 demonstrated very weak ubiquitination, while compounds 1, 2, 4, 5, A, and B had no noticeable effect ( Fig. 4A ). Co-treatment with MLN-4924 inhibited CC-885 and compound 3-induced ubiquitination, demonstrating that the upper bands observed were ubiquitinated GSPT1. In order to compare to previously reported Ymax degradation, we treated cells with 1 μM compound for 6 h. Upon Western blot analysis of protein degradation, compound 3 and CC-885 induced complete degradation of GSPT1 at 1 μM over 6 h, while compounds 2 and 5 decreased some degradation of GPST1 and the other compounds had no effect ( Fig. 4B ). This correlates with the finding that compound 3 and CC-885 induce the highest levels of ubiquitination as measured by NanoBiT-TUBE, and the Amax of ubiquitination of many other CC-885 analogs correlates with the observed degradation activity at 1 μM ( Table 2 ).
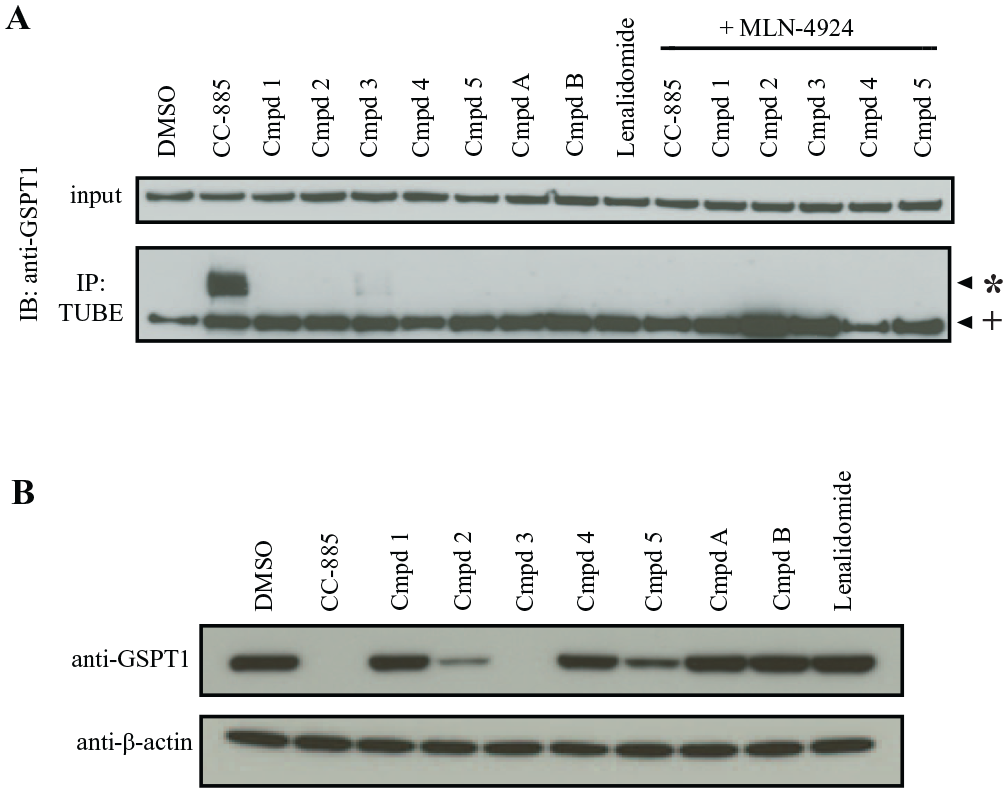
Screen follow-up. (
Discussion
The importance of the UPS in normal and disease states is well characterized,32,33 and many approaches have been developed recently to further elucidate and target this system for drug discovery. 34 The transient and reversible nature of ubiquitination makes it challenging to accurately measure this posttranslational modification. The most commonly used method for measuring ubiquitination is immunoprecipitation followed by Western blotting, but this approach is not amenable for HTS. 20 Other higher-throughput approaches that have been developed to study ubiquitination include the use of AlphaLISA, 35 which, similar to Western immunoprecipitation, does not require exogenous, tagged ubiquitin, but does not allow live-cell kinetic measurements and is limited by antibody availability, the need for high-energy lasers, and reagent sensitivity to environmental factors like light. 36
Other previously published methods of measuring protein ubiquitination include the use of FRET 37 or the closely related bioluminescence assay, bioluminescence resonance energy transfer (BRET), 38 which make use of probes that may fluctuate with changes in temperature and pH and have a low signal-to-noise ratio.39,40 Another recently developed method for ubiquitination measurement relies on the use of split-ubiquitin membrane-based yeast two-hybrid (Y2H). 41 This approach overcomes the limitation of other Y2H methods in terms of the need for nuclear localization of the protein. However, the use of exogenous ubiquitin that has to compete with high levels of endogenously expressed ubiquitin for observable functional activity remains a shortcoming of this approach.
Other biochemical methods developed for ubiquitination may not recapitulate the cellular complexities and feedback in the UPS.42,43 The few cell-based ubiquitination assays reported in the literature do not incorporate live-cell analysis25,44 and use exogenous ubiquitin. 45 Riching et al recently developed a bioluminescence, live-cell assay to study ubiquitination and degradation in the context of deciphering novel PROTAC interactions. 46 The use of exogenous ubiquitin and the low signal-to-noise ratio in BRET assays are limitations of this method.
Here we present the first live-cell high-throughput luminescent assay to detect endogenous ubiquitination. We developed a cellular assay that combines the use of TUBEs and NanoBiT protein complementation technology for luminescent output as a measure of target protein ubiquitination. We demonstrated the utility of this assay for IKZF1 and GSPT1 but focused our optimization efforts on GSPT1. By using characterized compounds that recruit de novo substrates to the well-characterized CRL4 receptor CRBN and, as such, have been characterized to mediate IKZF1 and GSPT1 degradation, we could show that our assay could quantitatively measure the intermediate ubiquitination step by the observed luminescence signal. As expected, the proteasome inhibitor MG132 causes an increased ubiquitination signal, likely due to blocking subsequent protein degradation and accumulation of ubiquitinated species. In addition, the NAE1 inhibitor MLN-4924 impeded the accumulation of the ubiquitination signal due to its ability to block CRL neddylation by the Nedd8-activating enzyme, thus blunting CRL activity and, as such, the turnover and polyubiquitination of the recruited substrate proteins. 11 The fact that addition of the pan-deubiquitinase inhibitor PR619 did not increase the signal significantly is surprising and may suggest that MG132 pretreatment conditions reach assay signal saturation, or that polyubiquitin chain protection by TUBE domains is sufficient to minimize deconjugation.
We also showed that the optimal time window during which high signal to background can be observed for GSPT1 ubiquitination is 1–2 h postcompound addition, after which there is a decrease in luminescence signal. We observed that the assay is resilient to changes in the ratio of the substrate protein to the TUBE domain DNA amount, and that optimal HEK293T cell density for the assay ranges from 2000 to 4000 cells/well in the 1536-well format, suggesting that this assay may be adapted to other cell types or screening formats. The assay has the added benefit of short-time-frame kinetic measurements using the Nano-Glo Live substrate, as we showed via tandem addition of a compound and Nano-Glo substrate mix. Use of Promega’s longer-duration Nano-Glo substrate Endurazine may increase kinetic measurement times beyond 40 h. We also showed a dose-dependent increase in luminescence signal upon CC-885-induced ubiquitination of GSPT1 and observed that the assay has EC50 values comparable to those previously reported. 29
To test the HTS compatibility of our assay we screened a 6500-compound library and identified compounds with varying levels of ubiquitination activity on GSPT1. We show that compound 3 and CC-885 induce the highest levels of ubiquitination, in both our assay and a standard immunoprecipitation approach. Other glutarimide analogs, compounds 1, 2, 3, and 5, have ubiquitination Amax values that correlate with the observed degradation Ymax as reported by Hansen and colleagues. 31 Surprisingly, compound 4 did not follow this trend and showed very weak ubiquitination of GSPT1. It is important to note that the previous study of this compound focused on degradation, which can result from other cellular pathways besides the UPS and can be confounded by compound-induced decreases in viability. We have also found that this assay is robust for delineating compounds that are cytotoxic from hits that truly cause ubiquitin-mediated degradation. Also, it is perhaps less likely that cytotoxic hits will score in our assay given the short compound incubation time (1 h). We also identified compounds A and B, which are nonglutarimide compounds, and confirmed weak ubiquitination of GSPT1 by compound A in a dose-dependent manner. Using the TUBE immunoprecipitation method, we confirmed that compound 3 and CC-885 induced ubiquitination of GSPT1. Our approach identified other compounds with moderate and weak ubiquitination of the target protein in a way that the standard immunoprecipitation method could not, suggesting that the NanoBiT-TUBE assay has increased sensitivity and the ability to identify novel chemical matter. In addition, compound 3 and CC-885 degrade GSPT1 within 6 h at 1 μM concentration. Other glutarimide analogs show varying levels of degradation, which is mostly correlated with the ubiquitination activity observed in the NanoBiT-TUBE assay, demonstrating that Amax of the NanoBiT-TUBE assay correlates with protein degradation and is likely predictive of degradation above a certain threshold. The observation that compound 2 causes moderate ubiquitination and degradation of GSPT1 and compound 1 causes weak ubiquitination of GSPT1, but does not degrade GSPT1, suggests that the NanoBiT-TUBE assay may have increased sensitivity to measure compound activity over degradation assays. Like degradation-based assays, the NanoBiT-TUBE assay is ligase agnostic, in that it measures ubiquitin transfer onto the substrate protein regardless of which E3 ligase recruited the substrate, allowing for potential identification of novel ligase activity. This assay could prove to be an essential tool for UPS discovery due to its high specificity, throughput, and sensitivity compared with standard ubiquitination and degradation assays. Findings resulting from this novel approach may be entry points for further compound optimization and medicinal chemistry.
Supplemental Material
Supplemental_material_novel_high_throughput_ubiquitination_Akinjiyan_legends – Supplemental material for A Novel Luminescence-Based High-Throughput Approach for Cellular Resolution of Protein Ubiquitination Using Tandem Ubiquitin Binding Entities (TUBEs)
Supplemental material, Supplemental_material_novel_high_throughput_ubiquitination_Akinjiyan_legends for A Novel Luminescence-Based High-Throughput Approach for Cellular Resolution of Protein Ubiquitination Using Tandem Ubiquitin Binding Entities (TUBEs) by Favour A. Akinjiyan, Aleem Fazal, Marc Hild, Rohan E. J. Beckwith, Nathan T. Ross, Joshiawa Paulk and Seth Carbonneau in SLAS Discovery
Footnotes
Acknowledgements
The authors would like to thank William Luther for assistance with figure formatting, and Jonathan Solomon, Martin Henault, and Janine Shulok for critical feedback concerning the manuscript. Favour A. Akinjiyan is now affiliated with Washington University, St. Louis, MO, and Nathan T. Ross is now affiliated with Vertex Pharmaceuticals, Boston, MA.
Supplemental material is available online with this article.
Declaration of Conflicting Interests
The authors declared the following potential conflicts of interest with respect to the research, authorship, and/or publication of this article: All authors are employed by Novartis Institutes for Biomedical Research, and their research and authorship of this article was completed within the scope of their employment with Novartis Institutes for Biomedical Research.
Funding
The authors received no financial support for the research, authorship, and/or publication of this article.
References
Supplementary Material
Please find the following supplemental material available below.
For Open Access articles published under a Creative Commons License, all supplemental material carries the same license as the article it is associated with.
For non-Open Access articles published, all supplemental material carries a non-exclusive license, and permission requests for re-use of supplemental material or any part of supplemental material shall be sent directly to the copyright owner as specified in the copyright notice associated with the article.