
Abstract
In the last 5 years, cellular thermal shift assay (CETSA), a technology based on ligand-induced changes in protein thermal stability, has been increasingly used in drug discovery to address the fundamental question of whether drug candidates engage their intended target in a biologically relevant setting. To analyze lysates from cells submitted to increasing temperature, the detection and quantification of the remaining soluble protein can be achieved using quantitative mass spectrometry, Western blotting, or AlphaScreen techniques. Still, these approaches can be time- and cell-consuming. To cope with limitations of throughput and protein amount requirements, we developed a new coupled assay combining the advantages of a nanoacoustic transfer system and reverse-phase protein array technology within CETSA experiments. We validated the technology to assess engagement of inhibitors of insulin-degrading enzyme (IDE), an enzyme involved in diabetes and Alzheimer’s disease. CETSA—acoustic reverse-phase protein array (CETSA-aRPPA) allows simultaneous analysis of many conditions and drug–target engagement with a small sample size, in a rapid, cost-effective, and biological material-saving manner.
Introduction
In the past few years, cellular thermal shift assay (CETSA) has emerged as an essential tool to explore target engagement and target validation in drug discovery, directly in the complex environment of intact cells. 1 It is increasingly also used to guide medicinal chemistry efforts and lead optimization.2,3 CETSA is based on the ligand-induced stabilization of the targeted protein ( Fig. 1A ). 2 After lysis of cell samples previously incubated in the presence or absence of ligand and subsequently heated at various temperatures, an aggregation protein profile is determined by measuring folded protein remaining in the cell lysate. The alteration of heat-induced aggregation by a small molecule binding to the protein causes a shift (also referred to as thermal shift) in the aggregation temperature (TAgg). Along with the increasing use of CETSA, various detection methods have been developed, 2 based on either homogeneous detection,4,5 high-resolution mass spectrometry (MS),6,7 or image analysis8,9 ( Fig. 1A ).
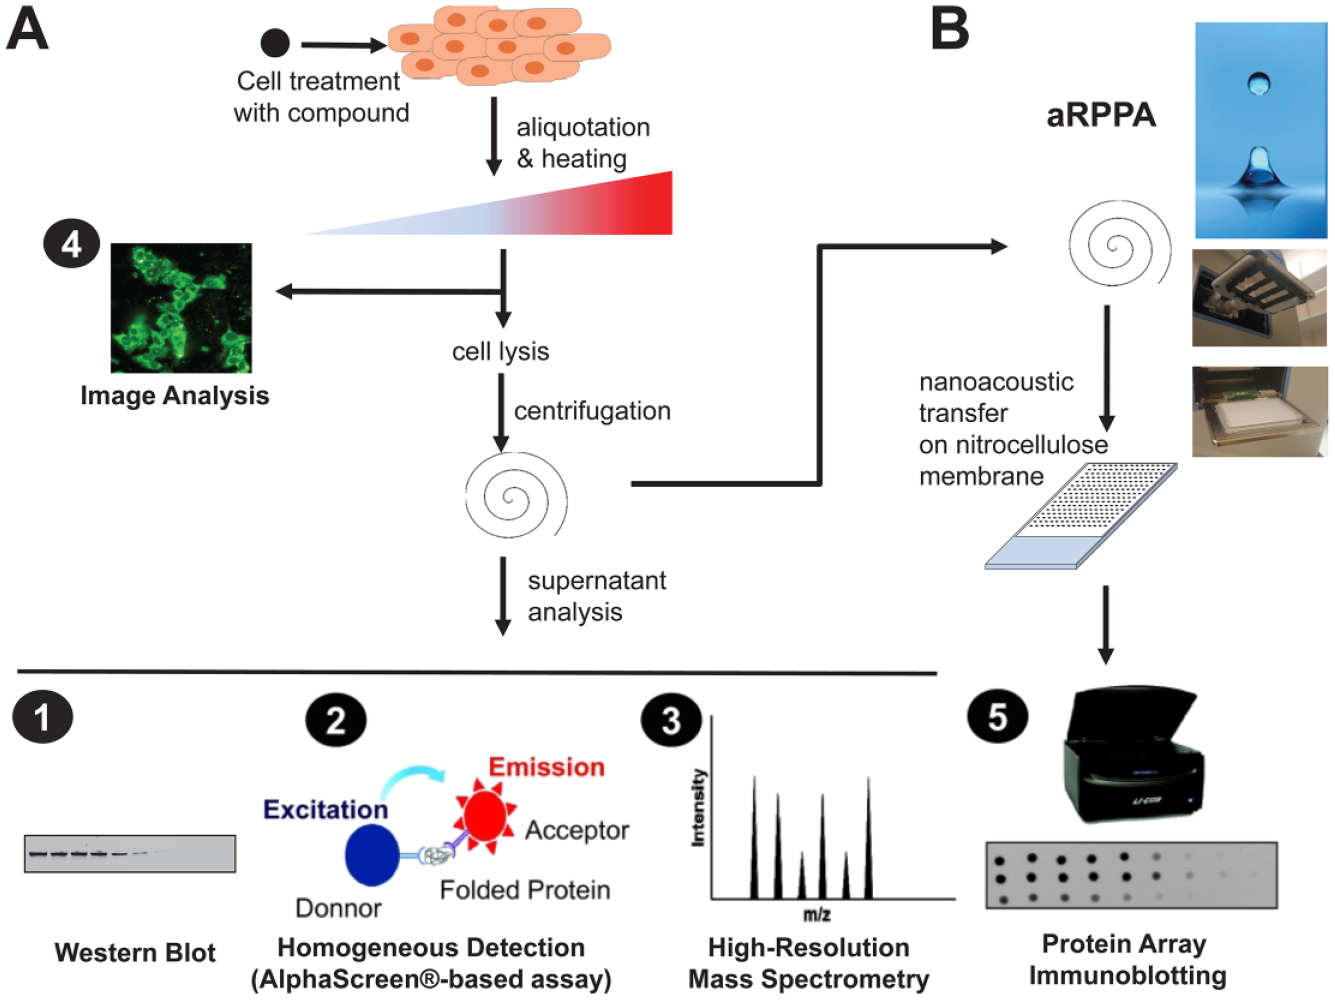
Current protocols of CETSA and proposed CETSA-aRPPA. (
To support decision making and compound selection in drug discovery, it is critical that the tools allow the testing of numerous compounds, and thus the throughput of CETSA needs to be increased. In this context, CETSA has been successfully coupled with AlphaLISA detection to screen androgen receptor ligands and to determine the agonist or antagonist binding mode of compounds. 10 Alternatively, enzyme fragment complementation (EFC), which is based on protein modification with a tag, allows the detection of nonaggregated protein by the addition of the enzyme acceptor (EA) fragment, in a high-throughput manner. This technique has been applied for the discovery of SMYD3 inhibitors using β-galactosidase-derived fragment, or for the screening of CDK9 inhibitors using a fragment of NanoLuc (NLuc).11,12 These latest developments have greatly improved throughput but nonetheless require specific assay development. Indeed, CETSA AlphaLISA requires the availability and optimization of a pair of antibodies. Additionally, CETSA EFC requires the production of the tagged–target and the checking of the absence of alteration of TAgg of the fused protein tag compared with untagged protein. Also, it is based on the production of a tagged protein within a cell, the expression of which can dramatically differ from that of the native protein.
As a result, Western blot (WB) is still the most used readout to quantify the folded protein target in CETSA protocols. However, this method leads to a large amount of data points to analyze, requires substantial cell amounts, and is labor-intensive when many compounds or parameters have to be tested. In this context, we propose to couple reverse-phase protein array (RPPA) technology to CETSA ( Fig. 1B ). RPPA can be fully adapted to measure the protein target signal at high throughput with minimal sample consumption. Thanks to the use of highly specific primary antibodies and automation allowing the printing of replicates, the technique is both robust and quantitative. Also, we use the most recent developments in the field of acoustic droplet ejection technology 13 for microarraying. To validate this method, we explored the target engagement of inhibitors of insulin-degrading enzyme (IDE). CETSA-aRPPA successfully provided insights into compound profiles and IDE target engagement in hepatocytes.
Materials and Methods
Cell Culture and Compound Treatments
HepG2 cells provided by Dr. Nathalie Hennuyer (Institut Pasteur de Lille, Lille, France) were cultured in gelatin (G-1890, 1 mg/mL; Sigma-Aldrich, St. Louis, MO) precoated T75 flasks in MEM Alpha Medium (1×) + GlutaMax (32561-029; Thermo Fisher Scientific, Waltham, MA) containing 10% heat-inactivated fetal calf serum (10270-106; Life Technologies, Walltham, MA) and 5 µg/mL penicillin/streptomycin (15070-063; Life Technologies), in a 37 °C humidified incubator with a 5% CO2 atmosphere. After the cells had grown to confluence, vehicle or compounds (
CETSA
Suspended HepG2 cells were washed in phosphate-buffered saline (PBS) and detached using trypsin/EDTA solution (25300054; Life Technologies). Cells were transferred in medium in a 15 mL Falcon and centrifuged at 300g for 4 min. Supernatant was then discarded and cells were washed in PBS (DPBS [1×], 14190-094; Gibco), counted, and centrifuged at 300g for 4 min. After removing PBS, cells were suspended in Tris-buffered saline 1× (TBS 10×; ET220-B; Euromedex, Souffelweyersheim, France) at 10 million/mL and aliquoted in 10 PCR 0.2 mL microtubes (AB-0622; Thermo Fisher Scientific) for each condition with 50 µL. Tubes were then transiently heated to a range of temperature from 40 to 67 °C for 3 min using a SureCycler 8800 Thermal Cycler (Agilent Technologies, Santa Clara, CA), cooled at room temperature (RT) for 3 min, and followed by three freeze/thaw cycles in liquid nitrogen. Insoluble proteins were separated by centrifugation (20,000g, 20 min, 4 °C) and 35 µL of supernatant corresponding to soluble proteins was kept for WB or RPPA analysis. Three independent experiments were performed for each compound. For ITDRFCETSA-aRPPA, see Supplemental Methods.
SDS-PAGE Electrophoresis with CETSA Samples
Each total protein sample (7 µL) was prepared and heated at 70 °C for 10 min with NuPAGE Sample Reducing Agent (10×) (NP0004; Thermo Fisher Scientific) and NuPAGE LDS Sample Buffer (4×) (NP0007; Thermo Fisher Scientific), loaded in NuPage 3%–8% polyacrylamide gel for migration (150 V, 1 h), and then transferred on a nitrocellulose membrane (10600080; Amersham Protran supported 0.2 µm NC (Nitrocellulose), Thermo Fisher Scientific) with an iBlot 2 Gel Transfer Device (IB21001; Thermo Fisher Scientific).
Immobilization of CETSA Samples and Purified IDE on Nitrocellulose by Nanoacoustic Transfer
A Labcyte 384 LDV microplate (LP-0200, Labcyte Inc, Sunnyvale, CA) was loaded with CETSA protein samples and TBS bovine serum albumin (BSA) 1% solution with 50 and 100 ng/mL IDE as controls, left at RT for 2 h to perform the protein saturation of microplate plastic (cyclic olefin copolymer), and centrifuged without seal at 1500g for 2 min with medium deceleration velocity. Using an acoustic liquid handling device (Echo 550; Labcyte) and Echo array Maker software, we transferred 20 nL of lysate or protein sample onto a nitrocellulose membrane (10600080; Amersham Protran supported 0.2 µm NC) fixed on a glass slide maintained on a slide holder (30065759; Tecan, Männedorf, Switzerland). After 2 h at RT, membranes were store at 4 °C until final disposal.
Immunoblotting for WB and RPPA
Blots and printed membranes were blocked in dry milk (5%) diluted in PBS for 1 h at RT and washed three times for 10 min in PBS 0.1% Tween 20. Mouse monoclonal anti-IDE antibody (clone F-9, sc-393887; Santa Cruz Biotechnology, Santa Cruz, CA) was used as the primary antibody diluted at 1:1000 for WB or 1:2500 for RPPA in 2% BSA–PBS 0.1% Tween 20 solution and incubated for 1 h 30 min for WB and 30 min for RPPA at RT. After three washes in 0.1% PBS Tween 20, Anti-Mouse IRDye 800 CW (IRDye 800CW Goat anti-Mouse IgG, P/N 925-32210; LI-COR, Lincoln, NE) was used as the secondary antibody in 2% BSA–PBS 0.1% Tween 20 solution at 1:20,000 for 1 h 30 min at RT, and blots were washed three times in PBS Tween 0.1% before fluorescence intensity detection by the Odyssey CLx Imaging System (LI-COR).
Data Analysis and Aggregation Curve
The signal intensities (corresponding to sample fluorescence minus background fluorescence) of each protein band or spot on the WBs or RPPAs were quantified using Image Studio Lite Analysis Software (LI-COR). Fold changes were calculated in percentage of the lowest temperature. The relative signals were plotted against temperature using GraphPad Prism and a variable slope sigmoidal curve was fitted using the chemical denaturation theory equation:
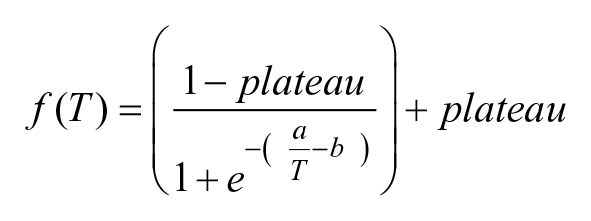
Initial values for the top and bottom plateaus were set at 100% and 0%, respectively, for curve fitting. Aggregation curves were expressed independently for each experiment or as means of multiple experiments (n = 3) ± SEM. Thermal shifts were calculated using ΔTAgg50, as the difference in TAgg values between the control and treatment, at which 50% signal intensity (protein denaturation) was observed.
Determination of IDE Inhibition by Compounds
Recombinant human IDE was provided by Prof. W. J. Tang (University of Chicago). The enzymatic activity of IDE was assayed quantifying the amount of insulin (Actrapid; Novo Nordisk) at the end of the incubation period. A total of 19.6 µL of wild-type IDE in HEPES buffer (50 mM with 100 mM NaCl, pH 7.4) at 300 ng/mL was preincubated for 15 min at RT with 400 nL of test compound or vehicle (DMSO) transferred with the Echo 550 into 96-well half-area microplate (3686; Corning). The reaction was then started by the addition of 20 µL of insulin at 40 nM. The final concentrations of IDE and the substrate were 0.25 µg/mL and 20 nM, respectively. Incubations were performed at ambient temperature for 10 min. The reaction was then stopped by the addition of 40 µL of 200 mM EDTA. The samples were diluted by 10 in AlphaLISA diluent. Two microliters of samples or standard was incubated with 8 µL of a 2.5× mix of AlphaLISA anti-insulin acceptor beads, biotinylated antibody anti-insulin, and AlphaLISA immunoassay buffer in a 384-well Proxiplate (AL204C; PerkinElmer). The microplate was sealed and left on the bench for 60 min at RT. Ten microliters of a mix of SA-donor beads and AlphaLISA immunoassay buffer was added and the plate was read with a Mithras LB 940 reader (Berthold) with the AlphaScreen protocol at 620 nm after 30 min of incubation. IC50 values were calculated using XLfit 5 software from concentration–response curves fitted by a nonlinear regression analysis to the four-parameter logistic equation:
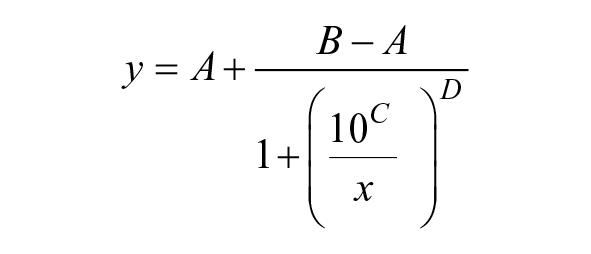
where A is the minimum y value, B is the maximum y value; C is the LogIC50 value, and D is the slope factor.
Results and Discussion
IDE is a ubiquitous protease involved in the degradation of many peptides, like insulin, that share a propensity to be amyloidogenic. IDE has an atypical structure that is able to undergo a large conformational shift from fully closed to fully open states. CryoEM studies on IDE recently revealed how amyloidogenic peptides are captured and hydrolyzed by IDE.
14
In recent years, several exosite-binding inhibitors, such as BDM4312415,16 or
Design and Validation of CETSA-aRPPA
In the described assay, we propose analyzing the soluble protein fraction obtained from CETSA experiments by RPPA approaches consisting of the immobilization of samples on a nitrocellulose support and subsequent detection by immunoblotting with an antibody directed against the protein of interest. HepG2 cells have been treated for 2 h with compounds
Linearity of IDE Detection Using Acoustic Transfer and RPPA Technologies
Immobilization of protein samples or purified IDE on the array was set up using Echo acoustic liquid handling technology. 20 Using sound energy achieved by the transducer, we transferred lysates from a source well of a 384-well low-dead-volume microplate to a nitrocellulose membrane, which provides contactless fluid dispensing. This destination support is fixed on a glass slide and held in a specific handler that is inverted in order to place the membrane above the source well ( Suppl. Fig. S2 ). Spots of protein samples correspond to 20 nL of transfer (8 droplets of 2.5 nL). To validate the correlation between the IDE signal detected by fluorescence and the concentration of this protein target, we have printed 20 nL of IDE protein from 50 µg/mL to 2.5 ng/mL. Pictures acquired after immunoblotting development corresponding to three drop-offs of the IDE range (10 concentrations) are shown in Supplemental Figure S3 . A very good linear correlation (r2 = 0.9695) between IDE concentration and fluorescence signal was measured.
Accuracy and Precision of RPPA versus WB
In order to avoid the detection of unrelated proteins in the RPPA approach, the high specificity of antibody directed against IDE (110 kDa) has been checked in WB on HepG2 protein extracts. The second strongest band (90 kDa) was found to have an intensity below 5% of the specific signal at 110 kDa, qualifying the antibody RPPA quantification (
Suppl. Fig. S4
). Quantified signals obtained from CETSA experiments (in WB and CETSA-aRPPA) were normalized for each condition of treatment with the signal at the lowest temperature (40 °C) corresponding to 100% of nonaggregated protein. Using the chemical denaturation theory formula, we fitted the data to obtain an aggregation curve of IDE in the presence or absence of inhibitors. To evaluate the accuracy of CETSA-aRPPA versus WB, three biological experiments for each method underwent the same analysis process (
Fig. 2A,B
,
Suppl. Figs. S5
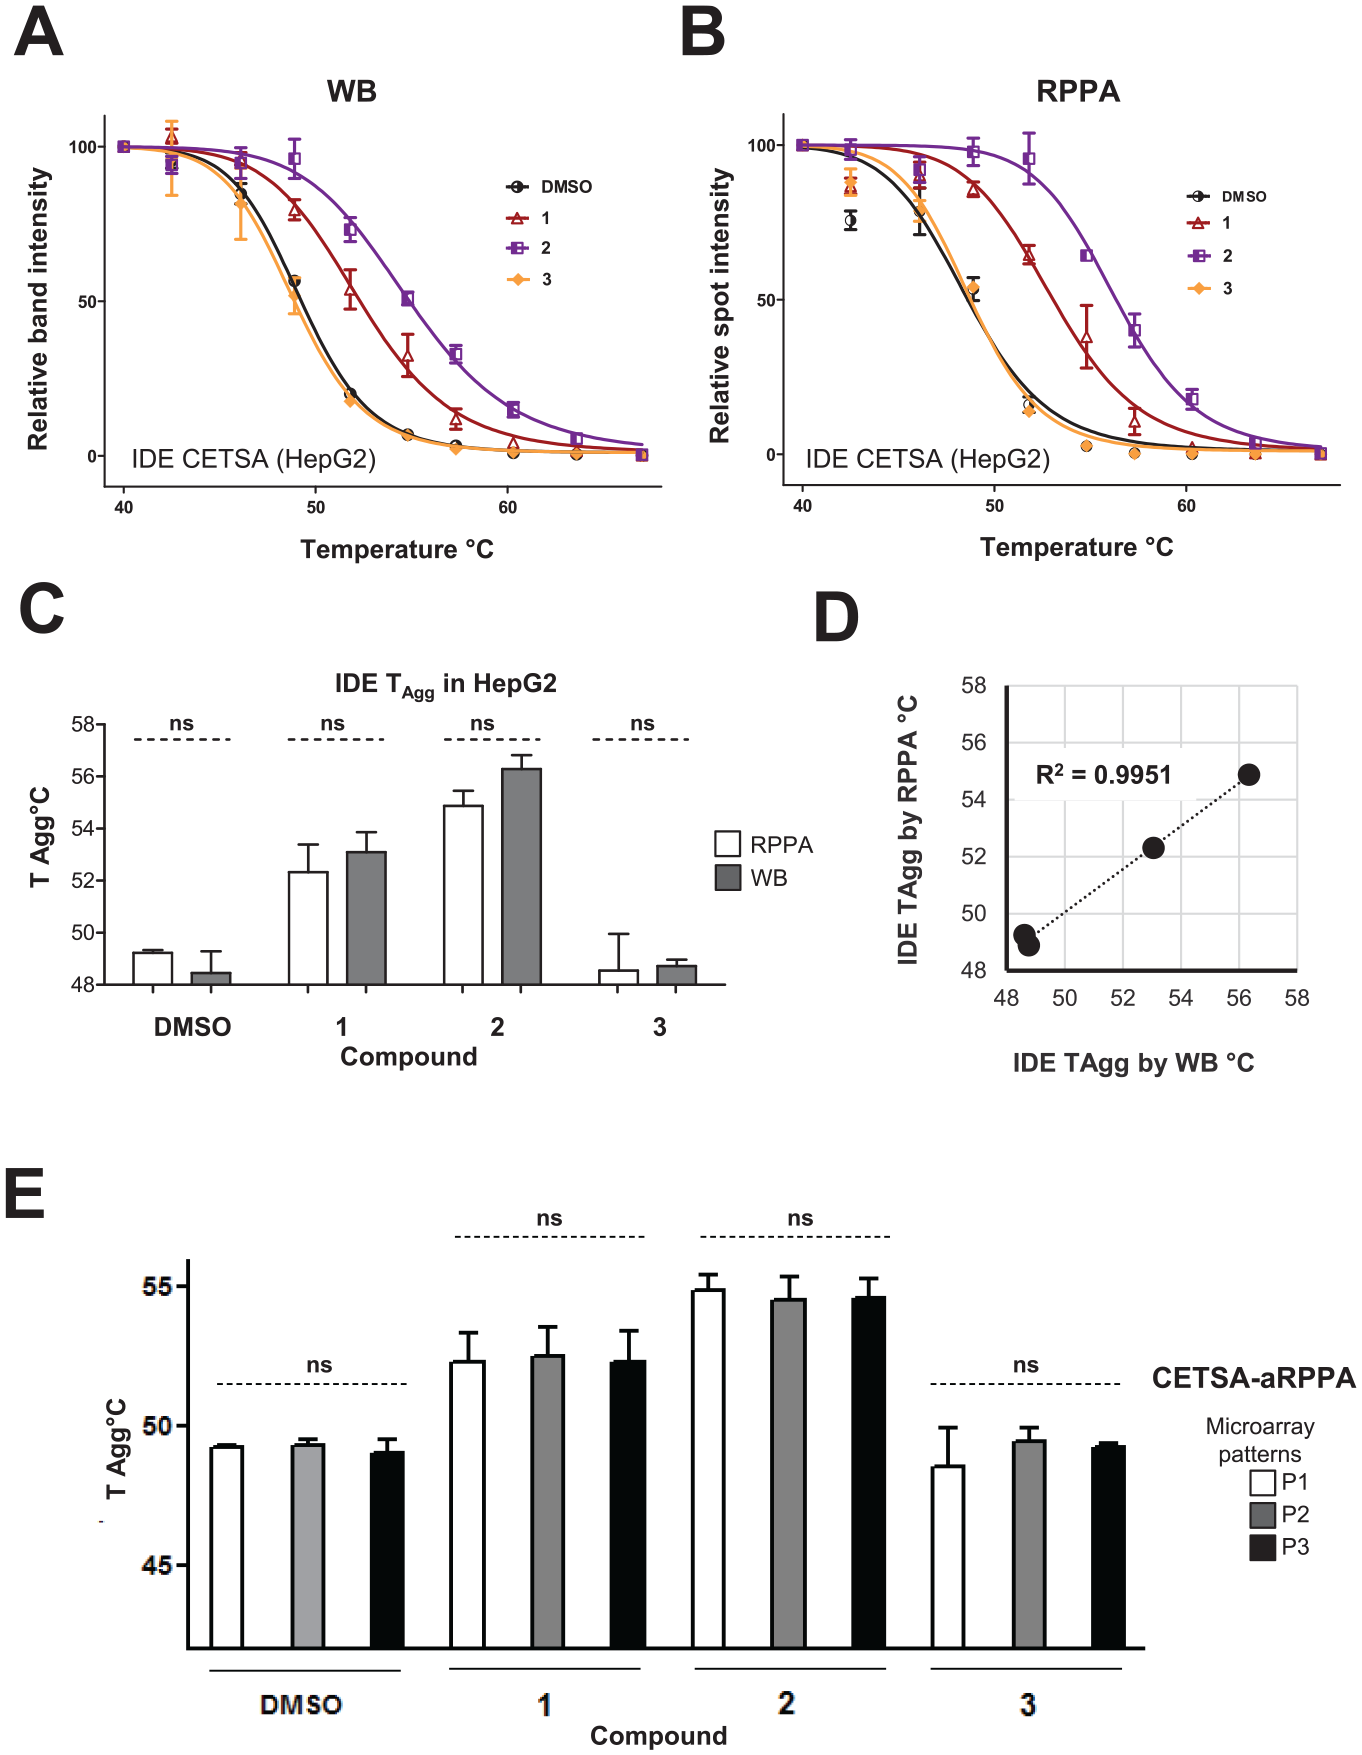
Validation of CETSA-aRPPA assay to screen for intracellular target engagement, in comparison with classical CETSA-WB, in HepG2 cells. HepG2 cells were treated for 2 h with DMSO vehicle or compounds (30 μM) before applying heat shock, lysis, and quantification by aRPPA or WB. Aggregation curves of IDE in the absence and presence of inhibitors determined by WB (
Cellular Target Engagement of IDE by Inhibitors
The three compounds (
Fig. 3A
) with inhibitory activities on IDE (enzymatic assay) in the same range (6.5 < pIC50 < 6.9;
Fig. 3B
) were selected to study target engagement of IDE in hepatocytes. Compounds
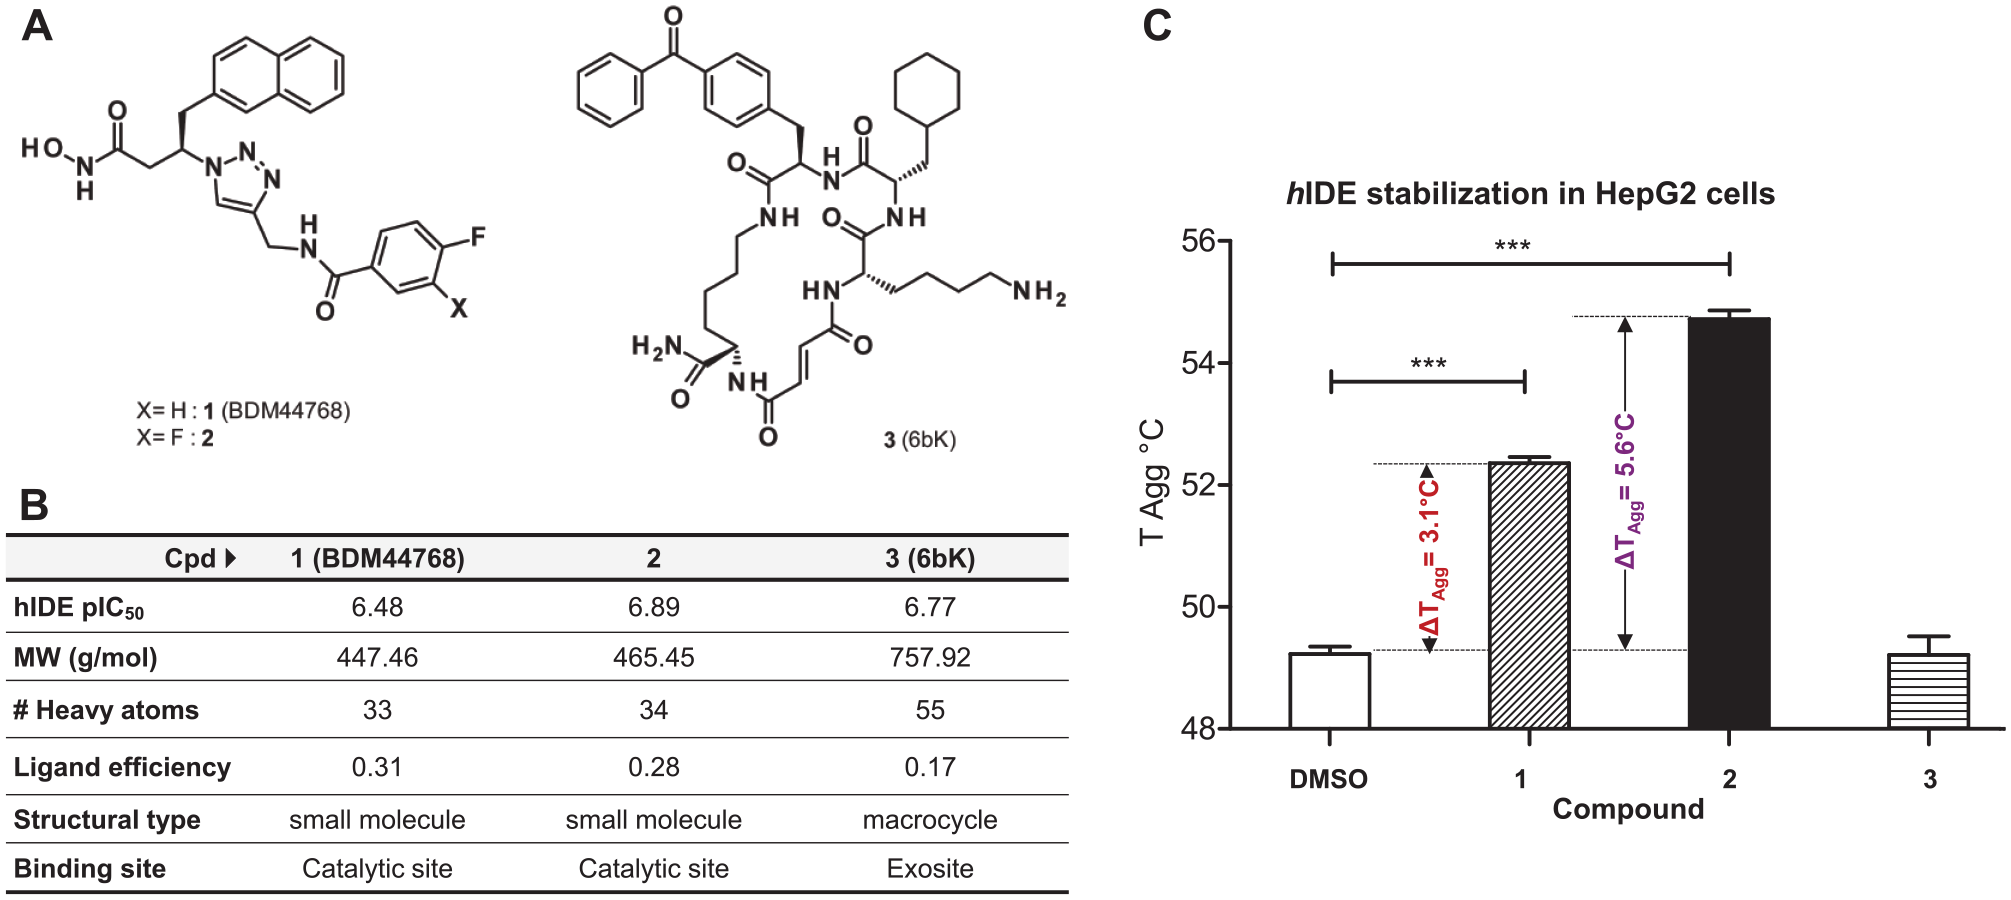
Evaluation of thermal stabilization of IDE in HepG2 cells by inhibitors
Using the same CETSA-aRPPA technique, we measured the dose-dependent IDE stabilization (isothermal dose–response fingerprint [ITDRF]) by compounds
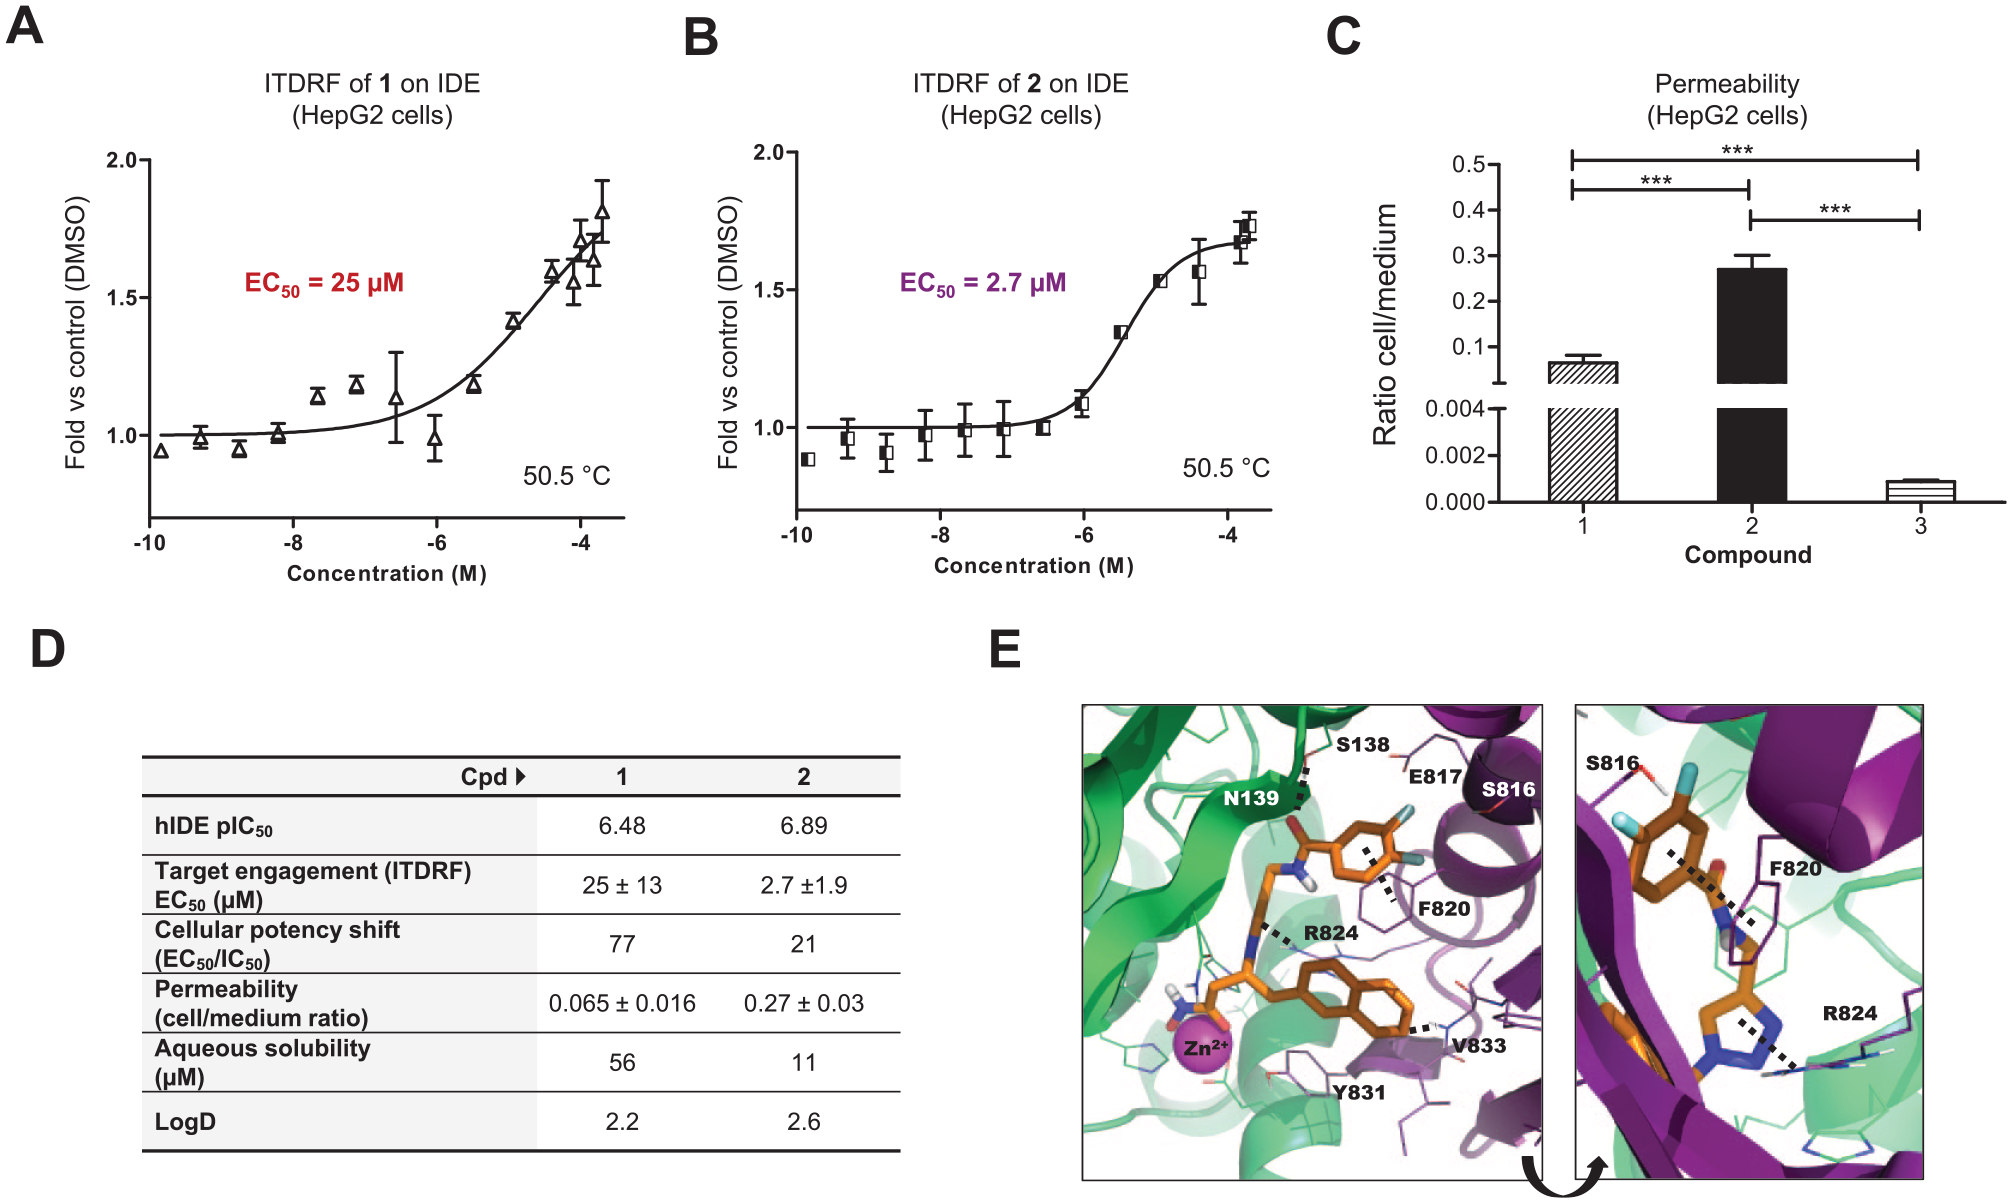
Dose-dependent stabilization (ITDRFCETSA-aRPPA) of IDE in HepG2 cells by inhibitors
Interestingly, potency shift between the acellular inhibitory assay (IC50) and cellular engagement assay (EC50) is three times lower for compound
ITDRF is more relevant to measure target engagement in cells than measuring the global intracellular concentrations of compounds because these could have an uneven cellular distribution. For our chemical series, however, the potency shift seems to be correlated to the ability to penetrate HepG2 cells.
Compound
Target engagement in whole cells or tissues has become a fundamental step in drug discovery projects in order to select drug candidates before preclinical studies or to confirm functional effects of chemical compounds. In this context, CETSA is a tool of choice to study target engagement. This approach considers addressing, permeability, and general protein-binding aspects and permits direct measurement of ligand binding to the target protein. Nevertheless, despite an easy implementation for most laboratories, application to large chemical series or libraries remains challenging. Based on new features of a nanoacoustic transfer device, we developed CETSA-aRPPA technology with the objective to propose a new valuable tool to explore target engagement with a higher throughput than conventional and actual analysis techniques and a lower consumption of samples. The method displays a high precision and accuracy compared with WB. It was used to study the target engagement of IDE by inhibitors in the whole HepG2 cell context. aRPPA detection can also be used to measure ITDRF dose-dependent stabilization of the target of interest (ITDRFCETSA-aRPPA) with the same advantages. In the future, CETSA-aRPPA will allow further applications, including screening or multitarget engagement studies.
Supplemental Material
Supplemental_Material_for_CETSA_aRPPA_by_Herledan_et_al_rev – Supplemental material for Drug Target Engagement Using Coupled Cellular Thermal Shift Assay—Acoustic Reverse-Phase Protein Array
Supplemental material, Supplemental_Material_for_CETSA_aRPPA_by_Herledan_et_al_rev for Drug Target Engagement Using Coupled Cellular Thermal Shift Assay—Acoustic Reverse-Phase Protein Array by Adrien Herledan, Marine Andres, Aurore Lejeune-Dodge, Florence Leroux, Alexandre Biela, Catherine Piveteau, Sandrine Warenghem, Cyril Couturier, Benoit Deprez and Rebecca Deprez-Poulain in SLAS Discovery
Footnotes
Acknowledgements
The authors would like to thank Dr. Nathalie Hennuyer for the kind gift of the HepG2 cell line and Prof. Wei-Jen Tang for human recombinant IDE.
Supplemental material is available online with this article.
Declaration of Conflicting Interests
The authors declared no potential conflicts of interest with respect to the research, authorship, and/or publication of this article.
Funding
The authors disclosed receipt of the following financial support for the research, authorship, and/or publication of this article: The authors acknowledge financial support from INSERM, University of Lille, Institut Pasteur de Lille, Region Nord Pas de Calais, FEDER, State (0823007, 0823008, 07-CPER 009-01, 2007-0172-02-CPER/3); the European Union under the European Regional Fund (ERDF), by the Hauts-de-France Regional Council (contract no. 17003781); the MEL (contract no. 2016_ESR_05); and the French State (contract no. 2017-R3-CTRL-Phase 1) and Institut Universitaire de France.
References
Supplementary Material
Please find the following supplemental material available below.
For Open Access articles published under a Creative Commons License, all supplemental material carries the same license as the article it is associated with.
For non-Open Access articles published, all supplemental material carries a non-exclusive license, and permission requests for re-use of supplemental material or any part of supplemental material shall be sent directly to the copyright owner as specified in the copyright notice associated with the article.