
Abstract
Understanding drug target engagement and the relationship to downstream pharmacology is critical for drug discovery. Here we have evaluated target engagement of Chk1 by the small-molecule inhibitor V158411 using two different target engagement methods (autophosphorylation and cellular thermal shift assay [CETSA]). Target engagement measured by these methods was subsequently related to Chk1 inhibitor–dependent pharmacology. Inhibition of autophosphorylation was a robust method for measuring V158411 Chk1 target engagement. In comparison, while target engagement determined using CETSA appeared robust, the V158411 CETSA target engagement EC50 values were 43- and 19-fold greater than the autophosphorylation IC50 values. This difference was attributed to the higher cell density in the CETSA assay configuration. pChk1 (S296) IC50 values determined using the CETSA assay conditions were 54- and 33-fold greater than those determined under standard conditions and were equivalent to the CETSA EC50 values. Cellular conditions, especially cell density, influenced the target engagement of V158411 for Chk1. The effects of high cell density on apparent compound target engagement potency should be evaluated when using target engagement assays that necessitate high cell densities (such as the CETSA conditions used in this study). In such cases, the subsequent relation of these data to downstream pharmacological changes should therefore be interpreted with care.
Introduction
Determining and understanding ligand–protein interactions (target engagement) at the site of drug action in the cell is critical for small-molecule drug discovery. Understanding how this relates to downstream phenotypic and/or pharmacological effects is important for assigning the cellular changes observed to on-target engagement versus off-target effects. A large number of the biophysical methods (e.g., nuclear magnetic resonance, surface plasmon resonance, and isothermal titration calorimetry) used to characterize ligand–protein interactions in cell-free systems are not directly transferable to cell-based assays. For small molecules that target enzymes, the most routinely used method is to monitor cellular changes to substrate or product generation. Several caveats exist for this: (1) the substrate or product must be unique to the enzyme studied, and (2) the substrate or product must be readily measurable in cells in a relatively high-throughput fashion. For other targets, such as G-protein-coupled receptors (GPCRs), it has been possible to assay displacement of a radiolabeled tracer ligand or changes to second messenger signaling (e.g., cAMP) in an artificial cell model expressing only the GPCR of interest. These “classical” approaches, however, are not amenable for a large number of potential drug targets. New methodologies and techniques are starting to emerge that allow the measurement of target engagement in a diverse array of protein classes. These include approaches that require (1) modification of the small molecule and target protein (e.g., bioluminescence resonance energy transfer [BRET] and fluorescence resonance energy transfer–fluorescence lifetime imaging [FRET-FLIM]), (2) modification of the small molecule, (3) competition for a target probe (e.g., KiNativ, 1 kinobeads, 2 and related techniques), (4) modification of protein enzyme fragment complementation (e.g., InCELL Hunter Assay), or (5) no modification (e.g., cellular thermal shift assay [CETSA], drug affinity responsive target stability [DARTS], and proximity ligation assay [PLA]) (reviewed in Schurmann et al. 3 and Simon et al. 4 ).
The distinct advantage of the modification free target engagement technologies is that they can, in theory, be applied to any target in any cellular system. Of these assays, the CETSA, first described by Molina et al., 5 has come to the fore. The assay relies on the principle that ligand binding results in thermal stabilization (or sometimes destabilization) of the bound protein. Cells are exposed to ligand and then heated and lysed, and the soluble pool of the target protein is detected by Western blotting or homogenous detection methods (e.g., AlphaScreen and enzyme-linked immunosorbent assay [ELISA]). 6 Target engagement against a range of small-molecule targets has been described.7–9 A recent advance has seen the application of high-resolution mass spectrometry to the whole proteome, enabling not only the measurement of desired on-target effects but also the identification of potential off-target liabilities.10–13 In an analogous fashion, DARTS relies on the increased protection from proteolysis conferred by ligand binding. 14 This technique has not become as popular as CETSA, potentially due to the reliance on high-resolution mass spectrometry to monitor protein stability. The serine/threonine checkpoint kinase Chk1 is a central component of the DNA damage response (DDR) pathway critical for protecting cells from endogenous and exogenously induced DNA damage and replication stress. Activation of the DDR results in a number of cellular responses, including checkpoint activation and cell cycle arrest, initiation of DNA repair, regulation of transcription, and apoptosis.15,16 Numerous small-molecule inhibitors of Chk1 have been developed17–22 and have demonstrated preclinical activity as anticancer agents both as monotherapy and as potentiators of cytotoxic chemotherapy. In the majority of human cancers, the G1/S checkpoint is dysfunctional, for example, by p53 mutation or functional inactivation, 23 making tumor cells highly reliant on Chk1 for checkpoint function. Tumor cells with a defective p53 response are particularly sensitive to Chk1 inhibitors in the presence of DNA-damaging chemotherapeutic agents. 24 A range of phase I and II clinical trials are currently evaluating this approach (reviewed in Manic et al. 25 ).
DNA damage and replication stress induced by cytotoxic chemotherapeutic agents and ionizing radiation or the unscheduled and uncoordinated DNA replication arising from oncogene activation and/or the loss of tumor suppressor proteins induce replication fork stalling and the activation of the DDR. Replication fork stalling results in the generation of tracts of ssDNA as the replicative helicase continues to unwind DNA in front of the stalled DNA polymerase. Binding of ssDNA by replication protein A (RPA) recruits ATR, and its subsequent activation by TOPBP1 leads to Chk1 phosphorylation on serine 317 and serine 345,26,27 and autophosphorylation on serine 296. 28 Activation of Chk1 induces cell cycle arrest (through the degradation of Cdc25 phosphatases), fork stabilization and protection from cleavage, and activation of homologous recombination repair. Inhibition of Chk1 in these circumstances results in increased DNA damage, especially double-strand breaks (DSBs), unscheduled entry into mitosis, and ultimately cell death.
V158411 is a potent, selective inhibitor of Chk1 discovered using structure-based drug design. 20 Inhibition of Chk1 autophosphorylation (pS296) has routinely been used as a proximal biomarker of cellular target engagement by Chk1 inhibitors in vitro and in vivo.20,22 We utilized S296 phosphorylation and CETSA to determine the target engagement of V158411 with Chk1 in human cancer cell lines. This was subsequently compared with a range of cellular phenotype changes associated with Chk1 inhibition.
Materials and Methods
Cell Lines and Cell Culture
HT29 and U2OS cells were purchased from the ATCC and grown in Dulbecco’s modified Eagle’s medium (DMEM) or McCoy’s 5a media supplemented with 10% fetal bovine serum (Thermo Fisher Scientific, Waltham, MA) and 1% penicillin/streptomycin at 37 °C and 5% CO2 in a humidified incubator. Cell lines were established as a low-passage cell bank and then routinely passaged in our laboratory for less than 3 months after resuscitation. Authentication was by STR profiling (LGC Standards).
Compounds
V158411 was provided by Vernalis Research (Cambridge, UK) 20 and prepared as a 20 mM stock in DMSO, aliquoted and stored at –20 °C. The same DMSO stock was used for all experiments.
Immunoblotting
Cells were washed once with phosphate-buffered saline (PBS) and then lysed with ice-cold RIPA buffer containing halt protease and phosphatase inhibitor cocktail (Thermo Fisher Scientific). Protein concentration was determined using a BCA protein assay kit and equal amounts of protein separated on Bolt 4%–12% Bis-Tris plus gels (Thermo Fisher Scientific). Protein was transferred to a polyvinylidene fluoride membrane and probed with the following primary antibodies: pChk1 (S296) (1:2500, Ab79758, Abcam, Cambridge, UK), pChk1 (S345) (1:2500, 2348, Cell Signaling Technologies, Danvers, MA), or total Chk1 (1:5000, 2360, Cell Signaling Technologies). Primary antibodies were detected with a horseradish peroxidase (HRP)–conjugated secondary antibody (Santa Cruz Biotechnology, Santa Cruz, CA) and Western Lightning Plus (PerkinElmer, Waltham, MA) or Immobilion (Merck Millipore, Billerica, MA) enhanced chemiluminescence substrate, and then imaged on an LAS 4000 imager (Fujifilm, Tokyo, Japan). Images were quantified by densitometry using ImageJ software (National Institutes of Health [NIH]).
Single-Cell Immunofluorescent Imaging
Single-cell immunofluorescent imaging was conducted as previously described29,30 with the following primary antibodies: γH2AX (1:1000, 05-636, Merck Millipore), pChk1 (S317) (1:800, 12303, Cell Signaling Technologies), pChk1 (S345) (1:100, 2348, Cell Signaling Technologies), or total Chk1 (1:500, Ab40866, Abcam). Primary antibodies were detected with an Alexa Fluor 488 labeled secondary antibody (1:500, Thermo Fisher Scientific) and counterstained with Hoechst 33342 and an Alexa Fluor 647 Phalloidin (Thermo Fisher Scientific). Plates were imaged on an Operetta high-content imager (PerkinElmer) using a 10, 20, or 40× objective and analyzed using Harmony software (PerkinElmer). Selectivity of the Chk1 antibody (Ab40866) was confirmed using an ON-TARGET plus Human CHEK1 SMARTpool siRNA (GE Dharmacon, Lafayette, CO).
Cellular Thermal Stability Assay
CETSA assays were conducted essentially as previously described.5,6 HT29 or U2OS cells (1 × 10⁶, in suspension in 100 μL of PBS) were heated using a PTC-200 thermal cycler (MJ Research, Waltham, MA) for 3 min and then incubated at room temperature for 5 min. Following repeated freeze–thaw cycles to lyse the cells and centrifugation to pellet aggregated proteins and cellular debris, soluble Chk1 protein was determined by immunoblotting with a mouse monoclonal antibody (1:5000, 2360, Cell Signaling Technologies). For isothermal dose response fingerprinting (ITDRFCETSA) determinations, cells were incubated with V158411 for 30 min prior to heating at either 52 or 55 °C. ImageJ software (NIH) was used for densitometric analysis of protein expression. Temperature or dose–response curves were calculated in Microsoft EXCEL using an XLFit software add-in (ID Business Solutions, Guildford, UK).
Apoptosis
Caspase-3/7 activity in live cells was determined using CellEvent caspase-3/7 green ReadyProbes reagent (Life Technologies, Waltham, MA). Images were acquired using the Alexa 488 fluorescence channel on the Operetta high-content imaging system at 10× magnification.
Cell Proliferation Assays
Five thousand cells per well were seeded in 96-well plates and incubated overnight. Cells were treated with a 10-point titration of compound for 72 h. The effect on cell proliferation was determined with sulforhodamine B (SRB) after fixation with 10% trichloroacetic acid and read on a Victor plate reader (PerkinElmer). GI50 values were calculated in Microsoft EXCEL using an XLFit software add-in (ID Business Solutions).
High-Content Live Cell Imaging
Cells were seeded in 96-well CellCarrier plates (PerkinElmer) and allowed to attach for 24 h before addition of compound. Images were acquired as indicated using the bright-field and digital phase imaging modalities on the Operetta high-content imaging system at 10× magnification. Cell confluency was determined from the bright-field images using the “Find Texture Regions” building block coupled with PhenoLOGIC texture-based segmentation in the Harmony software. Cell number was determined by analysis of the digital phase images with the “Find Cells” building block in Harmony.
Statistical Analysis
Results were analyzed using a two-tailed Student’s t-test tool within the data analysis package provided by Microsoft EXCEL.
Results
Determination of V158411 Chk1 Target Engagement by S296 Phosphorylation and CETSA
V158411 is a potent, selective inhibitor of Chk1 kinase developed using structure-guided drug design 20 and inhibits purified, recombinant human Chk1 with an IC50 of 4.4 ± 2.1 nM. V158411 induced a concentration-dependent decrease in Chk1 autophosphorylation (pS296) with IC50 values of 75 ± 36 nM and 119 ± 37 nM and IC90 values of 330 ± 290 nM and 610 ± 240 nM in HT29 and U2OS cells, respectively ( Fig. 1A–C ). Inhibition of pChk1 (S296) occurred within 5 min of V158411 addition ( Fig. 1D ) and was maintained for at least 24 h after addition.
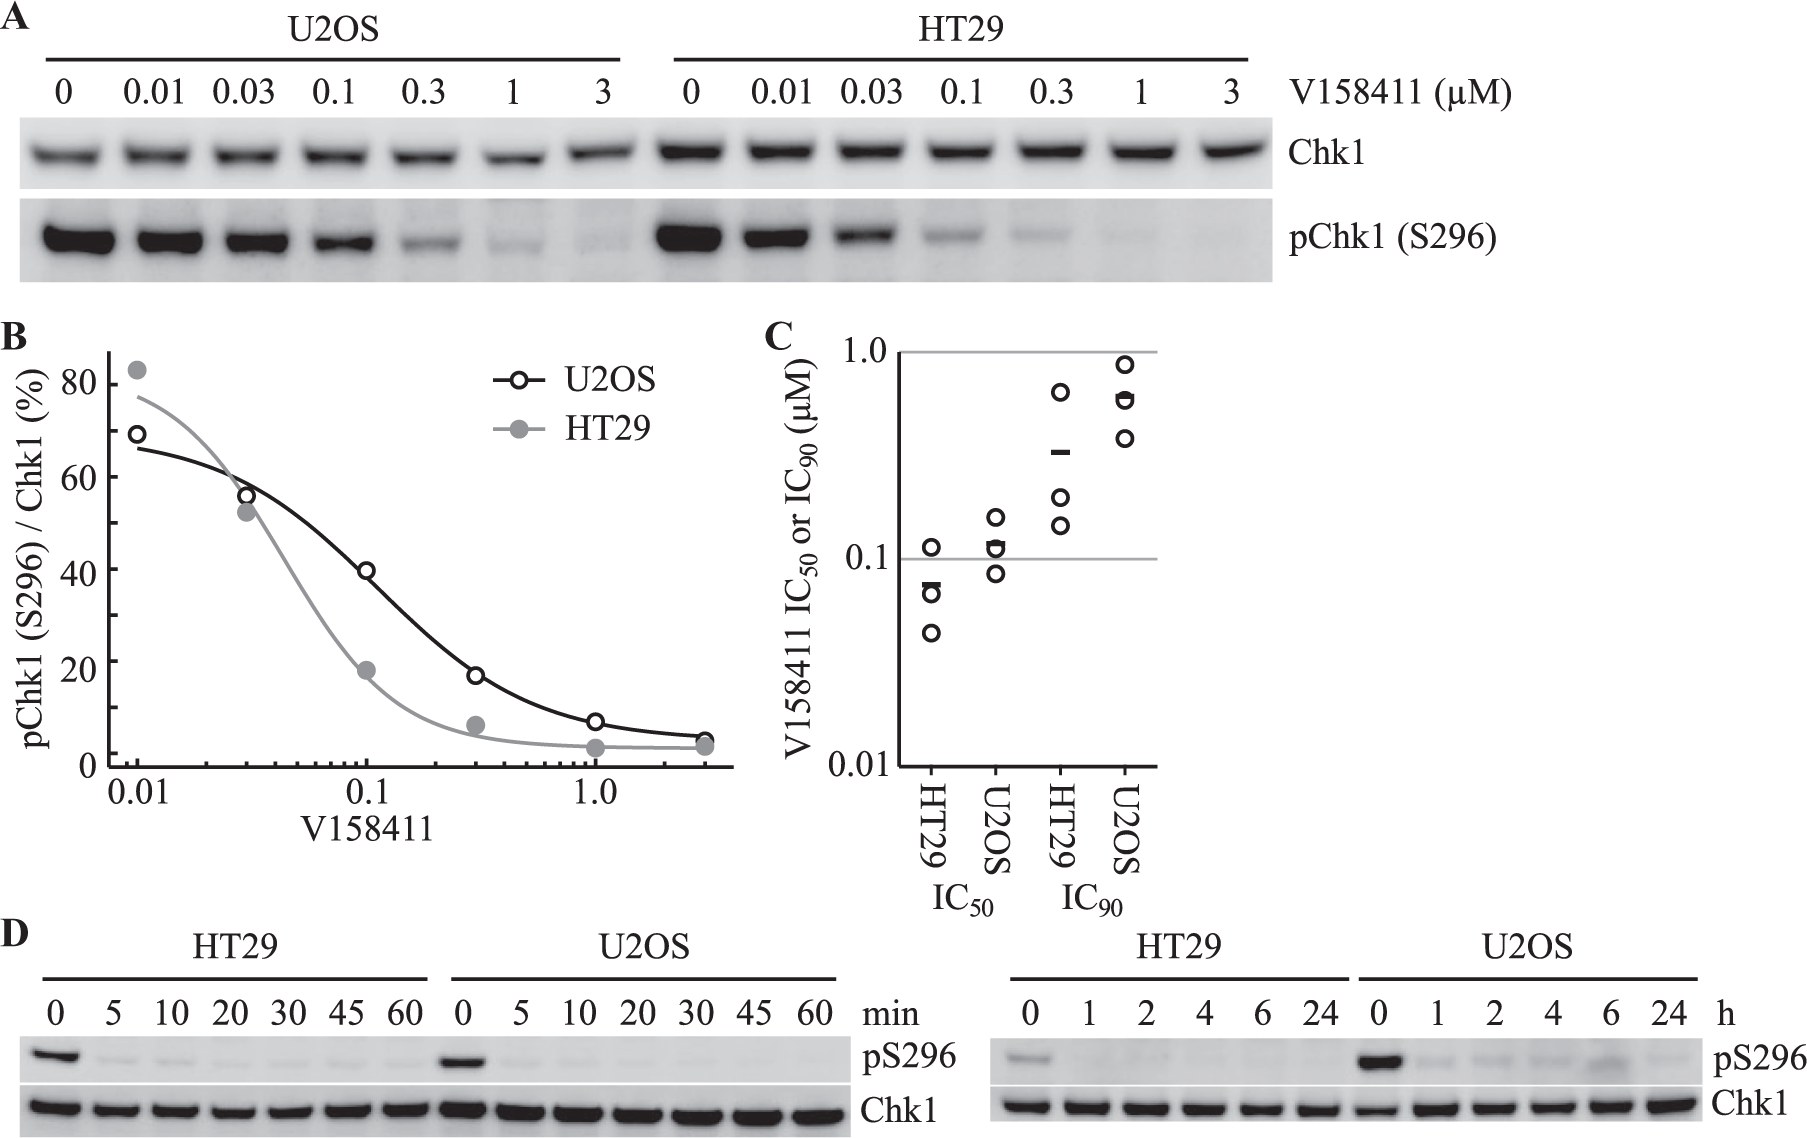
V158411 inhibits Chk1 autophosphorylation in HT29 and U2OS cancer cells. (
We utilized CETSA 5 to further evaluate the cellular potency of V158411 against Chk1. Protein thermal melt curves for Chk1 were generated in HT29 and U2OS cells with an apparent aggregation temperature (Tagg, the temperature at which half of the protein has denatured and aggregated) of 50.3 ± 1.4 and 51.6 ± 0.4 °C, respectively ( Fig. 2A–C ). Isothermal dose–response fingerprint (ITDRFCETSA) values were generated at 52 and 55 °C to estimate the relative extent of V158411 target engagement in both cell lines. At 52 °C, V158411 stabilized cellular Chk1 with an EC50 of 2.7 ± 2.9 and 3.8 ± 4.5 µM, and at 55 °C, the EC50 values were 2.6 ± 0.89 and 2.0 ± 1.5 µM in HT29 and U2OS cells, respectively ( Fig. 3A,B ).
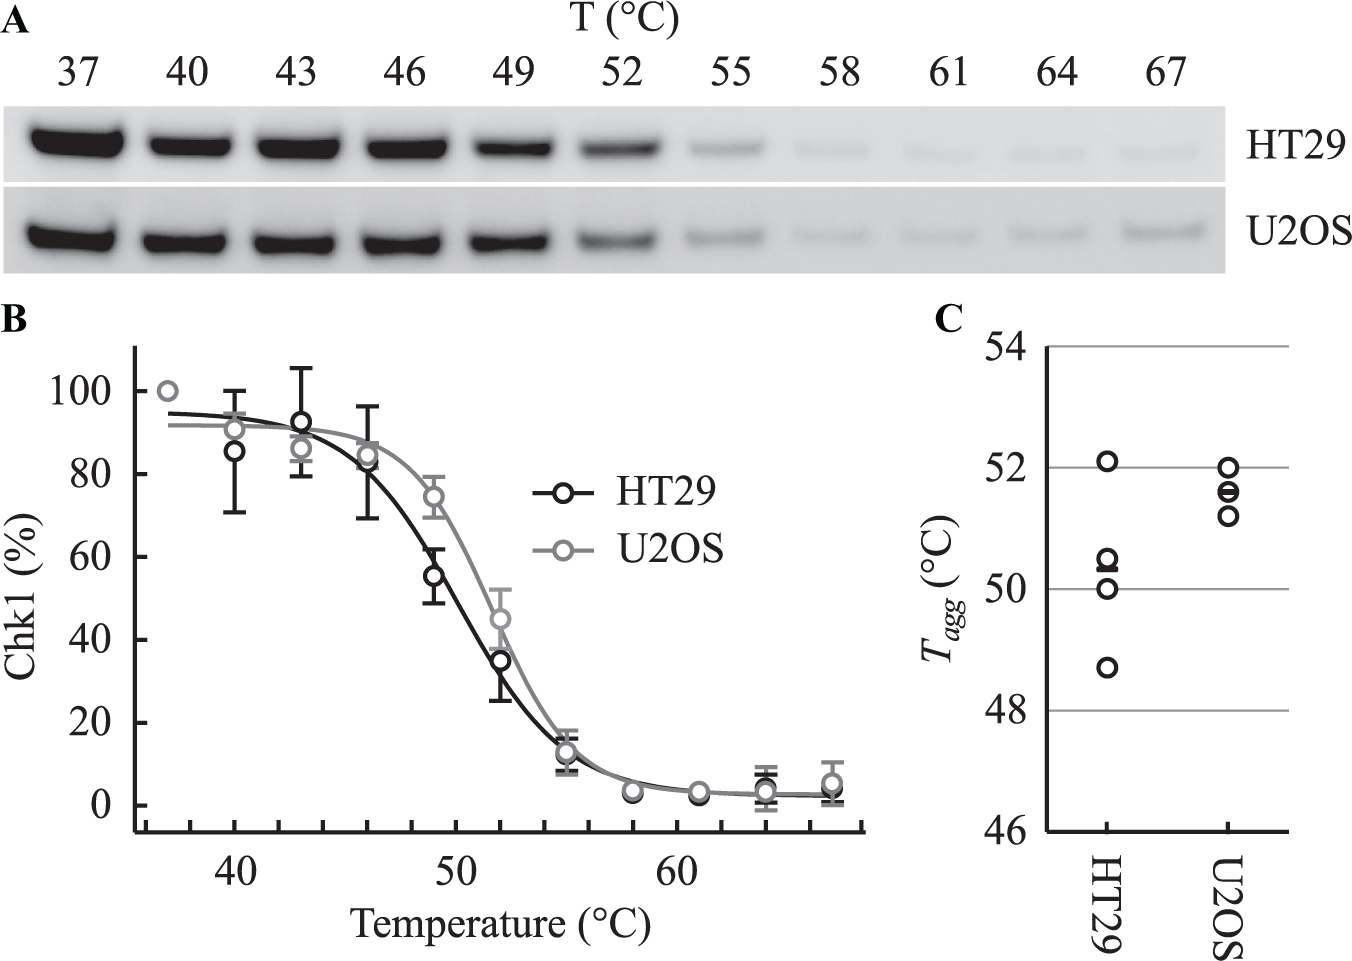
Determination of Chk1 Tagg in intact HT29 or U2OS cells. (
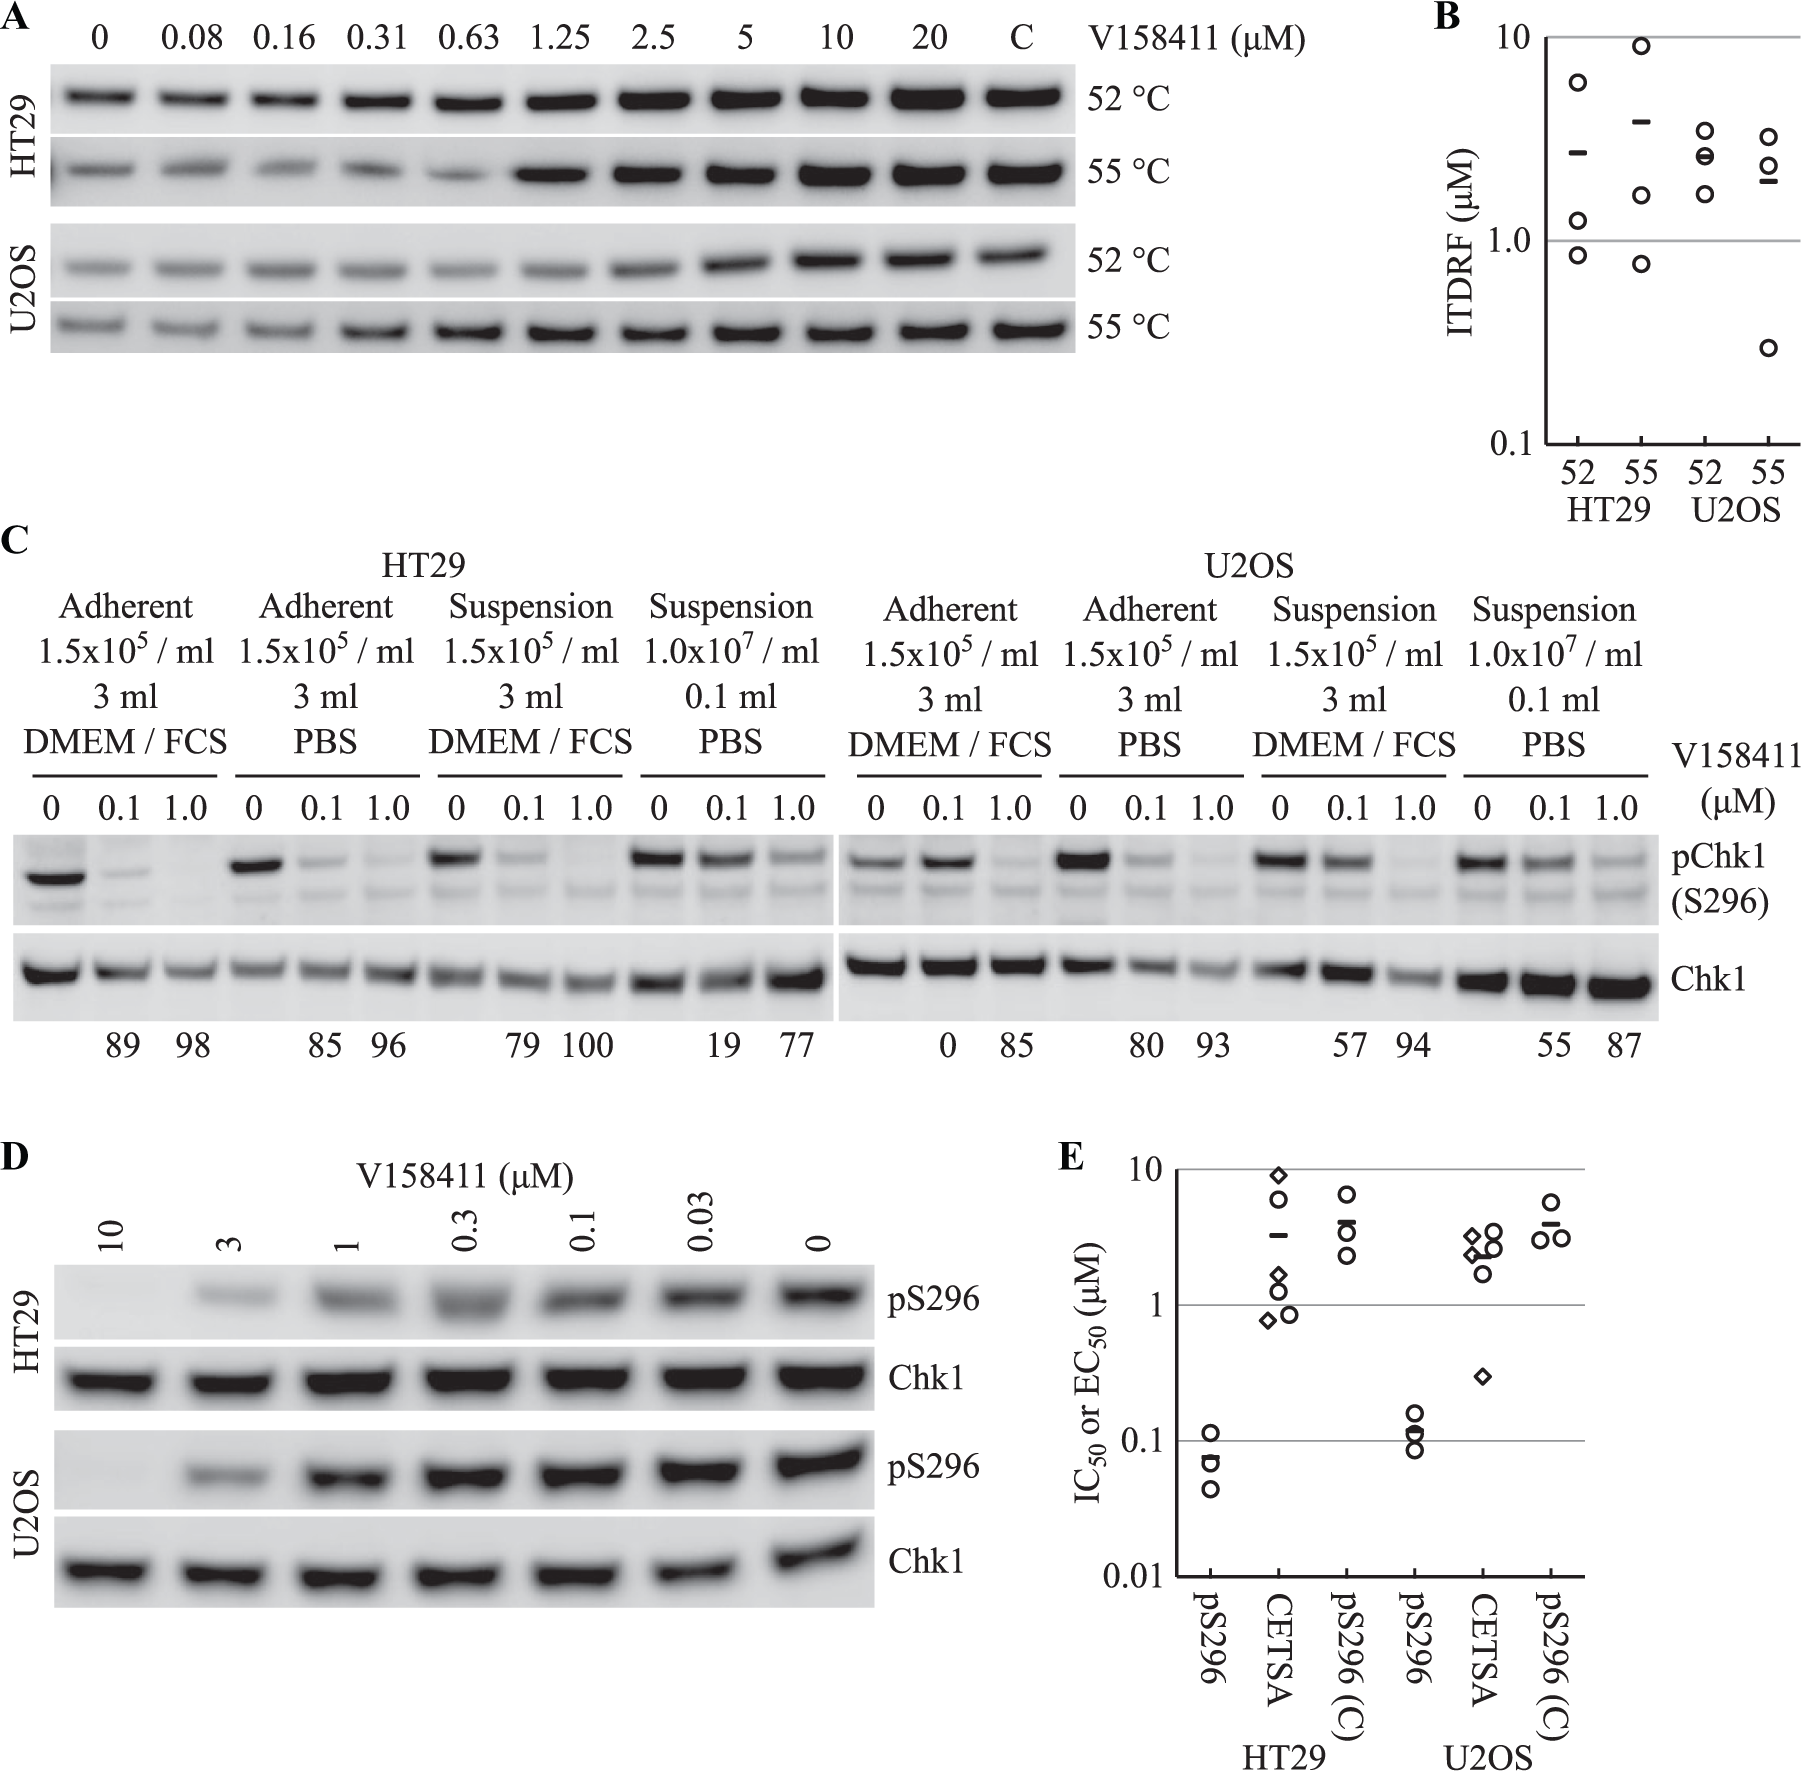
V158411 thermostabilizes Chk1 in intact cells. (
We observed a striking difference in V158411 Chk1 target engagement measured using autophosphorylation and CETSA, with the IC50 measured by pChk1 (S296) Western blotting being 43- and 19-fold lower in HT29 and U2OS cells, respectively, than the EC50 value measured by CETSA. An inspection of the two assay formats revealed distinct differences between them. In the CETSA assay, cells were treated with V158411 in suspension in PBS in a lower volume at a much higher density of cells ( Suppl. Table S1 ). To determine the effects of assay conditions on V158411 potency, we determined the effect of 0.1 and 1.0 µM V158411 on pChk1 (S296) under different assay conditions. In HT29 cells, V158411 demonstrated reduced inhibition of S296 phosphorylation under the CETSA conditions compared with standard adherent growth ( Fig. 3C ). To evaluate this further, the V158411 pChk1 (S296) IC50 was determined under CETSA assay conditions in both cell lines. V158411 induced a concentration-dependent decrease in Chk1 autophosphorylation (pS296) with mean IC50 values of 4.1 ± 2.2 μM and 3.9 ± 1.5 μM in HT29 and U2OS cells ( Fig. 3D ). This was 54- and 33-fold lower than that determined under the standard Western blotting conditions ( Fig. 3D ) and closely resembled the mean CETSA EC50 value.
V158411 Induces Cellular Morphology Changes and Chk1 Relocalization
Single-cell immunofluorescent high-content imaging was utilized to evaluate the effect of V158411 on cellular morphology and Chk1 protein localization. We initially used a SMARTpool CHEK1 siRNA to confirm that the EP691Y anti-Chk1 rabbit monoclonal antibody detected Chk1 by immunofluorescence. Knockdown of CHEK1 for 48 h reduced the Chk1 immunofluorescent signal in HT29 and U2OS cells ( Suppl. Fig. S1 ), demonstrating that this antibody specifically detects Chk1.
HT29 and U2OS cells were subsequently treated with increasing concentrations of V158411 for 24 or 48 h and various cellular parameters determined by high-content imaging. Inhibition of Chk1 by V158411 induced some distinct morphological and phenotypic changes in HT29 and U2OS cells. In HT29 but not U2OS cells, V158411 reduced both the mean nuclear and cytoplasmic Chk1 staining ( Suppl. Fig. S2 ) with EC50 values of 0.52 and 0.41 µM, respectively ( Suppl. Table S2 ). At higher concentrations of V158411, Chk1 appeared to accumulate in the perinuclear region in HT29 and U2OS cells, with EC50 values between 2.8 and 5.0 µM ( Suppl. Fig. S2 ). V158411 altered the cellular actin staining by phalloidin, resulting in cells with brighter but more punctate staining than DMSO-treated control cells, with EC50 values of 0.75 and 0.56 µM for HT29 cells and 0.99 and 1.2 µM for U2OS cells after 24 and 48 h ( Suppl. Table S2 ) V158411 treatment, respectively. V158411 reduced the number of cellular nuclei detected with EC50 values between 0.58 and 1.1 µM. Finally, V158411 increased the number of U2OS but not HT29 cells with small, bright nuclei (EC50 1.4 and 0.98 µM after 24 and 48 h treatment, respectively ( Suppl. Fig. S3 ). These nuclei had a DNA content equivalent to that of cells in the G1 and S phases and stained positive for active caspase-3/7 ( Suppl. Fig. S4 ), suggesting increased apoptosis in response to Chk1 inhibition by V158411. An increase in small bright nuclei was observed in U2OS cells transfected with CHEK1 siRNA ( Suppl. Fig. S1 ), suggesting that this phenotypic change was due to on-target Chk1 modulation.
Chk1 Inhibition Activates ATR Signaling and DNA Damage, and Inhibits HT29 and U2OS Cell Proliferation
Chk1 inhibition with V158411 induces activation of the ATR/ATM/DNA-PKcs DNA damage signaling pathways, DNA damage, and inhibition of cellular proliferation.30,31 In order to place the apparent target engagement of Chk1 by V158411 measured using CETSA and inhibition of autophosphorylation in context, we utilized Western blotting and single-cell immunofluorescent imaging to determine the ATR-dependent phosphorylation of Chk1 on S317 and S345, and increased γH2AX (pH2AX [S139], a marker of DNA DSBs 32-34 ) by V158411 in the same cell lines. Inhibition of Chk1 for 1 h with V158411 increased the ATR-dependent phosphorylation of Chk1 on S345 with an EC50 value of 130 ± 120 nM and 240 ± 50 nM in HT29 and U2OS cells, respectively ( Fig. 4A,B ). pChk1 (S345) appeared rapidly, with maximal phosphorylation occurring within 60 min of V158411 addition, and was sustained for at least 24 h after V158411 addition ( Fig. 4C ). Single-cell immunofluorescent imaging was used to further determine the effect of Chk1 inhibition by V158411 on Chk1 pS317 or pS345 (both ATR-dependent phosphorylation sites) and γH2AX. The concentration of V158411 required to half maximally increase the number of HT29 or U2OS cells staining positive for pChk1 (S317), pChk1 (S345), or γH2AX was approximately equal for all three markers ( Fig. 4D and Suppl. Fig. S5 ). The EC50 value for pChk1 (S345) induction by V158411 determined by high-content imaging was 5.5-fold and 2.6-fold higher than that determined by Western blotting in HT29 and U2OS cells, respectively ( Fig. 4E ).
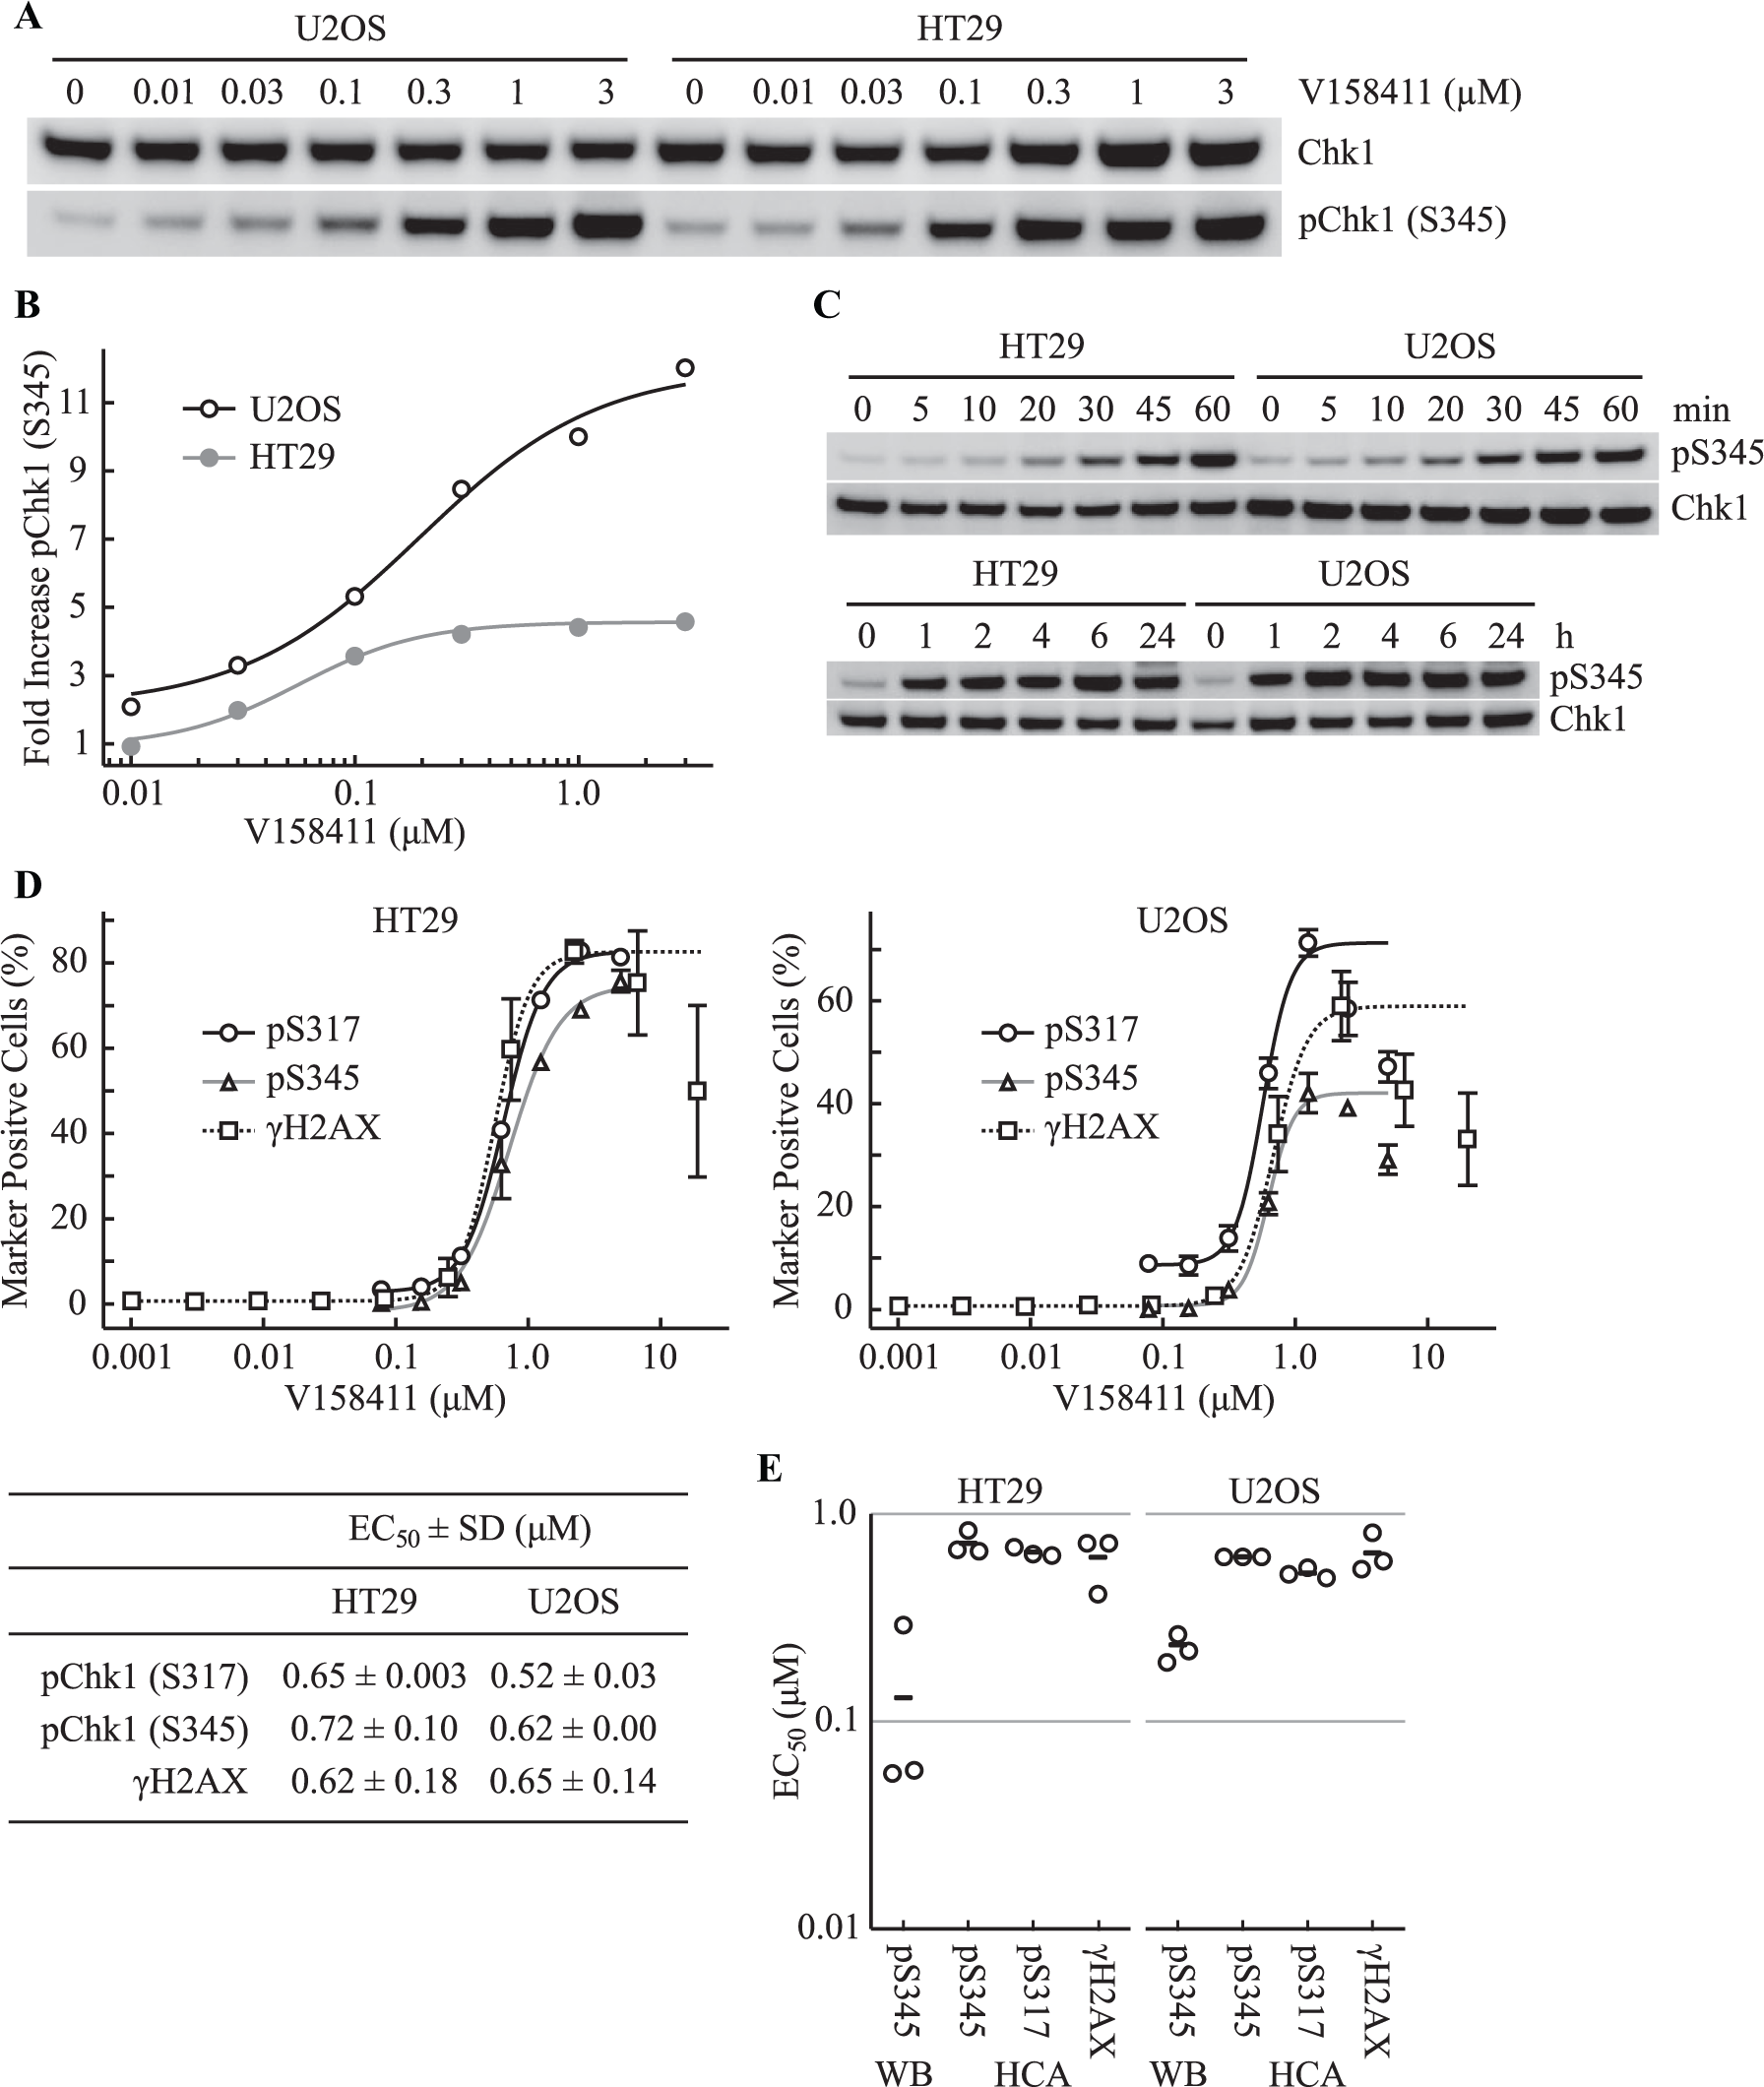
Inhibition of Chk1 by V158411 activates ATR signaling and increases DNA damage. (
To evaluate the effect of V158411 on HT29 and U2OS cell proliferation, we used three different measures of cell proliferation: (1) SRB staining, a marker of total cellular protein per well, and two live cell imaging methodologies, (2) cellular confluency and (3) digital phase contrast, to measure cell number. V158411 inhibited the proliferation of HT29 and U2OS cells ( Fig. 5A,B ) with approximately equal GI50 values measured by the three different methodologies for each cell line. Supplemental Figure S6 provides example live cell images demonstrating the effect of V158411 on cellular confluency and cell number.
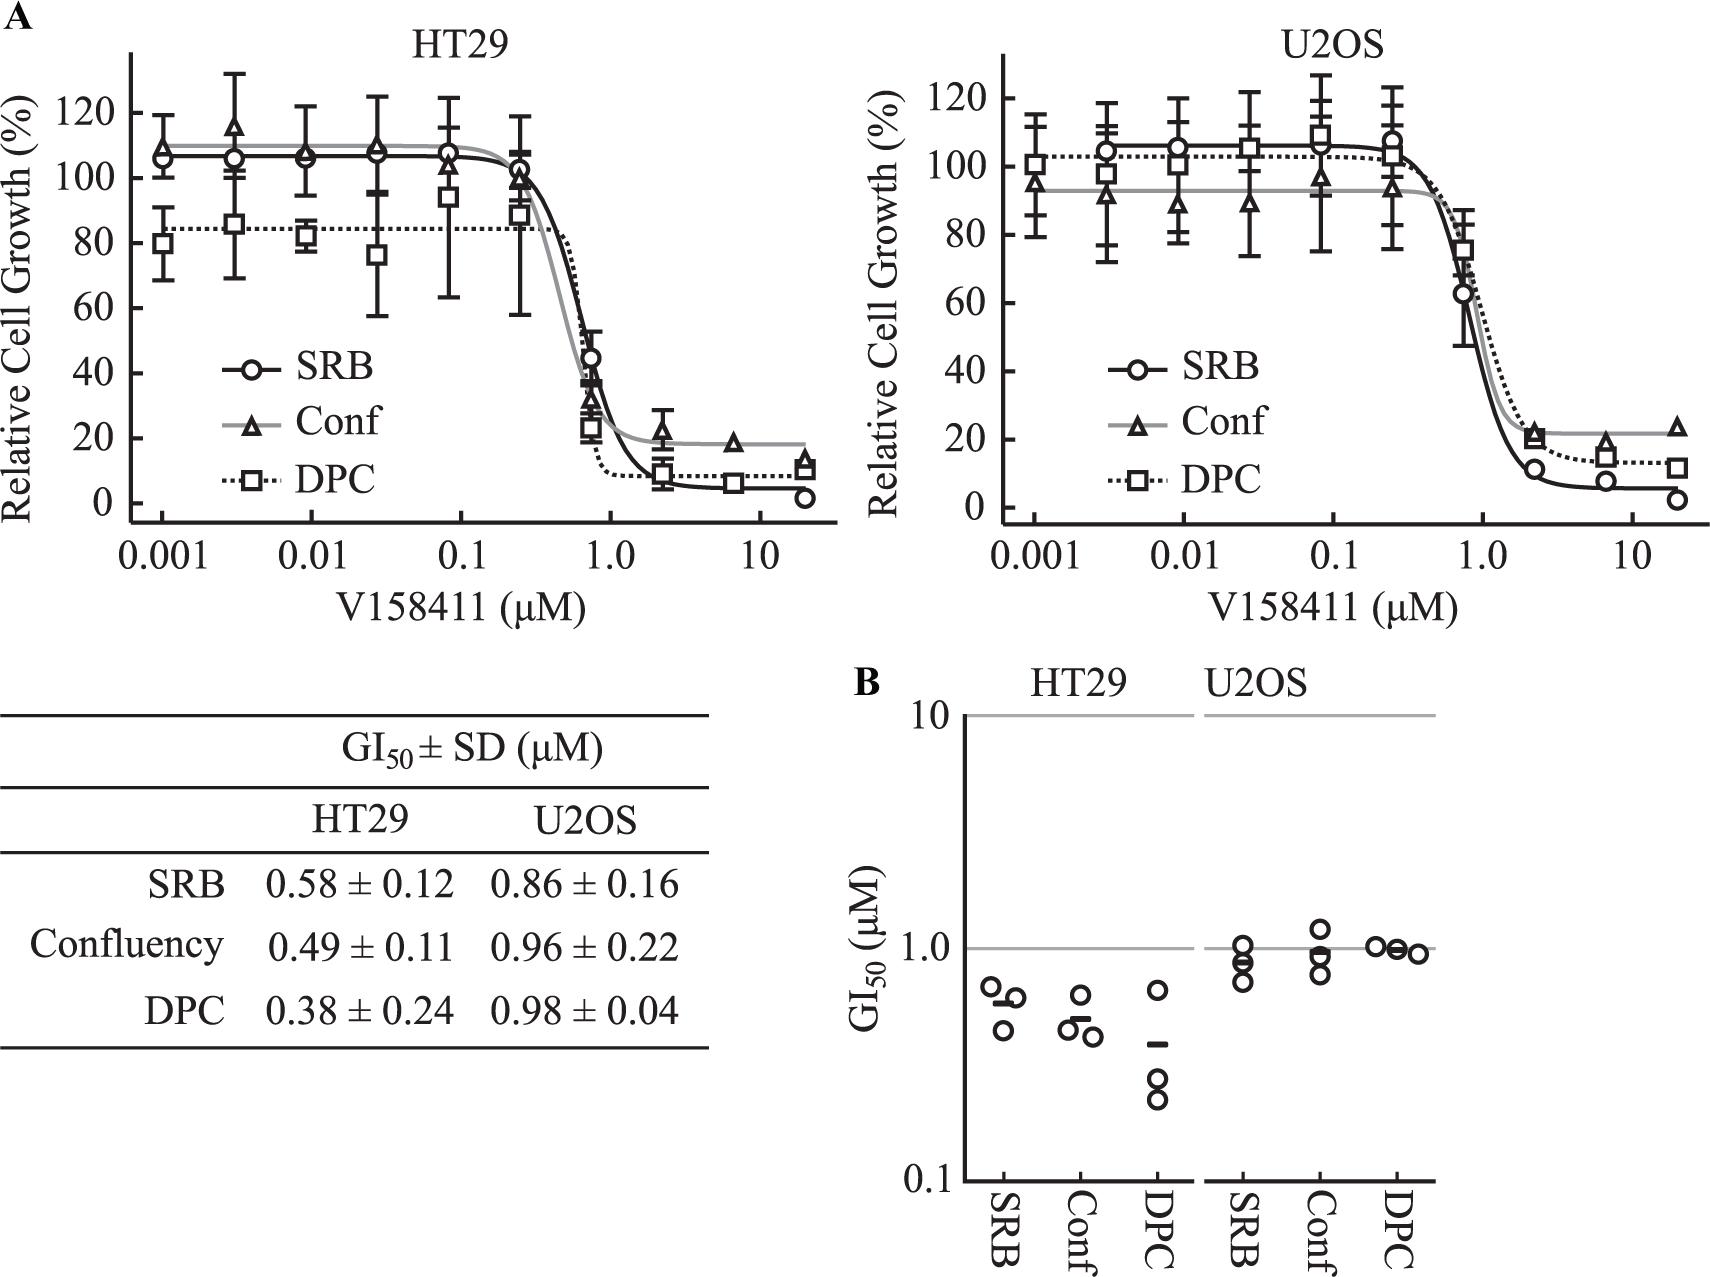
V158411 inhibits HT29 and U2OS cell proliferation. (
Discussion
The measurement of drug–protein interactions in living cells, and ultimately the target tissue, is fundamental to the drug discovery process. Using live cells is critical, as it adds potentially confounding factors, such as membrane permeability, serum binding, and intracellular endogenous ligand concentrations, into the process. The subsequent understanding of how this relates to downstream phenotypic and/or pharmacological effects is important for assigning the cellular changes observed to on-target engagement versus off-target effects. This is especially important in oncology, where a large number of the cellular readouts used (e.g., inhibition of cell proliferation, induction of apoptosis, inhibition of cell migration, and cell cycle arrest) can be induced through inhibition of a myriad of targets.
The usage of CETSA 5 to measure drug–target interaction has increased dramatically since its first description in 2013. CETSA has the potential to work on most targets in a wide variety of cell types, as it requires no protein modification or the generation of tracer molecules, and assays the target protein at the endogenous level. We compared V158411-Chk1 interaction measured by CETSA with that measured using inhibition of Chk1 autophosphorylation and subsequently compared these two target engagement determinations with effects on cellular pharmacology, namely, DNA damage pathway responses, induction of DNA damage, and inhibition of cellular proliferation. V158411 induced ATR activation, increased γH2AX, and inhibited cellular proliferation with approximately equal activity to that observed previously.30,31 No clear correlation between the target engagement assays and downstream pharmacological assays was immediately apparent. The pS296 IC50 and IC90 under low cell densities were generally around half a log lower than the ATR activation EC50, γH2AX induction EC50, and cellular proliferation GI50 ( Fig. 6 ), while the CETSA EC50 and pS296 IC50 (high cell density) were around 10-fold greater.
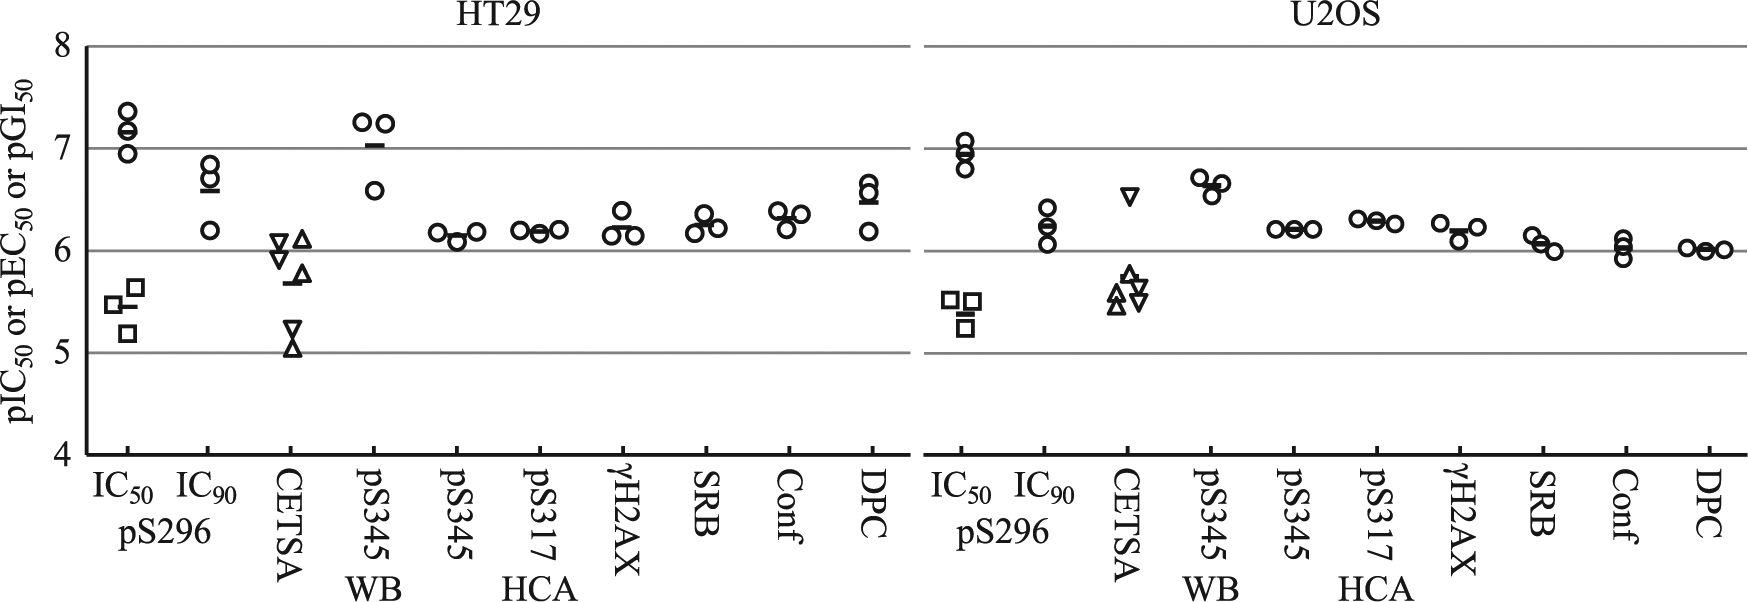
Correlation of Chk1 target engagement with cellular changes. pIC50, pEC50, or pGI50 values were calculated from the IC50, EC50, or GI50 values illustrated in the previous figures and plotted by assay type. WB, Western blot; HCA, high-content analysis; black line, assay mean; square, pS296 pIC50 under CETSA conditions; triangle, CETSA pEC50 at 52 °C; inverted triangle, CETSA pEC50 at 55 °C.
The large difference in pChk1 (S296) IC50 and CETSA EC50 values (43-fold in HT29 cells and 19-fold in U2OS cells) was attributed to the increased cell density (approximately 67-fold more cells per milliliter) in the CETSA assay (1 × 10⁷ cells/mL) compared with the standard Western blotting assay (1.5 × 10⁵ cells/mL) used to determine the pChk1 (S296) IC50. Determination of the pChk1 (S296) IC50 using the CETSA assay conditions resulted in an apparent 54- and 33-fold loss of Chk1 inhibition by V158411. This suggests that target engagement determined under high cell densities could have a dramatic effect on the apparent Chk1 target engagement by V158411. Other differences in the assay formats, such as the matrix in which cells were compound treated and cell attachment status, appeared to have only a minor effect on Chk1 inhibition by V158411.
We observed a much higher interassay variability for the Western blot assays (Chk1 pS296 and pS345, and CETSA) than those conducted in microplates (Chk1 pS317 and pS345, and γH2AX high-content assays, as well as cell proliferation assays). This is most likely a reflection of the greater number of steps needed to generate Western blot data and the semiquantitative nature of this method. Measurement of autophosphorylation requires the samples to be processed for Western blotting, which is labor-intensive, especially in samples derived from whole organism (pharmacodynamic) studies. A recent paper, however, has demonstrated that the pChk1 (S296) assay can be adapted to an ELISA format, including the analysis of in vivo samples. 22 Likewise, under the assay conditions described here, using Western blotting to analyze live cell thermal stability assay samples has the same limitations. Adaptation of the method to a homogenous plate-based methodology (such as AlphaScreen or ELISA, as described in Seashore-Ludlow et al. 35 ) could help reduce the interassay variability, as well as increase assay throughput. More sensitive target detection methods may allow the number of cells in the assay to be reduced, thereby potentially bringing the apparent compound activity in concordance with other assay methods. An alternative methodology to determine ligand-induced changes in protein thermal stability is to utilize quantitative mass spectrometry to quantify changes in protein abundance.10–12 Quantitative mass spectrometry has a distinctive advantage over the other methods described in that a significant proportion of the cellular proteome (in excess of 7000 proteins 12 ) can be analyzed in one experiment. This not only allows an unbiased assessment of on-target drug occupancy but also facilitates the identification of potential off-target drug–protein interactions.
The phenotypic responses of HT29 and U2OS cells to Chk1 inhibition by V158411 were cell line dependent. Proving the relationship between phenotypic changes and direct target engagement is much more difficult. However, some of the changes observed, namely, decreased Chk1 expression in HT29 cells and the increase in small nuclei in U2OS cells, occurred at V158411 concentrations that were similar to those needed to induce changes in the other pharmacology assays. The possibility exists that some of the phenotypic changes observed may be a consequence of cellular changes induced due to increased DNA damage and replication stress following Chk1 inhibition with V158411. For example, the relocalization of Chk1 observed may be a consequence of decreased nuclear integrity in the treated cells arising during cell death and/or the failure of cytokinesis. In response to Chk1 inhibition by V158411, HT29 cells fail to undergo cytokinesis, leading to DNA damage–induced irreversible cell cycle arrest, while U2OS cells undergo a combination of caspase-3/7 dependent apoptosis and irreversible cell cycle arrest. 30 At the concentrations of V158411 required to induce these phenotypic changes, additional off-target kinases may be inhibited by V158411 20 and may account for some of the differences observed in phenotypic response. Further experiments are required to understand these phenotypic changes fully.
In summary, determining drug–protein interactions in living cells and establishing the relationship to downstream pharmacology is a major challenge in the drug discovery process. Using Chk1 as a test system, we found that cellular conditions, especially cell density, had a dramatic effect on V158411-Chk1 target engagement. Under conditions of high cell density, necessitated by the CETSA assay method utilized here, V158411 exhibited low micromolar affinity for Chk1. However, under standard Western blotting conditions at a 67-fold lower cell density, the pS296 IC50 values were 55- and 33-fold lower in HT29 and U2OS cells, respectively. The effects of high cell density on apparent compound target engagement potency should be evaluated when using target engagement assays that necessitate high cell densities (such as the CETSA conditions used in this study). In such cases, the subsequent relation of these data to downstream pharmacological changes should therefore be interpreted with care.
Footnotes
Supplementary material is available online with this article.
Declaration of Conflicting Interests
The authors declared the following potential conflicts of interest with respect to the research, authorship, and/or publication of this article: A.J.M. is an employee and stock option holder of Vernalis.
Funding
The authors disclosed receipt of the following financial support for the research, authorship, and/or publication of this article: This work was funded by Vernalis Research, who agreed to the publication of this manuscript. C.C.G. is a student of the master of oncology of Lyon, France, and was supported by LabEx DEVweCAN, Université de Lyon, F-69000 Lyon, France, while at Vernalis.
References
Supplementary Material
Please find the following supplemental material available below.
For Open Access articles published under a Creative Commons License, all supplemental material carries the same license as the article it is associated with.
For non-Open Access articles published, all supplemental material carries a non-exclusive license, and permission requests for re-use of supplemental material or any part of supplemental material shall be sent directly to the copyright owner as specified in the copyright notice associated with the article.