
Abstract
The ionotropic GABAA receptors represent the main target for different groups of widely used drugs having hypnotic and anxiolytic effects. So far, most approaches used to assess GABA activity involve invasive low -throughput electrophysiological techniques or rely on fluorescent dyes, preventing the ability to conduct noninvasive and thus nonperturbing screens. To address this limitation, we have developed an automated marker-free cell imaging method, based on digital holographic microscopy (DHM). This technology allows the automatically screening of compounds in multiple plates without having to label the cells or use special plates.
This methodological approach was first validated by screening the GABAA receptor expressed in HEK cells using a selection of active compounds in agonist, antagonist, and modulator modes. Then, in a second blind screen of a library of 3041 compounds (mostly composed of natural products), 5 compounds having a specific agonist action on the GABAA receptor were identified. The hits validated from this unbiased screen were the natural products muscimol, neurosteroid alphaxalone, and three compounds belonging to the avermectin family, all known for having an agonistic effect on the GABAA receptor. The results obtained were exempt from false negatives (structurally similar unassigned hits), and false-positive hits were detected and discarded without the need for performing electrophysiological measurements.
The outcome of the screen demonstrates the applicability of our screening by imaging method for the discovery of new chemical structures, particularly regarding chemicals interacting with the ionotropic GABAA receptor and more generally with any ligand-gated ion channels and transporters.
Keywords
Introduction
Chloride homeostasis has a pivotal role in controlling neuronal excitability in the adult brain as well as during neurodevelopment. The intracellular concentration of chloride is regulated by the dynamic equilibrium between passive fluxes resulting from the operations of both plasma membrane chloride channels and local impermeant anions as well as the active fluxes mediated by transporters. Chloride channels are involved in several physiological functions such as cell volume regulation, transmembrane fluid transport, muscular activity, and neuroexcitability (for review see Duran et al. 1 ). Their dysfunction is observed in more than a dozen human pathological conditions, including several that affect the nervous system, such as epilepsy and certain psychiatric diseases (for review see Bowery and Smart 2 ). The development of drugs targeted to these chloride ion channels represents an important field for developing novel pharmaceutical agents and the need for anxiolytics and hypnotics with fewer side effects than the benzodiazepines (for review Kowalczyk and Kulig 3 ). Specifically, a complete understanding of the physiological GABAergic activity requires a full quantification of the dynamic properties of GABA-activated chloride channels.
In general, electrophysiology (patch clamp) remains the most accurate technique for analyzing and quantifying the effectiveness of a drug on ligand-gated ion channels. Thus, this approach has been widely used for studying chloride currents mediated by GABAA. Nevertheless, despite an exceptional fidelity and precision, patch clamp is a priori not suitable for multiple compound screening since this approach is technically demanding, with very low-throughput capacity, labor-intensive, and limited to single-cell assay.
However, the recent development of automated patch clamp systems 4 has substantially improved the throughput (e.g., Patchliner and SyncroPatch 384/768PE [Nanion Technologies GmbH, Munich, Germany]; CytoPatch [Cytocentrics AG, Rostock, Germany]; PatchXpress 7000A, IonWorks Quattro, and IonWorks Barracuda [Molecular Devices, LLC, San Jose, CA, USA]; Dynaflow Resolve [fluicell, Gothenburg, Sweden]; QPatch and Qube [Sophion A/S, Ballerup, Denmark]; IonFlux Mercury HT [Fluxion Bioscience Inc., Alameda, CA, USA]), yet with the requirement to have cells in suspension before the experiments, thus limiting potential maturation of the monitored cells and precluding experiments on primary culture. The invasive aspect of cytoplasm dilution by the content of the pipette is also often neglected. Besides the important contribution of automated patch clamp systems to drug discovery, the unpredictable gigaohm seal and the absence of visual inspection have still limited the screening of large random compound sets.
A widely used approach to monitor the dynamics of intracellular chloride is the use of fluorescent dyes whose signal is related to the intracellular concentration of chloride (for review see Arosio and Ratto 5 ). However, despite the advantage of a wide range of fluorophores allowing for the measurement of multiple targets and high-throughput capabilities, 6 the technique suffers from several methodological drawbacks, including low sensitivity and specificity, limitations inherent to the loading and washing steps of the protocol, pH sensitivity of the dye, and photobleaching and phototoxicity. In addition, the quantitative determination of intracellular chloride concentration changes with nonelectrophysiological methods amenable to screening approaches has been challenging, in particular because the transmembrane ratio of chloride is low (10:1) and the equilibrium potential of chloride is generally close to the resting membrane potential of cells. These two factors result in minute chloride concentration changes, therefore raising issues of sensitivity. 5 Time-lapse experiments using living cells with fluorescent dyes are challenging to implement routinely and imply high running cost due to the price of fluorescent dyes. Furthermore, the image focusing process required prior to image acquisition itself is time-consuming. 7 These disadvantages consequently yield a reduced throughput and a cost per data point that may represent an issue for some screening settings.
The fluorescence lifetime of fluorescence molecules has also been successfully used to accurately measure intracellular chloride concentration changes, 6 while requiring expensive dedicated apparatus. All genetically encoded chloride sensors are also responding to other changes in their surroundings, like pH, 8 which might be a problem knowing that GABAA receptors are also permeable to bicarbonate, which modulates the pH, therefore affecting imaging as well. 5
Due to the above drawbacks, several approaches relying on label-free screening methods have been implemented in drug discovery for a variety of assays, enabling noninvasive and sensitive measurements of many cellular responses, including receptor activation, signaling, ion channel activation, cell growth and proliferation, cell differentiation, and cell migration. 9 These label-free-based biosensors convert the cell stimulus into a cell-induced quantifiable signal through an optical or electrical transducer. For example, the commercial instruments Epic BT (Corning) and BIND (SRU Biosystems) make use of resonance waveguide gratings to generate an evanescent wave to sense whole-cell responses. 10 Other instruments, for example, ECIS (Applied BioPhysics), xCELLigence (Acea Biosciences), and CellKey (Molecular Devices), rely on a low electrolyte impedance interface to detect the impedance of a cell layer under sinusoidal-voltage-generated electric fields. 11 All in all, these label-free technologies are still currently not optimal for their application in image-based screening assays, due to their lack of satisfactory spatial resolution for studies at the single-cell level and their high associated consumable costs. 12
In addition to the above-mentioned microscopy techniques, quantitative phase imaging (QPI) represents a group of label-free microscopy techniques (reviewed in Park et al. 13 ) that enable the provision of quantitative phase images of transparent living cells, allowing visualization of cell structures and dynamics. The QPI we have developed, called quantitative phase digital holographic microscopy (QP-DHM), presents the great advantage, thanks in particular to a numerical autofocus capability, 14 to accurately measure, under extended periods of time (up to a few days), the optical path difference (OPD) (see eq 1). From these accurate OPD measurements, various biophysical parameters have been derived, including absolute cell volume, dry mass, and protein concentration. 15 Furthermore, QP-DHM represents an efficient tool to perform both early detection of cell death12,16 and monitoring of ligand-gated ion channel activity. The osmotic-driven water flux accompanying ionic movements related to the channel activity can indeed be monitored by DHM, as it significantly changes the intracellular refractive index (see eq 1).15,17,18
The suitability of QP-DHM for image-based screening in multiwell cell culture plates 12 and for time-lapse measurement has recently been confirmed. In the present paper, we first validated, in 96-well plates, the capability of QP-DHM to perform agonist/antagonist and modulator screens using a targeted selection of compounds on HEK cells expressing the α1, β2, and γ2s subunits of the GABAA ion-channel receptors. Second, in 384-well plates, we performed a blind agonist screen on a collection of natural products and compounds synthetized in Swiss chemistry groups. All hits were then further characterized with QP-DHM and confirmed with electrophysiology.
Materials and Methods
Library Design
First, a specific “GABA compounds” library was created for our validation assays. We selected all the entries of the 1280 FDA-approved compounds of Prestwick Chemical Library (PCL; Illkirch, France) that had the keyword “GABA” in their annotations (20 compounds). We then added 11 compounds from other suppliers known to have effects on GABA receptors (based on a literature search). Those 31 compounds were then used as seeds to identify other compounds having structural similarities in the 14,000 compounds of the Maybridge HitFinder (MHF) library (Maybridge, UK) and the PCL. Compounds were considered similar to one of the seeds if they exhibited a Tanimoto distance
19
of less than 0.4 when using an extended connectivity fingerprint of diameter 4. This allowed the selection of 13 and 9 additional compounds, respectively. A description of all 53 selected compounds, their therapeutic group, and mechanism of action can be found in
A second blind screen library was composed of 3041 compounds: 2627 from a “Natural products” library with compounds obtained from Analyticon (Germany) and InterBioscreen (Russia) that are purified organic molecules from fractioned extracts of two sources, plants and bacteria. The 414 remaining compounds are diverse and synthesized and kindly provided by various academic laboratories in Switzerland through the ACCESS platform (The Swiss Chemical Collection; https://nccr-chembio.ch/technologies/facilities/the-swiss-chemical-collection/).
Cell Culture
HEK 293 cells stably expressing the α1, β2, and γ2s subunits of the rat GABAA receptors (HEK-GABA) were generously given by Hoffmann-La Roche (Basel, Switzerland). Details on the constructs can be found in a previous publication. 17 After thawing, cells were grown in minimal essential medium (Invitrogen) supplemented with 10% fetal calf serum (Invitrogen) and 20 mM HEPES (Invitrogen) for 2 days, and then the cells were transferred to the same medium, also containing the following selection antibiotics: 0.3 µg/mL puromycin (Clontech, Mountain View, CA), 300 µg/mL hygromycin B (Roche Diagnostics, Mannheim, Germany), and 200 µg/mL G418 (Invitrogen).
For all experiments, medium was replaced by an artificial cerebrospinal fluid (ACSF) containing (in mM) NaSCN, 140; KCl, 3;
For QP-DHM imaging, HEK-GABA cells were plated on 0.1 mg/mL poly-
For electrophysiological recordings, cells were grown on a 20 mm glass coverslip coated with 0.1 mg/mL poly-
Electrophysiology Recording
For all experiments, HEKGABA cells were transferred to an open recording chamber and perfused in an ACSF containing (in mM) NaCl, 140; KCl, 3;
Whole-cell recordings were made at room temperature, and signals were amplified using a Multiclamp 700B amplifier (Axon Instruments, Union City, CA) and digitized by means of an ITC-1600 interface (Instrutech, Great Neck, NY) to a PC computer running Igor Pro (Wavemetrics, Portland, OR). All currents (sampling interval, 5 kHz) were low-pass-filtered (2 kHz). They were recorded with pipettes containing (in mM) potassium-gluconate, 95; KCl, 40 (equal to intracellular HEK cell concentration 20 ); HEPES, 10; and MgCl2, 2 (pH 7.3; 280–290 mOsm). Gluconate is an impermeant anion used place of proteins to prevent dilution of the intracellular content. The pipettes were pulled with a DMZ universal puller.
GABA and all compounds were dissolved in ACSF and applied by bath perfusion during 30 s at concentrations ranging from 1 nM to 100 µM. A delay of at least 10 min was observed between successive applications.
The effect of each compound concentration was obtained by measuring the maximum current for each recorded current curve (see
DHM Image Acquisition
For each experiment, four images per well were acquired and the corresponding measurements were averaged to yield a mean value per well. DHM quantitative images were acquired at room temperature (~22 °C) on a commercially available DHM T-1001 from LynceeTec SA (Lausanne, Switzerland) equipped with a motorized xy stage (Märzhäuser Wetzlar GmbH & Co. KG, Wetzlar, Germany, catalog number S429). Images were recorded using a Leica 10×/0.22 NA objective (Leica Microsystems GmbH, Wetzlar, Germany, catalog number 11506263). The typical acquisition time is less than 0.5 ms per image and the total scan time (with four images per well) is 3 min 40 s for 96-well plates, and 8 min for 384-well plates (when the two outer wells are not imaged), both resulting in a single-row scan time of about 30 s. Images are automatically numerically refocused to the best focus after the acquisition. 12
Label-Free QP-DHM Technology
Briefly, QP-DHM21–23 is a label-free interferometric microscopy technique that provides a quantitative measurement of the optical path length (OPL; related to the optical density of the cell). It is a two-step process where a hologram consisting of a 2D interference pattern is first recorded on a digital camera and the contrast (phase) images are reconstructed numerically using a specific algorithm. 24 The contrast in the QP-DHM phase images is quantitatively related to the OPD, expressed in terms of physical properties as
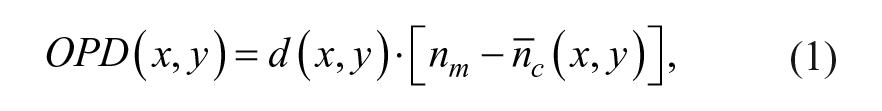
where d(x,y) is the cell thickness,
As described in Jourdain et al.,
17
when Cl− is replaced by SCN− in bath solution, the Cl− gradient is reversed with a Cl− intracellular concentration (around 40 mM in HEK cells; see Gillen and Forbush
20
) higher than the extracellular one (13 mM). Thus, activation of the GABAA receptor by a specific ligand will produce an efflux of Cl−, together with an exit of molecules of water (for osmotic reasons), leading to both a cell shrinkage and an increase of the intracellular refractive index.
17
As OPD is highly sensitive to intracellular refractive index changes,
15
the net signal will be a significant OPD increase (
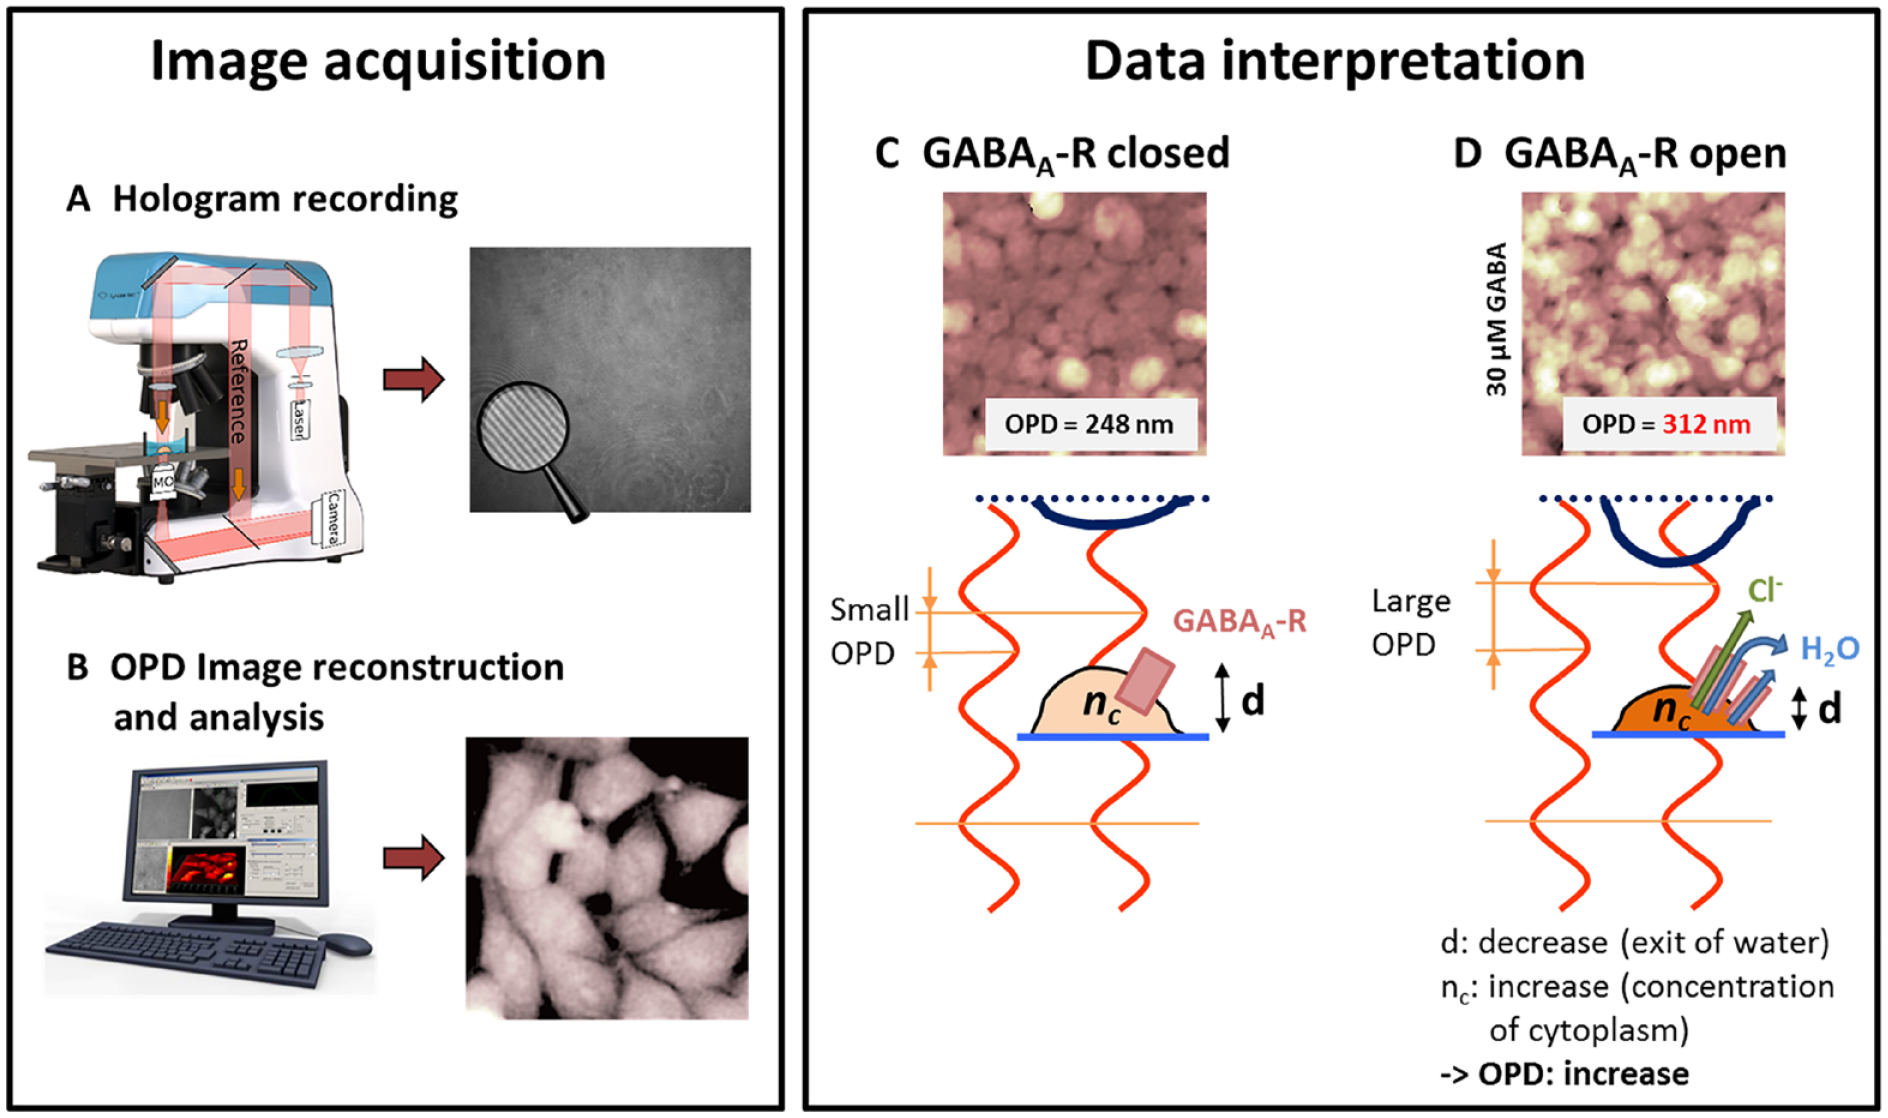
DHM workflow and OPD signal interpretation when HEK-GABA cells are stimulated by GABA. Image acquisition: Holograms are (
Data Analysis
Confluency was measured by first thresholding the images with a fixed predetermined value to obtain a mask and then by measuring the surface ratio of the mask to the total area of the field of view. The total OPD value is obtained by adding the OPD value recorded in each of the (x,y) masked pixels of the image. Finally, the average OPD is obtained by dividing the total OPD by the surface of the mask and is a measure of the optical density of the cells within the field of view independently of the confluency. This value is dependent on the cell shape (rounded cells have a higher optical density than flat cells). The average OPD is an unbiased parameter that can be used to categorize cell phenotypes 12 or quantify the activity of ion channels.17,18
Dose–response curves were fitted using Prism7 (GraphPad Software, La Jolla, CA) with the following equation:
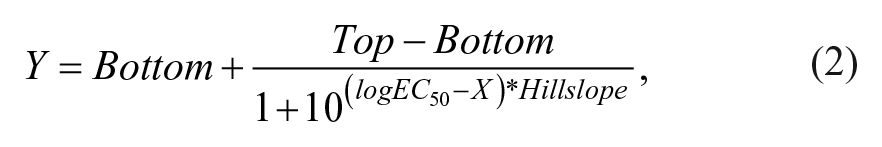
where X is the log concentration of compounds, Y is the measured average OPD response, Top and Bottom are the plateaus of the average OPD response, Hillslope is the slope factor or Hill slope, and logEC50 is the fitted logarithm of the half-maximal effective concentration. For the QP-DHM and electrophysiology agonist EC50 ranking experiments, the Hill slope was set at 2 (which corresponds to the two binding sites of GABA) for all the fittings. For the antagonist experiments, the Hill slope was not fixed, and for the modulator experiments the Hill slope was not fitted (fixed at 1).
All data are represented as means ± standard error of the mean (SEM).
Three separated types of screen were conducted in duplicate using the GABA library: agonist, antagonist, and modulator.
Before running the screens, the GABA EC30 (EC30GABA) and EC70 (EC70GABA) values were measured in four separate experiments where a serial dilution (3 points per log) of GABA was applied for 8 min; values were calculated using the following equation:
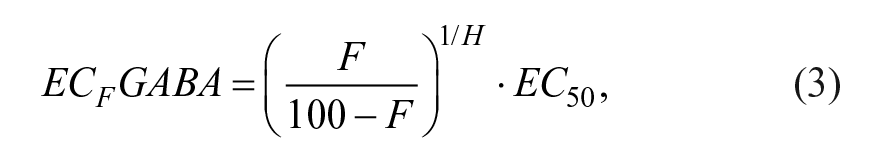
where F is the fraction (in percent, 30 or 70 in our case) and H is the fitted Hill slope.
The agonist screen aims to identify direct agonists of the GABAA receptor where compounds are added directly to the cells. The antagonist screen aims to identify direct antagonists of the GABAA receptor. Compounds are added together with GABA at its EC70 concentration (EC70GABA) and the inhibition of the response is measured. The modulator screen aims to identify modulators of the GABAA receptor. Compounds are added together with GABA at its EC30 concentration (EC30GABA) and the potentiation of the response is measured. The second blind screen was done in an agonist search mode.
Data from the screens were imported in a custom-made laboratory information management system (LIMS). To compare the relative effect of each compound, raw values were first normalized for each plate against the corresponding controls, bringing the negative control value to 0 and the positive control value to 1. Hits were defined as values 3 standard deviations (SD) above the negative controls (0 µM GABA), 3 SD above the measured EC30GABA value (0.4 µM GABA), or 3 SD below the measured EC70GABA value (1.2 µM GABA) for the agonist and blind screens, modulator, and antagonist screens, respectively. Normalized values of the hits were then averaged between duplicates to produce a final score for the screened compounds.
Results
Assay Development
The QP-DHM technique has been previously validated for GABA activity monitoring
17
using a peristaltic pump to deliver a pulse of GABA on single coverslips containing HEK-GABA cells. However, to adapt the technique to high-throughput screening or high-content screening, modifications must be conducted to accommodate imaging using microtiter plates. With our current system, culture medium is replaced by the assay medium containing GABA and/or other compounds using a robotic liquid handling dispenser. When four images are acquired by well, the whole 96-well plate can be imaged in less than 4 min. Time-lapse acquisition of serial dilution of GABA (
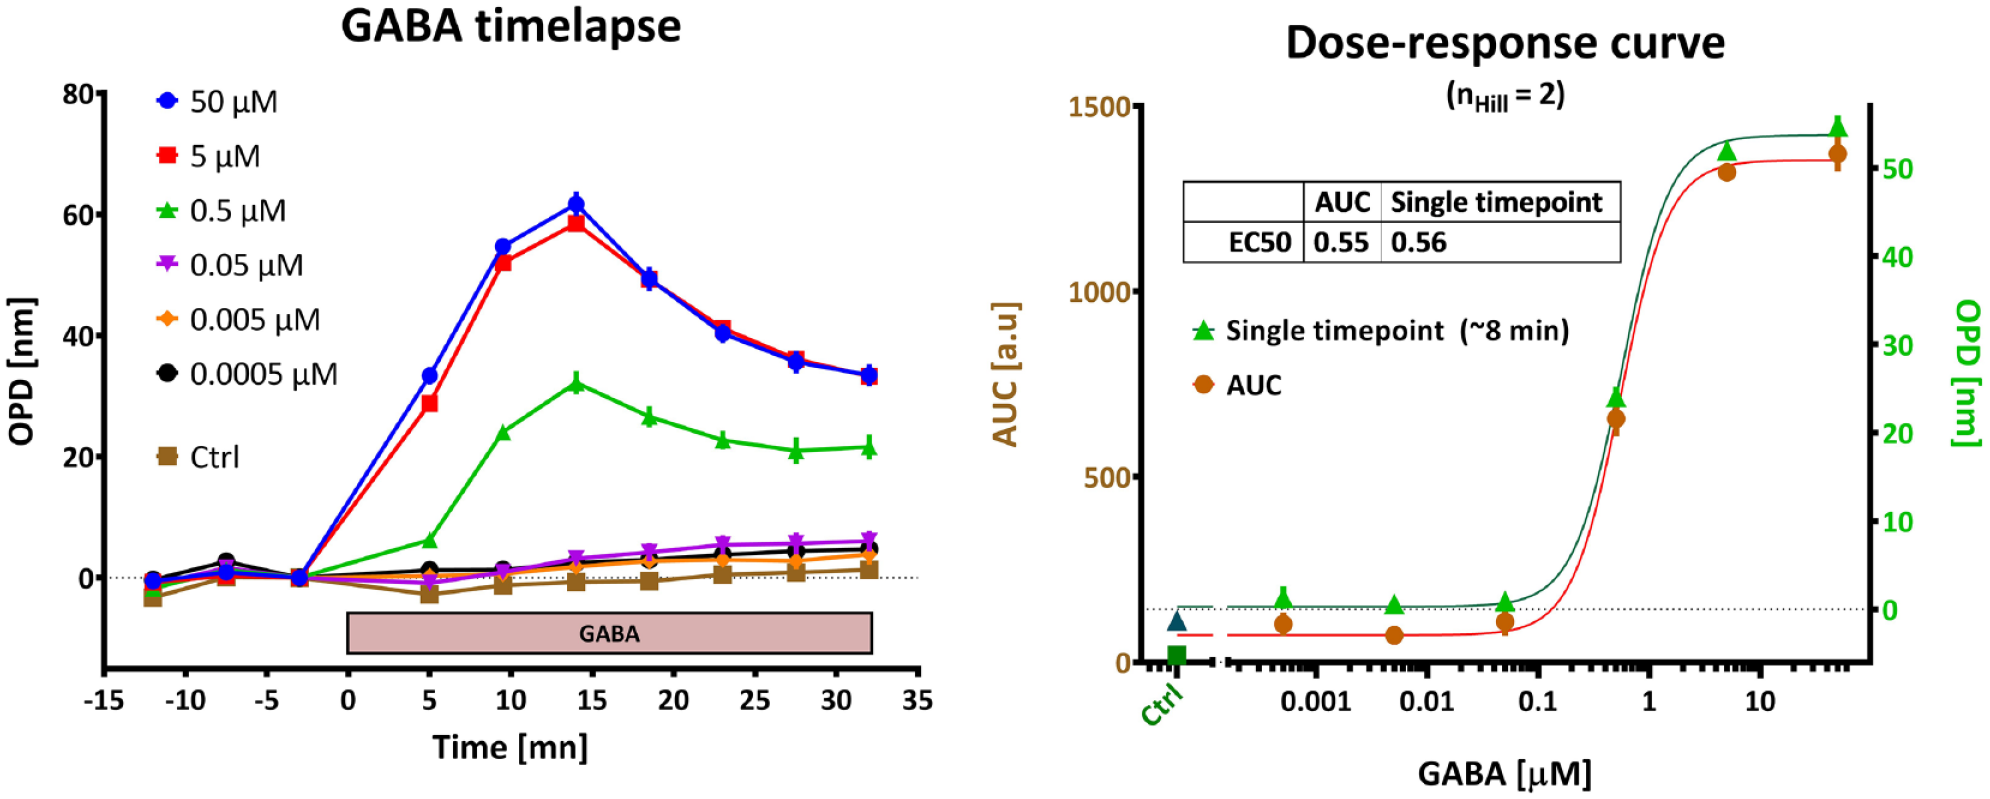
Assay development. Left: Dynamics of the GABA signal recorded in a 96-well plate. We observe a prolonged effect with a peak at 8–14 min after the start of stimulation. Right: Quantification. The whole dynamics was integrated by measuring the area under the curve (AUC) and compared with a single time-point measurement (at 8 min); both approaches yield the same EC50 value.
Plating density and culture duration were optimized to yield the best assay conditions, quantified by the Z′ factor, 26 a direct measure of the quality of an assay, where a value close to 1 indicates an excellent screening window, whereas a value below 0.5 reflects a marginal assay. Our culture conditions (see Materials and Methods) yielded reproducible Z′ factors in the 0.6–0.8 range for 96-WP and around 0.5–0.7 for 384-WP.
Validation Screens
Hits obtained for the agonist, antagonist, and modulator screens are given in
The eight compounds that were hits for the agonist screen were retested in serial dilution using QP-DHM imaging and validated with electrophysiological recording (
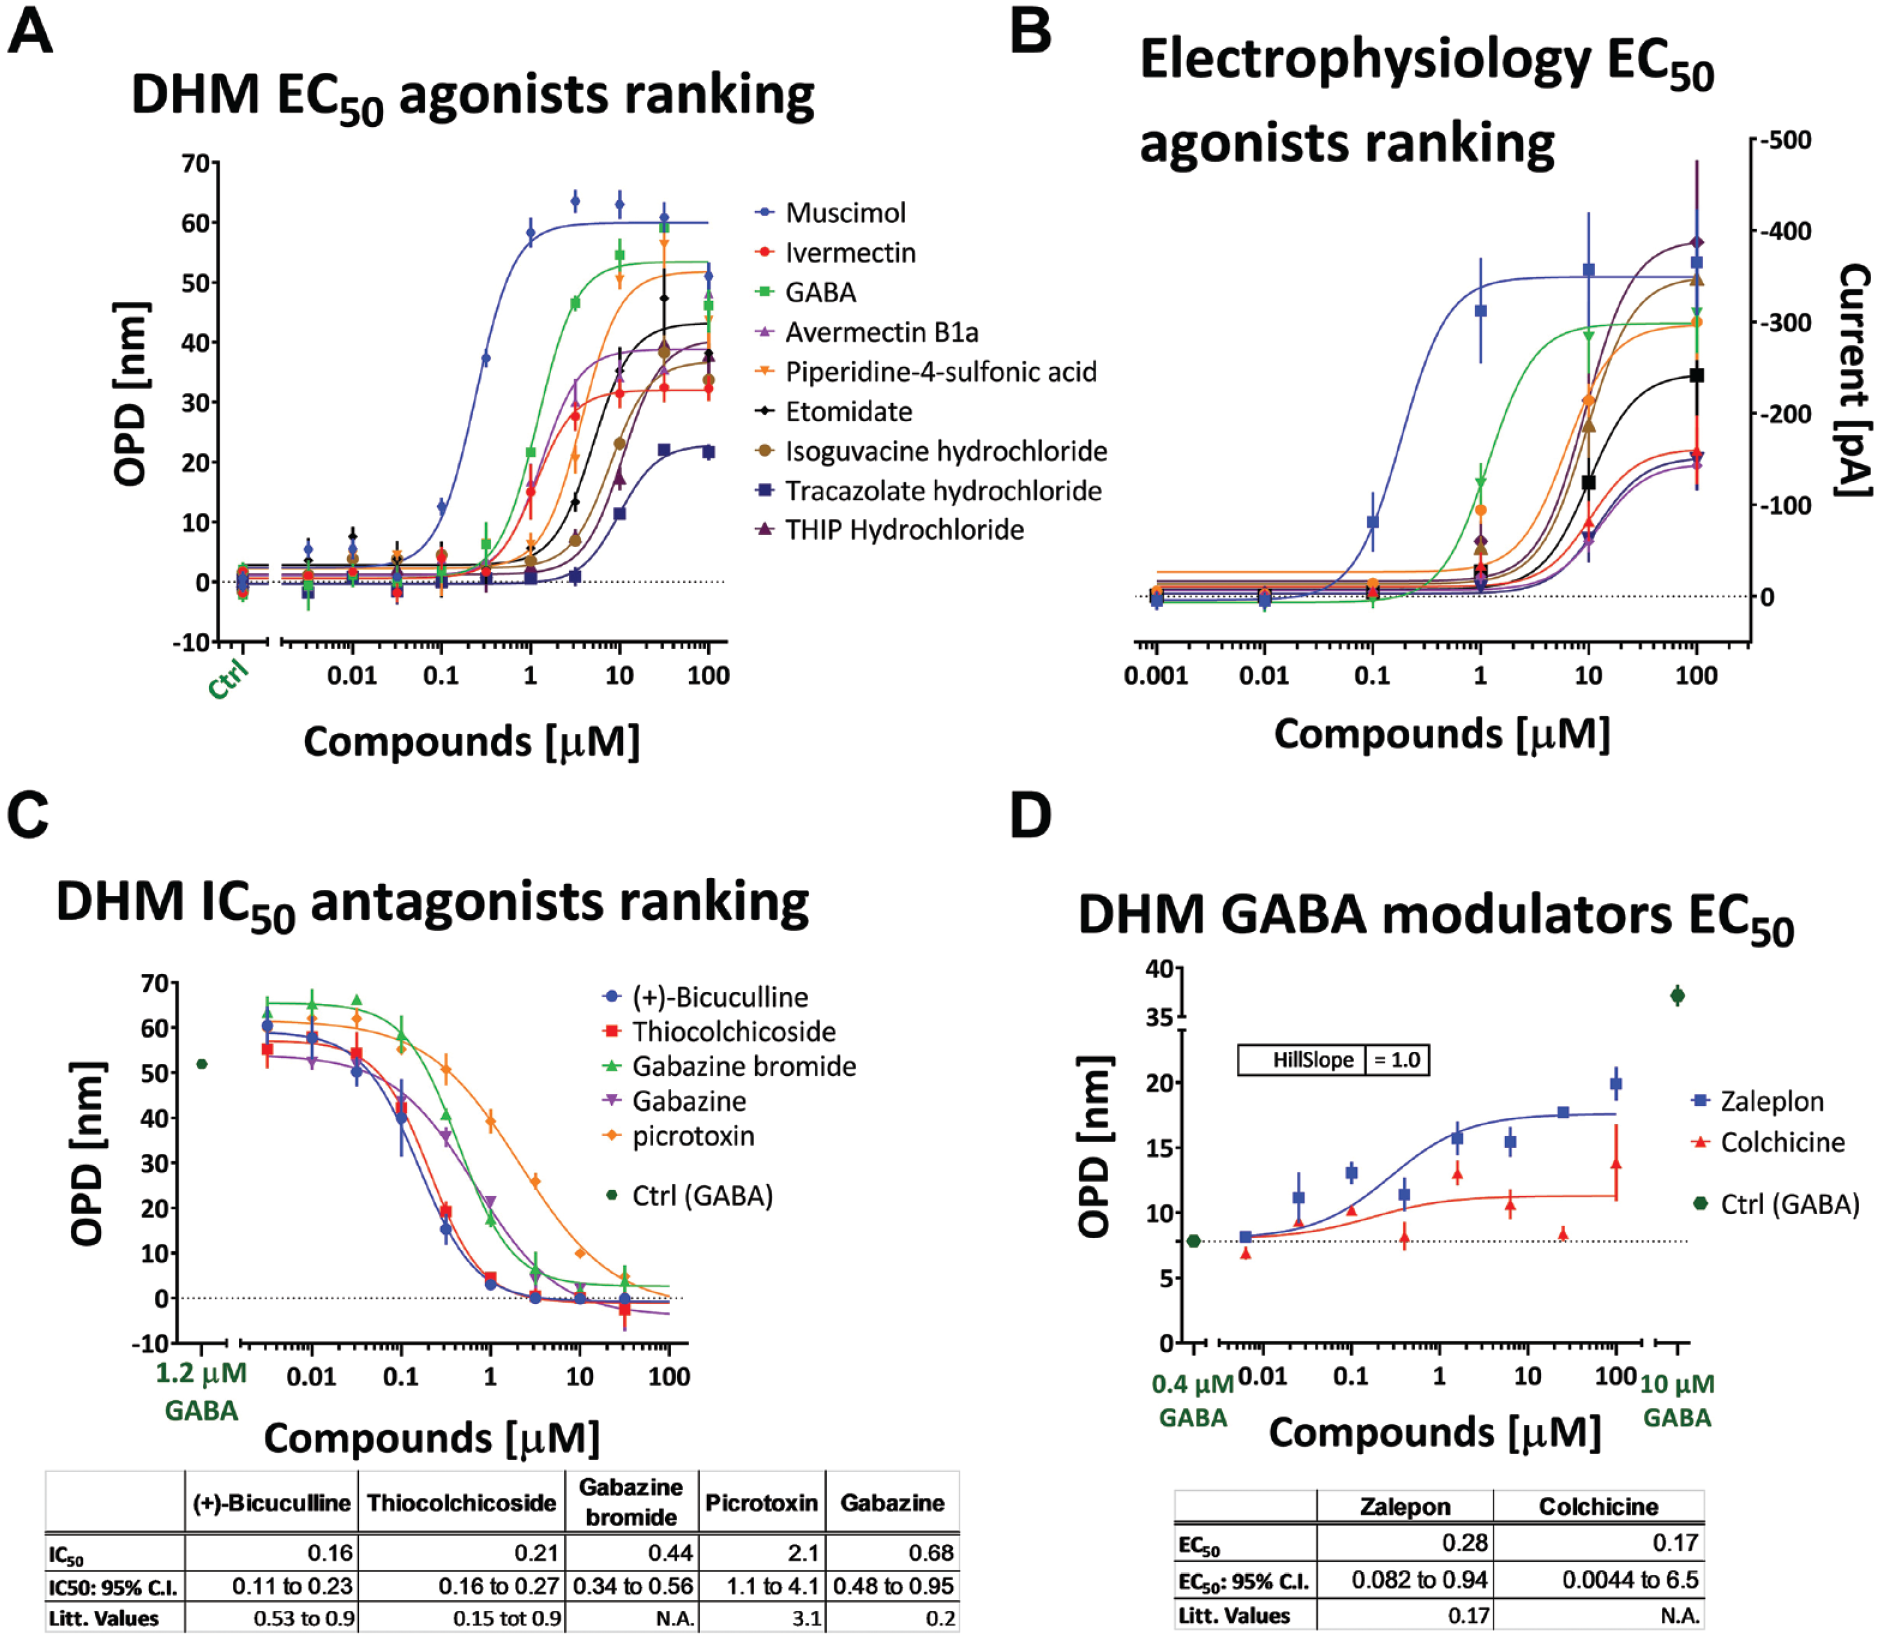
Hits analysis and validation. (
All compounds were confirmed as hits and results from the QP-DHM agonist screen were in good agreement with the results obtained with electrophysiology (
The five compounds that were hits for the antagonist screen were retested in serial dilution (
The antagonist hits were confirmed, and all produced a nearly complete inhibition of the effect of GABA at its EC70 concentration (1.2 μM;
From the nine modulator hits, only two showed a score higher than 0.5 (zalepon and colchicine); those were also the only two that we confirmed (i.e., that could be fitted with a sigmoid curve) when retested in serial dilutions. The maximum concentration of zaleplon and colchicine increased the effect of GABA to 41% or 21% of the maximum (GABA at 10 µM), respectively (
Zaleplon has also previously been reported as a modulator with an EC50 of 0.17 μM with α1β2γ2 expressed in Xenopus oocytes. 33 However, the obtained effect of colchicine is in apparent disagreement with what has been reported in the literature, for which colchicine significantly inhibits GABA currents recorded from L(tk−) cells stably transfected with human α1β2γ2L GABAA receptor subunits. 34 Colchicine was included based on its structure homology with thiocolchicoside, which exhibited an antagonist effect in the EC70 antago-screen, an effect also described in the literature: thiocolchicoside-inhibited GABA-evoked Cl− currents with similar potencies (median inhibitory concentrations of 0.2 μM for α1β2γ2L receptors) and in a competitive manner were reported. 35 Colchicine inhibits GABAA receptors independently of microtubule depolymerization. 36
This discrepancy could be explained by a dual effect of colchicine, increasing the OPD on one side by acting on the cytoskeleton, and having an antagonist effect on the other side. 37 This is confirmed by the fact that a significant delay in OPD increase is observed when colchicine is applied for more than 15 min, demonstrating that the effect of this compound on microtubule dynamics has a retarded influence on OPD signal increase compared with its effect on GABA signal transduction. We thus concluded that the observed effect of colchicine is mainly due to an increased OPD signal induced by microtubule depolymerization. This highlights the need to carefully design experimental conditions and controls to specifically observe the monitored process.
Blind Screen
On the 3041 compounds tested for agonist effect, 15 hits (defined as 3 SD above the negative controls) were obtained, corresponding to a hit rate of 0.49% (
Each compound, as well as GABA, was further retested, in serial dilution (nine dilutions from 100 µM to 0.01 µM in triplicate). To validate the specificity of the GABA response, each compound was added at its calculated EC70 value (concentration that produces 70% of the maximal response, estimated using the GraphPad Prism Find ECanything function) alone or with either 100 µM picrotoxin (a noncompetitive channel blocker for GABAA receptor) or 100 µM bicuculline (a competitive antagonist of GABAA receptor). Compounds that have a very steep Hill slope were also tested at 3× their EC70 value. All tests were performed using both wild-type HEK cells (HEK-WT 38 ) and HEK cells expressing the GABA-R used in this study (α1, β2, and γ2s subunits, HEK-GABA). Wild-type HEK cells show no electrophysiological response to GABA when tested with patch clamp 17 and thus serve as an additional control for the specificity of the response. Tests done on HEK-WT used standard culture medium, whereas tests with HEK-GABA used artificial ACSF medium.
Among the 15 original hits, 6 were found to be active and specific for the GABAA receptor (muscimol, avermectin B1A, 17α-hydroxypregnanolone, alphaxalone, emamectin B1A, and eprinomectin B1A), 7 were found to be nonspecific (indicated by the beige rectangle in
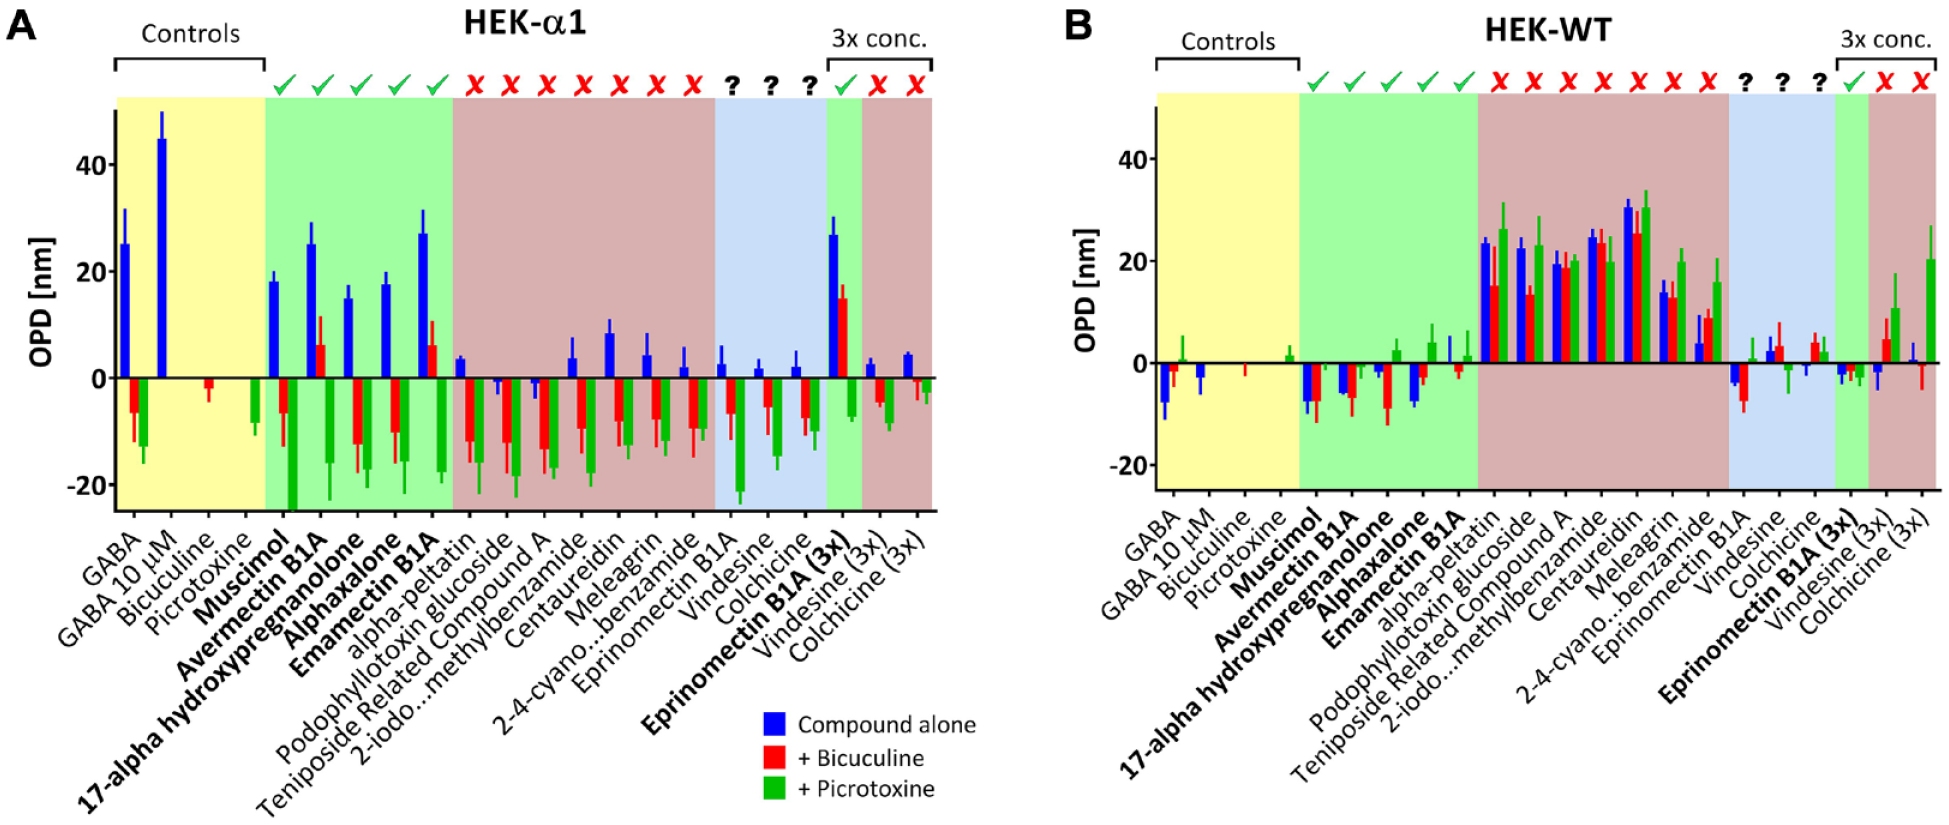
Hits validation. (
Table 1
describes the six retained specific and validated hits from the primary screen. Muscimol, which was present in the collection screened, was detected as an agonist delivering pharmacological parameters as reported and was also obtained in our pilot screen in the agonist mode. Besides this well-known agonist detected without prior knowledge of the content of the chemical collection, the other compounds belong to two distinct chemical families (neurosteroid and avermectin-like) based on their structure. Alphaxalone is a neurosteroid previously reported as a potentiator and agonist at high concentration.
39
The compound STOCK1N-56888 detected in the primary screening has been discarded due to quality control issues. This compound, which was annotated by the supplier to be 17α-hydroxypregnanolone, did not pass our quality control check by liquid chromatography–mass spectrometry (LC-MS) for peak purity and mass assignment (data not shown). Since the mass obtained for this compound was the same as that for alphaxalone, the two compounds were co-injected and analyzed by LC. Two distinct well-resolved peaks were obtained demonstrating that the compound STOCK1N-56888 cannot be alphaxalone. Further NMR analyses confirmed that the supplied compound was not the expected one. However, even if a neurosteroid backbone is suggested by our data, an unambiguous structural assignment was not possible; therefore, this compound was not retained as a validated hit. Moreover, the structure corresponding to 17α-hydroxypregnanolone is not following the structure–activity relationship (SAR) rules for GABAA active neurosteroids,
40
suggesting that the compound delivered as 17α-hydroxypregnanolone could be another active neurosteroid or a mixture (
List of Preliminary Validated Hits.
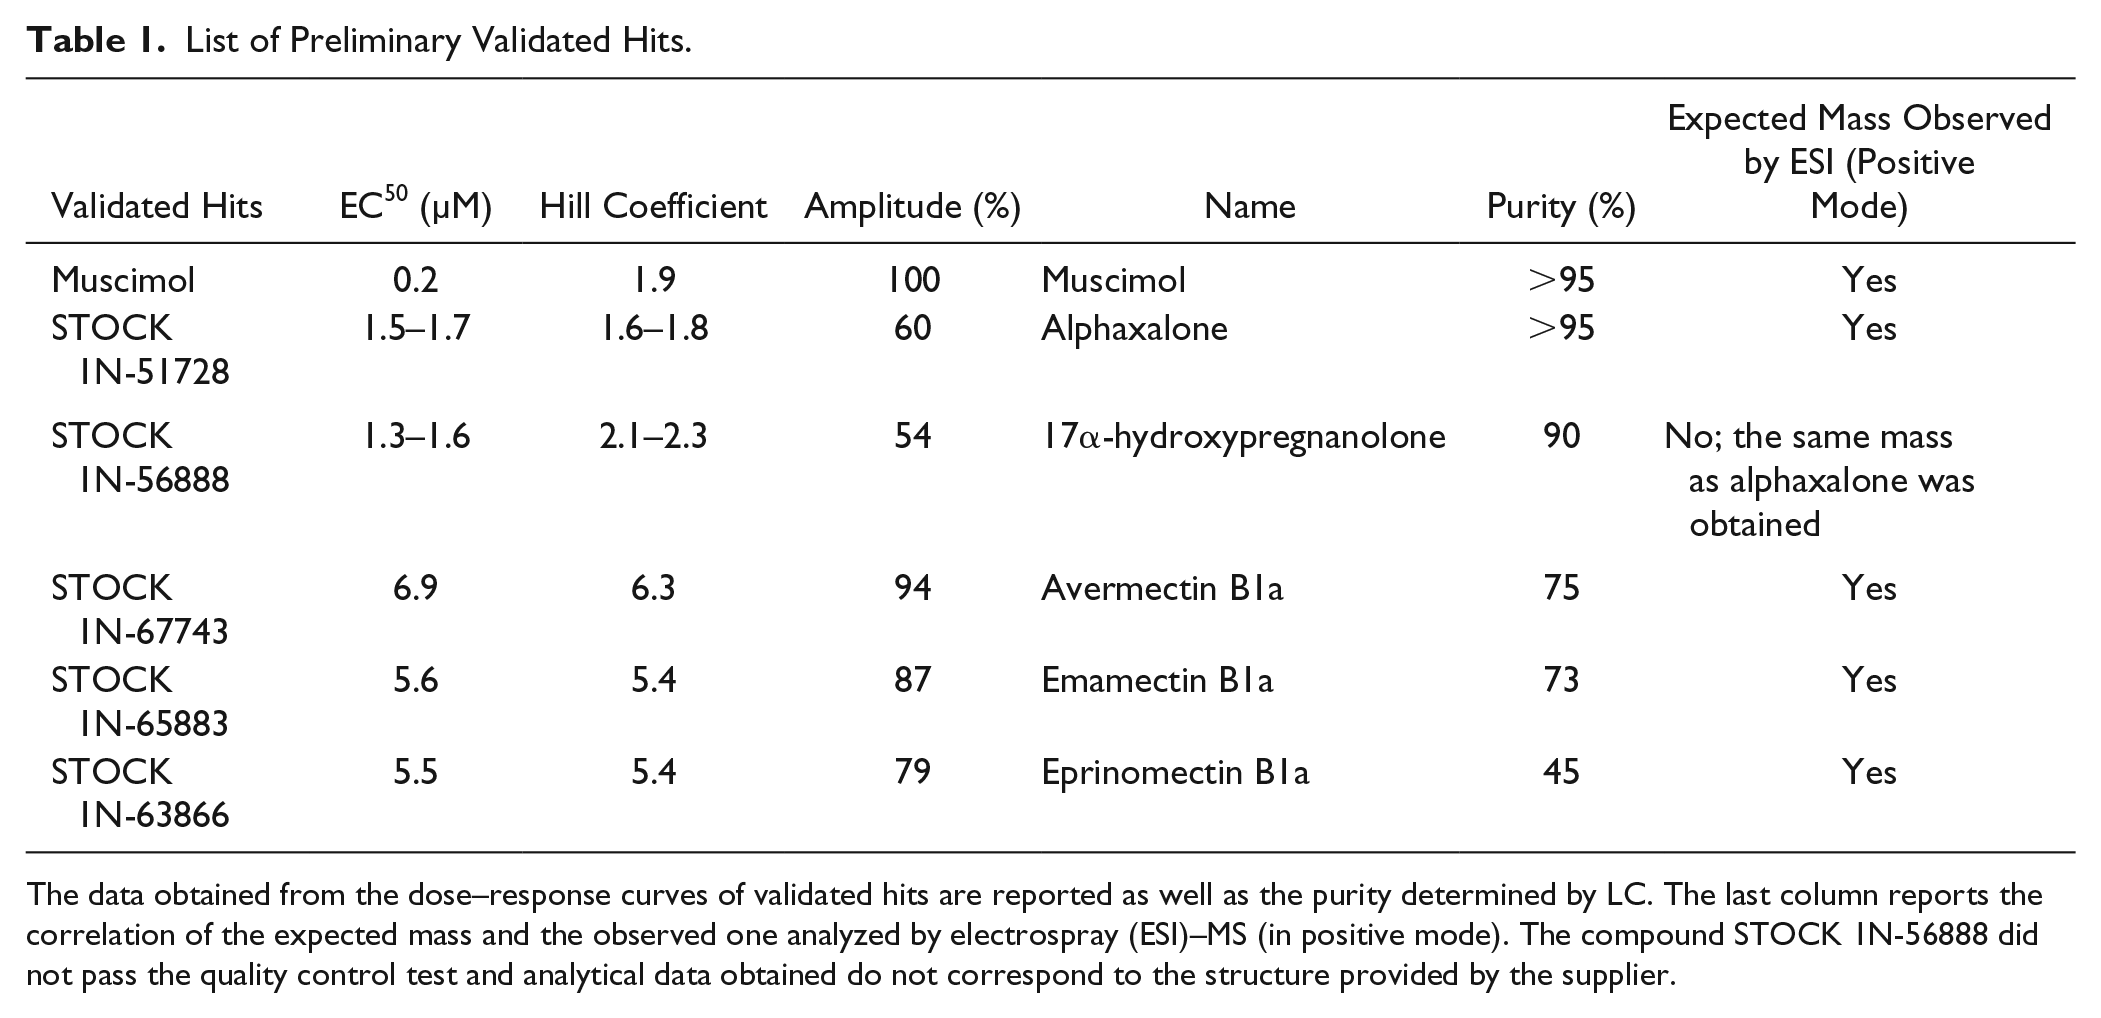
The data obtained from the dose–response curves of validated hits are reported as well as the purity determined by LC. The last column reports the correlation of the expected mass and the observed one analyzed by electrospray (ESI)–MS (in positive mode). The compound STOCK 1N-56888 did not pass the quality control test and analytical data obtained do not correspond to the structure provided by the supplier.
The natural products collection used for the screen was in silico screened for structures bearing steroids following the SAR rules for GABAA activity. No other molecules were detected, confirming that our screen was free from false negatives regarding the neurosteroid compounds. One molecule present in our collection and negative in our assay was alphaxalone acetylated at the 3α OH on the A steroid ring. This is consistent with the neurosteroid SAR rules, 40 where a hydrogen bond-donating group is necessary for triggering GABAA activity.
The structures of the three other compounds belonging to the family of avermectins are illustrated in Table 2 . Avermectins are antiparasitic agents, 16-membered macrocyclic lactones with a disaccharide substituent at the carbon-13 position. Avermectin B1a has been reported as a partial agonist at the high-affinity state and also binding other sites of the GABAA receptor. 28 Avermectin B1a, emamectin B1a, and eprinomectin B1a, possessing a high structural similarity, delivered very similar parameters from the dose–response curves, namely, EC50 and Hill coefficients. Our measured Hill coefficient of 5–6 suggests multiple molecules binding per pentameric receptor, in agreement with a recent report suggesting that ivermectin, also a member of the avermectin family, binds to the GABAA receptor in a common orientation at each of the five interfaces. 41
Structures and Pharmacological Data of GABAA Active Compounds from the Natural Products Screen Belonging to the Avermectin Family.
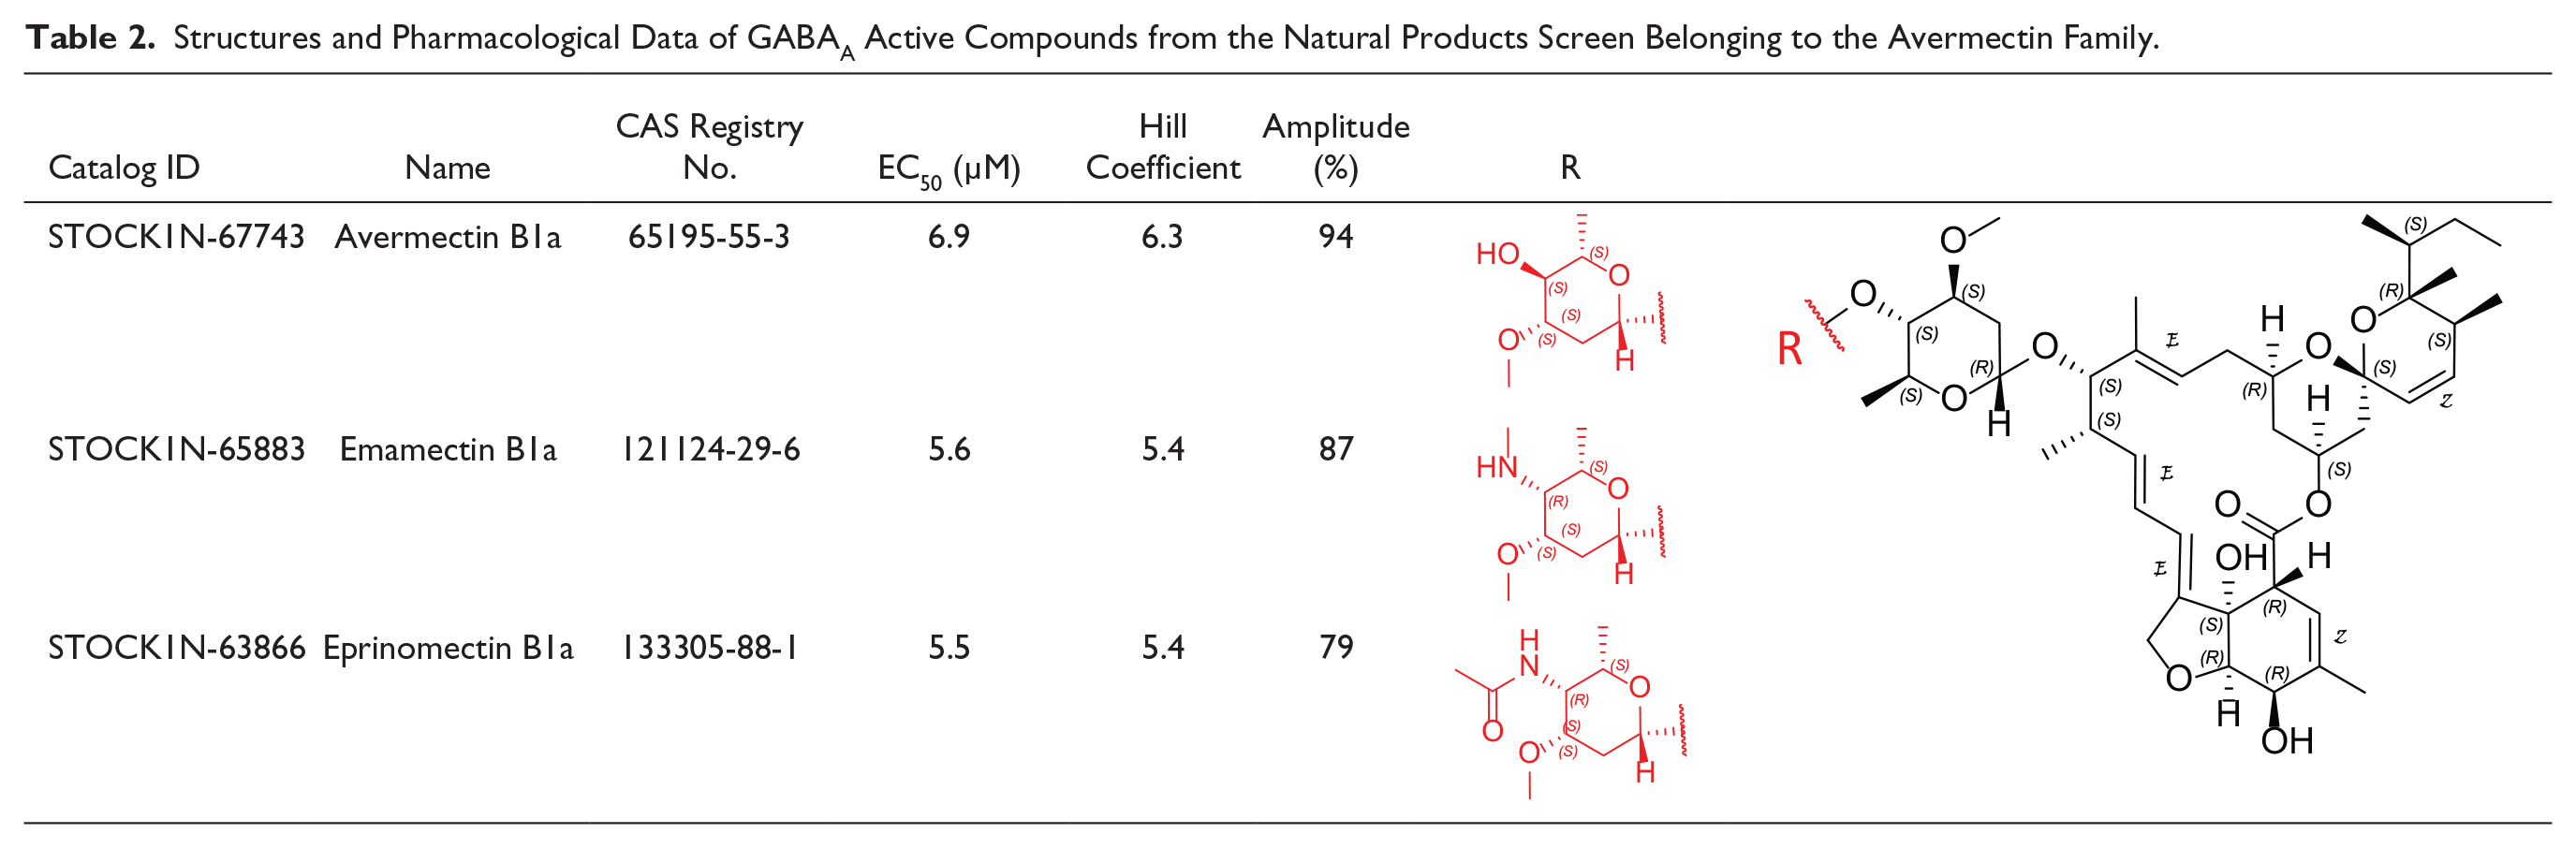
It is important to emphasize that no other avermectin-like structures were present in the collection of natural products screened (no false negatives), confirming and validating that our screen by the QP-DHM imaging method is robust and accurate for the assignment of GABAA-activating molecules.
Discussion
In this paper we presented a GABAA receptor screen using a marker-free motorized QP-DHM. The activity of the receptor is quantified thanks to the ion-associated water fluxes’ impact on the refractive index. The specificity of the signal is validated by the inhibition of the measured effect by antagonists and the absence of effect of the reported compounds in wild-type cells not expressing the GABAA receptor. Furthermore, we also confirmed that QP-DHM was not limited to the system model tested in this report by also ranking the potency of five known agonists using HEK cells expressing the α5β3γ2 receptor subtype and comparing the results with electrophysiological recordings (
QP-DHM is intrinsically multisite in its recording, as each of the pixels in the image provide a quantitative measurement of the activity of the monitored receptors. A high sensitivity can therefore be obtained by averaging the measurements over all the cells present in the field of view, as demonstrated in this paper, or individual cells can be measured and tracked over time-lapse acquisitions in parallel recordings12,18,42 or used to distinguish different phenotypes. 43 Like with fluorescent-based high-content screening images, QP-DHM images could even be used in repurposing assays, to go deeper into the analysis of alternative pathways or targets. 44 QP-DHM images also offer a direct visual quality control of the experiments (visualizing the images allows the eventual discrimination of wells with contamination, growth problems, or any other issues that might affect the measurement). In contrast to QP-DHM, other label-free techniques should rely on additional quality control steps to assess the integrity of the cell culture.
Compared with electrophysiology, which measures net currents through the membrane related to the fluxes of ions, the phase signal recorded by QP-DHM is proportional to the temporal integration of these ion fluxes.
17
The dynamics measured with the two approaches is thus different, in the second timescale for electrophysiology and in the minute timescale for QP-DHM. Some small differences observed between the two techniques, notably when receptor desensitization occurred (like with ivermectin), can also be explained by the fact that compounds were only applied for 30 s and then washed out with electrophysiology (bath application in open perfusion chamber) or applied continuously (inside well plate without perfusion) for QP-DHM. However, this less rapid timescale offers a larger time frame for imaging and provides more versatility for recording the cell response. In addition, the overall time needed to perform the experiments was much smaller. For instance, the data presented in
Figure 3A
were obtained and analyzed automatically in a 1 h experiment with QP-DHM (from the scan of a 96-well plate in duplicate), while 3 days of multiple-cell patching for electrophysiology from an experienced user was required (
The method presented here has been validated first with a set of selected compounds and compared with electrophysiological measurements. The results obtained from the larger blind screen constituted an additional confirmation of the robustness and applicability of the approach in a high-throughput context where identified specific GABAA agonists were validated without the need for further electrophysiology-based experiments. The false-positive compounds (compounds that were hits in the screen but later discarded as also being active in the validation test on wild-type HEK cells) were α-peltatin, podophyllotoxin glucoside, teniposide-related compound A, centaureidin, meleagrin, vindesine, and colchicine, as well as two compounds from the Swiss Chemical Collection, provided by the same academic lab, and both derivatives of benzamide backbones. Among these nine compounds, seven are known to target directly or indirectly the dynamics of microtubules, mainly through inhibition of tubulin polymerization (the other two being original molecules not previously described). It is therefore expected that such compounds, acting on microtubule dynamics, can ultimately display an effect on almost all cellular processes besides the potential GABAergic effect, whatever the readout, but mainly linked to differences in timings, reflecting differences in modes of action. For instance, meleagrin is a precursor of oxaline (similar to roquefortine) and classified as a tremorgenic mycotoxin, which is thought to inhibit the GABA receptor and have an effect on microtubules. 45
In summary, the results reported in this publication demonstrate that the activity of the GABAA receptor can be successfully monitored and new chemical structures specifically interfering with this activity can be discovered using the label-free image-based DHM system. We propose this new approach for primary screening and preliminary validation of hits. It can then be followed by low-throughput complete characterization using standard electrophysiological techniques.
This drug discovery tool can be extended to other ion-channel targets of therapeutic interest, like the glutamate receptor, 18 the CFTR receptor, 42 or even electroneutral co-transporters (like NKCC1 and KCC2), 18 which cannot be assessed by electrophysiology due to the net neutral charge being transported, but still can be analyzed by DHM through monitoring of the net flux of water.
Supplemental Material
Rappaz_GABA_HCS_2019_SLAS-Disco_supplementary_revised – Supplemental material for Image-Based Marker-Free Screening of GABAA Agonists, Antagonists, and Modulators
Supplemental material, Rappaz_GABA_HCS_2019_SLAS-Disco_supplementary_revised for Image-Based Marker-Free Screening of GABAA Agonists, Antagonists, and Modulators by Benjamin Rappaz, Pascal Jourdain, Damiano Banfi, Fabien Kuttler, Pierre Marquet and Gerardo Turcatti in SLAS Discovery
Footnotes
Acknowledgements
The authors thank the BSF team for their technical assistance, in particular Nathalie Ballanfat, Jonathan Vesin, Julien Bortoli Chapalay, and Antoine Gibelin.
Supplemental material is available online with this article.
Declaration of Conflicting Interests
The authors disclosed receipt of the following potential conflicts of interest with respect to the research, authorship, and/or publication of this article: B.R. also works part-time for Lyncee Tec, which commercializes the DHM used in this study. The other authors declare no conflicts of interest. The work presented in this study was performed independently of B.R.’s work at Lyncee Tec.
Funding
The authors disclosed receipt of the following financial support for the research, authorship, and/or publication of this article: Part of this work was supported by the CTI program (grant no. 12669.1 PFLS-LS). We acknowledge the national research program NCCR Chemical Biology and the Swiss National Science Foundation for their financial support. We also acknowledge the support of the University of Lausanne and Departement de Psychiatrie-CHUV to the International Joint Research Unit in Child Psychiatry.
References
Supplementary Material
Please find the following supplemental material available below.
For Open Access articles published under a Creative Commons License, all supplemental material carries the same license as the article it is associated with.
For non-Open Access articles published, all supplemental material carries a non-exclusive license, and permission requests for re-use of supplemental material or any part of supplemental material shall be sent directly to the copyright owner as specified in the copyright notice associated with the article.