
Abstract
We have developed an automated patch clamp module for high-throughput ion channel screening, recording from 384 cells simultaneously. The module is incorporated into a laboratory pipetting robot and uses a 384-channel pipettor head for application of cells and compounds. The module contains 384 amplifier channels for fully parallel recordings using a digital amplifier. Success rates for completed experiments (1- to 4-point concentration–response curves for cells satisfying defined quality control parameters) of greater than 85% have been routinely achieved with, for example, HEK, CHO, and RBL cell lines expressing hNaV1.7, hERG, Kir2.1, GABA, or glutamate receptors. Pharmacology experiments are recorded and analyzed using specialized software, and the pharmacology of hNaV1.7 and hERG is described. Fast external solution exchange rates of <50 ms are demonstrated using Kir2.1. Short exposure times are achieved by stacking the external solutions inside the pipette of the robot to minimize exposure of the ligand on the receptor. This ensures that ligand-gated ion channels, for example, GABA and glutamate described in this report, can be reproducibly recorded. Stem cell–derived cardiomyocytes have also been used with success rates of 52% for cells that have a seal resistance of >200 MΩ, and recordings of voltage-gated Na+ and Ca2+ are shown.
Introduction
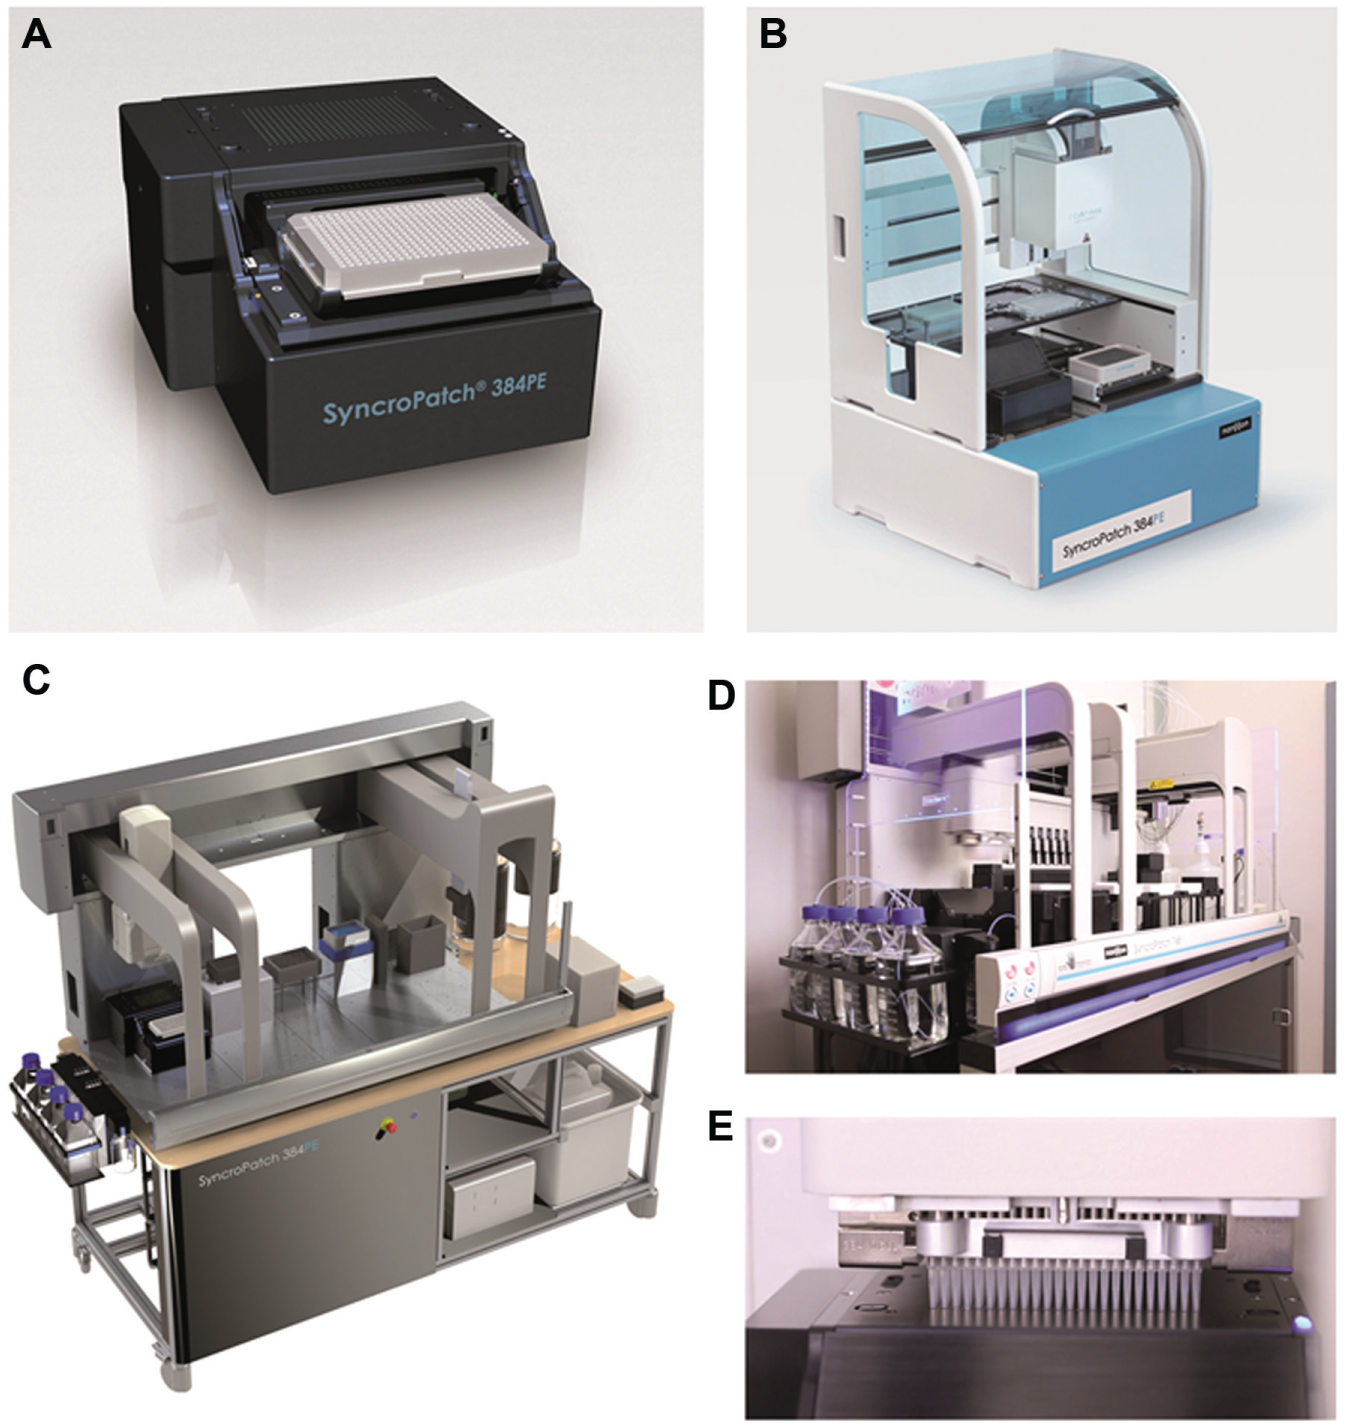
Patch clamp remains the gold standard for obtaining information about ion channels since it was first described in the 1970s by Neher and Sakmann. 1 However, conventional patch clamp is technically demanding and is unsuitable for high-throughput screening (HTS) experiments. Attempts to automate the technique began in the late 1990s with two approaches being adopted, either a pipette-based automation approach, for example, the Apatchi-1 2 (Sophion Biolin Scientific, Copenhagen, Denmark) and Flyscreen 3 (Flyion GmbH, Tübingen, Germany), or a planar chip approach, for example, the Port-a-Patch4,5 (Nanion Technologies GmbH, Munich, Germany), Patchliner 6 (Nanion Technologies), QPatch2,7 (Biolin Scientific/Sophion A/S, Ballerup, Denmark), PatchXpress8,9 (Molecular Devices, LLC, Sunnyvale, CA), SyncroPatch 96 10 (Nanion Technologies), IonWorks11,12 (Molecular Devices), IonWorks Barracuda13,14 (Molecular Devices), Qube (Biolin Scientific/Sophion A/S), CytoPatch 15 (Cytocentrics AG, Rostock, Germany), and IonFlux 16 (Fluxion Biosciences, South San Francisco, CA). The planar chip approach has been by far the most successful of the two methods and has done much to improve ease of use and increase throughput.17,18 However, the demands of HTS laboratories require the constant improvement of existing devices to include features such as temperature control, which are available on the Patchliner, 10 IonFlux, and QPatch, and the introduction of new devices to increase throughput, data quality, and flexibility. Devices such as the Patchliner, SyncroPatch 96, QPatch, CytoPatch, and IonFlux promise gigaseal recordings, a desirable attribute for accurate voltage control and reliable pharmacology, but these devices lack the throughput required for true HTS experiments. The IonWorks Quattro and, particularly, the IonWorks Barracuda, with the provider’s claim of up to 6000 data points per hour, address the throughput needs, but with a seal resistance of <100 MΩ, data quality may be compromised. Only the Qube, which was first sold in 2014 with its estimated throughput of 30,000 compounds in 24 h coupled with gigaseal recordings, begins to address both the throughput and quality needs of an HTS laboratory. However, all currently available instruments are stand-alone devices, resulting in potential complications when integrating into existing HTS environments. The SyncroPatch 384PE (PE for Patch Engine) differs from the currently available systems because of its revolutionary modular design. The SyncroPatch 384PE is a patch clamp module ( Fig. 1A ) capable of recording from 384 cells simultaneously with success rates routinely greater than 80% achieved for completed experiments (cells satisfying quality control criteria such as a seal resistance of >500 MΩ and a defined peak current amplitude at the start of the experiment). The module is connected to a digital amplifier (Tecella, Foothill Ranch, CA) with 384 channels. The module can be integrated into existing state-of-the-art pipetting robots with a 384 pipettor arm so that all 384 cells are truly recorded and serviced with solutions in parallel. The pipetting robots that have been used routinely so far are the Biomek FX (Beckman Coulter GmbH, Krefeld, Germany; Fig. 1C–E ) and the CyBi FeliX (CyBio, Jena, Germany; Fig. 1B ). The CyBi FeliX has a smaller footprint than the Biomek FX and therefore is a good choice for laboratories where space is limited. The Biomek FX has a larger footprint, but has the advantage that two PE modules can be incorporated into the system, thus vastly increasing throughput. The quality of the data and the success rate for completed experiments (based on quality control criteria such as seal resistance and current amplitude) do not differ between the systems, and the user is free to choose which pipetting robot best suits his or her laboratory needs based on aspects such as size, prior experience, and throughput requirements. The SyncroPatch 384PE uses a borosilicate glass chip in a 384-well plate format with one or more patch clamp apertures per well.
(
A powerful and easy-to-use data acquisition and analysis software package is paramount to the efficient performance of such a high-throughput device. The data acquisition software, PatchControl 384 (Nanion Technologies), and data analysis software, DataControl 384 (Nanion Technologies), have been developed in collaboration with academic and pharmaceutical HTS laboratories. PatchControl 384 controls the running of the experiment, from positioning of compounds through definition of voltage protocols and basic online analysis functions, to acquisition and display of raw data. A color-coded display of all 384 wells based on, for example, seal resistance, and an expanded view of 1 and 16 wells provides an at-a-glance overview of the quality of the experiment for the user (see Fig. 3 for an annotated screenshot of the PatchControl 384 software during an actual experiment). The user can then toggle between raw data and basic online analysis such as current–voltage plots or current–time plots. The PatchControl 384 software and the software controlling the movement of the pipetting robot, for example, Biomek FX (Beckman Coulter) or CyBi FeliX (CyBio), work together for efficient running of the experiment.
The data analysis software, DataControl 384, is used for subsequent offline analysis of the data. In this software package, data are loaded and displayed in the same way as PatchControl 384 and then concentration–response curves for individual wells are generated. The data from wells can be included or excluded based on quality (e.g., seal resistance > 500 MΩ, RSeries < 25 MΩ, current amplitude >100 pA at the start and/or end of the experiment). Average concentration–response curves for each compound are then generated. The data can be exported in different formats and easily integrated into existing HTS databases. The data analysis is permitted directly after the experiment on the computer where the experiment is being performed, or later offline on a remote computer.
In this report, we describe a new automated patch clamp module that meets the needs of HTS laboratories studying ion channels. We present data recorded with the SyncroPatch 384PE using the Biomek FX pipetting robot from Beckman Coulter. Cells used so far are HEK293, CHO, Ltk, Jurkat, 1321N1, and RBL, with success rates for completed experiments of routinely >85% (cells satisfying certain quality criteria for a 1- to 4-point concentration–response curve lasting approximately 20–30 min). Stem cell–derived cardiomyocytes (iCell cardiomyocytes 2 , Cellular Dynamics International, Madison, WI; Cor.4U, Axiogenesis AG, Cologne, Germany) have also been recorded with success rates of >50% for cells with a seal resistance of >200 MΩ and data are shown.
Materials and Methods
System Components
The SyncroPatch 384PE (Nanion Technologies) described here is an automated patch clamp module in combination with a 384-channel digital amplifier (Tecella), a Biomek FX pipetting robot (Beckman Coulter) with 384 pipettor, software for control of the robot (Biomek Software, Beckman Coulter), and proprietary software for data acquisition (PatchControl 384, Nanion Technologies) and data analysis (DataControl 384, Nanion Technologies). Data output and compound information is compatible with most database formats. For the patch clamp recordings, planar borosilicate glass patch clamp chips were used 18 in a 384-microtiter-plate format. For Patchliner experiments, a Patchliner Octo (Nanion Technologies) was used, including HEKA EPC10 Quadro amplifiers (HEKA Elektronik, Lambrecht, Germany). PatchControlHT (Nanion Technologies), the software for controlling the experiment, was integrated with PatchMaster (HEKA Elektronik) for acquisition of data and online analysis of the recorded data. Data were exported and analyzed offline using IGOR Pro (WaveMetrics, Lake Oswego, OR).
Cell Culture and Harvesting
Standard cell lines
The cell lines used here were cultured as previously described.5,19-21 In brief, cells were cultured in T75 culture flasks in the media recommended by the supplier and passaged every 2–3 days when they were 50%–80% confluent. The cells were passaged regularly to ensure that the cells were single when passaged and harvested. The cells were prohibited from reaching 100% confluency so that the cells remained healthy, single, and expressed the ion channel of interest when they were harvested into a cell suspension for recordings. For experiments on the SyncroPatch 384PE and Patchliner, cells were harvested into suspension and suction was used to attract a cell to the patch clamp aperture of each well. Since it was a blind method for capture, cells had to be single with not too many clusters and the cell suspension was free from cell debris, as the presence of cell clusters and debris could have decreased the success rate. Cells were typically harvested as described previously5,19-21 using trypsin, other suitable enzymes, or even enzyme-free detachment protocols. Cells were then resuspended in a mixture of 50% culture media/50% external recording solution at a density of 50,000–500,000 cells/mL.
Stem cell–derived cardiomyocytes
The human-induced pluripotent stem cell–derived cardiomyocytes (iPSCs) were cultured as per the manufacturer’s instructions (iCell cardiomyocytes 2 , Cellular Dynamics International) or were provided by the manufacturer as beating monolayers in T25 culture flasks (Cor.4U, Axiogenesis). Cells were maintained in culture for 2–3 weeks before being used for patch clamp measurements. Cells were harvested as previously described.10,21
Patch clamp solutions
The internal solution for hERG, Kir2.1, GABA, glutamate experiments, and iPSCs was as follows: 50 mM KCl, 10 mM NaCl, 60 mM KF, 20 mM EGTA, 10 mM HEPES/KOH, pH 7.2. The internal solution for hNaV1.7 experiments (SyncroPatch 384PE) differed slightly and was composed of 10 mM CsCl, 110 mM CsF, 20 mM EGTA, 10 mM HEPES/CsOH, pH 7.2. The internal solution for hNaV1.7 experiments on the Patchliner used the following solution: 50 mM CsCl, 10 mM NaCl, 60 mM CsF, 20 mM EGTA, 10 mM HEPES/KOH, pH 7.2. The external recording solution for Kir2.1, hERG IV, GABA, and glutamate experiments used the following composition: 140 mM NaCl, 4 mM KCl, 1 mM MgCl2, 2 mM CaCl2, 5 mM
Electrophysiology
All cells were recorded in the whole-cell mode of the patch clamp technique using the SyncroPatch 384PE incorporated into a Biomek FX pipetting robot (Beckman Coulter) or the Patchliner Octo. On the SyncroPatch 384PE, voltage protocols were constructed and data acquired using PatchControl 384 (Nanion Technologies). For experiments on the Patchliner, voltage protocols were constructed and data acquired using PatchMaster (HEKA Elektronik). Data were analyzed and concentration–response curves were generated using DataControl 384 (Nanion Technologies) or IgorPro (Wavemetrics) for Patchliner experiments. For hERG concentration–response curves on the SyncroPatch 384PE, one concentration of compound was applied to each cell and the concentration–response curve calculated across the whole plate. In this case, IC50 values were calculated from the averaged fits. For hERG pharmacology on the Patchliner, tetracaine block of hNaV1.7 on the SyncroPatch 384PE, and GABA on the SyncroPatch 384PE, cumulative concentration–response curves were generated and the average IC50 calculated as the mean of the individual plots. In these experiments, the IC50 is given as mean ± SEM. For current–voltage plots, points were plotted as the mean peak amplitude or mean normalized amplitude ± SEM. For hNaV1.7, the points were fitted using a Boltzmann equation.
Results and Discussion
The SyncroPatch 384PE automated patch clamp module has been developed for high-throughput screening of ion channels important in drug discovery and safety pharmacology. It uses a 384-channel digital amplifier (Tecella), and each cell is clamped individually with a common ground for 32 wells. The SyncroPatch 384PE uses a borosilicate glass substrate for the patch clamp recordings that has already proven successful with the Port-a-Patch,4,5,18,19 Patchliner,6,18,19 and SyncroPatch 96.10,19 The borosilicate glass patch clamp chip has a 384-well plate format, typically with a single hole in each well, and so far the success rate for a seal resistance of >500 MΩ at the start of the experiment for CHO or HEK cells expressing hNaV1.7 or hERG is >90% (see Figs. 3 and 6 ). Although the wells typically have one hole per well, patch clamp chips containing multiple holes per well are also available. This is particularly useful when current size is very small or not all cells express the ion channel of interest, for example, when transiently transfected cells are used. In this case, the sum of the currents recorded in each well is measured. A seal resistance of 50–200 MΩ can be expected with these kinds of recordings (see Fig. 10 ).
The SyncroPatch 384PE has been incorporated into a Biomek FX (Beckman Coulter) or CyBi FeliX (CyBio) robot with a 384 pipetting arm. With a 384-channel amplifier, 384 pipetting arm, and success rate of >85% for a seal resistance of >500 MΩ (at the start of the experiment) coupled with an experiment time of around 20–30 min for a 4-point concentration–response curve, the SyncroPatch 384PE provides a theoretical throughput for ion channel screening using a patch clamp of 20,000 data points per 8 h day. In addition, two SyncroPatch 384PE modules can be incorporated into one pipetting robot (data not shown), thus almost doubling throughput.
We have performed pharmacology experiments on several different voltage-gated ion channels using the SyncroPatch 384PE routinely with success rates of >80% for completed experiments (using strict quality control parameters described below), and two examples are shown here in detail: hNaV1.7 and hERG.
The voltage-gated sodium channel, NaV1.7, found primarily in the peripheral nervous system and thought to play a role in nociception and pain sensing, has been recorded on the SyncroPatch 384PE. The current–voltage plot for an average of 275 CHO cells expressing hNaV1.7 (Anaxon AG, Berne, Switzerland) recorded in one experiment on the SyncroPatch 384PE is shown in Figure 2A . An example of the raw traces is shown in the inset. The current–voltage plot for an average of eight CHO cells expressing hNaV1.7 (Anaxon) recorded on the Patchliner is shown in Figure 2B for comparison. The Vhalf of activation calculated from the average current–voltage plot using a Boltzmann equation was −24 mV for the SyncroPatch 384PE. This is in good agreement with the value obtained for the Patchliner (−19 mV) and with values reported in the literature.22-24 For pharmacology experiments using tetracaine, CHO cells expressing hNaV1.7 (Anaxon) were used on the SyncroPatch 384PE with a success rate of 95% for cells that have a seal resistance of >500 MΩ at the start of the experiment ( Fig. 3 ). In Figure 3 , a screenshot of the PatchControl 384 software with current traces in response to a voltage step protocol (panel A) and the corresponding online analysis (panel B) are shown. The PatchControl 384 software was developed to be user-friendly and intuitive. There is a color-coded overview of all 384 wells; in the case shown in Figure 3 , the color coding is based on seal resistance, but cell capacitance or series resistance could also be used. The settings for the color coding are set in the bottom left corner; in this case, green wells are cells with a seal resistance of >500 MΩ, blue wells are cells with a seal resistance of >100 MΩ, light blue wells are cells with a resistance of <100 MΩ, and gray wells are disabled. Sixteen wells can be highlighted and are shown on the right of the screen for a slightly larger view of the recordings, and one well is expanded and shown at the bottom of the screen. In this way, the user gains a quick, at-a-glance overview of the quality of the experiment. In panel B, a background of different shades of blue indicates three successive additions of tetracaine at increasing concentrations (150 nM, 1.58 µM, 15.8 µM). The voltage protocol (panel C) consists of two consecutive depolarization steps from −120 to 0 mV. It is designed to show the current response and compound potency on the resting state (cursor C1) as well as the inactivated state (cursor C2) of the channel. Inactivation is achieved by holding the membrane potential for 2 s at 0 mV between C1 and C2 (not displayed, represented by a broken vertical line) and followed by partial recovery at −120 mV for a defined period of 30 ms. It has been previously established that many compounds that act on voltage-gated Na+ channels display a state-dependent change in potency.25,26 For this reason, being able to reliably measure the potency of compounds on different activation states of NaV1.7 is critical. Importantly, seal resistance and current amplitude remained stable over the course of the experiment, which took 18 min ( Fig. 4 ). Three applications of control solution (including vehicle; 0.1% DMSO) were made to ensure that the current amplitude was stable before application of tetracaine.
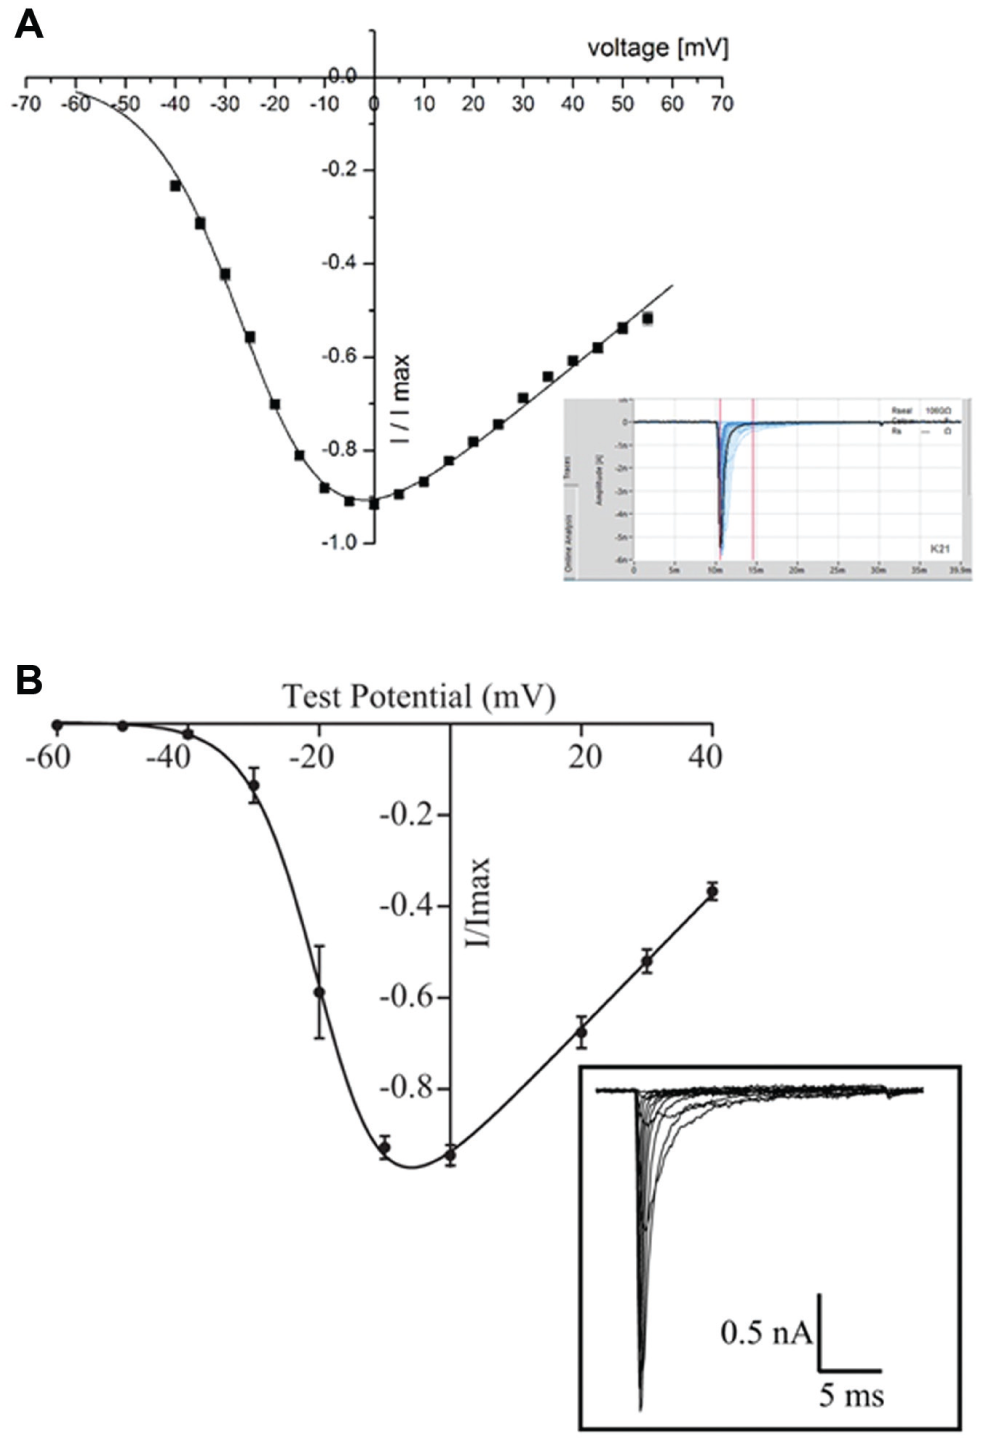
Average current–voltage plot for hNaV1.7 recorded on the SyncroPatch 384PE and the Patchliner. (
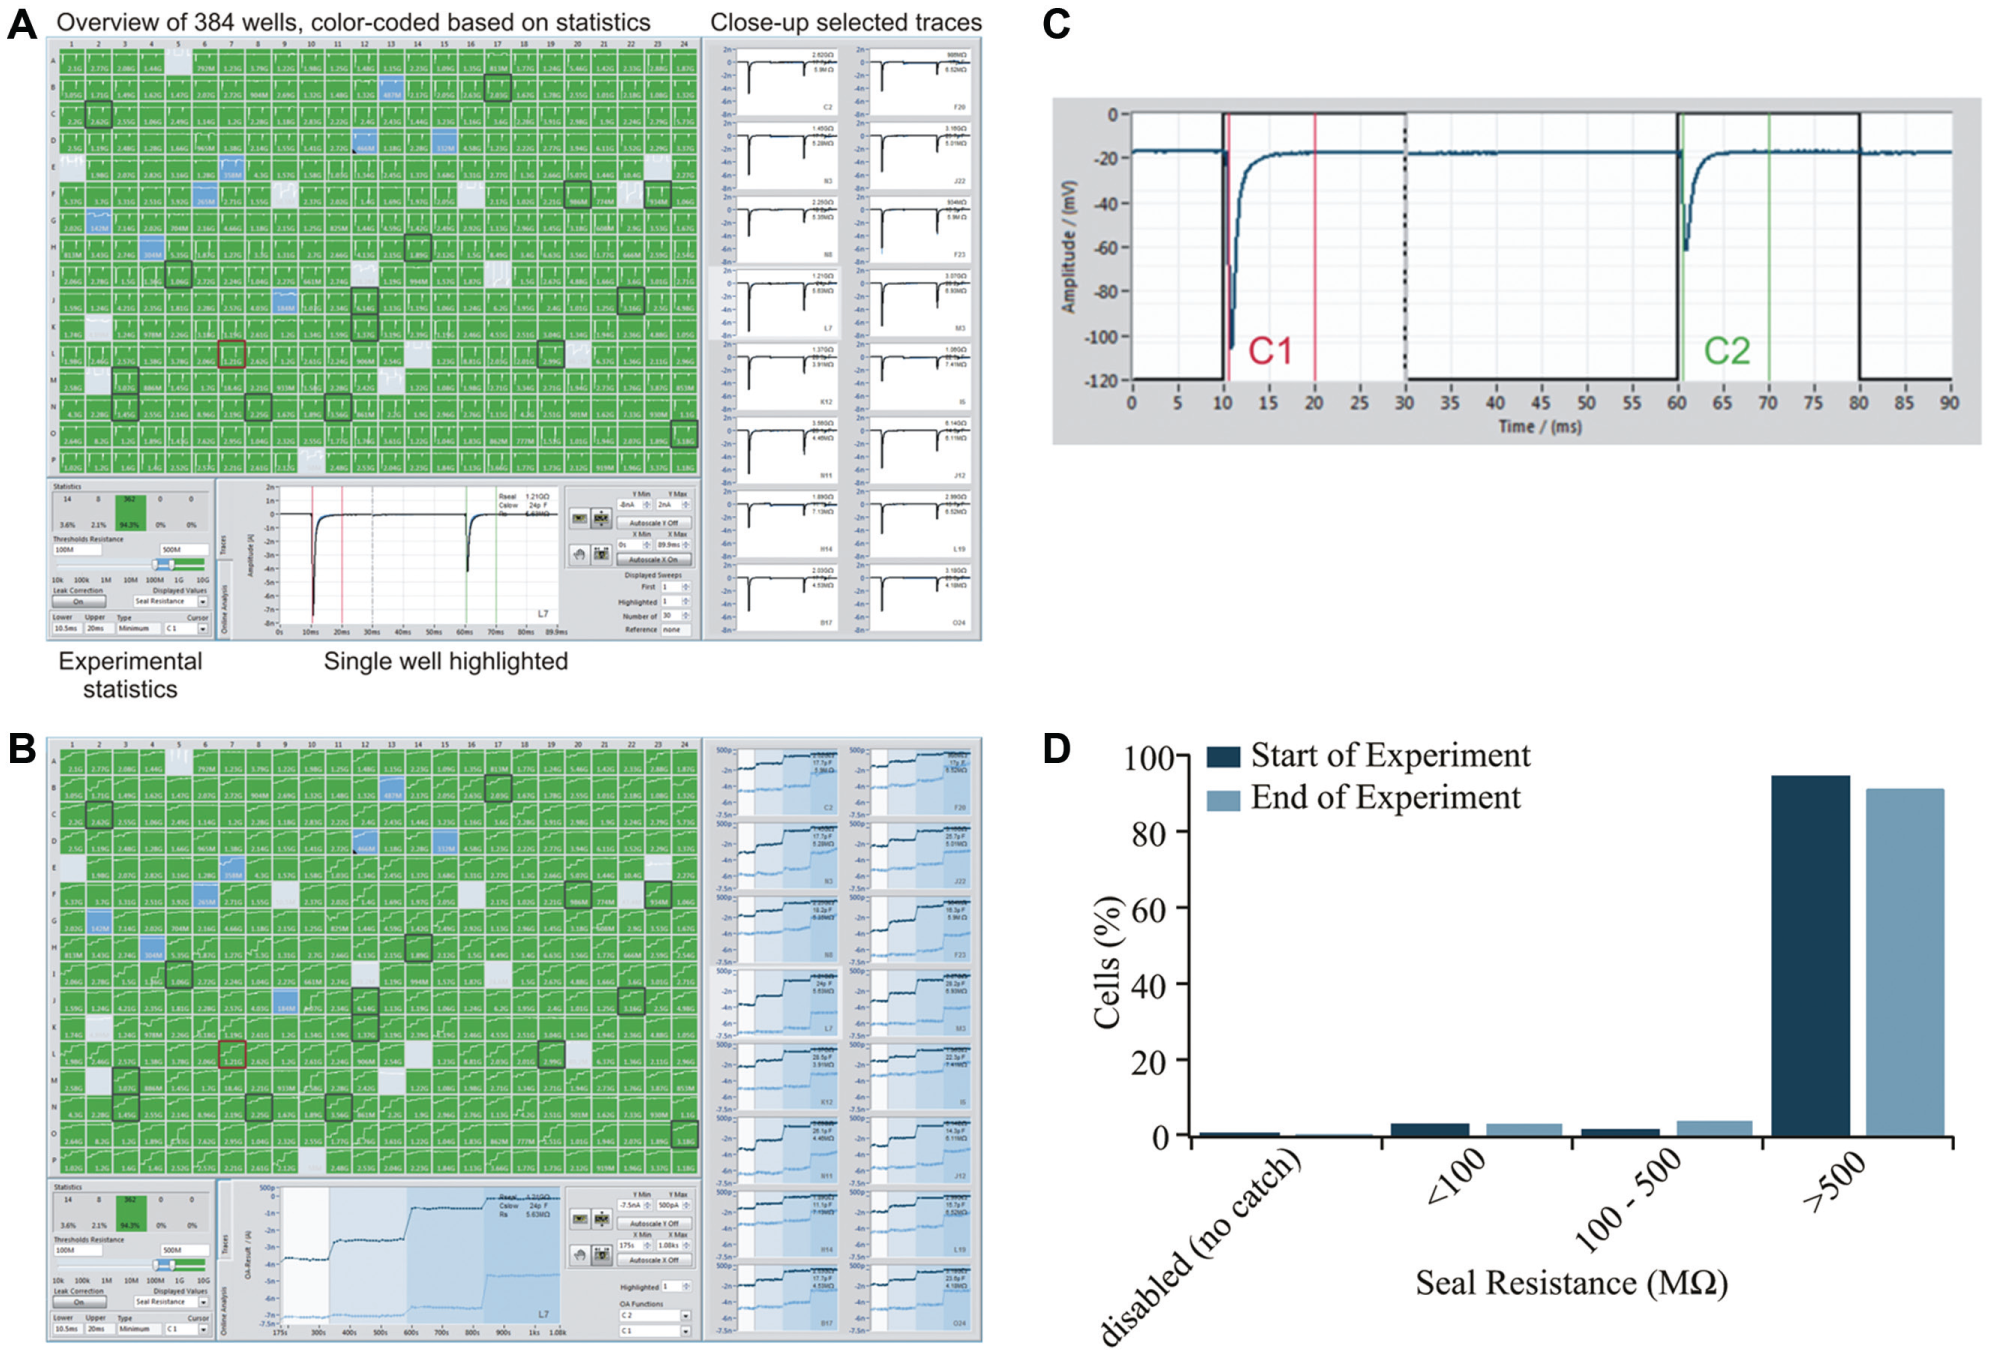
Screenshot of the PatchControl 384PE software showing an experiment using CHO cells expressing hNaV1.7 during a voltage step protocol. (
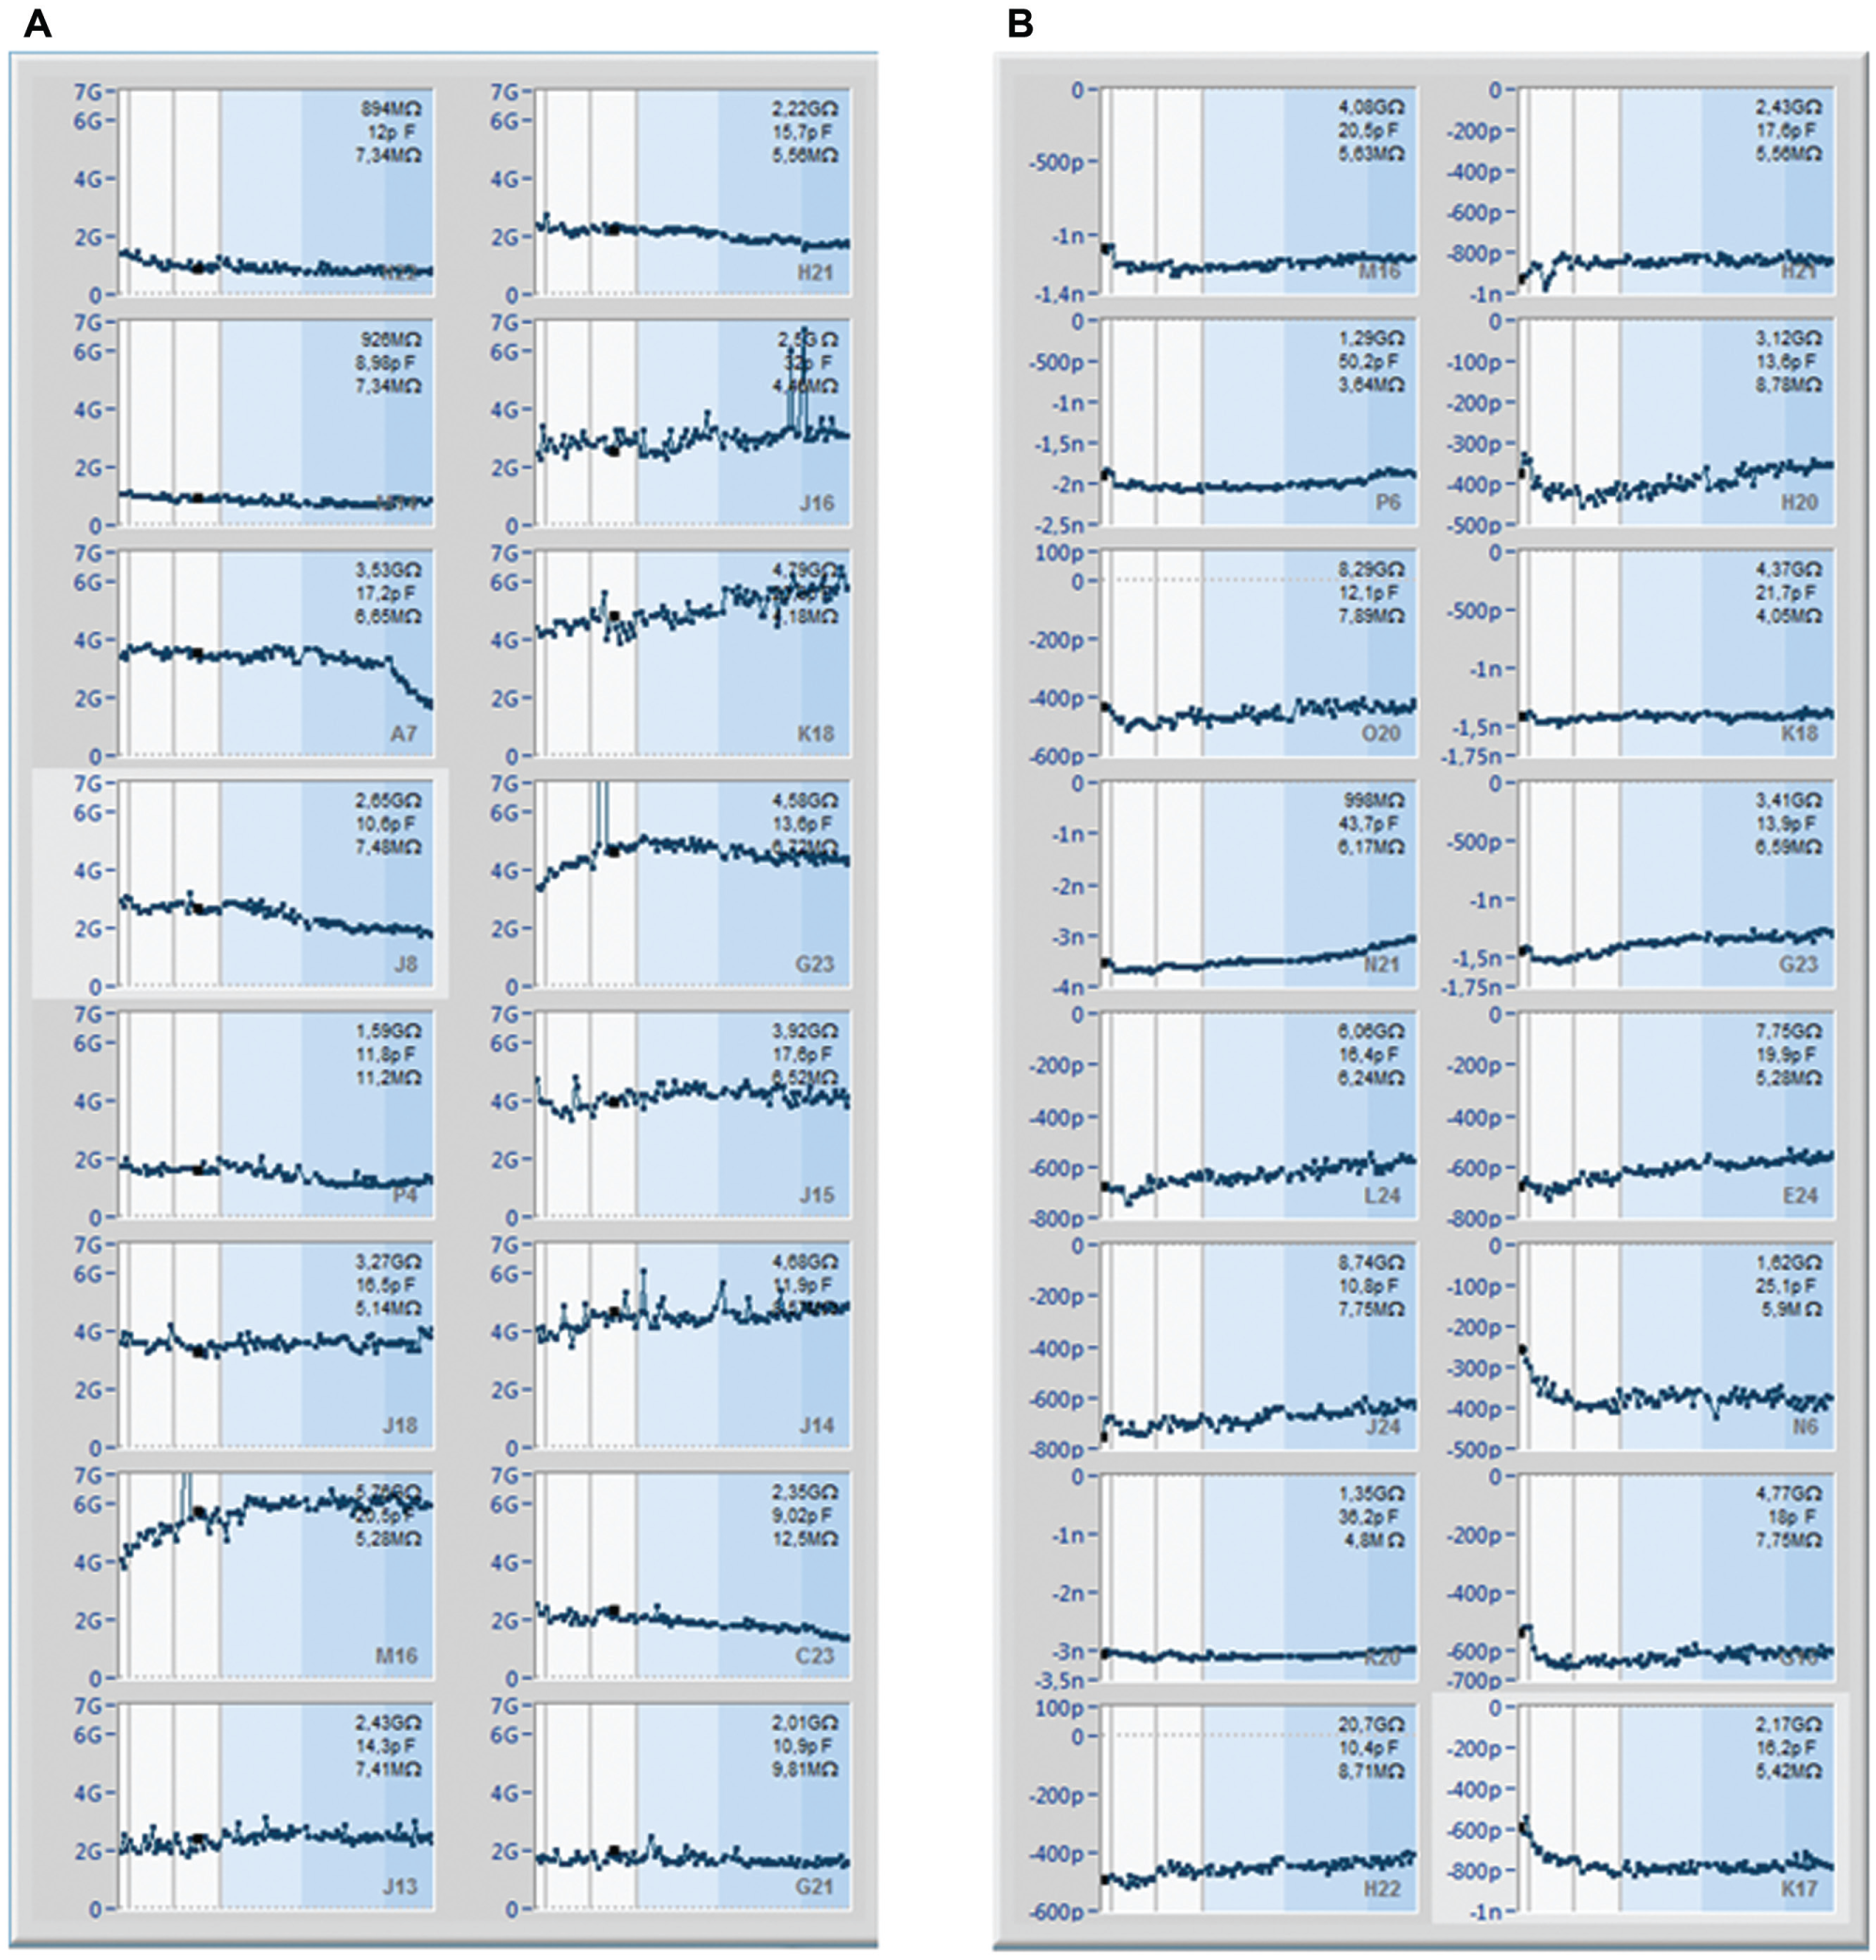
Stability of recordings on the SyncroPatch 384PE. (
In the subsequent experiment, three different concentrations of tetracaine were added to each cell sequentially and the corresponding concentration response was calculated. Figure 5 shows the analysis of NaV1.7 inhibition by tetracaine in DataControl 384. After defining strict quality criteria for a successful experiment (seal resistance >500 MΩ, first peak amplitude >550 pA, second peak amplitude >200 pA at the start of the experiment), only valid wells were selected for calculation and analysis of the averaged concentration–response curve. Depending on the chosen cursor, the fitting results are displayed for the block of the resting state (C1, panel B), the inactivated state (C2, panel C), or both (panel D). The averaged fitting results from all valid wells (panel A), as well as the raw traces, time plots of peak amplitude, and concentration–response curves from each individual well (panel D), can be retrieved and exported from the software. As expected,25,26 tetracaine exhibits state dependence of inhibition of NaV1.7. For activation from the closed state (holding potential −120 mV), the IC50 was 14.9 ± 0.6 µM (n = 290; C1), whereas the IC50 on the inactivated state (C2) was 266 ± 6 nM (n = 296).
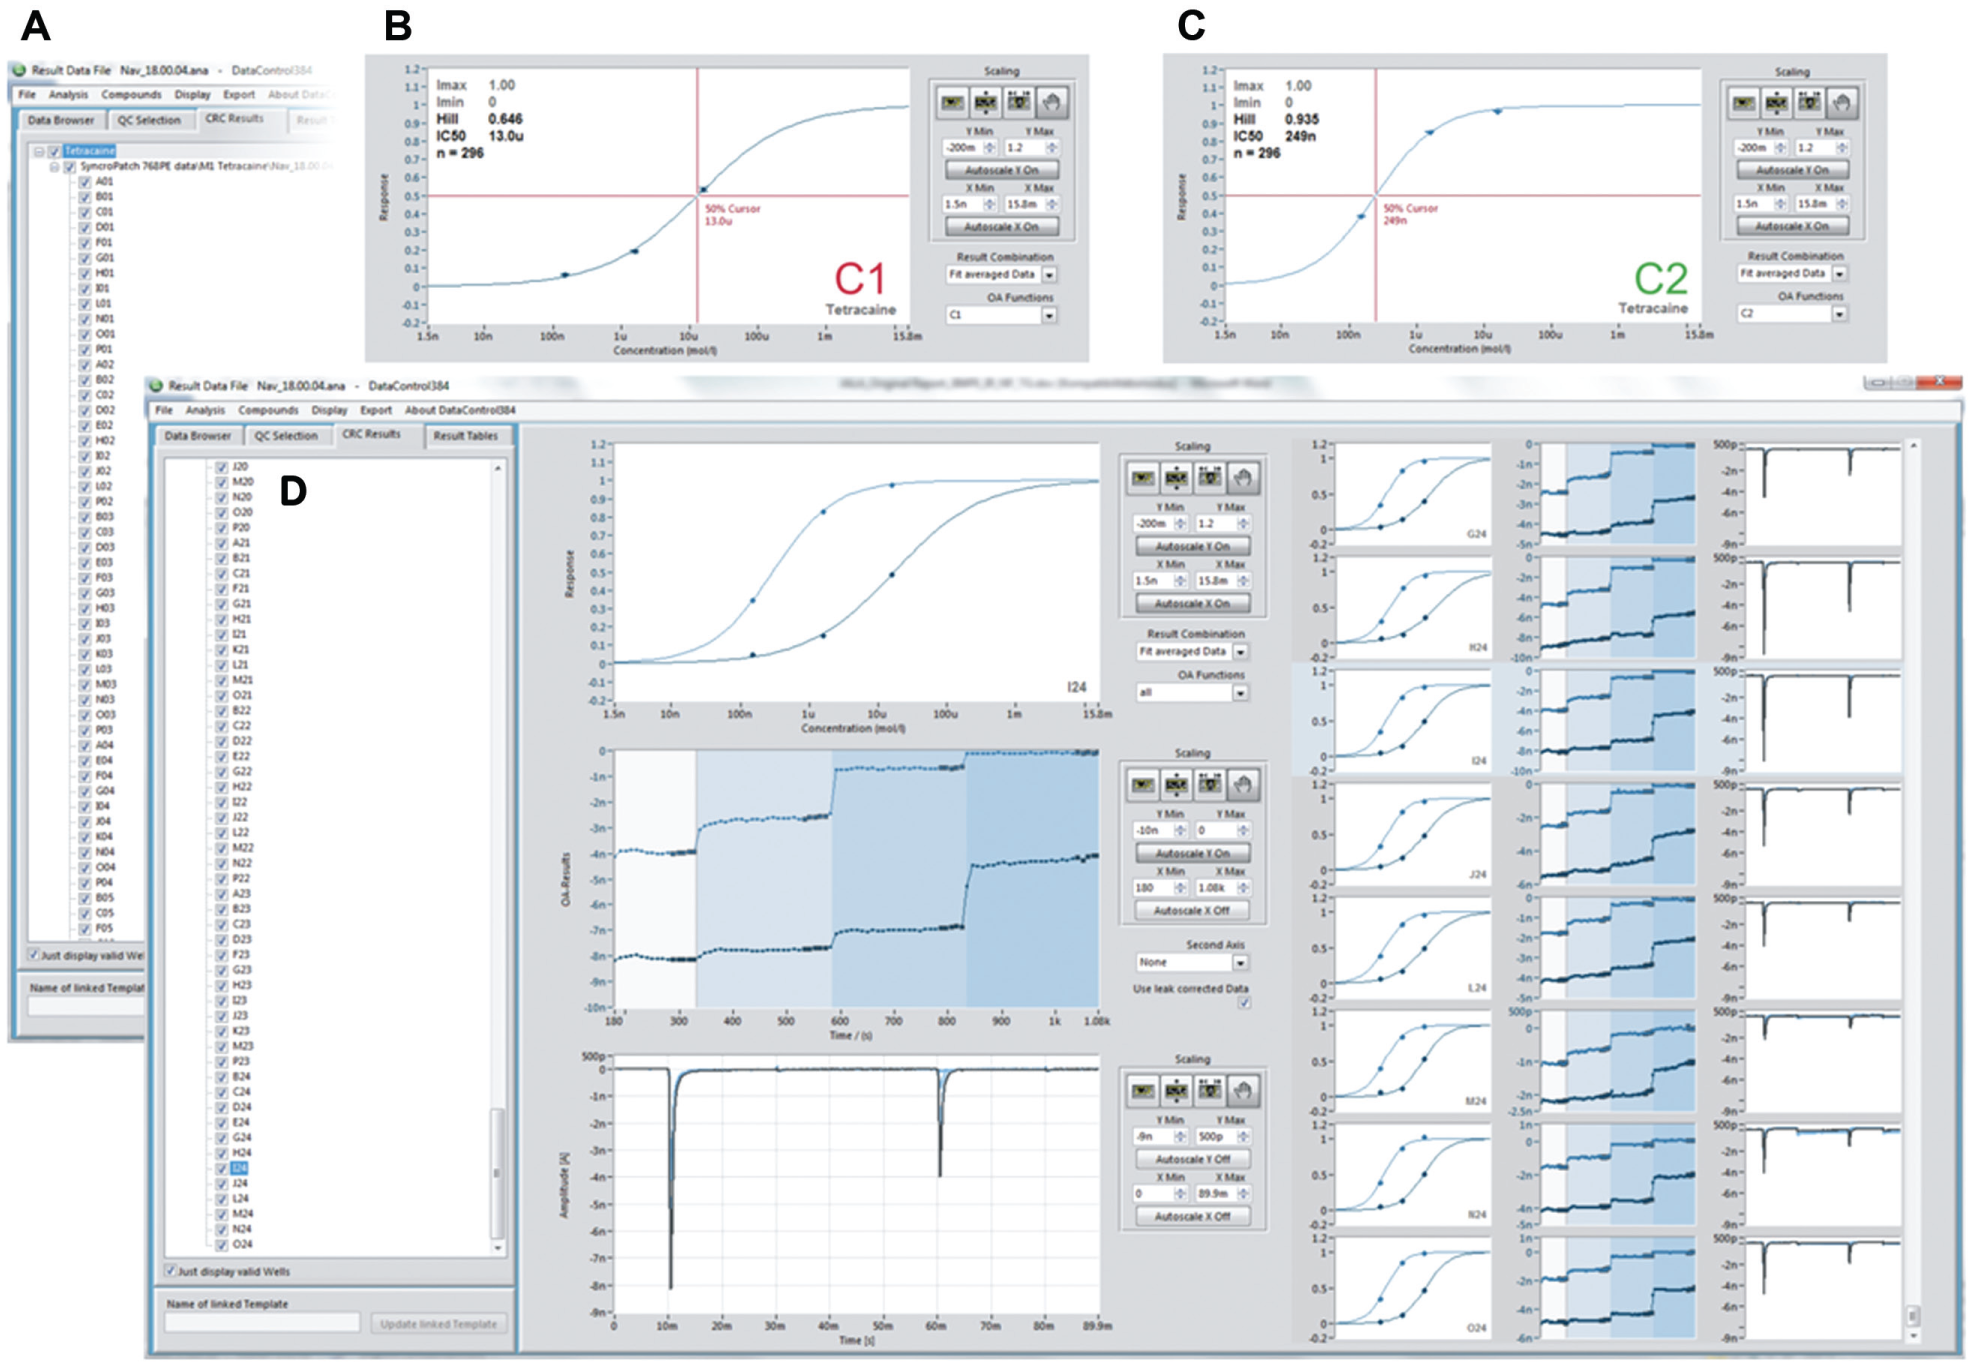
Analysis of tetracaine block of hNaV1.7 expressed in CHO cells using DataControl 384. (
The human ether-a-go-go-related gene (hERG) encodes a potassium channel that mediates the delayed rectifying current (IKr) in cardiac myocytes. 27 The hERG channel has become an important target for drug safety testing, as compound interaction with this channel has been shown to prolong the QT interval, resulting in torsades de pointes, a potentially fatal ventricular tachycardia.27,28 Figure 6 shows the current–voltage response of CHO cells expressing hERG (Anaxon) recorded on the SyncroPatch 384PE. Panel A shows the online analysis (peak current vs. voltage) for all 384 cells recorded. Ninety-three percent of cells had a seal resistance of >500 MΩ at the end of the voltage protocol, with a further 5% of cells that had a seal resistance of >100 MΩ. Panel B shows the voltage protocol used to elicit the hERG current and an example of the raw traces. Panel C shows the current–voltage relationship for an average of 322 cells. The current–voltage relationship is consistent with IKr reported in the literature 27 and with hERG expressed in HEK cells (Merck Millipore, Darmstadt, Germany) recorded on the Patchliner (see Fig. 8A ). HEK cells expressing hERG were used for pharmacology experiments on the SyncroPatch 384PE. Four known blockers of the hERG channel were applied via the external solution, and the average concentration–response curves are shown in Figure 7 . A summary of the IC50 values is given in Table 1 . The IC50 values agreed well with those reported in the literature29-37 and with those obtained using the Patchliner ( Fig. 8 , Table 1 ).
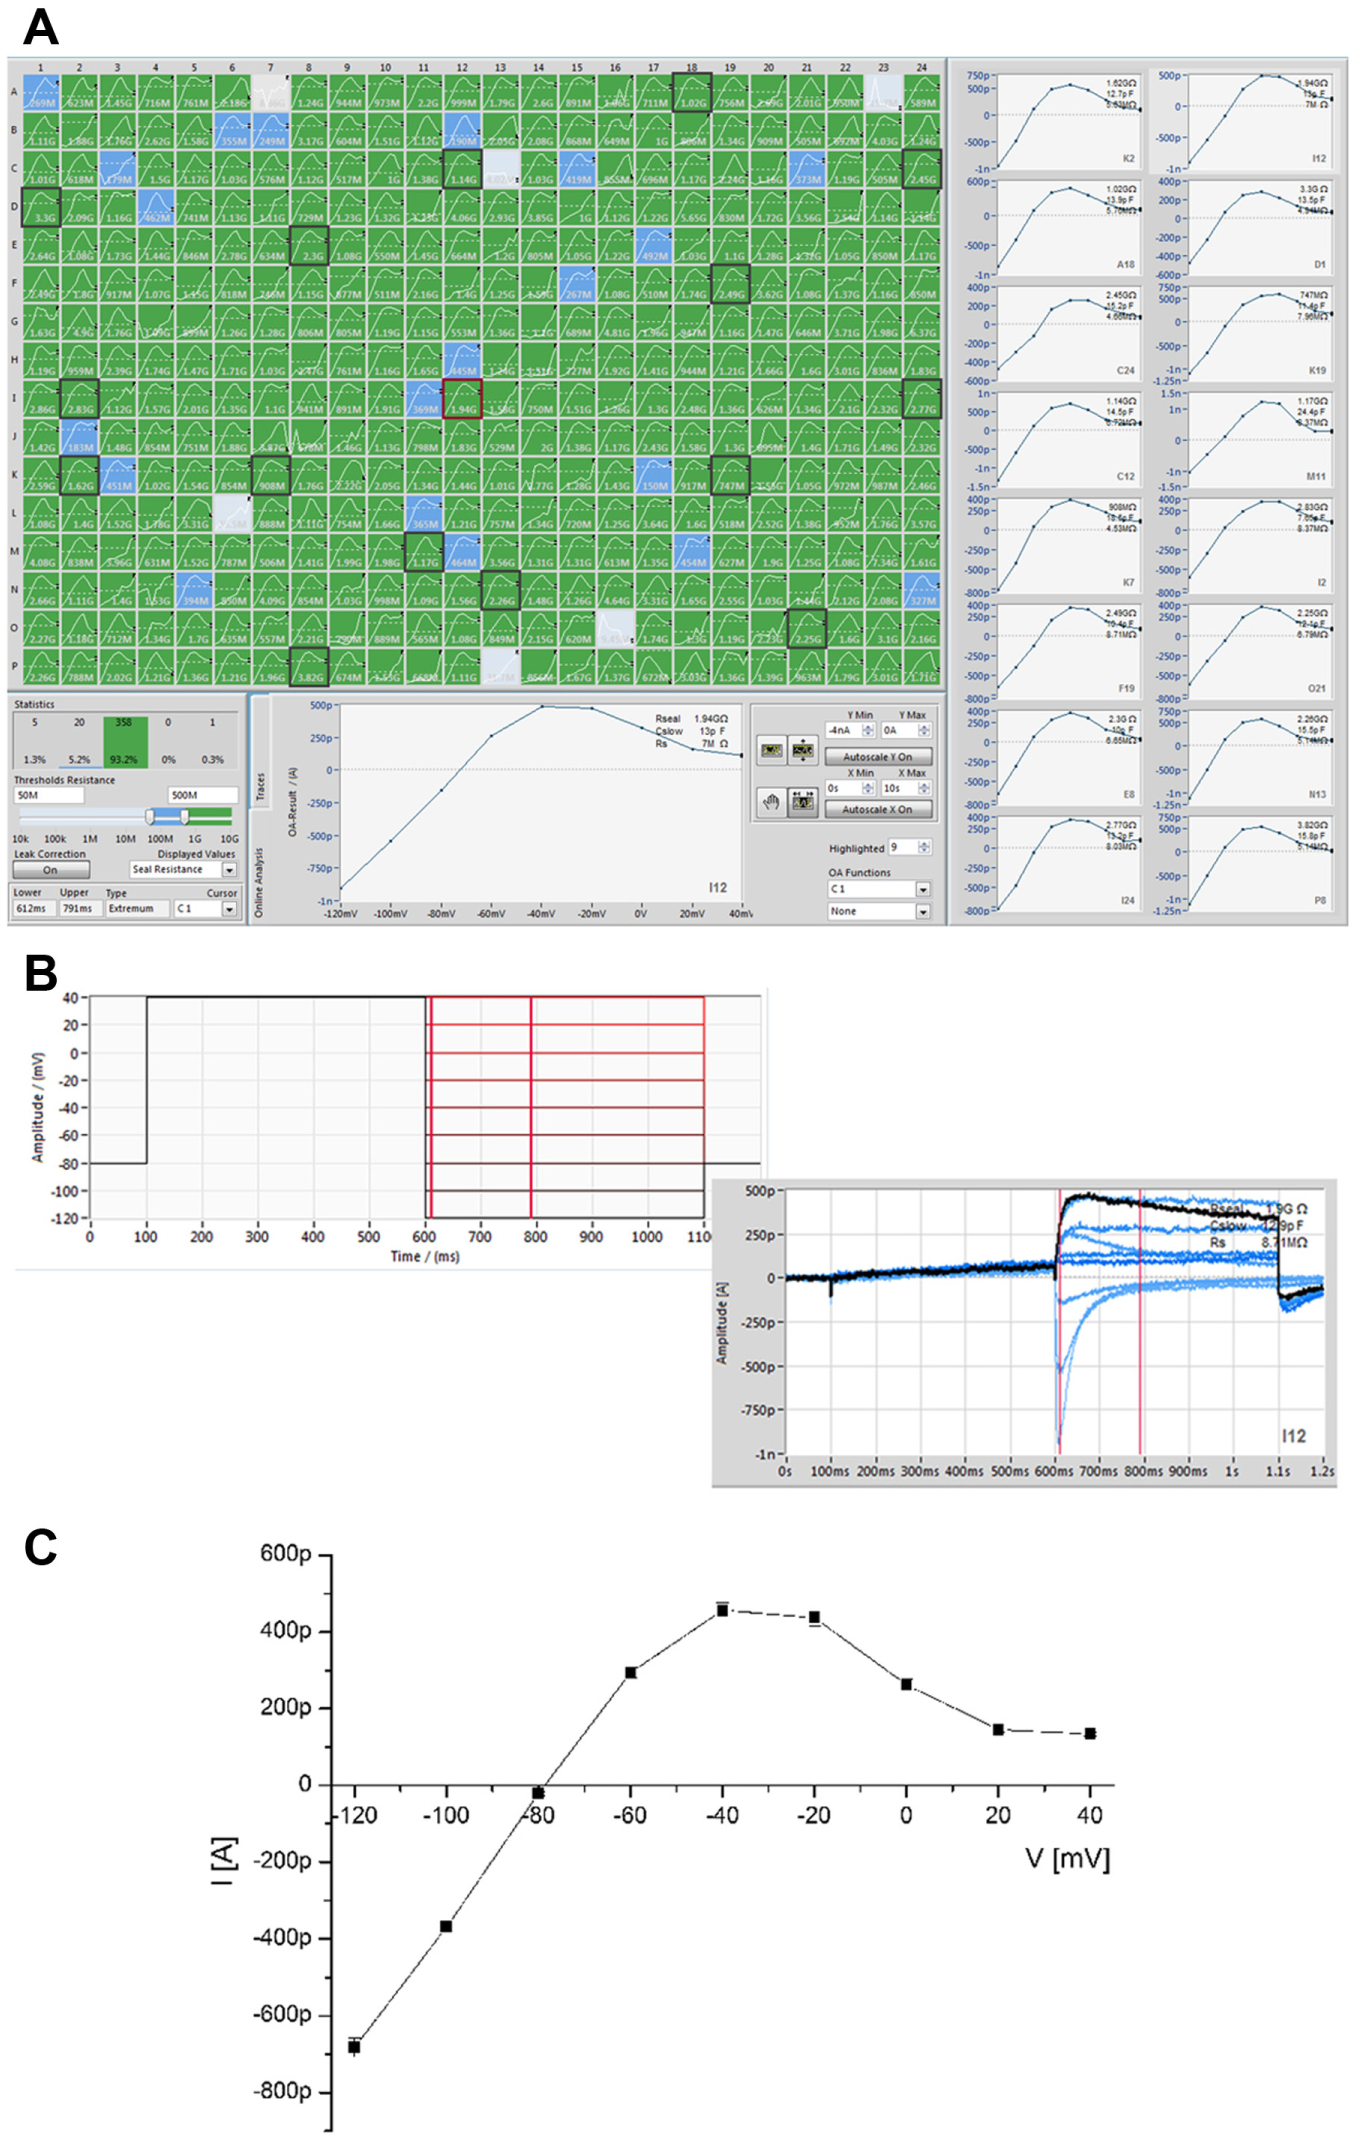
Current–voltage plot for hERG expressed in CHO cells recorded on the SyncroPatch 384PE. (
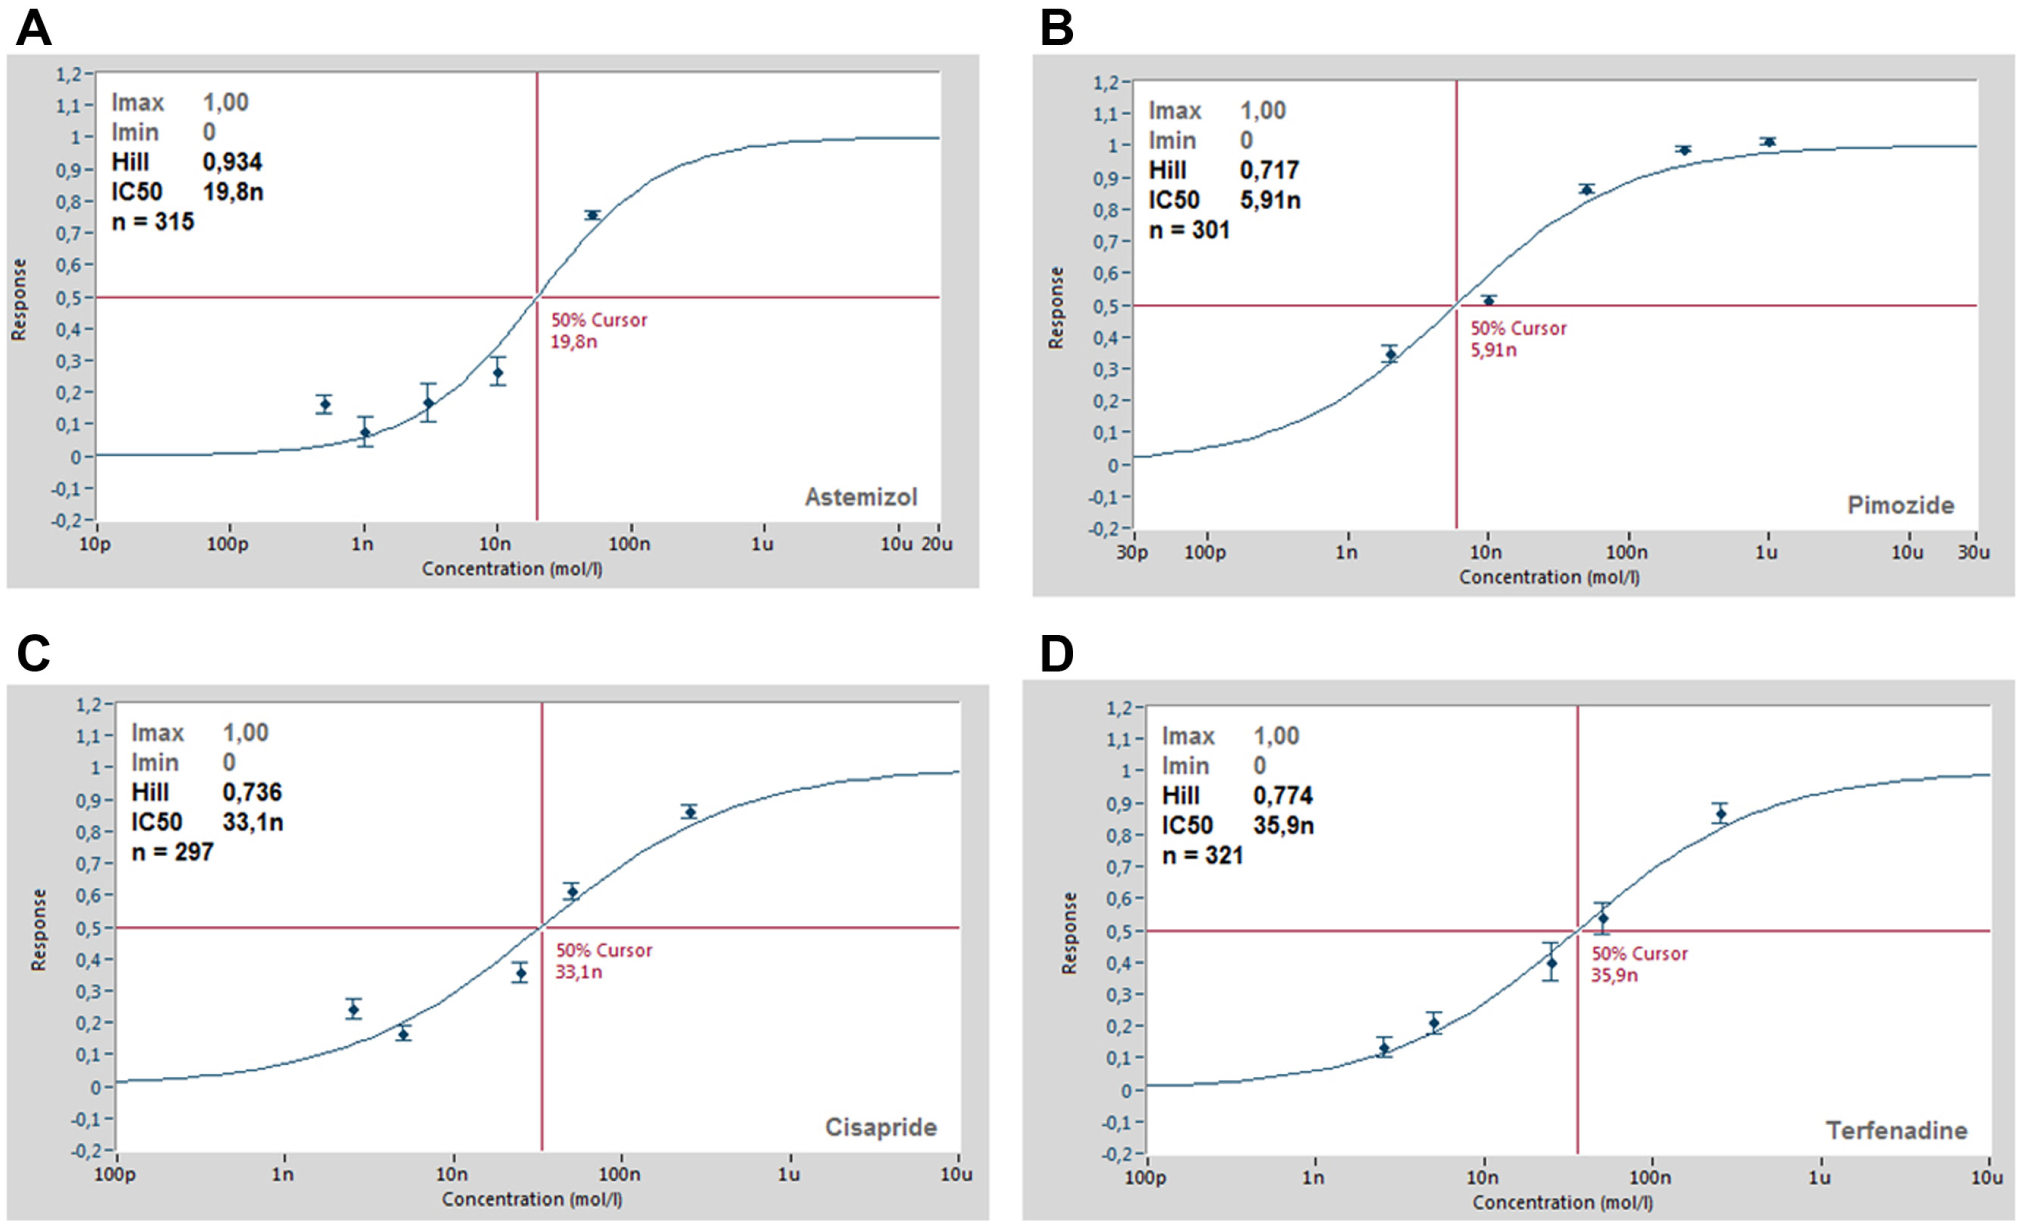
Concentration–response curves for four known hERG blockers. (
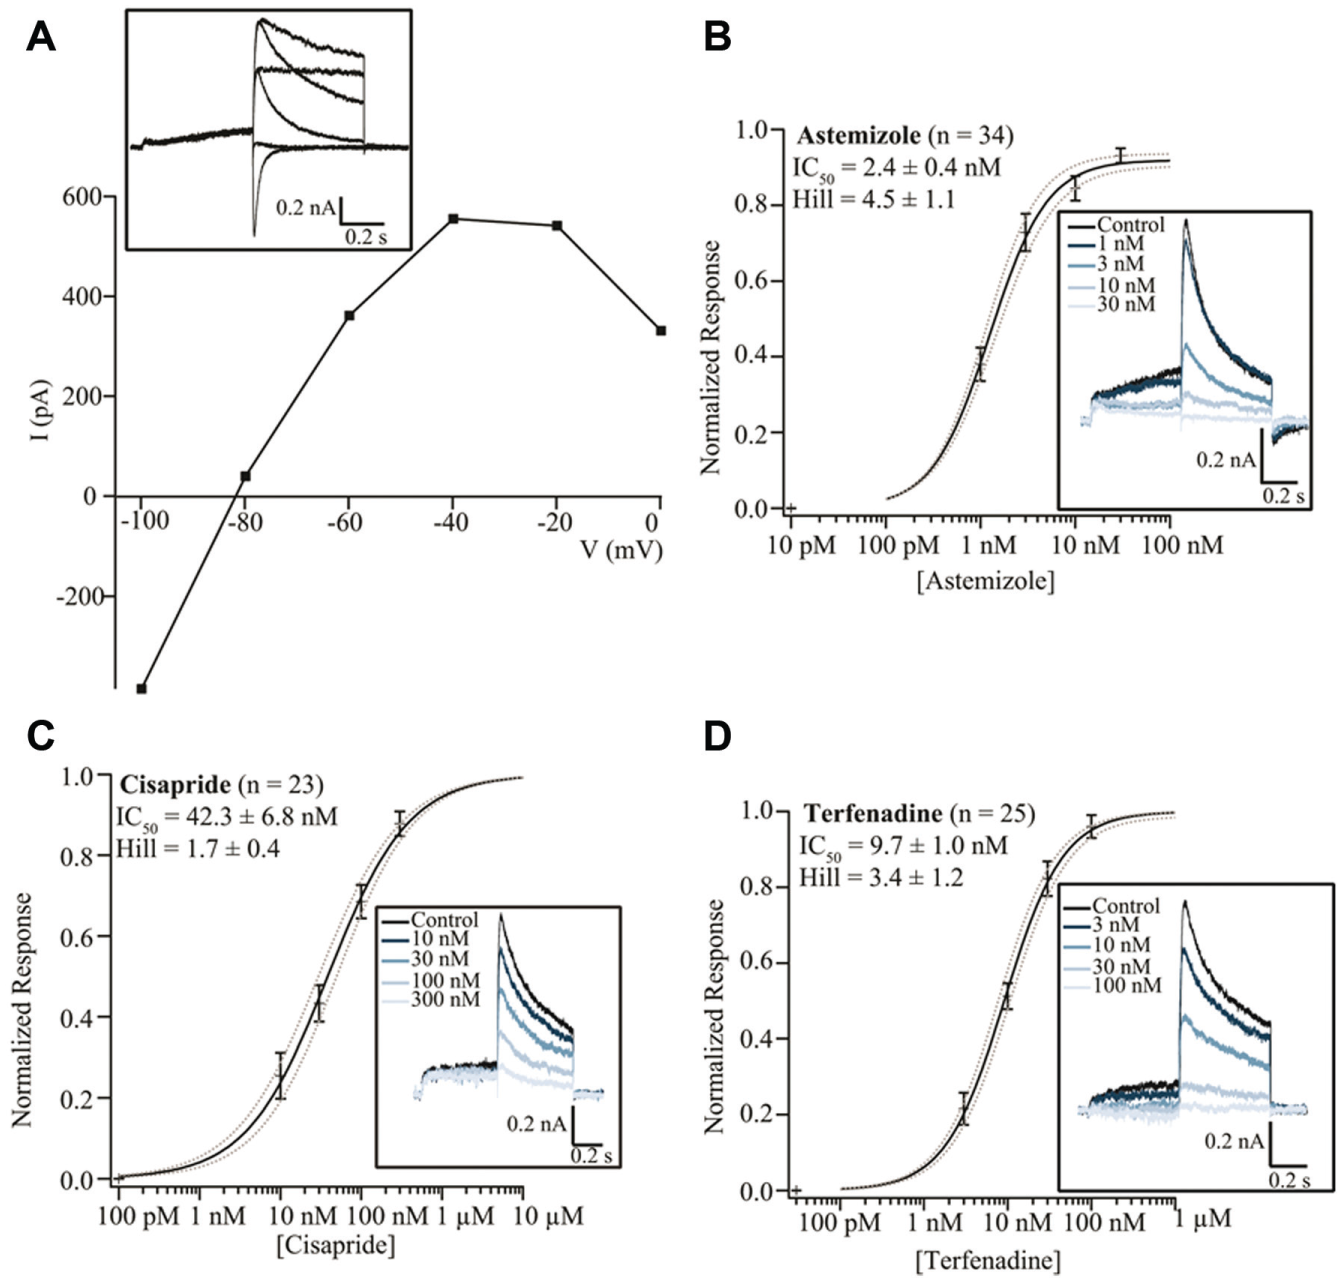
hERG current–voltage plot and pharmacology recorded on the Patchliner. (
IC50 Values for Astemizole, Pimozide, Cisapride, and Terfenadine on hERG-Mediated Currents Recorded on the SyncroPatch 384PE.
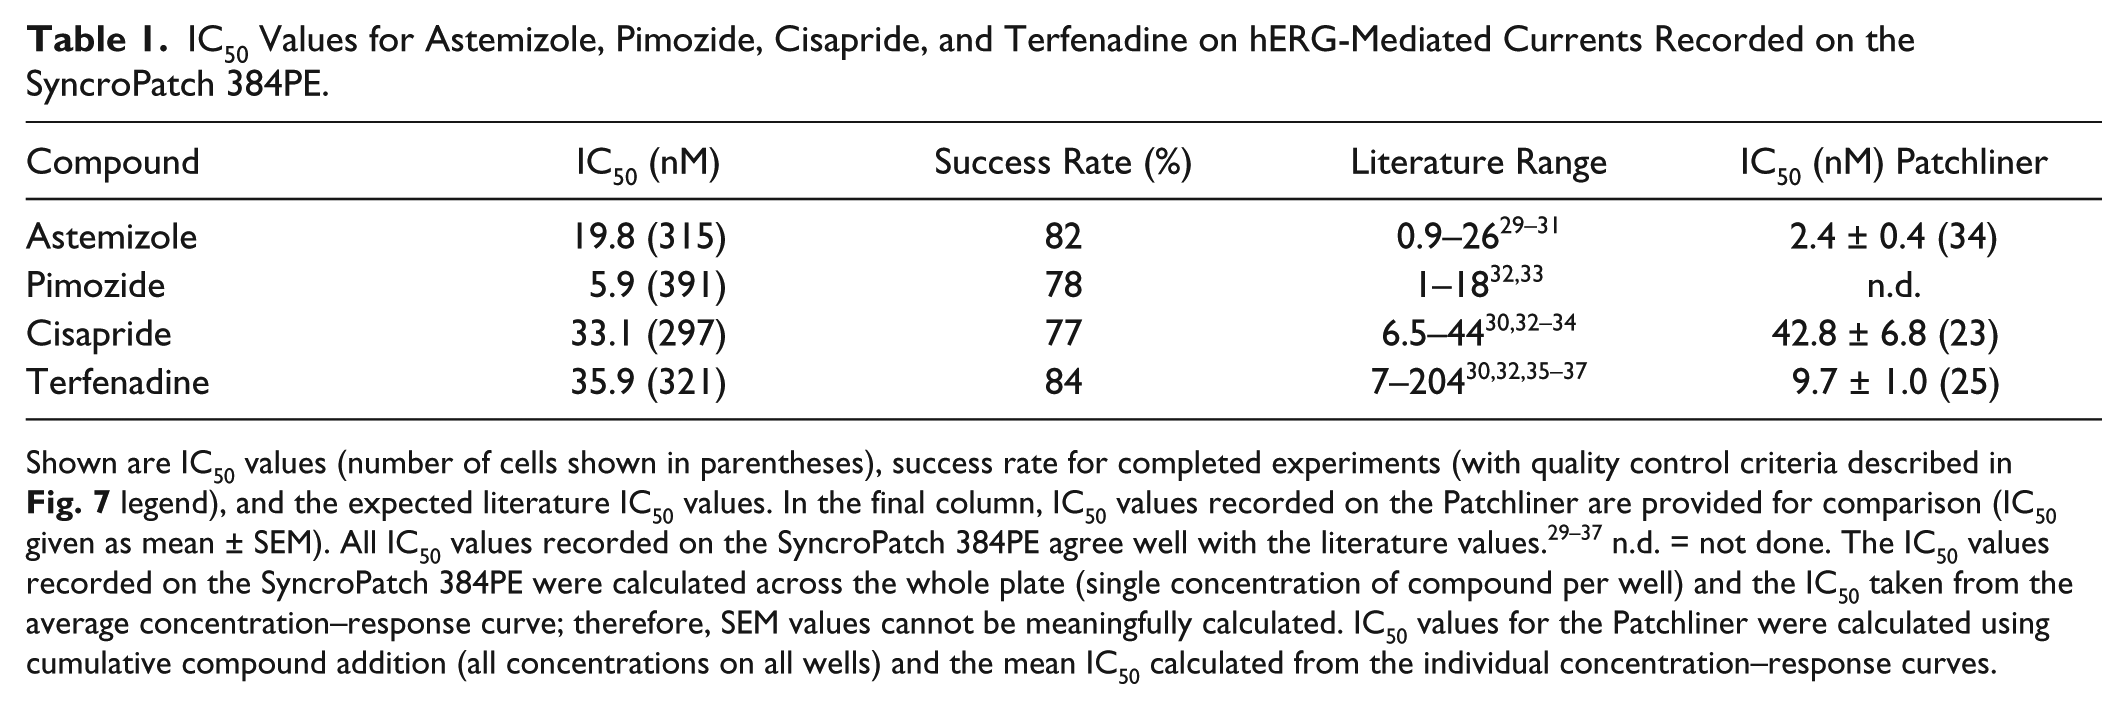
Shown are IC50 values (number of cells shown in parentheses), success rate for completed experiments (with quality control criteria described in Fig. 7 legend), and the expected literature IC50 values. In the final column, IC50 values recorded on the Patchliner are provided for comparison (IC50 given as mean ± SEM). All IC50 values recorded on the SyncroPatch 384PE agree well with the literature values.29-37 n.d. = not done. The IC50 values recorded on the SyncroPatch 384PE were calculated across the whole plate (single concentration of compound per well) and the IC50 taken from the average concentration–response curve; therefore, SEM values cannot be meaningfully calculated. IC50 values for the Patchliner were calculated using cumulative compound addition (all concentrations on all wells) and the mean IC50 calculated from the individual concentration–response curves.
In order to test external fluidic exchange times on the SyncroPatch 384PE, the inward rectifying potassium channel, Kir2.1, endogenously expressed in RBL cells (ATCC, Manassas, VA) was used. The external solution was exchanged from normal (low) K+ to an external solution containing high K+, and recordings were made at a constant holding potential of −80 mV. Figure 9 shows a recording from an example cell. The exchange time was approximately 50 ms. This exchange time is fast enough to reliably and reproducibly record GABAA-mediated responses shown in Figure 10 . Experiments were performed using a stacked solutions approach where wash solution was first aspirated into the pipette followed by ligand so that the ligand was rapidly washed away after application to minimize exposure time and desensitization. This approach has already proven successful with the Patchliner18,19 and SyncroPatch 96 19 for minimizing exposure time by avoiding lengthy solution pickup times. The patch clamp chip utilized a multihole per well format with four holes per well, as opposed to one hole per well. Figure 10A shows the PatchControl 384 software where HEK cells expressing the GABAA receptor subunit combination α1β2γ2 were activated three consecutive times with 5 µM GABA. The traces overlay almost exactly. Figure 10B shows an example of a cumulative concentration–response curve for GABA, and Figure 10C shows the concentration–response curve for GABA activation for an average of 328 cells recorded in one experiment revealing an EC50 for GABA activation of 3.5 ± 0.2 µM (n = 328), in good agreement with values reported in the literature. 38 A double stacked solutions approach was also used to investigate modulation of the GABAA receptor–mediated current. In the experiment shown in Figure 10D , 100 µM pentobarbital plus GABA (1 µM) was first aspirated into the pipette, followed by GABA alone (1 µM). In this way, receptors were first activated by the low concentration of GABA (1 µM), and this response was enhanced by application of the potentiator.
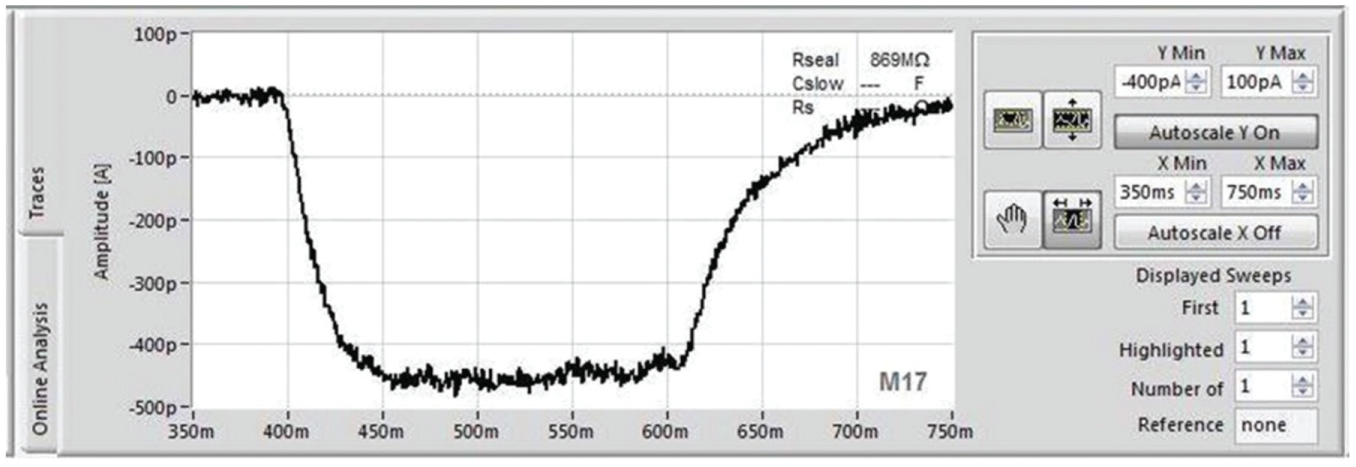
Solution exchange time measured on the SyncroPatch 384PE using Kir2.1 expressed in RBL cells. The external solution was exchanged to a high K+-containing solution and then back into normal external recording solution; the holding potential remained constant at −80 mV. Shown is the current response of an example cell. The solution exchange time for wash in, that is, the time to peak, was 50 ms.
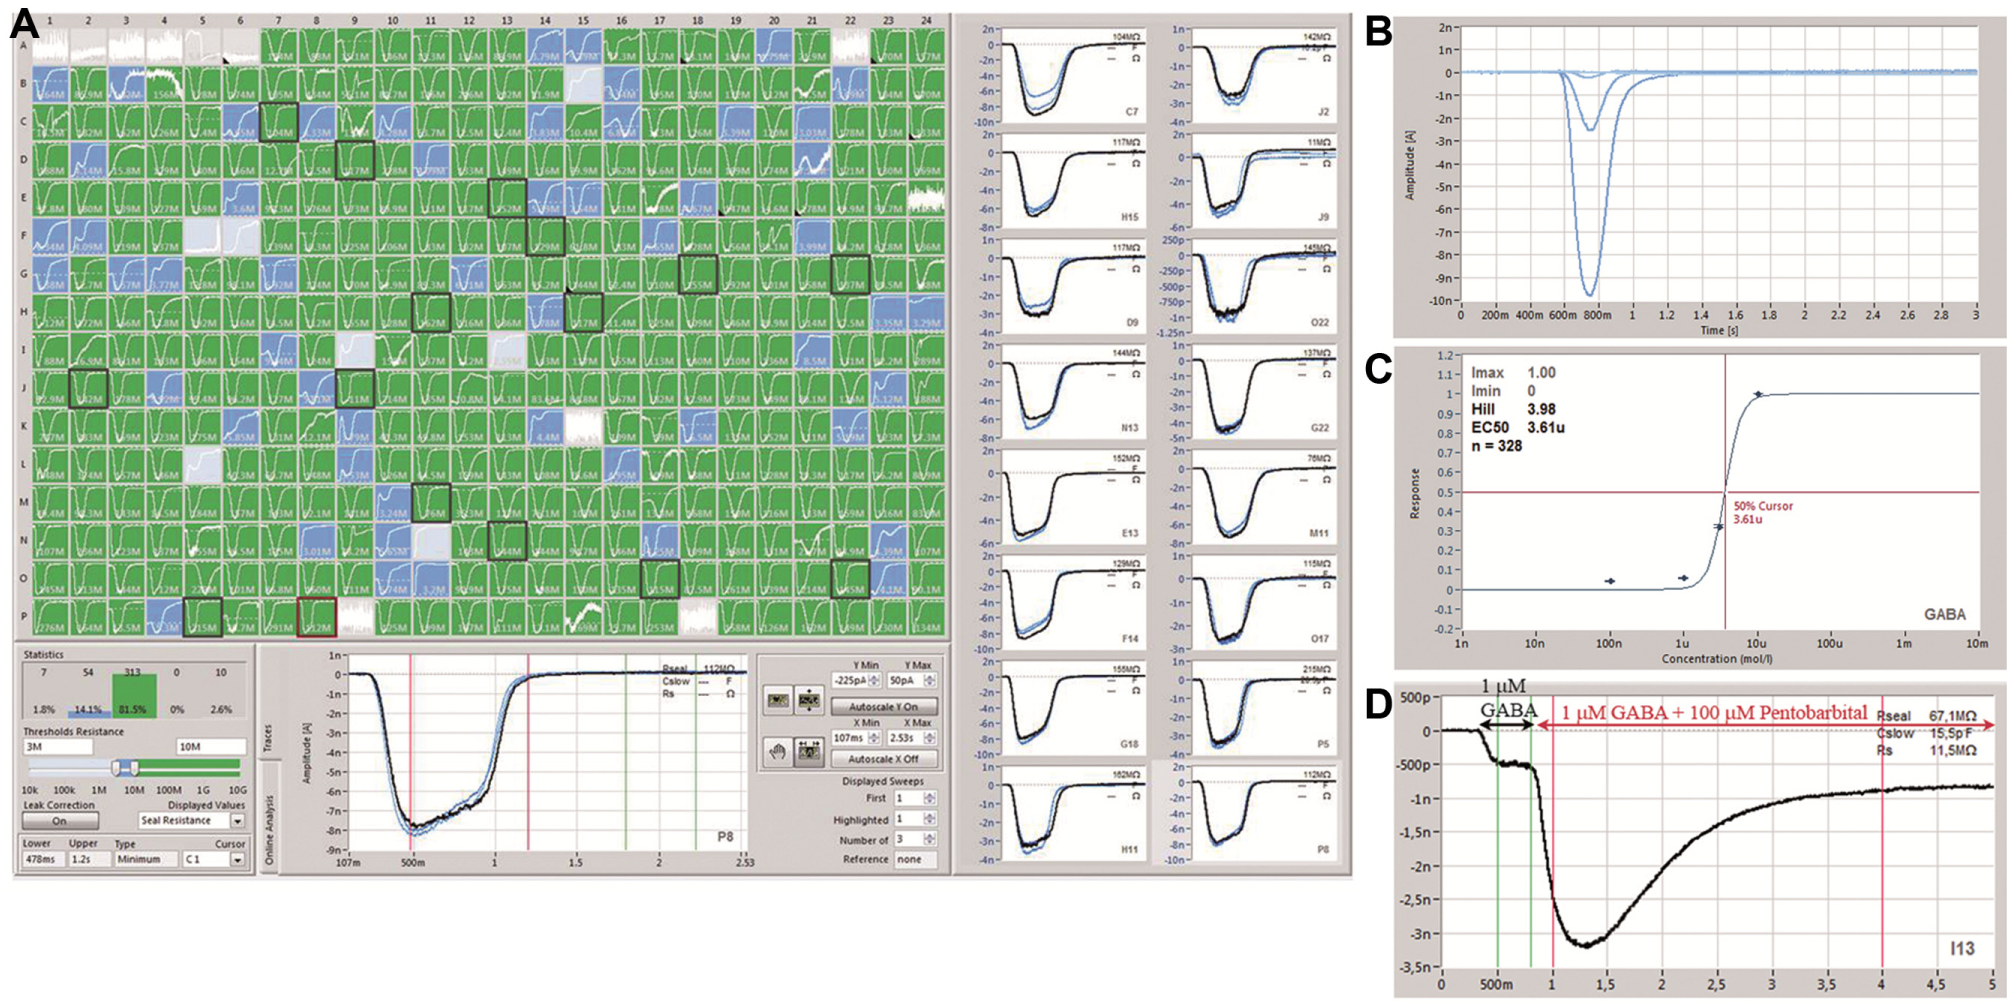
GABAA receptor–mediated responses on the SyncroPatch 384PE. (
By using a stacked solutions approach coupled with aspiration of small ligand volumes and a fast pipetting speed, exposure time is low enough to reliably and reproducibly record fast-desensitizing ligand-gated receptors such as glutamate receptors. Figure 11 shows GluA2 receptors expressed in HEK cells (University of Sussex, UK) and repetitive activation by glutamate. Raw data traces and corresponding online analysis of the peak amplitude over time of an exemplary cell are shown in Figure 11A and B , respectively. Receptors were activated with 100 µM Na-glutamate repeated three times, which resulted in inward currents of similar peak amplitudes. The current onset time was approximately 10 ms. Figure 11 (C,D) shows an example of a cumulative concentration–response curve for Na-glutamate (in mM: 0.1, 0.3, and 1).
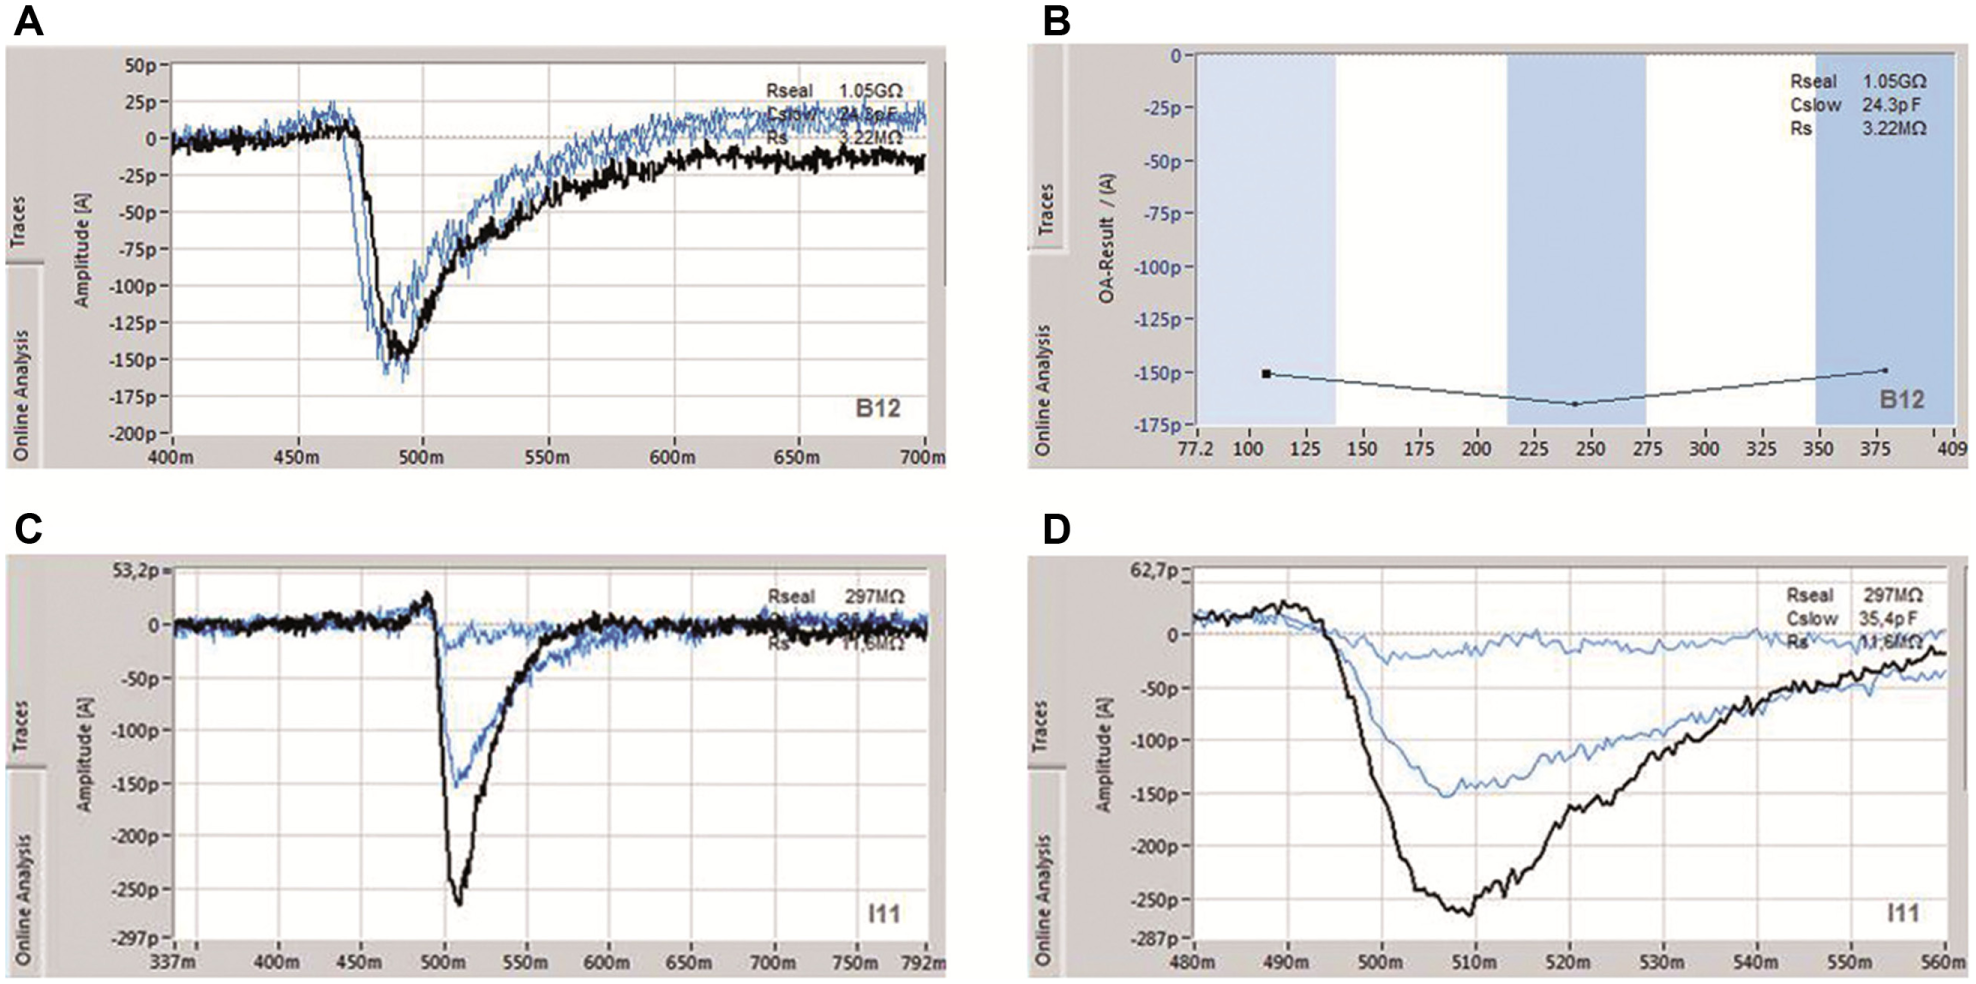
Fast solution exchange on the SyncroPatch 384PE exemplified by recordings of GluA2 receptor expressing HEK cells. (
In addition to cell lines that have been successfully used on the SyncroPatch 384PE, human iPSCs (iCell cardiomyocytes 2 , Cellular Dynamics International; Cor.4U, Axiogenesis) have also been recorded. Figure 12 shows a recording of iCells and Cor.4U cells on the SyncroPatch 384PE. In this experiment, half the plate (columns 1–12) received iCell cardiomyocytes 2 and the second half of the plate (rows 13–24) received Cor.4U cells. Shown are current responses to a voltage step protocol in Na+- and Ca2+-containing external solution. In these preliminary experiments, the success rate was approximately 50% for cells with a seal resistance of >200 MΩ at the start of the experiment. In most cells, both a fast and a slower component can be seen. The fast component is most likely mediated by the NaV1.5 channel and the slower component mediated by the voltage-gated L-type calcium channel. Optimization of cell culture and harvesting techniques is required to improve the success rate (based on seal resistance) before these cells can be routinely used in an HTS setting.
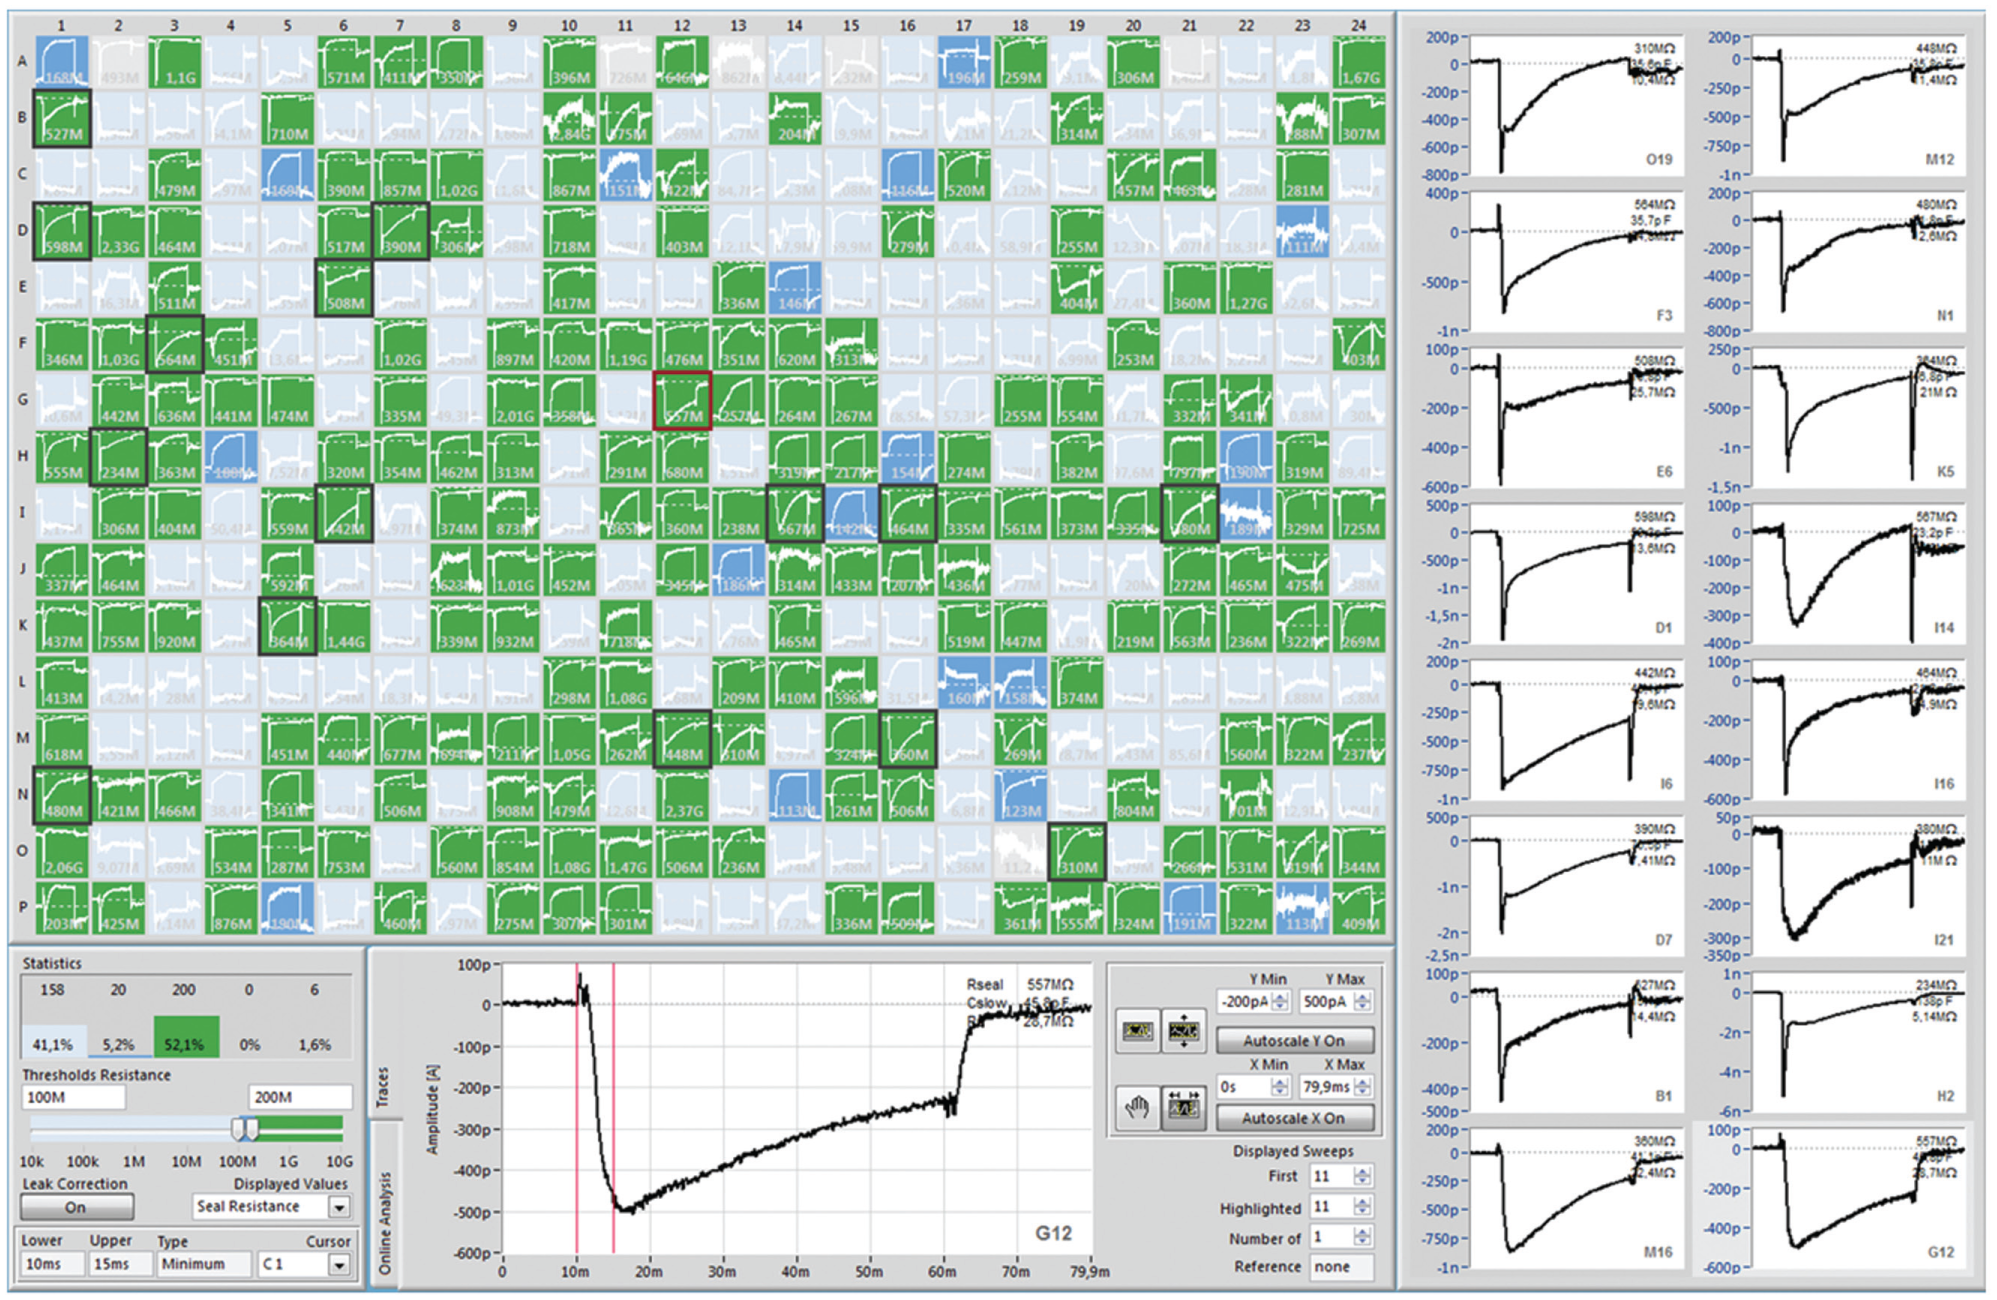
Voltage-gated Na+ and Ca2+ currents recorded from human iPSCs on the SyncroPatch 384PE. Screenshot of the PatchControl 384 software is shown during the recording of iCell cardiomyocytes 2 (Cellular Dynamics International; rows 1–12) and Cor.4U cells (Axiogenesis; rows 13–24). Currents were elicited using a voltage step protocol from −80 to 50 mV increasing in 10 mV steps (intersweep holding potential −100 mV). Shown is the current response at 30 mV. In this case, the color coding is based on seal resistance where all cells with a seal resistance of >200 MΩ are shown in green, cells with a seal resistance between 100 and 200 MΩ are shown in blue, cells with a seal resistance of <100 MΩ are shown in light blue, and wells that are disabled are shown in gray. In this experiment, more than 50% of cells had a seal resistance of >200 MΩ regardless of cell type (iCell cardiomyocytes 2 or Cor.4U). Sixteen wells are highlighted and are shown on the right. One cell is highlighted and shown in the bottom middle of the screen, and the statistical analysis parameters are shown at the bottom left of the screen. Recordings were made in a Na+- and Ca2+-containing solution, and in most cells, both a fast inactivating inward Na+ current and a slower inactivating Ca2+ current could be observed.
In conclusion, the SyncroPatch 384PE is a new modular system for automated patch clamp recordings that can be incorporated into different pipetting robotic systems for high-throughput recordings of ion channels. The system is capable of recording voltage-gated ion channels expressed in cell lines where a success rate of more than 80% for completed experiments (with defined quality control criteria) has been achieved. Additionally, external fluidic exchange is fast (<50 ms), and this coupled with low exposure times due to a stacked solutions approach ensures that ligand-gated ion channels expressed in cell lines can also be reliably recorded. The module contains 384-channel digital amplifier channels and a 384 pipettor head, ensuring that 384 cells are recorded truly in parallel. This, in combination with success rates for completed experiments of routinely more than 80% with strict quality control criteria and fast turnaround of experiments (each experiment took approximately 20 min to complete), results in an anticipated throughput of around 20,000 data points per 8 h day. Due to its modular design, two SyncroPatch 348PE modules may be incorporated into a single pipetting robot, thus almost doubling throughput. Since the SyncroPatch 384PE module is not restricted to a particular type of pipetting robot, it can be integrated into existing, preferred pipetting robots, making integration into HTS pathways considerably easier than is currently possible with available stand-alone automated patch clamp systems. The data quality, throughput, and flexibility of the system make it highly compatible with screening large compound libraries on ion channels.
Footnotes
Acknowledgements
We thank Anaxon for providing the CHO hNaV1.7 cell line, Merck Millipore for providing the HEK hERG cell line (for Patchliner experiments), Cellular Dynamics International and Axiogenesis for the human iPSCs (iCell cardiomyocytes 2 , Cor.4U), and John Atack of the University of Sussex, Brighton, UK, for the HEK GluA2 cell line. We also thank Bayer AG and Alfred George, Northwestern University, Chicago, for useful input in development of the software.
Declaration of Conflicting Interests
The authors declared no potential conflicts of interest with respect to the research, authorship, and/or publication of this article.
Funding
The authors received no financial support for the research, authorship, and/or publication of this article.