
Abstract
The Caco-2 permeability assay is a well-accepted in vitro model to evaluate compounds’ potential for oral absorption at early discovery. However, for many lipophilic compounds, no meaningful Caco-2 data could be generated due to their low solubility in assay buffer and/or poor recovery from the assay. In our previous study, we reported an organic catch approach to improve compound recovery. To further reduce compound loss and increase solubility in aqueous buffer, we explored the addition of bovine serum albumin (BSA). However, in contrast to the commonly used BSA level at 4%, a lower level of BSA was selected in an effort to minimize the potential risk of missing the identification of efflux substrates, and to avoid the extensive sample cleanup needed for 4% BSA. Through a systematic evaluation, it was found that 0.5% BSA was effective in enhancing compound solubility and reducing nonspecific binding, which allowed reliable assessment of the permeability and efflux potential for lipophilic compounds. Also, with an optimized sample handling process, no extra sample cleanup was required before liquid chromatography–mass spectrometry (LC-MS) analysis. The implementation of this assay has enabled accurate permeability assessment for compounds that had poor solubility and/or poor mass balance under the non-BSA assay conditions.
Introduction
The Caco-2 cell monolayer is the most widely used in vitro intestinal epithelial model to predict the in vivo absorption for new chemical entities (NCEs) at early drug discovery, due to the good correlation between the permeability coefficient (Pc) and oral absorption in humans. 1 In this model, sufficient compound solubility in aqueous assay buffer and good recovery are critical to generate and interpret the permeability results accurately. Poorly soluble compounds may not achieve the required concentrations in assay buffer to generate meaningful permeability results. Furthermore, compounds with low solubility are especially susceptible to poor recovery, as the limited quantities in solution may not saturate the nonspecific binding sites of the assay labware. Despite the challenges in assaying compounds with low aqueous solubility, it is important to be able to generate accurate data for these compounds as about 70% of the NCEs have poor aqueous solubility. 2 To accurately determine the Caco-2 permeability and efflux properties for these poorly soluble and/or low-recovery compounds, various approaches have been explored and reported. The most common approaches involve adding solubility-enhancing excipients to increase the compound aqueous solubility, as well as adding surfactants to reduce nonspecific binding.3,5 For example, Krishna et al. added up to 5% DMSO on the apical side to increase the solubility for lipophilic compounds and 4% bovine serum albumin (BSA) on the basolateral side to reduce compound retention by the cell monolayer and transwell surfaces. 3 Fossati et al. added fasted-state simulated intestinal fluid (FaSSIF) in the apical compartment and Hank’s Balanced Salt Solution (HBSS) with 1% BSA in the basolateral compartment for lipophilic acid drugs. 4 However, adding different agents to the apical and basolateral compartments may cause differential effects on a compound’s permeability rates from these compartments (A > B vs B > A) and thereby confound accurate determination of permeability and efflux. Additionally, having different agents in these two compartments may compromise accurate liquid chromatography–mass spectrometry (LC-MS) quantification since the compound may exhibit different matrix effects in these two media, resulting in biased permeability values. One further complication is that many commonly used solubility enhancers have been found to inhibit the efflux transporter Pgp (0.5% Tween 80 and 50% FaSSIF) or disrupt the Caco-2 cell monolayer (100% FaSSIF, 1% NMP, 1% Gelucir 44/14), all of which can compromise the ability to generate interpretable results for permeability and efflux. 6 Shah reported that BSA was benign to Caco-2 cells and adding 4% BSA to both the apical and basolateral sides greatly enhanced compound solubility and recovery, as well as circumvented the potential matrix effect difference. This approach worked well for a limited number of samples but was not suitable for the high-throughput settings at early drug discovery due to the difficulty of handling the somewhat viscous solution by automated liquid handlers and the necessity for extensive sample preparation prior to LC-MS quantification. Furthermore, the high concentration of BSA was reported to have caused the misidentification of efflux substrates in Caco-2 assays.7,8 Another group reported adding BSA at a lower level; however, protein precipitation by acetonitrile was still employed for sample cleanup, followed by centrifugation and supernatant removal prior to LC-MS analysis. 9 The additional offline sample preparation step would significantly increase the workload, and therefore reduce the throughput, which was not ideal in a drug discovery environment.
In this study, we put an emphasis on maintaining the throughput by optimizing the concentration of BSA as an additive in the Caco-2 assay. The optimal BSA concentration should be high enough to provide sufficient improvement to compound solubility and recovery and, at the same time, should be low enough to be compatible with existing high-throughput assay and analysis processes without introducing extra sample cleanup. It was found that with the addition of BSA at a 0.5% level, compound solubility and recovery increased significantly, which enabled accurate data generation for many poorly soluble compounds. Also, with the optimized sample handling procedure no extra sample cleanup was needed.
Materials and Methods
Materials
The Caco-2 cell line was obtained from the American Type Culture Collection (ATCC; Manassas, VA). Heat-inactivated fetal bovine serum (FBS), HBSS, and BSA were obtained from Sigma-Aldrich (St. Louis, MO). Type I Rat Tail Collagen was obtained from BD Biosciences (Billerica, MA).
Dulbecco’s Modified Eagle’s Medium (DMEM),
Propranolol, tolbutamide, and diclofenac were purchased from Sigma Chemical Co. (St. Louis, MO). High-performance liquid chromatography (HPLC)-grade acetonitrile, distilled water, formic acid, and methanol were purchased from J.T.Baker (Phillipsburg, NJ). All test compounds were from Discovery Chemistry, Bristol-Myers Squibb Co.
The 24-well Transwell plates (surface area = 0.33 cm2/well) with a polycarbonate membrane (0.4 μm pore size) were purchased from Corning (Corning, NY). Corning deep-well V-bottom assay blocks (Corning) and Whatman 96-well 0.45 µm PVDF Filter Blocks (GE Healthcare, Piscataway, NJ) were used for sample filtration prior to assay. V-Bottom 96-well plates from BD Biosciences were used for the sample collection after assay incubation.
Methods
Caco-2 Cell Culture and Bidirectional Assay
Caco-2 cells were maintained and seeded as described previously. 10 Prior to the assay, the Caco-2 monolayers seeded on Transwell plate membranes were washed three times with 0.5% BSA in modified HBSS buffer supplied with 10 µM HEPES at pH 7.4 to remove all traces of culture media. Test compound solutions were made by diluting 300 μM DMSO stocks 100-fold using 0.5% BSA in modified HBSS buffer and filtering with 0.45 μm PVDF Whatman filters. Final 3 μM solutions were added to either the apical (A → B direction) or basolateral (B → A direction) compartment and HBSS with 0.5% BSA was added on the other side. Transwells were incubated at 37 °C and 5% CO2 for 2 h. After incubation, 100 µL aliquots from all the apical and the basolateral compartments were transferred to the collection plates, which were preloaded with acetonitrile containing internal standard (IS) right before the collection to minimize nonspecific binding by coating the wells with organic solvent. The collection plates were sealed until analysis by LC-MS/MS.
Caco-2 Sample Analysis by LC-MS/MS
For the quantification, a set of 6-point curves were prepared for each compound in Caco-2 HBSS buffer containing 0.5% BSA at 1, 5, 50, 500, 2500, and 5000 nM. A simple dilution was then conducted by adding 100 µL of sample into an equal volume of preloaded acetonitrile containing the IS (500 nM tolbutamide for negative mode and 500 nM diclofenac for positive mode). Both the samples and calibration standard plates were vortexed vigorously and then centrifuged at 3275g for 30 min prior to LC-MS/MS analysis.
Analysis of the samples was conducted on an Aria LX-2 multiplexed high-performance LC-MS/MS system consisting of a Sciex 4000 mass spectrometer (Sciex, Framingham, MA), two sets of Shimadzu 20 AD binary pumps (Shimadzu Scientific Instruments, Columbia, MD), a Leap HTS autosampler with twin arms (Leap Technologies, Morrisville, NC), and a Thermo Fisher Scientific Valve Interface Module (VIM) for valve switching and stream selection. Multiplexing is commonly used as a way to improve the throughput through staggered LC injections and elutions from multiple columns, followed by alternated detection by one mass spectrometer. 11 To obtain the optimum selected reaction monitoring (SRM) conditions for sample analysis, MS/MS optimization for each compound was performed using DiscoveryQuant as reported previously. 12 A 5 µL aliquot of sample was injected and the separation was carried out on a Kinetex XB-C18 column (2.6 µm, 2.1 × 30 mm; Phenomenex, Torrance, CA) under a gradient elution using mobile phases A (0.2% formic acid in water) and B (0.2% formic acid in acetonitrile). The percentage of B was first held at 2% for 5 s and then ramped up to 98% in 25 s, where it was held for 20 s before being brought back to the starting composition. The total run time for each sample was about 1 min. A set of universal source parameters was used for data acquisition by mass spectrometer that was equipped with an electrospray ion source. The ion spray energy was set at 4 kV, the vaporizer temperature at 600 °C, the curtain gas at 25, gas 1 at 60, and gas 2 at 50. After the data acquisition, peak integration and data processing were conducted through GMSU software (Gubbs, Inc., Alpharetta, GA).
Data Analysis
The Pc was calculated according to the following equation:

where dA/dt was the flux of the test compound across the monolayer (nm/s), S was the surface area of the cell monolayer (0.33 cm2), and C0 was the initial concentration (µM) at T0. The Pc values were expressed as nm/s.
Compound recovery, which measures compound loss during the assay, was calculated using the following equation:

where CD,2hr and CR,2hr refer to the compound concentration at the donor side and receiver side at 120 min, respectively. VD and VR were the volumes of the solution in the donor and receiver wells. C0,0hr was the initial concentration as in eq 1.
Results and Discussions
We previously reported a postassay organic catch approach to improve compound recovery in Caco-2 assays during the analysis process. 10 Briefly, the sample collection plates were preloaded with organic solvent containing IS to minimize the nonspecific binding prior to sample transfer. With its implementation, the percentage of compounds with good recovery (>70%) greatly increased from 33% to 60%. However, 40% of early-discovery compounds still showed poor recovery in the Caco-2 assay. Moreover, based on our historical data, 34% of compounds were either undetected (defined as initial concentration [T0] <50 nM out of a dosing concentration of 3000 nM) or had very low initial concentration (defined as T0 between 50 and 850 nM). These low initial concentrations were likely due to the compounds’ poor aqueous solubility and/or adsorption loss during filtration. To generate quality data for these categories of compounds, serum albumin was evaluated as an additive based on its known effect on enhancing solubility and reducing nonspecific binding to plastics. In addition, serum albumin has been shown to be benign toward Caco-2 cells and is compatible with automated liquid handling techniques.
Identify the Level of BSA to Reduce Adsorption
To mimic the physiological conditions, a BSA concentration at 4% (w/v) was typically used in the Caco-2 assay for its physiological relevance.5,7 There have been reports that adding 4% BSA achieved significant improvement in Caco-2 data quality. However, for samples containing 4% BSA, additional sample cleanup, typically through protein precipitation, was required prior to LC-MS/MS analysis to maintain LC column life and minimize signal suppression in MS detection. This additional sample cleanup would not be desirable in an early-discovery ADME (absorption, distribution, metabolism, excretion) profiling environment where high throughput and fast turnaround time are required. In this study, we explored adding a lower level of BSA to circumvent additional sample cleanup steps while maintaining its favorable effect on solubility and recovery enhancement.
To identify the lowest level of BSA that can effectively minimize adsorption to plastic labware, a group of low-recovery compounds was selected and spiked in HBSS assay buffer containing different BSA concentrations ranging from 0% to 4% (w/v). Four sequential transfers were conducted every 30 min in a 96-well plate, and aliquots from each well were taken and added to an equal volume of IS in acetonitrile for all BSA levels except for 4% BSA, for which a 1:3 protein precipitation was conducted and the supernatant was taken out for analysis by LC-MS/MS. Sequential transfer is a quick and simple way to identify an adsorption issue in bioanalysis. If a compound “sticks to” the plastic wells, increasing compound loss would occur each time the sample is transferred to a new well as contact with more fresh plastic surface area occurs. 13
Data obtained from the representative compound A are presented in Figure 1 . Among the six tested BSA concentrations (0%, 0.05%, 0.1%, 0.25%, 0.5%, and 4%), 0.05% and 0% BSA showed a similarly steep compound loss (from 100% to 14% after the first-time transfer). At BSA concentrations from 0.1% to 4%, the compound showed no appreciable loss, which indicated that compound adsorption to plastics was minimized. Furthermore, there was no noticeable difference between 0.1% and 4% BSA, indicating that a BSA concentration above 0.1% would be sufficient to minimize adsorptive loss.
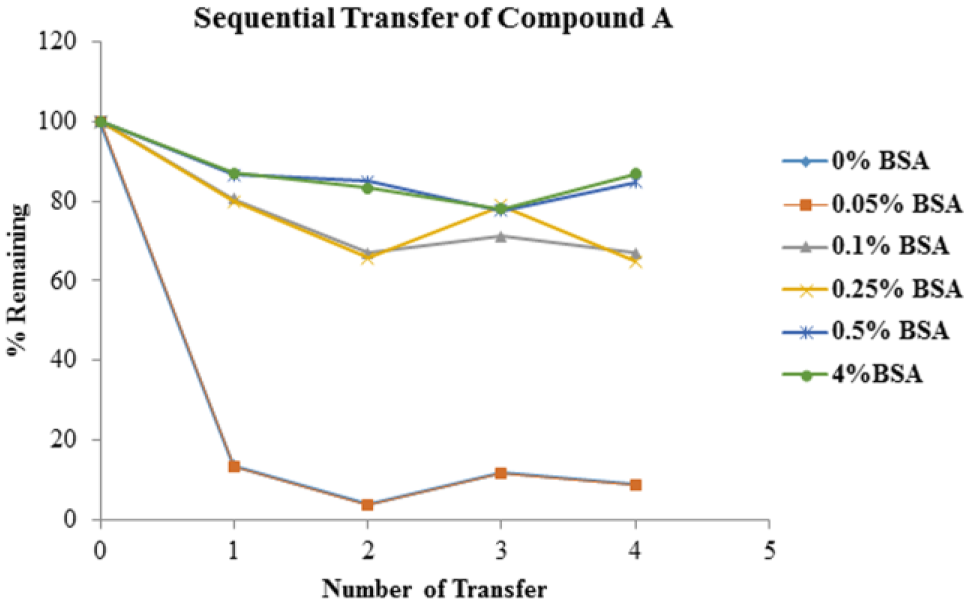
Compound loss in Caco-2 buffer with various BSA concentrations through sequential transfer. The addition of 0.1%–4% BSA to HBSS buffer minimized the compound adsorption loss. The addition of 0.05% BSA showed the same loss as 0% BSA due to nonspecific binding.
Identify the Level of BSA to Improve Compound Solubility
To identify the level of BSA needed to improve compound solubility, a group of compounds with low observed initial concentrations (T0) in assay were prepared in HBSS buffer with various BSA concentrations (0%, 0.1%, 0.25%, 0.5%, and 4%) and filtered before quantification by LC-MS/MS.
There was a significant increase in these compounds’ initial concentrations at all of the BSA concentrations from 0.1% to 4% in comparison with T0 in pure HBSS buffer. For example, for one of the compounds, the initial concentration without BSA was very low at around 120 nM. With the addition of 0.1% BSA to the HBSS buffer, the T0 increased to 1600 nM. Similarly, increased T0 was observed at 0.25%–4% BSA concentrations. An adequate initial concentration was necessary to generate accurate permeability data, since otherwise a more sensitive LC-MS/MS method with LLOQ at 1 nM or lower would be required to correctly identify compounds with low permeability values. Based on our results, the addition of BSA from 0.1% to 4% has been shown to be able to increase the T0 above 850 nM for a set of 10 BMS test compounds with low aqueous solubility.
Effect of BSA on Compound Recovery
Following the observation that a BSA level from 0.1% to 4% could effectively reduce nonspecific binding and improve compound solubility, we investigated the effect of various BSA concentrations on compound recovery. For this test, a compound set enriched with low-recovery compounds was put through the Caco-2 assay with various concentrations of BSA. Regardless of the BSA concentrations (0.1%, 0.5%, and 4%), the addition of BSA enhanced the recovery of the compounds. Also, as the BSA level increased the number of compounds with acceptable recovery (>70%) increased.
Effect of BSA on Pc Value
Having observed that the addition of BSA was able to increase compound solubility and recovery in the Caco-2 assay, next we examined the effect of BSA on permeability values. From our experience, it was noted that a significant increase in the recovery could result in changes in the determined permeability values. Therefore, we chose a set of 10 commercial and BMS proprietary compounds that had good recovery (>70%) without the addition of BSA in an effort to remove that confounder from the interpretation of the data. The seven controls are well-known literature compounds covering various permeability categories. Nadolol and atenolol have low permeability; verapamil is highly permeable; and digoxin, sufasalzine, and cladribine are transporter substrates. Proprietary compounds B and C have low permeability, while compound D has a high efflux ratio and is highly protein bound. This set of compounds was assayed in the Caco-2 assay with various concentrations of BSA, and the permeability values were determined and efflux ratios were calculated. For many compounds, there was no distinct effect on permeability values or efflux transporter assessment (defined as an efflux ratio of >2). Furthermore, at concentrations of 0.5% BSA and below there was an excellent correlation between Pc values generated with and without BSA. However, for a small percentage of compounds, there was a clear relationship between increasing BSA concentrations and decreasing Pc values such that at 4% BSA, the well-characterized efflux transporter substrate sulfasalazine was no longer identified as an efflux substrate ( Fig. 2 ). The same impact was observed by other researchers.7,8
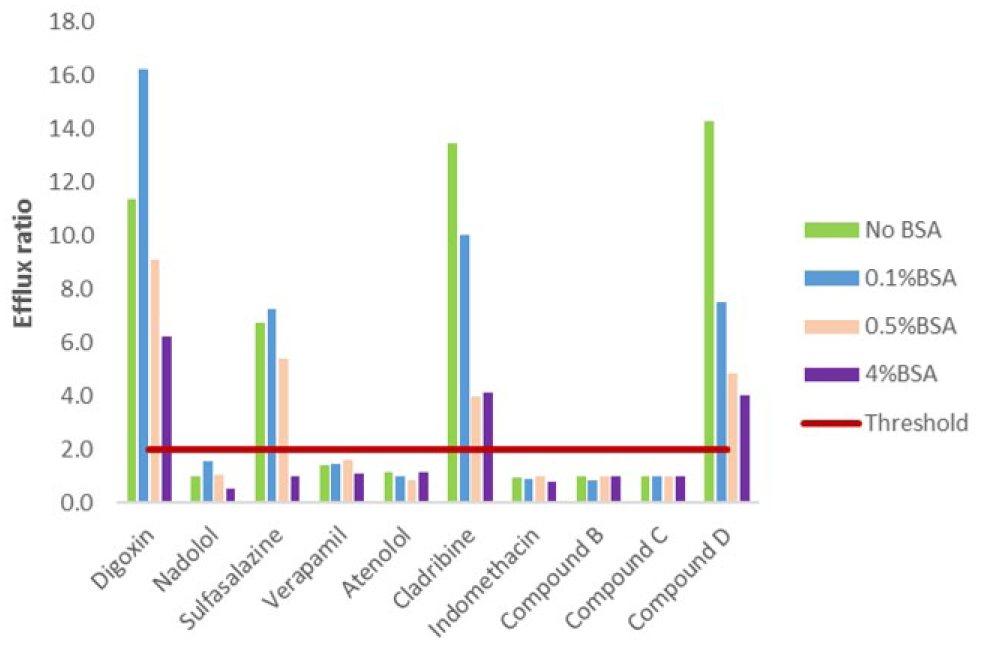
Effect of various BSA levels on compounds’ efflux ratio for the identification of efflux substrate. With increasing BSA concentrations, a decreased efflux ratio for some efflux substrates was observed.
For compounds that showed suppressed permeability values in the presence of BSA, one shared characteristic was that they were highly protein bound. Therefore, it has been suspected that protein binding may cause Pc suppression, as a highly protein bound compound might have less free fraction to traverse the membrane. This hypothesis was supported by the low free fractions determined by using a protein binding assay for these outliers. 14 For example, sulfasalazine had a 0.2% free fraction and showed significantly reduced Pc values with BSA. This could also explain why, when the BSA level increased from 0.1% to 0.5% to 4%, additional outliers were detected since fewer and fewer free compounds were available due to protein binding. For this reason, 4% BSA was not optimal with the higher possibility of Pc disconnect. At 0.1% and 0.25% BSA, large data variation was observed among the replicates and across intraday tests. Therefore, 0.5% BSA was selected for further tests.
To evaluate the extent to which protein binding would give rise to outliers at 0.5% BSA, a test set enriched with highly protein bound compounds (<2% free; data not shown) was tested in Caco-2 with or without 0.5% BSA. Again, we selected compounds that had good recovery in the standard Caco-2 assay without serum albumin, to eliminate recovery as a confounder in result interpretation. As can be seen in Figure 3 , there was a good correlation of Pc values at ±0.5% BSA even in this highly protein bound compound set. Furthermore, using the bin system of Pc <100 for low/medium permeability and Pc >100 for high permeability, we found that 86 of 90 obtained Pc values from both directions fell in the correct bin with or without BSA. This indicated that the probability of generating incorrectly binned Pc values with the addition of 0.5% BSA was remote. However, the slight possibility of Pc suppression with 0.5% BSA prompted us to keep the non-BSA assay in place to verify those compounds that have been advanced to a later stage. For the majority of the early-discovery compounds, the addition of 0.5% BSA in the Caco-2 assay has been a beneficial and practical way to generate interpretable data.
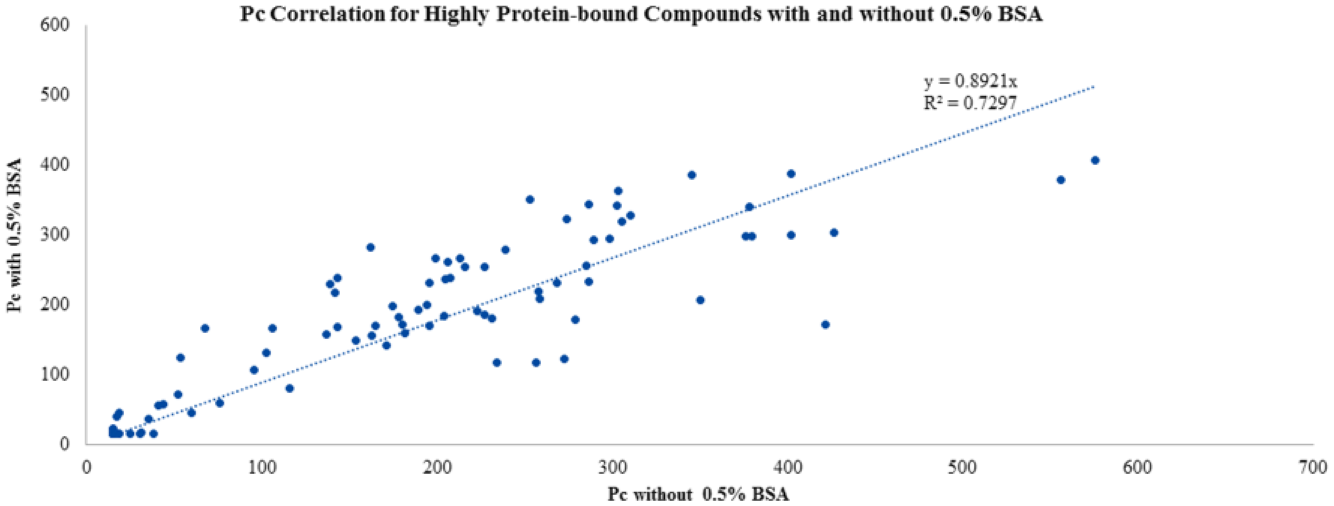
Effect of 0.5% BSA on permeability values for a set of highly protein bound compounds. Good correlation of Pc values at ±0.5% BSA in this set of highly protein bound compounds was observed.
In summary, based on the results from adsorption, solubility, recovery, and permeability experiments under various BSA concentrations, 0.5% BSA offered the most optimum benefits/risk profile in terms of increasing solubility and recovery with minimized impact on Pc values and efflux substrate identification for the vast majority of compounds. Therefore, 0.5% BSA was chosen to be added to the assay buffer in the modified assay.
Overcome Bioanalytical Challenges with 0.5% BSA to the Assay Samples
Reduced Column Life
After a BSA level of 0.5% was selected to be added to the assay buffer, a series of validation tests were conducted side by side with non-BSA assays. With 0.5% BSA in assay samples, faster LC backpressure buildup and more frequent column blockage were also observed, which was not surprising with BSA in the samples. To address this challenge, various sample handling procedures were evaluated to extend column life. The best practice was found to be vigorously vortexing the sample plates for 30 s, followed by centrifugation at higher speed (3270g) for a longer time (30 min) compared with the previous practice at 590g for 2 min for non-BSA samples. In addition, the autosampler syringe needle height was raised to prevent disturbing the precipitated protein pellet in the bottom of the wells. With these measures, a normal column life was maintained, with only a slightly more frequent precolumn cartridge replacement than in the non-BSA assay.
Internal Standard Variation
During the initial validation process, it was also observed that the existing IS propranolol showed a large variation in its response in the BSA-containing samples compared with that in non-BSA samples. As shown in
Figure 4
, for one of the control (verapamil) samples the peak area variation for IS propranolol in non-BSA samples was within ±13%, while its variation in 0.5% BSA samples reached ±65% (
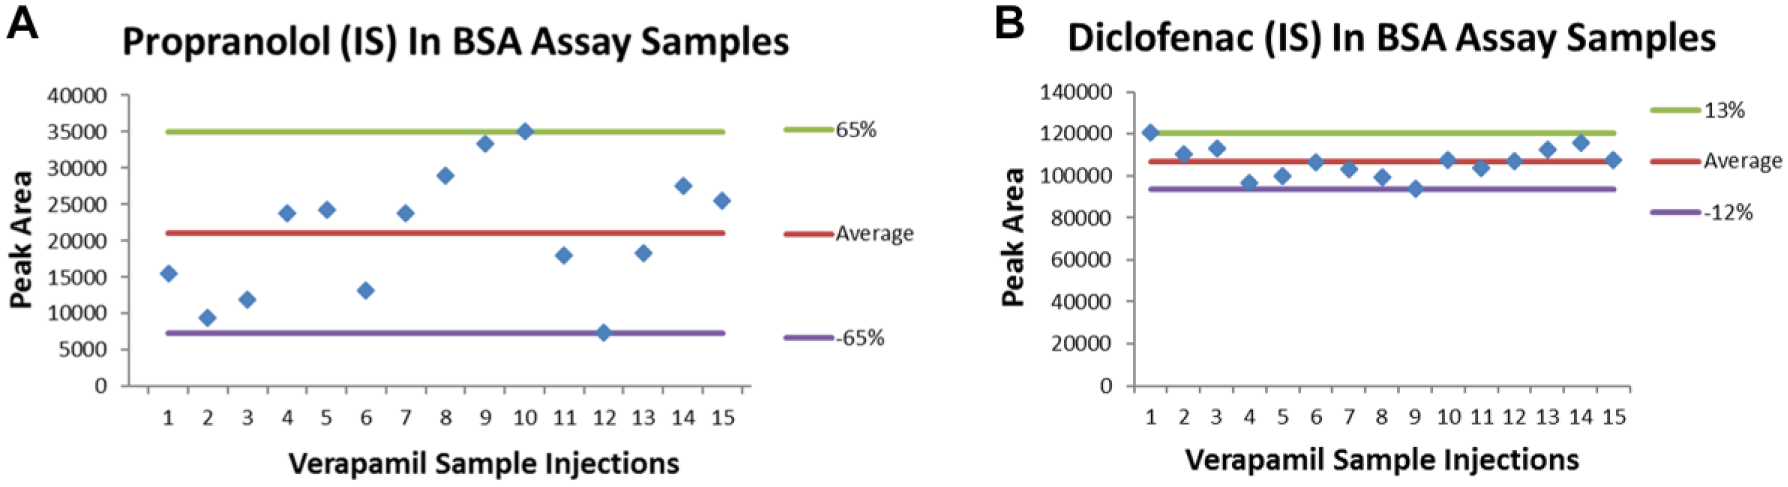
IS variation in BSA-containing samples. Propranolol (
This demonstrated that even for early-eluting compounds, the optimized sample processing procedure with diclofenac as IS was effective in minimizing matrix effect and generating reproducible data. Our positive experience with thousands of compounds after the implementation of the BSA Caco-2 assay further confirmed this observation.
Improved Compound Recovery and Solubility in the New BSA Assay
After resolving the bioanalytical challenges in the BSA assay, we implemented the assay in routine discovery support at BMS. Overall, with the addition of 0.5% BSA in the assay system, significant improvement of data quality was observed, especially for compounds with poor aqueous solubility and/or with low recovery. In addition, a comparison of recovery and T0 data from a 9-month period before and after the BSA assay implementation showed a remarkable improvement in Caco-2 data quality. Under the enhanced 0.5% BSA assay, 85% compounds showed good recovery compared with 60% under the non-BSA assay. In addition, the very poor-recovery compounds (<40%) decreased from 20% to 2%. For initial concentration, 94% of the compounds had T0 >850 nM under 0.5% BSA, which enabled better Pc resolution compared with 66% from the non-BSA assay. Previously, 12% of test compounds were undetected due to very low aqueous solubility, and no data could be generated. This number decreased to only 1% under the BSA assay with improved aqueous solubility.
In this study, we optimized the level of BSA as an additive added to both chambers in a high-throughput bidirectional Caco-2 assay, by successfully balancing the need for solubility enhancement and/or prevention of nonspecific binding, and the requirement for maintaining accurate efflux substrate prediction. The implementation of the BSA additive assay has greatly improved compound solubility and recovery, which enabled the accurate Caco-2 data generation for many compounds that had previously failed in the non-BSA assay. In addition, through an optimized sample handling process, the overall throughput has been maintained with minimal changes made to the current assay and analysis process.
Footnotes
Declaration of Conflicting Interests
The authors declared no potential conflicts of interest with respect to the research, authorship, and/or publication of this article.
Funding
The authors received no financial support for the research, authorship, and/or publication of this article.