
Abstract
Myelosuppression is a major side effect of chemotherapy in cancer patients and can result in infections, bleeding complications, and increased risk of morbidity and mortality, as well as limit the drug dose and frequency of administration. Chemotherapy-induced myelosuppression is caused by the disruption of normal hematopoiesis. Thus, prior understanding of the adverse effects of chemotherapies on hematopoietic cells is essential to minimize the side effects of cancer treatment. Traditional methods such as colony-forming assays for studying chemotherapy-induced myelosuppression are time-consuming and labor intensive. High-throughput flow cytometry technologies and methods to detect rare hematopoietic cell populations are critical in advancing our understanding of how different blood cell types in complex biological samples respond to chemotherapeutic drugs. In the present study, hematopoietic progenitor cells were induced to differentiate into megakaryocytes and myeloid lineage cells. The expanded cells were then used in a multiplexed assay to monitor the dose-response effects of multiple chemotherapies on different stages of megakaryocyte differentiation and myeloid cell populations in a 96-well plate format. The assay offers an alternative method to evaluate the myelosuppressive potential of novel chemotherapeutic drugs compared to traditional lower throughput and labor-intensive assays.
Introduction
Myelosuppression is a common side effect of chemotherapy, increasing the risk of infections, as well as hemorrhagic complications that affect the efficiency of cancer treatment, and may also result in reduced overall survival of cancer patients. 1 Myelosuppression is mainly caused by the impairment of hematopoietic stem and progenitor cells in the bone marrow and in peripheral blood. 2 Hematopoietic stem cells (HSCs) primarily reside in the complex bone marrow microenvironment and give rise to distinct blood cell types such as erythrocytes, megakaryocytes/platelets, neutrophils, mast cells, basophils, eosinophils, T and B lymphocytes, natural killer (NK) cells, and dendritic cells (DCs).3,4 Different types of cytopenias can arise when the normal hematopoietic system is disrupted by the adverse effects of chemotherapeutic drugs. Thrombocytopenia is one of the most common side effects of chemotherapy due to the inhibition of the early stages of megakaryocyte and platelet development. 5 Chemotherapies may also impair the self-renewal ability and differentiation capacity of HSCs, which can lead to bone marrow failure, and increase mortality and morbidity. 6 Furthermore, despite the clinical importance of chemotherapy-induced myelosuppression, there is little information about the effects of chemotherapies on the different stages of megakaryocyte and myeloid cell development. Thus, assays that can screen for these effects early in the drug development process are needed to avoid drugs likely to fail during clinical development. In addition, these assays can also be used to identify novel, alternative remedies that may prevent chemotherapy-induced myelosuppression.
Megakaryocytes and myeloid progenitor cell populations are rare, with megakaryocytes representing 0.03% of total bone marrow cells and 0.01% of peripheral blood cells in humans, while monocytes represent 5% to 10% of peripheral leukocytes.7,8 Megakaryocytes are derived from myeloid progenitors and function to produce blood platelets and therefore play an important role in blood coagulation. Myeloid progenitors can also develop into a variety of other cell types with wide-ranging functions, from oxygen-carrying erythrocytes to immune surveillance mediators (e.g., macrophages, neutrophils, basophils, eosinophils, mast cells). The development of these different cell types is dependent on a well-orchestrated set of signaling cues, as well as the surrounding microenvironment. However, chemotherapy treatment of cancer patients may induce permanent damage to the bone marrow microenvironment and inhibit the development of different hematopoietic cells.
Studying these rare cell populations in vitro is difficult due to the lack of pure and abundant megakaryocytes and myeloid progenitor cells. Traditional methods, such as immunohistochemistry, are labor intensive and limited by the number of antibodies that can be multiplexed to identify specific cell types. 9 Colony-forming cell assays are also labor intensive and time-consuming and can only be used to screen a limited number of drugs and drug concentrations. 10 While standard flow cytometry can distinguish different cell types, the typical assay is based on sample-by-sample analysis involving relatively large volumes, which significantly increases the assay time and reagent cost. Advanced flow cytometry instruments allow for multiple orders of magnitude in fluorescence intensity and rapid sampling with new fluidic technology developments. Specifically, the evolution in sampling introduced with the HyperCyt(IntelliCyt, Albuquerque, NM) instrument allows for very small sample quantities to be analyzed very quickly with minimal dead volume. 11 Combined with a sensitive flow cytometer, small cell populations can be detected from limited samples. Such advances can be widely used in hematology, where standard flow cytometry is commonly used in clinical laboratories and could replace colony-forming assays.10,12
In an attempt to overcome the limitations of traditional in vitro myelosuppression screening methods, we developed a multiplexed screening assay using CD34+ hematopoietic progenitor cells (HPCs) purified from peripheral blood (PB) and bone marrow (BM) samples from healthy donors, which were induced to megakaryocyte and myeloid differentiation and maturation in serum-free liquid culture with added cytokines. To investigate chemotherapy-induced myelosuppression, we analyzed the effects of 14 different chemotherapeutic drugs representing different drug classes, including anthracyclines, alkylating agents, nucleoside analogues, demethylation agents, kinase inhibitors, histone deacetylase inhibitors, and BCL-2 inhibitors, which were plated in five concentrations in a 10,000-fold concentration range. Using an iQue Screener PLUS instrument (Intellicyt, Albuquerque, NM), we could assess the effect of these compounds in parallel on the expanded megakaryocytes and myeloid cells. Application of this assay may be helpful in the drug development process and provide insight on the adverse effects of novel chemotherapies on healthy hematopoiesis.
Materials and Methods
Reagents and Antibodies
StemSpan SFEM II cell culture medium, StemSpan Megakaryocyte Expansion Supplement containing recombinant human stem cell factor (SCF), interleukin-6 (IL-6), interleukin-9 (IL-9) and thrombopoietin (TPO), EasySep Human CD34 Positive Selection Kit, RoboSep buffer, and the EasySep magnet were from STEMCELL Technologies (Vancouver, Canada). All cytokines were dissolved in StemSpan SFEM II media. The 10× Annexin V binding buffer, anti-human CD45-FITC (clone H130), anti-human CD14-BV421 (clone M5E2), anti-human CD16-BV786 (clone 3G8), anti-human CD41a-APC (clone HIP8), anti-human CD42b-PE (clone HIP1), anti-human CD11b-BV605 (clone ICRF44), anti-human HLA-DR-PECy7 (clone G46-6), CD19 (clone HIB19), CD56 (clone B159), CD3 (clone SK7)/7AAD in PerCPCy5.5, and IgG controls with corresponding fluorochromes were purchased from BD Biosciences (San Jose, CA). We used UltraComp eBeads compensation beads purchased from Thermo Fisher Scientific (Carlsbad, CA). All drugs were purchased from chemical vendors as follows: azacitidine, cytarabine, etoposide, gemcitabine, midostaurin, and paclitaxel from MedChem Express (Monmouth Junction, NJ); carboplatin, cisplatin, and vincristine from Selleck (Munich, Germany); ruxolitinib and venetoclax from ChemieTek (Indianapolis, IN); doxorubicin from Sigma-Aldrich (Darmstadt, Germany); panobinostat from LC Laboratories (Boston, MA); and lidocaine from ENZO Life Sciences (Farmingdale, NY).
Isolation of Hematopoietic Progenitor Cells from Healthy Peripheral Blood and Bone Marrow Samples
For the study, we used three PB samples and one BM sample (50–80 mL), which were obtained from 20- to 50-year-old healthy donors after written informed consent using protocols approved by the local institutional review board and in accordance with the Declaration of Helsinki. The PB and BM samples were collected in EDTA blood collection tubes. Mononuclear cells (MNCs) were isolated by density gradient separation (Ficoll-Paque PREMIUM; GE Healthcare, Little Chalfont, Buckinghamshire, UK). The collected MNCs were washed three times in phosphate-buffered saline (PBS) containing 2% fetal calf serum with centrifugation at 120 g for 10 min to remove platelet contamination. 13 CD34+ cells were purified from the MNC fraction using the EasySep Human CD34 Positive Selection Kit according to the manufacturer’s instructions. In brief, MNCs were incubated with the human CD34+ selection antibody cocktail for 15 min followed by magnetic nanoparticle positive selection cocktail for another 10 min in a 14-mL polystyrene round-bottom tube at room temperature. After incubation, CD34– cells were excluded and CD34+ cells were collected using an EasySep magnet. The isolated CD34+ cells were analyzed for megakaryocytes and myeloid cells at day 0 by flow cytometry using the iQue Screener PLUS platform (Intellicyt), while viability and the cell number were calculated using the Countess automated cell counter (Thermo Fisher Scientific).
Expansion of Megakaryocytes from Hematopoietic Progenitor Cells
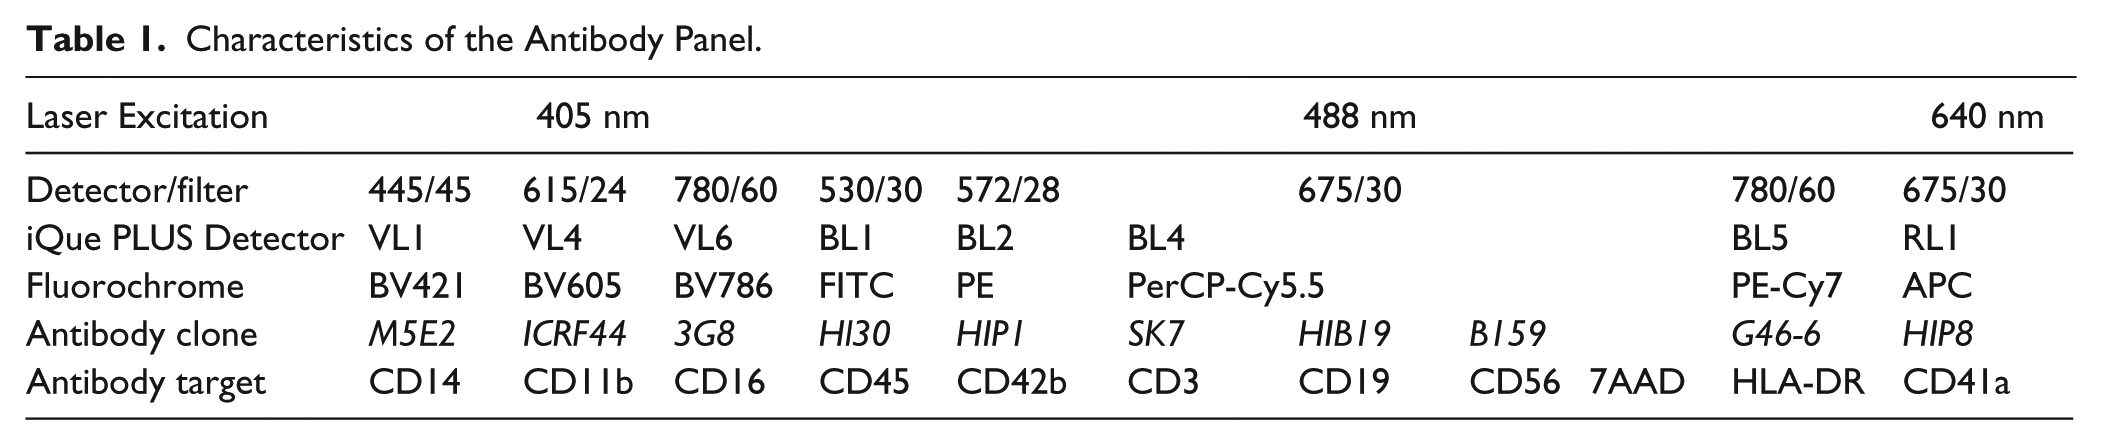
Purified CD34+ HPCs from PB and BM samples were cultured in six-well plates at 5 × 10⁴ cells/mL concentration in StemSpan SFEM II media supplemented with megakaryocyte supplement for 8 to 10 days at 37 °C and 5% CO2. After expansion, the cells were counted and viability assessed by trypan blue dye exclusion. Megakaryocyte and myeloid lineage marker expression was also measured on the iQue Screener PLUS platform using appropriate antibodies ( Table 1 ) to confirm the presence of different stages of megakaryocytes and myeloid cells.
Characteristics of the Antibody Panel.
Flow Cytometry Drug Screening Analysis
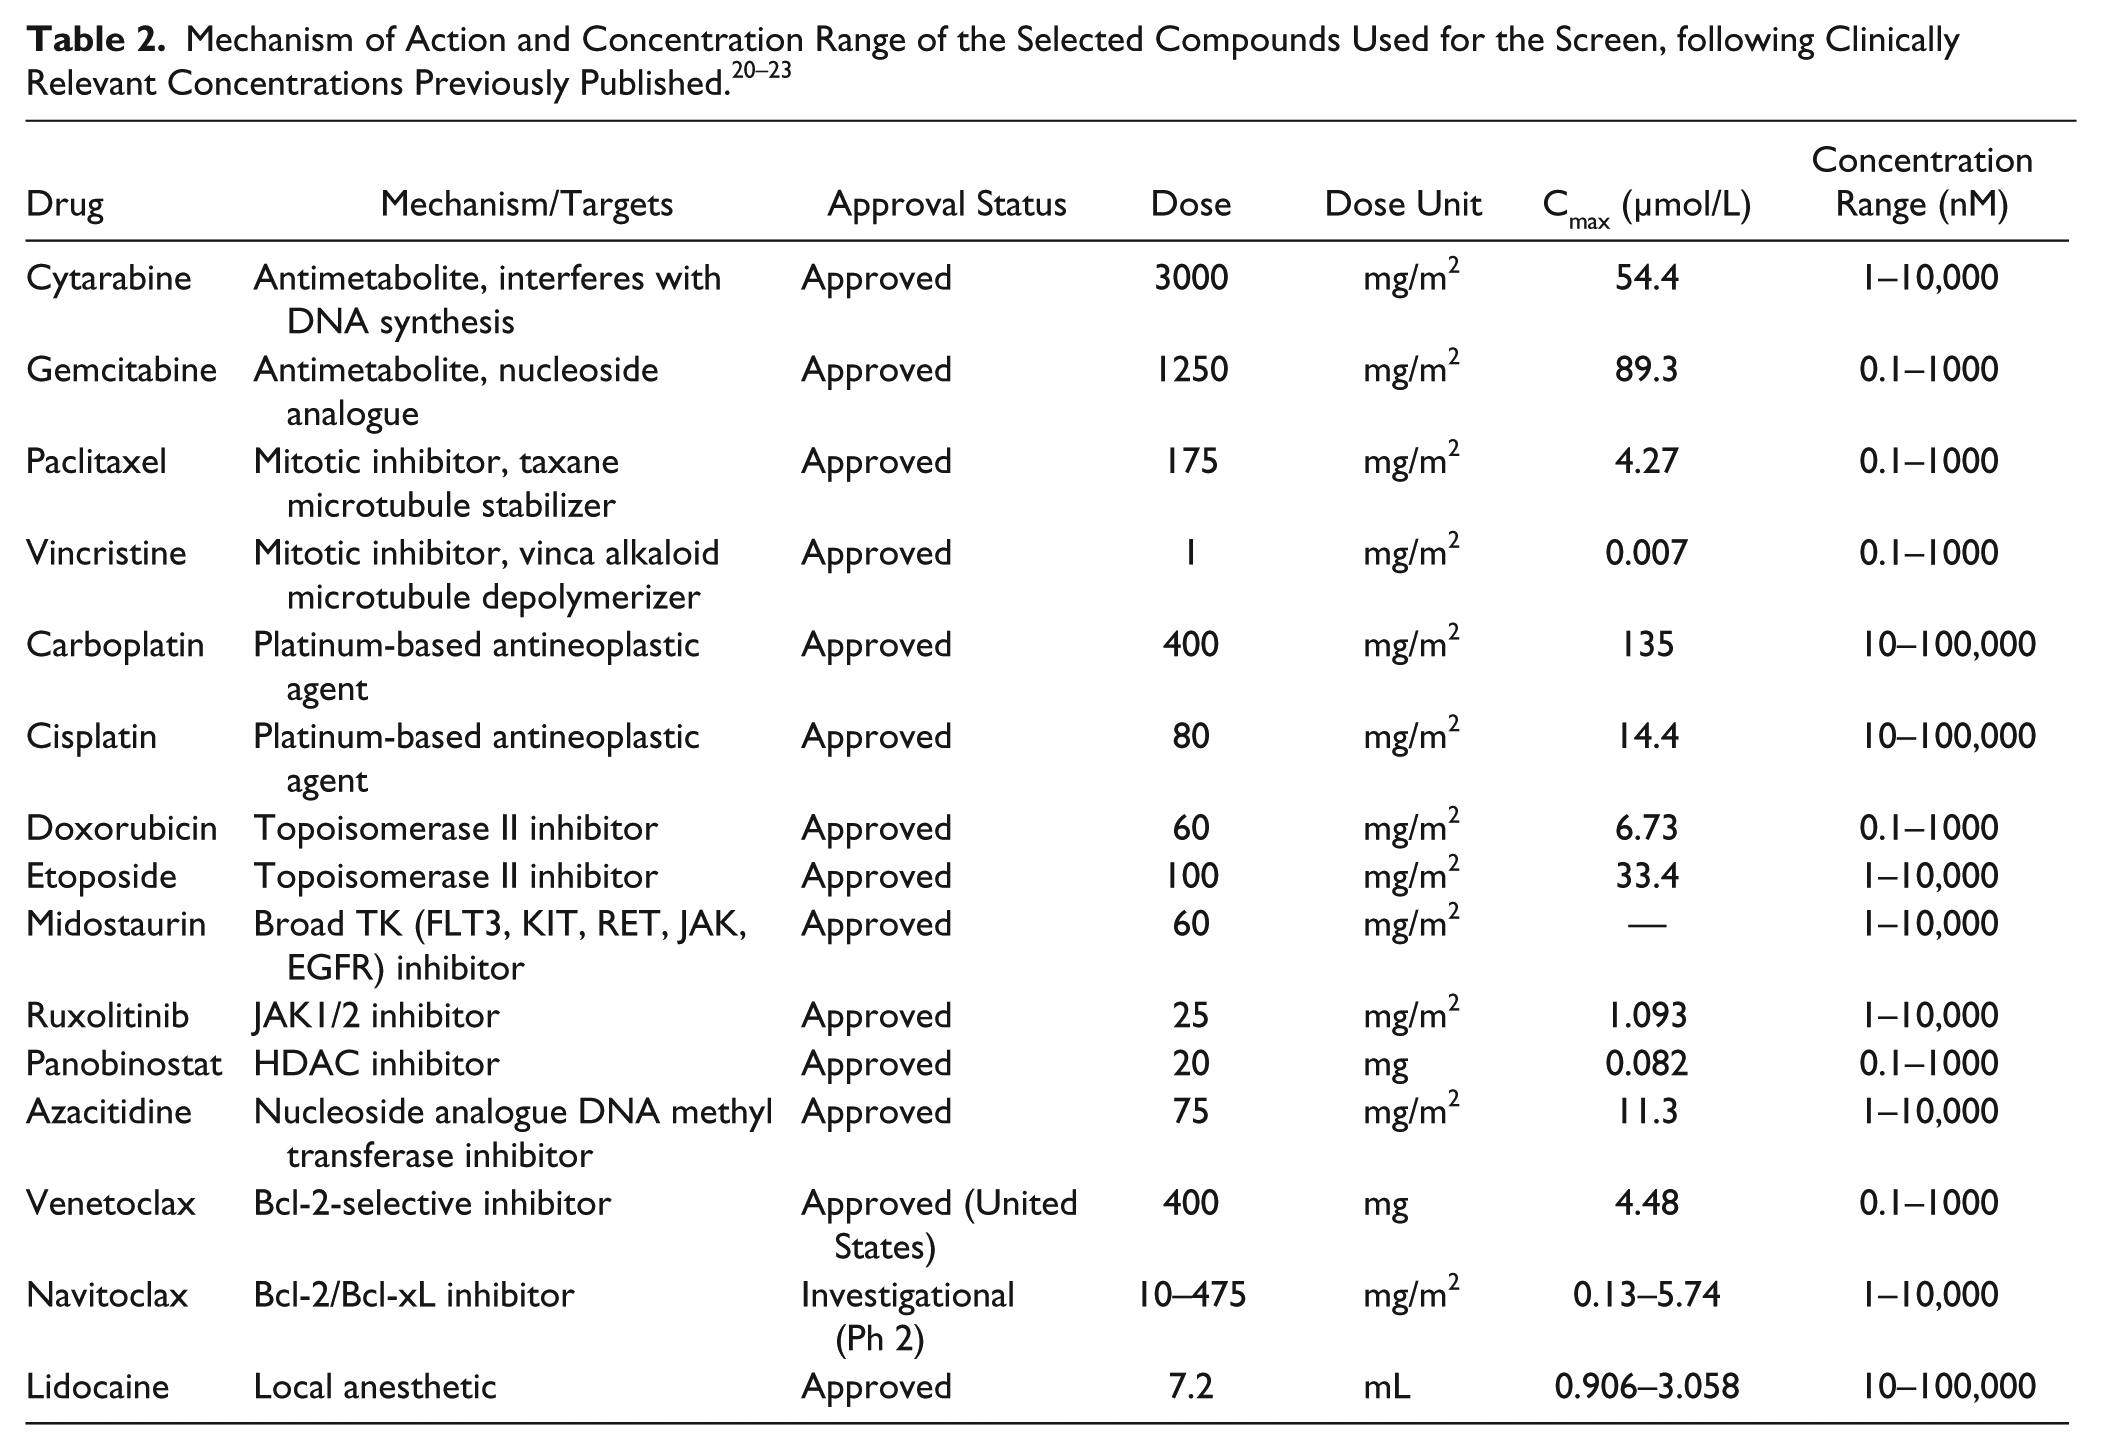
Most of the selected active substances included Food and Drug Administration/European Medicines Agency (FDA/EMA)–approved treatments plus clinically investigated compounds. The compounds were dissolved in 100% DMSO or aqueous solution and dispensed on tissue culture grade V-bottom 96-well plates (Corning, Corning, NY) using the Echo 550 Liquid Handler (Labcyte, Sunnyvale, CA). The final DMSO concentration was 0.01% v/v at all drug concentrations and control wells. The compounds were plated in five concentrations in a 10-fold dilution series covering a 10,000-fold concentration range (e.g., 0.1–1000 nM or 1–10,000 nM) according to clinically relevant concentrations ( Table 2 ). The expanded cells were seeded at 10,000 cells/well on the drug plates with StemSpan SFEM II media and incubated for 3 days at 37 °C and 5% CO2. The cells were then washed with cell staining buffer (PBS with 2% fetal bovine serum), centrifuged at 600 g for 5 min, and stained in 25 µL of antibody cocktail (CD45, CD41, CD16, HLA-DR, CD11b, CD41a, CD42b, CD3, CD56, CD19 diluted in cell staining buffer) for 30 min at room temperature in the dark. After antibody staining, the cells were washed in staining buffer and resuspended in 25 µL Annexin V binding buffer containing 0.7 µL 7AAD for 10 min at room temperature in the dark. Using the iQue screener PLUS flow cytometer equipped with three lasers (405, 488, and 640 nm), we collected an average of 40,000 events/well at a rate of 18 s/well and maximum of 4 to 5 million events in about 30 min. The cells were analyzed after CD34+ selection, after expansion, and after treatment. Lymphoid and dead cells were excluded from megakaryocytes and monocytes using the markers CD3, CD56, CD19, and 7AAD. Immature and mature megakaryocytes were distinguished using CD45, HLA-DR, CD11b, CD41a, and CD42b ( Table 1 ). Myelo/monocytic cell lineages were identified using CD45, HLA-DR, CD11b, CD14, and CD16 ( Table 1 ). The gating strategy based on fluorescence minus one (FMO) controls is illustrated in Supplemental Figure S1 . The effect of chemotherapies was assessed by calculating the percentage of different subsets of myeloid and megakaryocyte cells normalized to the total number of myeloid and megakaryocytes in the vehicle control wells.
Data Analysis
Flow cytometry standard (FCS) files were collected from the iQue Screener PLUS instrument, and further analysis was conducted using FlowJo software v10 (Treestar, San Carlos, CA). To calculate the compensation matrix of spectral overlap values for each fluorochrome, unstained compensation beads and compensation beads stained with the same fluorochrome-labeled mouse Ig anti-human antibody were used in the experiment and acquired using ForeCyt software (Intellicyt). The calculated compensation matrix was used to correct the spectral overlap for any combinations of fluorochrome-labeled mouse Ig anti-human antibodies conjugated to the dyes used in the present experiments. Gated cells were separated in quadrants, and percentages were calculated for every well using FlowJo software. The percentage of different stages of megakaryocytes and myeloid cell populations was imported from FlowJo for further analysis and normalized to vehicle control data. Statistical analysis, curve fitting, and EC50 calculations were performed using GraphPad Prism 8 (GraphPad Software, La Jolla, CA).
Results
Expansion of Megakaryocytes and Other Myeloid Lineage Cells from Healthy Hematopoietic Progenitors
A schematic overview of the entire process from sampling to drug testing and data analysis is shown in Figure 1 . Megakaryocytes and other myeloid progenitor cells are rare in PB and BM and can be difficult to detect. We therefore purified CD34+ hematopoietic progenitor cells by immunomagnetic bead selection from the mononuclear cell fraction of PB samples or BM aspirates from healthy donors. The yield of CD34+ cells on average was approximately 1 × 10⁵ cells from 50 mL PB and 1 × 10⁶ cells from 50 mL BM aspirate. To generate sufficient numbers of cells for drug testing analysis, we expanded the HPCs in StemSpan SFEM II media supplemented with megakaryocyte supplement for 8 to 10 days. Prior to and after expansion, we analyzed the samples using the antibody panel shown in Table 1 . The eight-color multiparameteric flow cytometry panel was designed to detect cells at different stages of myeloid lineage and megakaryocyte development and included antibodies for CD45, CD41a, CD42b, CD11b, CD14, CD16, and HLA-DR. This set of antibodies allowed for detection of immature and mature megakaryocytes plus different myelomonocytic cell subsets. To exclude lymphocytes, antibodies for CD3, CD19, and CD56 all labeled with the same fluorochrome were also included in the panel.
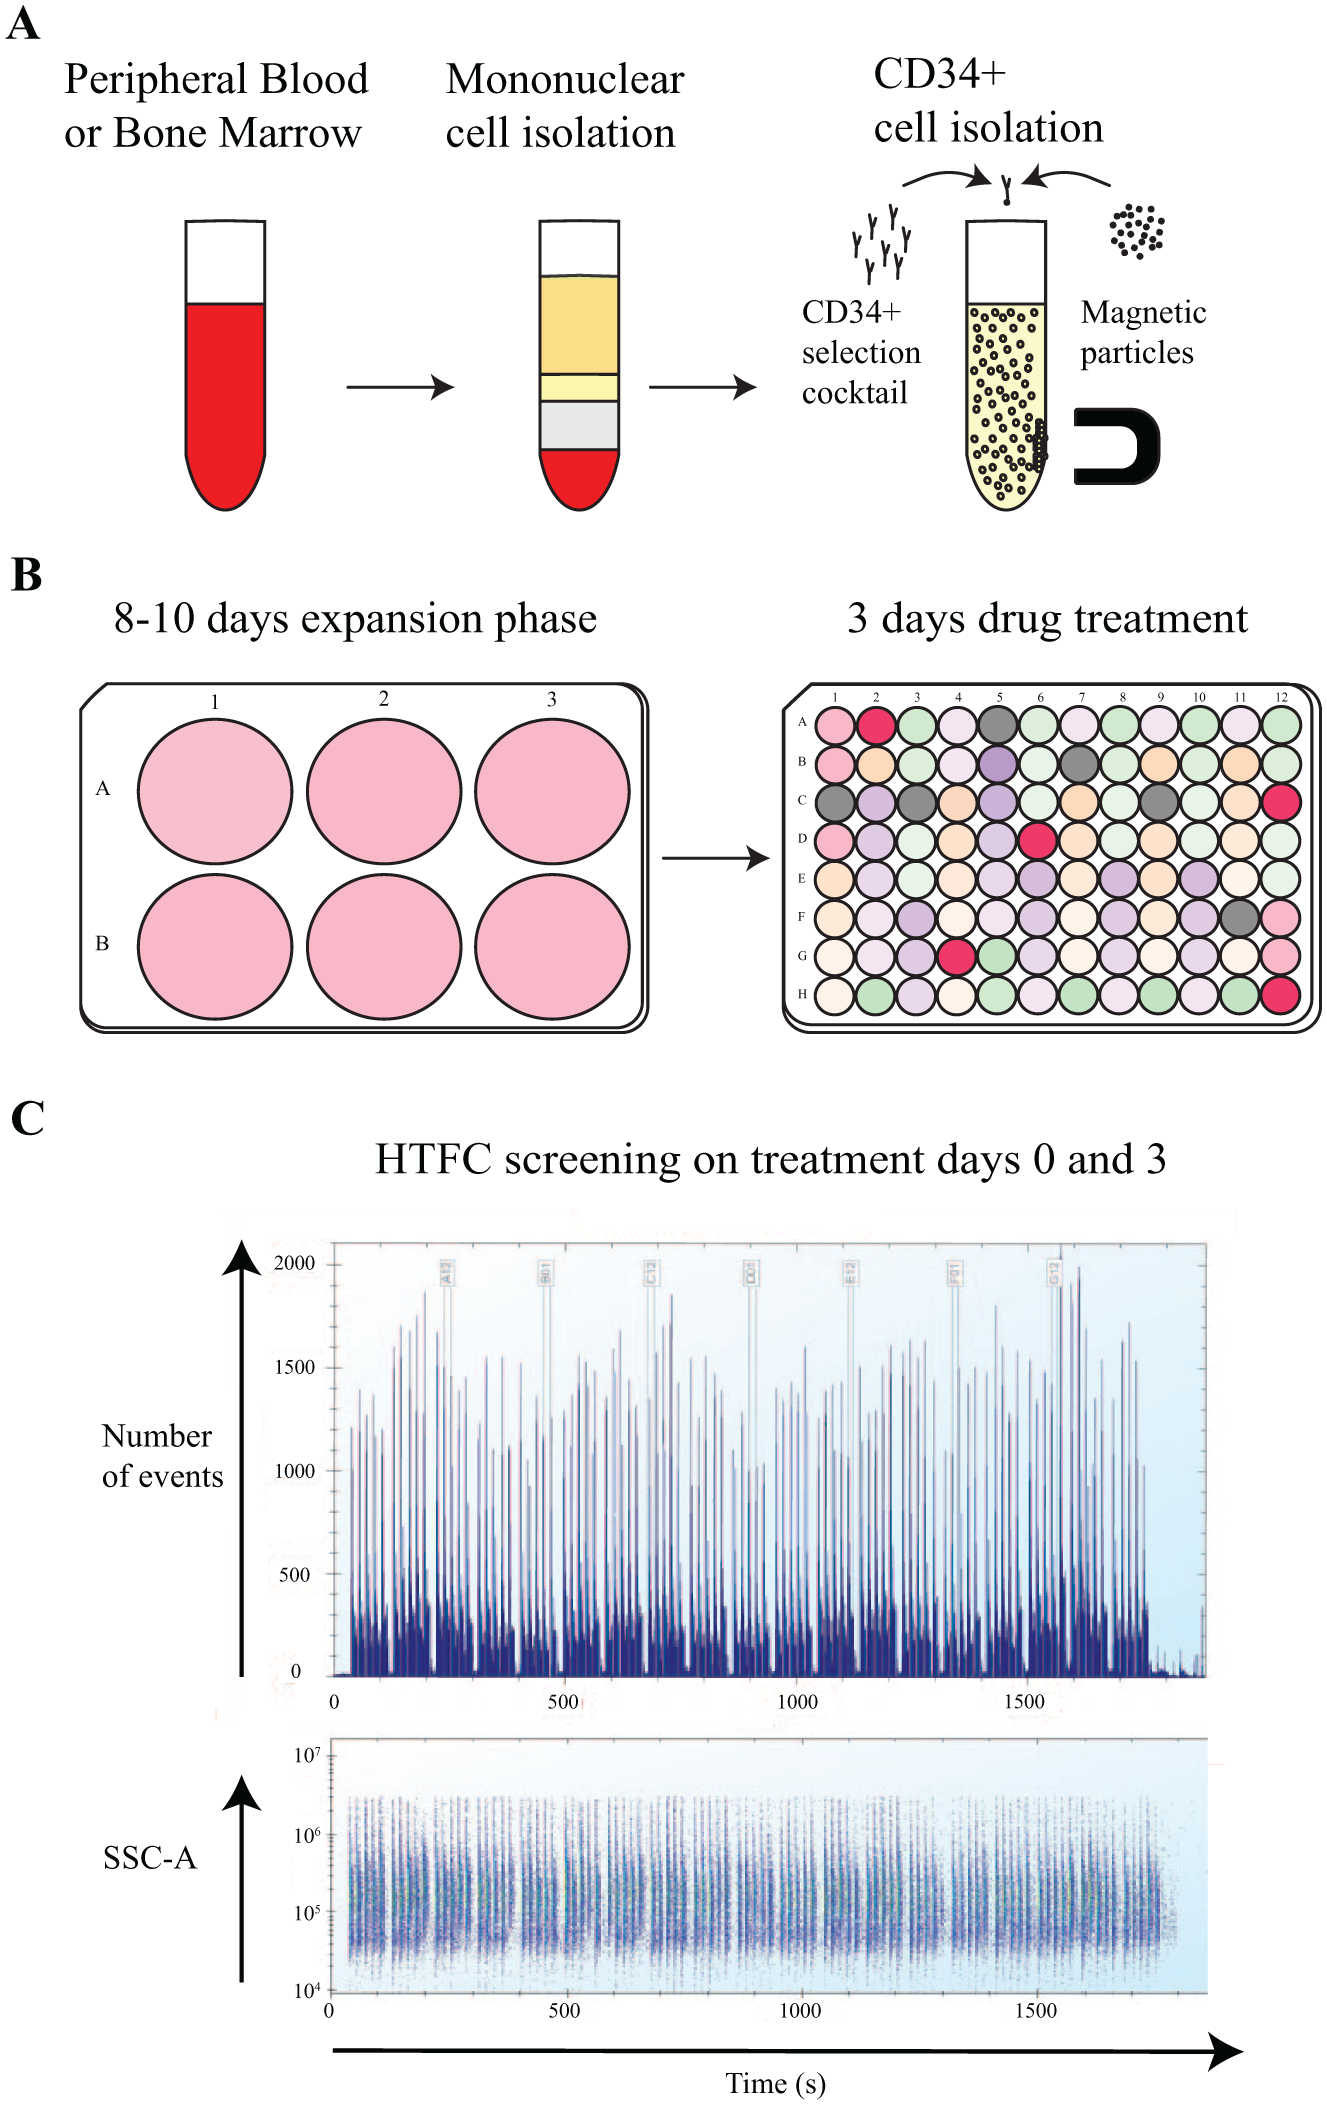
Myelosuppression assay workflow. (
Using the gating strategy presented in Figure 2 , we were able to detect clear differences in the cell populations pre- and postexpansion. Early immature megakaryocytes are CD41a+CD42b– and late mature megakaryocytes are positive for both CD41a and CD42b markers (CD41a+CD42b+). From the enriched CD34+ cells, ≤3% immature megakaryocytes were detected in the BM sample and ≤1% in the PB samples. For mature megakaryocytes, ≤1% were detected in the BM sample and ≤0.5% in PB. After 8 to 10 days of culture with megakaryocyte supplement, we observed ≥42% immature megakaryocytes and ≥40% mature megakaryocytes in the PB samples. In the BM sample, we observed ≥35% increase in immature megakaryocytes and ≥60% increase in mature megakaryocytes, indicating induction of megakaryopoiesis. Mature megakaryocytes were detected earlier with the BM derived HPCs (8 days, Suppl. Fig. S2 ) compared to HPCs derived from the PB samples (10 days, Fig. 2 ) based on cell shape and morphology observed with light microscopy (data not shown). Nevertheless, megakaryopoiesis could be induced from both PB- and BM-derived HPCs using StemSpan SFEM II media supplemented with recombinant human SCF, IL-6, IL-9, and TPO.
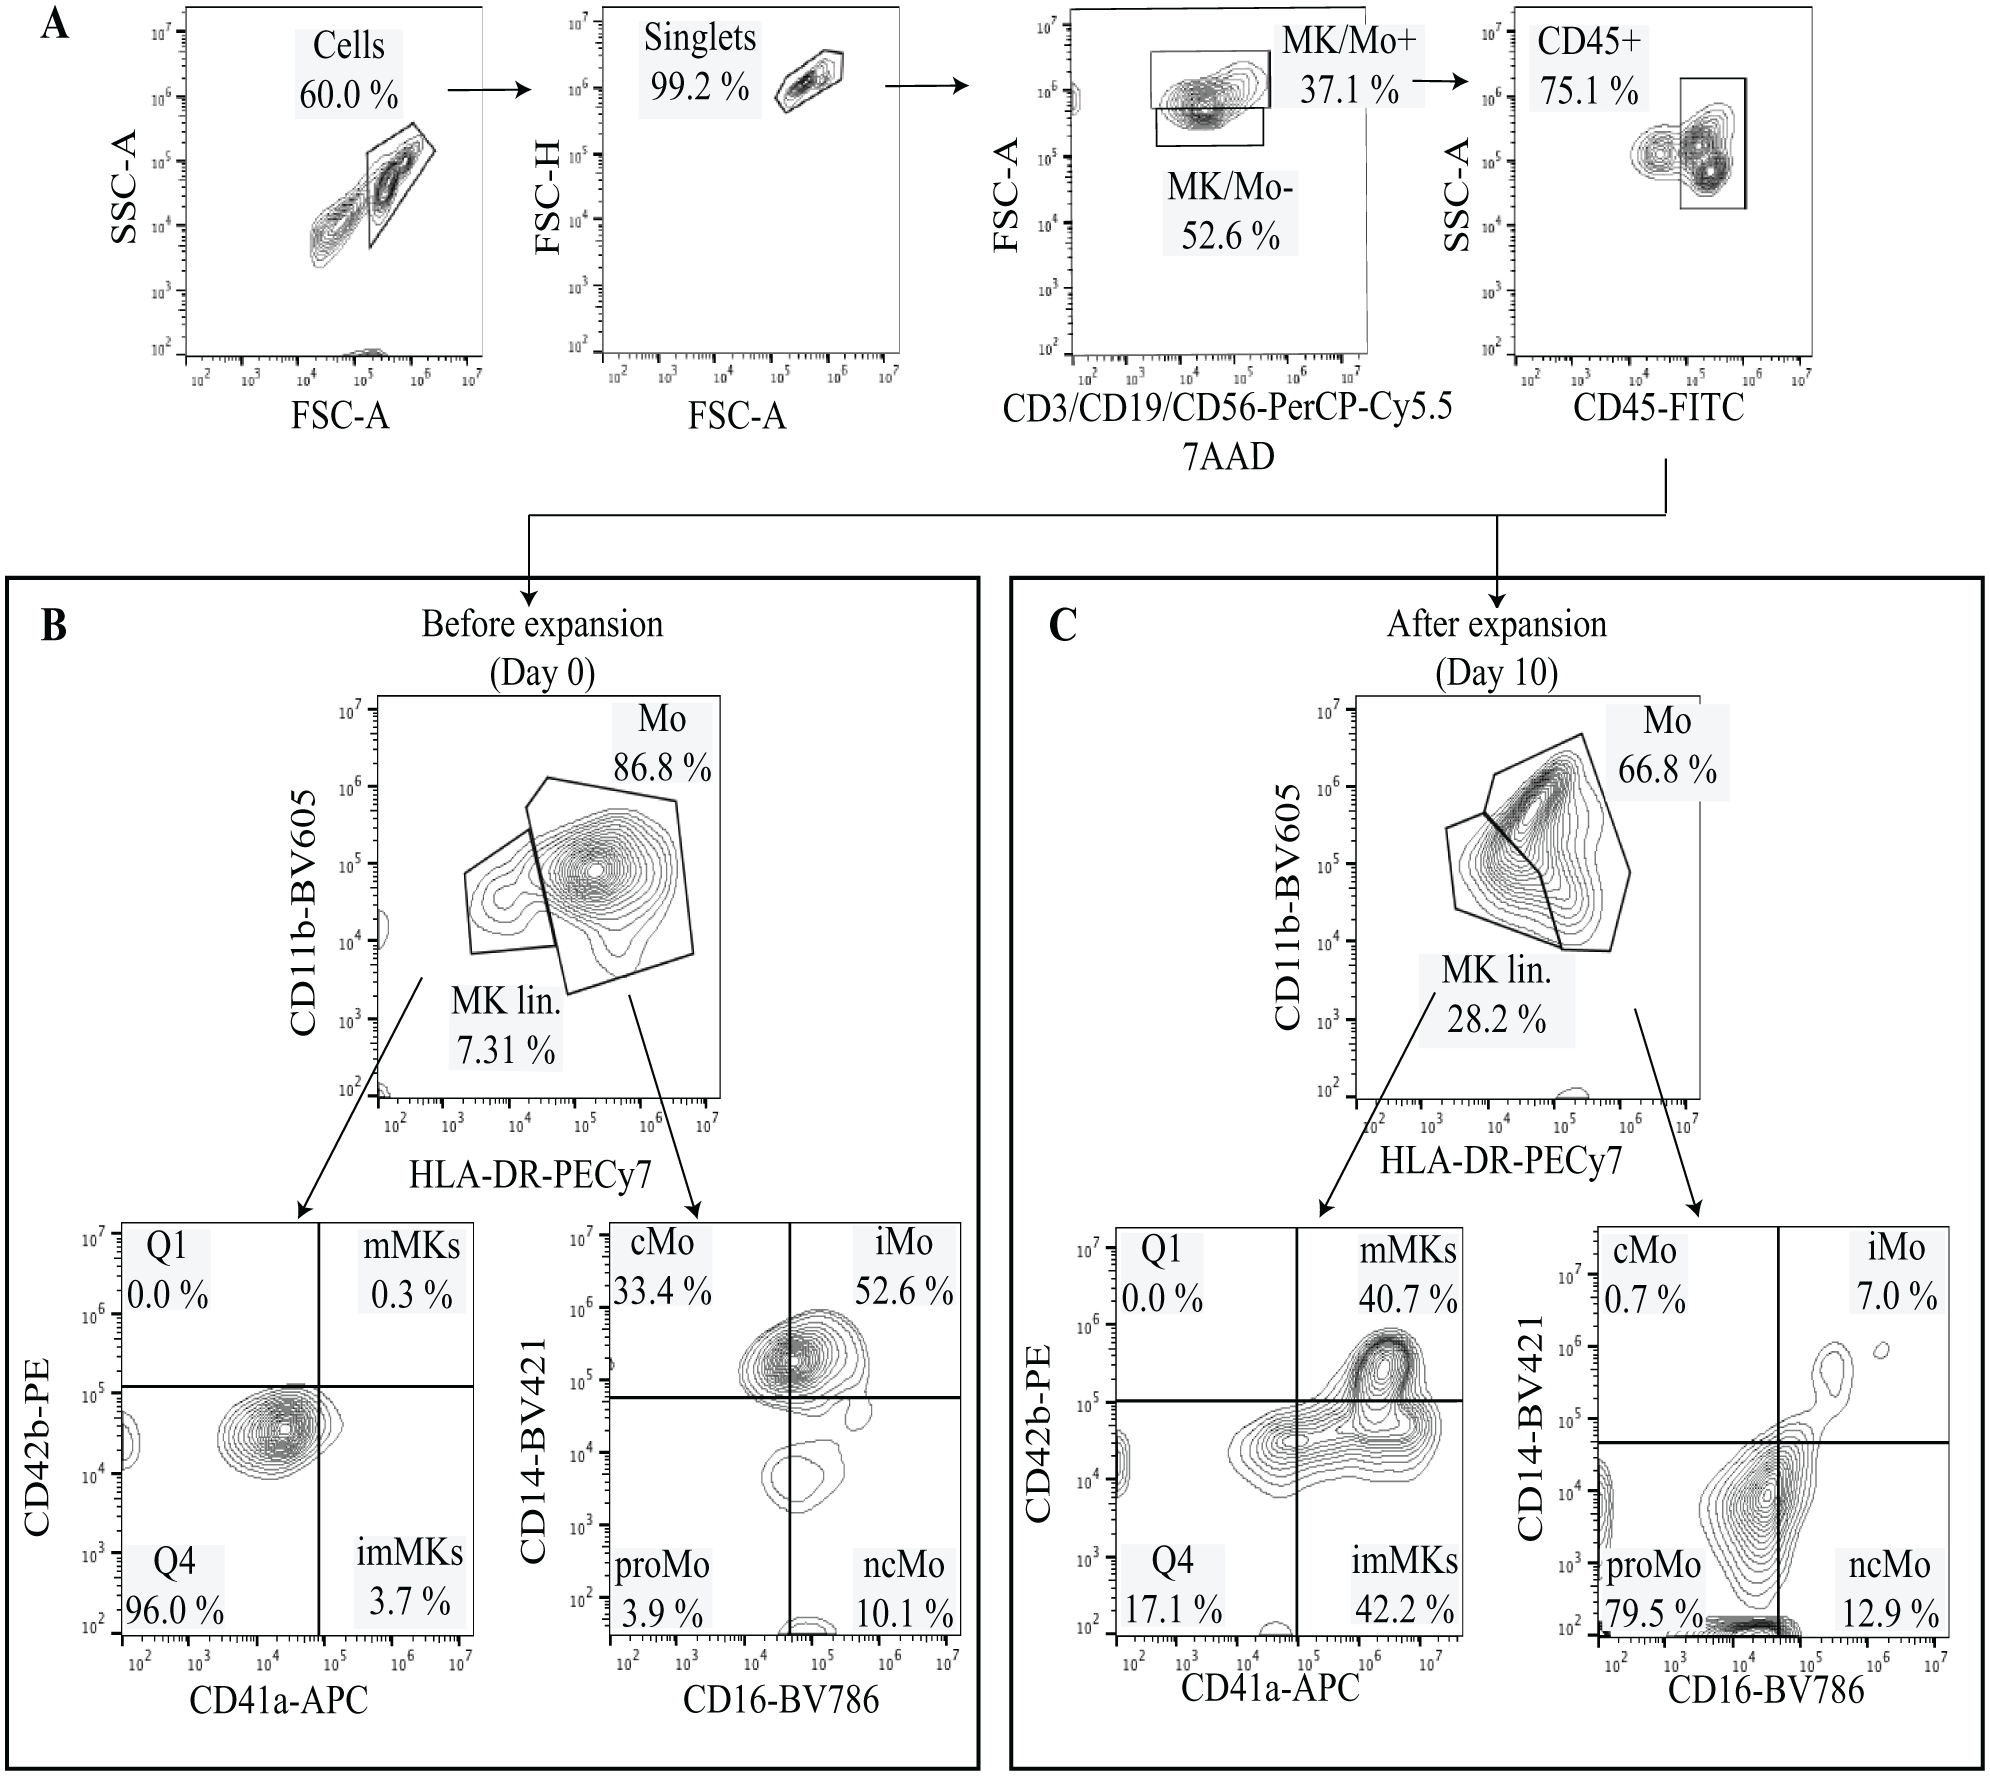
An example of the gating strategy used to define major subpopulations of megakaryocytes and cells of the myeloid lineage. Peripheral blood CD34+ hematopoietic stem and progenitor cells were cultured for 10 days in serum-free liquid medium in the presence of Megakaryocyte Expansion Supplement. (
In addition to megakaryocytes, we also observed changes within the monocytic cell compartment pre- and postexpansion ( Fig. 2 ). Different stages of myeloid cell populations were also detected at days 8 to 10 and identified based on the surface expression of different CD markers. The monocyte compartment was assigned based on CD11b+ and HLA-DR+ expression. Within this compartment, we further defined classical monocytes (CD14+CD16–), nonclassical monocytes (CD14–CD16+), intermediate monocytes (CD14+CD16+), and promonocytes (CD14–CD16–) ( Fig. 2 ). After 8 to 10 days of expansion, we observed increased numbers of classical monocytes, nonclassical monocytes, and promonocytes ( Fig. 2B , C ).
Drug Panel for Testing the Myelosuppression Flow Cytometry Assay
To evaluate chemotherapy-induced myelosuppressive effects, we designed a panel of 14 drugs that included both conventional cytotoxic drugs as well as targeted agents and approved and investigational drugs. The panel comprised antimetabolites, mitotic inhibitors, platinum-based agents, topoisomerase II inhibitors, tyrosine kinase inhibitors, HDAC inhibitors, and BCL2 inhibitors ( Table 2 ). These were all selected based on their known or potential myelosuppressive effects, while lidocaine, a known treatment that has no reported effect on hematopoiesis, was tested as a negative control ( Suppl. Fig. S3 ). To generate dose-response curves, the drugs were plated in five concentrations in a 10,000-fold range. After the PB- or BM-derived HPCs were expanded to induce megakaryocyte and myeloid cell differentiation, the cells were transferred to the drug plates and incubated for 3 days and then analyzed with the antibody panel in Table 1 , which enabled assessment of megakaryocytes and other myeloid lineage cells.
Effect of Chemotherapies on Megakaryocytes and Myeloid Cell Populations
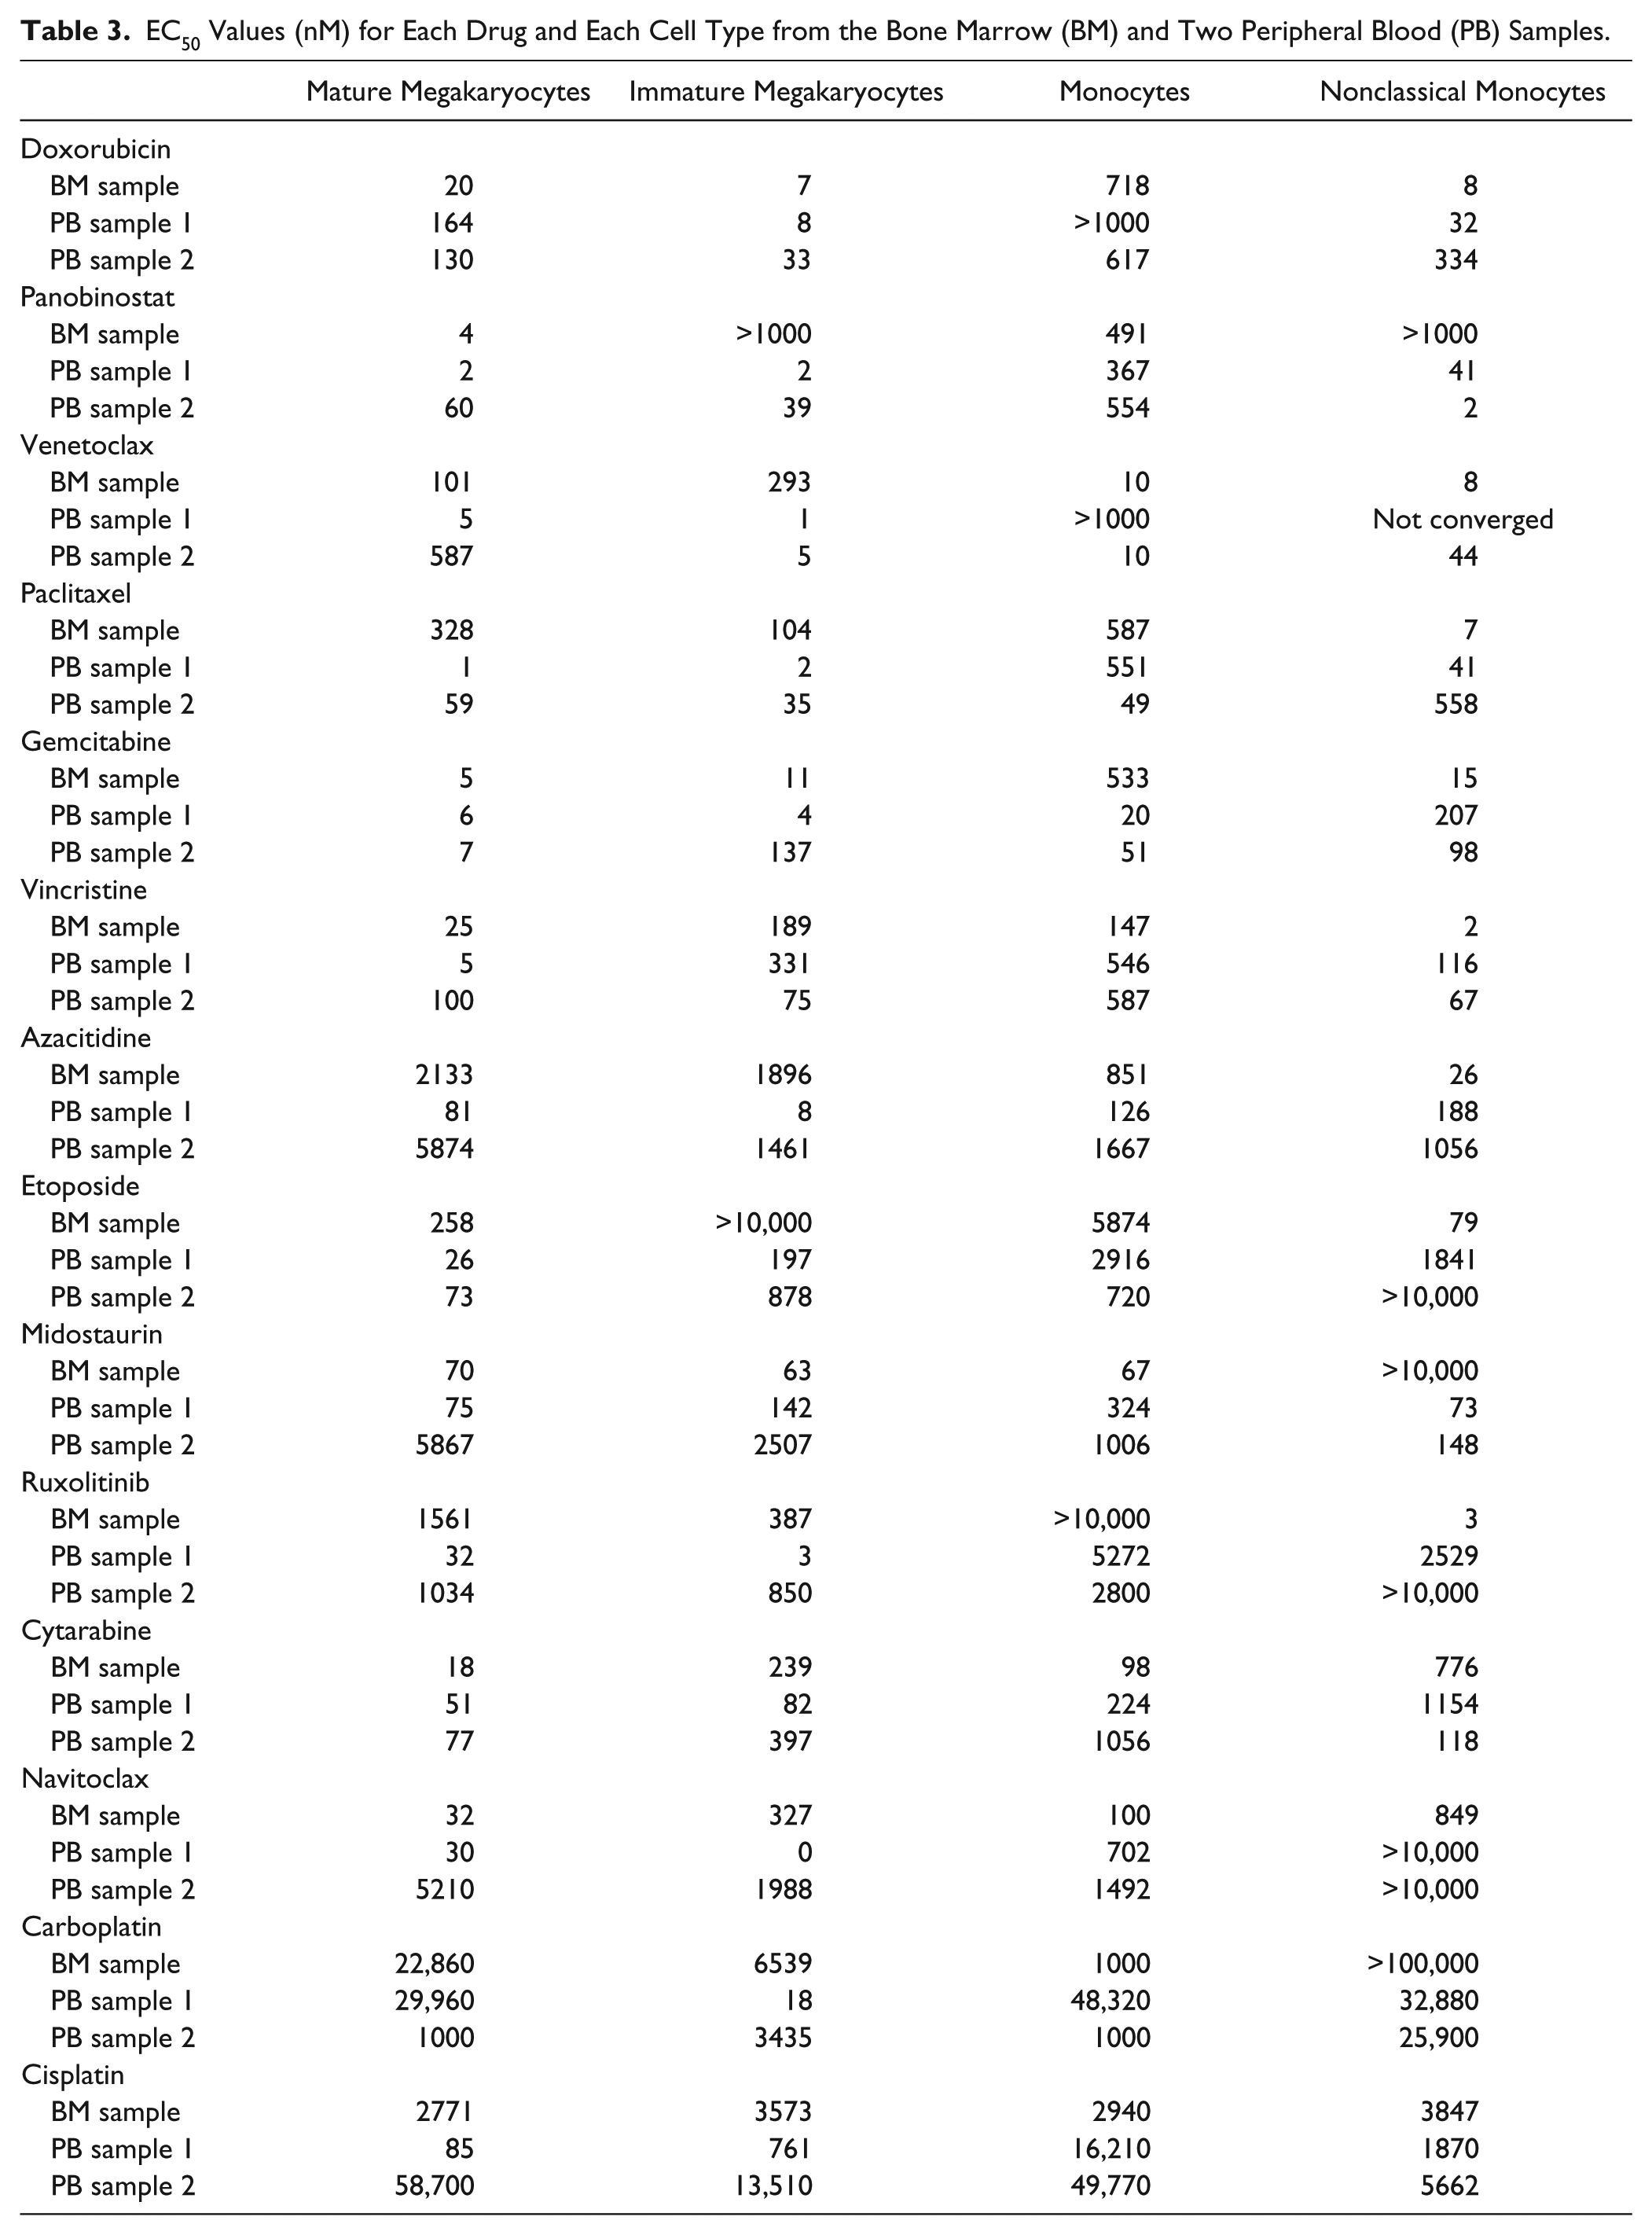
With the addition of drugs, we were able to identify chemotherapies that inhibited the expansion of immature and mature megakaryocyte cell populations in a dose-dependent manner ( Table 3 and Suppl. Fig. S4 ). Interestingly, the effect of several drugs was different between the megakaryocyte populations. For example, immature megakaryocytes appeared to be more sensitive to doxorubicin than mature megakaryocytes ( Table 3 ). However, in general, most of the compounds affected both megakaryocyte populations, while the negative control lidocaine had little impact ( Suppl. Fig. S3 ). Furthermore, the EC50 values for the megakaryocyte populations were near the known Cmax values for the drugs ( Table 2 ), suggesting that the results are clinically relevant. The chemotherapies affected the myeloid cell populations, including early monocytes and classical, nonclassical, and intermediate monocytes in all the tested healthy samples ( Table 3 and Suppl. Fig. S5 ). However, these cells were less sensitive to the compounds compared to megakaryocytes and as indicated by the higher EC50 values for monocytes and nonclassical monocytes ( Table 3 ).
EC50 Values (nM) for Each Drug and Each Cell Type from the Bone Marrow (BM) and Two Peripheral Blood (PB) Samples.
Discussion
Here, we developed a drug screening assay using hematopoietic stem and progenitor cells (HPCs CD34+) purified from peripheral blood and bone marrow to study chemotherapy-induced myelosuppression. This setup provides parallel information regarding the adverse effects of antineoplastic agents on both megakaryocyte and monocyte cell populations, which reflects part of the treatments’ adverse effects. To evaluate the direct translational relevance of the assay, we screened compounds with well-characterized side effect profiles and known to induce myelosuppression. The dose-response effect of multiple treatments on multiple populations was possible due to the adaptation of a high-throughput flow cytometry (HTFC) platform. This approach can provide a novel tool to investigate the unexplored mechanisms of drug-induced myelosuppression as well as screen compounds that may potentially induce myelosuppression.
Myelosuppression is a major side effect of chemotherapies and contributes to cancer patient morbidity. Chemotherapies impair the growth and development of early HPCs, which are necessary to produce different mature blood cells. One of the best examples of the side effects of cisplatin is inhibition of the renal release of erythropoietin, which leads to anemia, neutropenia, and thrombocytopenia. 14 Megakaryocytes produce blood platelets, which are needed to stop blood vessel injuries. They are rare polyploid cells derived from primitive hematopoietic cells residing in the bone marrow. 15 To study the cellular and molecular functions of megakaryocytes, different investigators have used a serum-free liquid culture system to induce the differentiation of megakaryocytes from CD34+ PB and BM samples.7,16–18 In this present study, we adapted a similar system and cultured CD34+ cells isolated from PB and BM to produce megakaryocytes and myeloid cells, which could then be used in a high-throughput screening platform for the identification of chemotherapy-induced myelosuppression. Our current protocol allows detection of different stages of megakaryocytes such as immature and mature megakaryocytes and different myeloid cell subsets, including early monocytes and classical, nonclassical, and intermediate monocytes. Application of this multiplexed protocol to the iQue Screener PLUS instrument allowed us to simultaneously monitor the effects of 14 different compounds on these rare cell types in a dose-dependent manner. Although the throughput of the present assay is moderate and limited to a 96-well format, the protocol could potentially be further optimized for a 384-well plate assay that would better support large compound screening efforts. In addition, HTFC would require less material and would be more economical. 19
Methods to support prediction of toxicity are required for the improvement of the safety and efficacy of chemotherapies. However, drug-induced myelosuppression is usually considered during the later stages of the drug development process. Typically, the myelosuppressive potential of new cancer drugs is assessed with labor-intensive and low-throughput colony-forming unit assays and costly animal models, prior to first-in-human trials. Although these tests are still very much needed, our assay could be implemented earlier in the development pipeline to rapidly filter out highly myelosuppressive compounds. Although the assay may be further refined and validated, our initial results testing several known myelosuppressive drugs indicate the potential of the assay.
By incorporating several different markers that allow for the identification of different stages of megakaryocyte and myeloid cell development, we could simultaneously assess the impact of the tested compounds on distinct cell populations. For example, we could determine if the compounds differentially affected immature and mature megakaryocytes. Indeed, for many of the tested drugs, we did observe a difference in effect between immature and mature megakaryocyte populations. However, we also noted variation between samples, which could be due to donor-to-donor and BM-to-PB variation. In addition, as many of the tested drugs are cell cycle inhibitors, the variation could be due to the drug mechanism of action and whether the tested cells were efficiently proliferating at the time the drugs were added. Nevertheless, the differentiation stage-specific information may provide more insight into the mechanisms mediating chemotherapy-induced myelosuppression. The information may also be helpful to improve the management and prevention of various therapy-related cytopenias.
Although the focus of our assay was on the megakaryocyte and myeloid cell populations, modifications to the cell isolation and expansion protocol plus alternate cell markers could be readily adapted to allow for the assessment of other blood cell populations. For example, some chemotherapies induce lymphocytopenia, and therefore a modified protocol could potentially be used to assess those cell types. Moreover, as the development of new anticancer agents has become more focused on targeted drugs, it will be important to more fully understand the impact of these compounds on healthy hematopoiesis to avoid potential adverse effects.
The present study establishes a multiplexed approach by which cells and chemotherapies can be rapidly assessed by HTFC. We described the use of a liquid culture assay to produce megakaryocytes from healthy peripheral blood and bone marrow samples, and we developed a multiplexed assay to monitor for myelosuppression. The assay was highly sensitive, allowing for detection of multiple rare cell populations. Although the throughput of the assay was moderate, nevertheless, several compounds could be analyzed simultaneously in a dose-dependent manner. The assay has the potential to serve as a valuable tool in preclinical studies screening for the myelosuppressive potential of novel anticancer compounds and also to understand the impact of chemotherapy on healthy hematopoiesis.
Supplemental Material
Supplemental_Material_for_Multiplexed_Myelosuppression_Assay_by_Javarappa,_et_al – Supplemental material for A Multiplexed Screening Assay to Evaluate Chemotherapy-Induced Myelosuppression Using Healthy Peripheral Blood and Bone Marrow
Supplemental material, Supplemental_Material_for_Multiplexed_Myelosuppression_Assay_by_Javarappa,_et_al for A Multiplexed Screening Assay to Evaluate Chemotherapy-Induced Myelosuppression Using Healthy Peripheral Blood and Bone Marrow by Komal K. Javarappa, Dimitrios Tsallos and Caroline A. Heckman in SLAS Discovery
Footnotes
Acknowledgements
We thank the donors for the generous contribution of their samples, the excellent phlebotomists Mia Johanna Urjansson and Tiina Vesterinen, and Prof. Satu Mustjoki for her sample contributions. We also thank Minna Suvela, Alun Parsons, and Siv Knaappila for their excellent technical support and the FIMM High Throughput Biomedicine Unit for preparing the drug plates.
Declaration of Conflicting Interests
The authors declared no potential conflicts of interest with respect to the research, authorship, and/or publication of this article.
Funding
The authors disclosed receipt of the following financial support for the research, authorship, and/or publication of this article: The work was supported by research grants from the Cancer Society of Finland and Novartis and by the University of Helsinki Doctoral Programme in Biomedicine.
Supplemental material is available online with this article.
References
Supplementary Material
Please find the following supplemental material available below.
For Open Access articles published under a Creative Commons License, all supplemental material carries the same license as the article it is associated with.
For non-Open Access articles published, all supplemental material carries a non-exclusive license, and permission requests for re-use of supplemental material or any part of supplemental material shall be sent directly to the copyright owner as specified in the copyright notice associated with the article.