
Abstract
High-throughput screening (HTS) hits include compounds with undesirable properties. Many filters have been described to identify such hits. Notably, pan-assay interference compounds (PAINS) has been adopted by the community as the standard term to refer to such filters, and very useful guidelines have been adopted by the American Chemical Society (ACS) and subsequently triggered a healthy scientific debate about the pitfalls of draconian use of filters. Using an inhibitory frequency index, we have analyzed in detail the promiscuity profile of the whole GlaxoSmithKline (GSK) HTS collection comprising more than 2 million unique compounds that have been tested in hundreds of screening assays. We provide a comprehensive analysis of many previously published filters and newly described classes of nuisance structures that may serve as a useful source of empirical information to guide the design or growth of HTS collections and hit triaging strategies.
Keywords
Introduction
High-throughput screening (HTS) is a critical tool in the identification of lead molecules for novel therapeutic targets in drug discovery.1,2 Over the past 20 years GlaxoSmithKline (GSK) has continuously invested in the development and curation of its HTS collection. After the merger of Glaxo Wellcome and SmithKline Beecham in 2001, the creation of a combined GSK HTS collection started with an extensive quality control (QC) program for all compounds, 3 the definition and refinement of substructure and property filters to remove compounds not suitable for HTS, 4 the development of an integrated strategy for collection growth, 5 and extensive compound synthesis and compound acquisition efforts in line with this strategy. 6
The issue of identifying useless primary screening hits caused by nuisance compounds has been well known since the advent of HTS in the early 1990s. 7 Several articles have been published describing a number of chemotypes that display nonspecific effects, like chemical reactivity, assay signal interference, and colloidal aggregation.8,9 Baell coined the term pan-assay interference compounds (PAINS),10–14 which has been adopted as an imprecise synonym of nuisance. There are notable significant additional works15–18 that use chemical substructures represented by the convenient SMARTS notation (SMiles ARbitrary Target Specification) for identifying compounds to be flagged for potential nuisance. Since automation impacted chemistry and screening, it has become routine work for many pharmaceutical companies to catalog reactive or undesirable compounds.19–21 More recently, the American Chemical Society (ACS) has adopted clear guidelines to filter out nuisance hits in articles submitted to any ACS journal. 22 One characteristic of nuisance compounds not often cited is their inconsistent behavior: a bad actor is rarely a hit in every assay in which it is tested; instead, it shows up as interference given specific conditions, such as the presence of an important free cysteine thiol group in a protein or the use of a particular wavelength at a certain pH in an assay. Therefore, a fit-for-purpose collection of filters for a screening collection requires more than a handful of specific assays using a single technology tested against a small number of compounds sharing a chemical feature, a common criticism of the original PAINS paper that has been recently backed by questioning many filters based on the analysis of the bioactivity profile of all compounds in PubChem.23–30
In 2008, an analysis of frequent hitters in HTS campaigns conducted in GSK revealed 750 noisy compounds that had been subject to more than 13,000 dose–response experiments. Subsequently, we set out to measure the activity profile of every compound of the GSK HTS collection over hundreds of campaigns using the inhibitory frequency index (IFI), a pragmatic and intuitive measure of promiscuity. 31 The promiscuity of a chemotype can be assessed by measuring the IFI profiles of analogs bearing a substructure of interest across different target classes and assay technology, allowing us to distinguish nonspecific nuisance effects from specific assay interference or bona fide biological activity within a particular target class.
In this article, we show the promiscuity profile of the whole GSK HTS collection comprising more than 2 million unique compounds. We provide a comprehensive analysis of many previously published filters and newly described classes of nuisance structures that may serve as a useful source of empirical information to guide the design or growth of HTS collections and hit triaging strategies.
Materials and Methods
Compounds and Assays
The GSK screening collection comprises approximately 2 million diverse compounds at any given time, with continuous addition of new chemicals and exhaustion or disposal of old samples.6,32 Over the last 10 years 2,586,543 compounds have been tested at a compound concentration of 10 µM in GSK in at least 50 of 334 primary HTS assays (both biochemical and cellular) looking for inhibitors or antagonists of a diverse set of targets (excluding kinases). A smaller number of assays looking for agonists are not considered in this study. The distribution of target classes and technologies is shown in Figure 1 . Kinase assays (47) were excluded from the analysis of nuisance filters because kinase inhibitors, even if specific for one particular kinase, tend to be active against many kinases at the relatively high concentration tested, distorting the analysis of nuisance profiles. However, kinases assays were included in the assessment of target and technology bias.
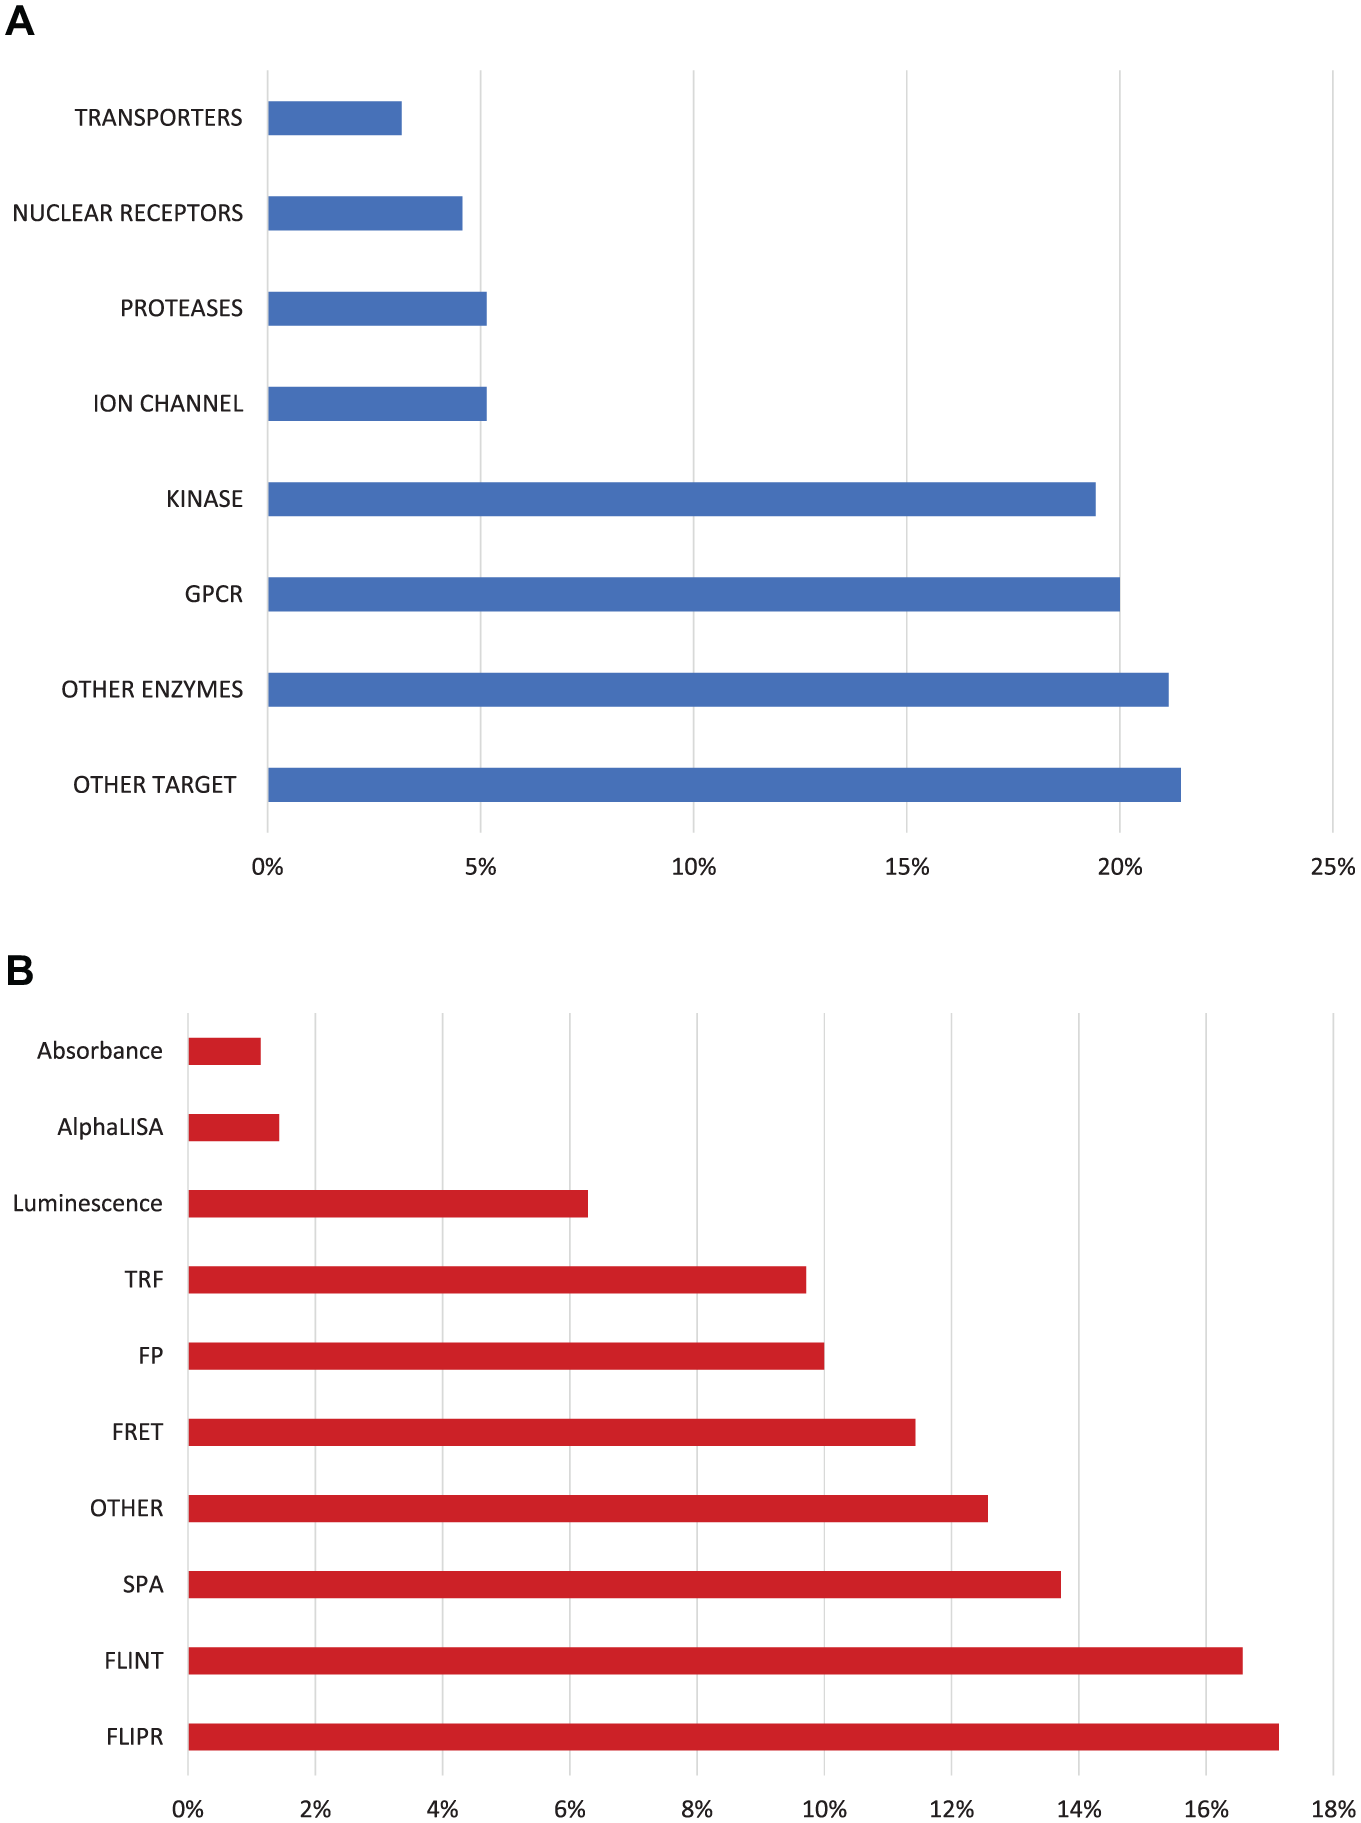
Distribution of HTS assays run in GSK per target class (
Inhibitory Frequency Index
We used inhibition ≥ 50% as a uniform cutoff to define hits; for most screening campaigns, this cutoff is above the statistical cutoff calculated to select hits for secondary confirmation (typically performed in duplicates); 33 the result computed for the IFI calculation is the median of all available results at 10 µM for every compound.
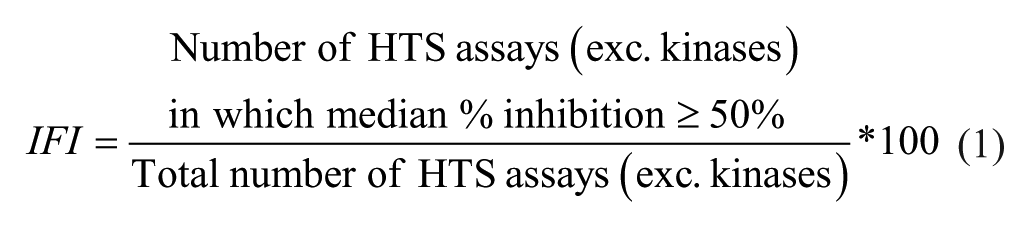
IFI is defined as the proportion (%) of nonkinase assays in which a compound shows inhibition ≥ 50%, 3 , calculated with eq 1:
We only considered for the analysis compounds that have been tested in at least 50 HTS assays.
“IFI with kinases” was calculated using the same formula but including kinase assays in the analysis.
The IFI analysis hereby reported for every compound in the record of GSK HTS was conducted in January 2017. In January 2012, a similar analysis was performed using results from 185 HTS assays.
Compound Classification according to IFI
Based on heuristics, compounds with IFI > 2 were considered noisy. We used the following bins to classify compounds according to their IFI:
IFI = 0: Inactive or “dark chemical matter” 34
0 < IFI ≤ 1: Specific active
1 < IFI ≤ 2: Moderately active
2 < IFI ≤ 5: Somewhat noisy
5 < IFI ≤ 10: Noisy
10 < IFI: Very noisy
Nuisance Filters
Publicly available SMARTS substructure filters have been obtained from Jadhav et al., 8 PAINS 14 (the original PAINS filters were listed in SLN and were converted to SMARTS internally), the structural alert tables in the ChEMBL 22 database, 17 the “patterns” web service in the ZINC 15 database, 18 BMS filters, 15 and those that had a SMARTS representation from Lilly. 16 GSK CTC (Cleaning the Collection) filters were developed in GSK after analysis of noisy compounds in the first IFI analysis in-house conducted in 2008.
Filters were described by the following characteristics:
N = number of compounds identified in GSK collection belonging to the filter. Note that filters with < 10 members were not further analyzed.
Fraction of noisy compounds = proportion of compounds in the filter that are somewhat noisy, noisy, or very noisy (i.e., IFI > 2).
Target class bias = A filter shows target bias if one to three target classes fall above the bias cutoff.
Assay technology bias = A filter shows assay technology bias if one to three assay technologies fall above the bias cutoff.
Chemical structures were extracted from the GSK registry in a standardized SMILES format as the parent structure (salts removed and neutral form). SMARTS matching was performed using the ChemAxon Java toolkit (JChem 16.7.4, http://www.chemaxon.com) with data processing in Pipeline Pilot (Pipeline Pilot 2017R2, Biovia, https://www.3ds.com/products-services/biovia/).
In order to assess target class and assay technology bias, we first obtained a summary measure for each filter and assay technology/target class as follows: first, determined the percentages of assays (among assays testing a specific assay technology or target class) that a specific compound showed > 50% inhibition. Then, calculated the median of this percentage across all compounds within a given filter and assay technology or target class. Nonnoisy compounds (i.e., IFI with kinase ≤ 2) and compounds that were tested in < 50 assays were excluded from these calculations. Next, a summary measure-based bias cutoff was calculated across all filters via the mean + 3*SD approach. The bias cutoffs for target classes are 20.92% and 21.33% for assay technologies. As a last step, we assessed the number of assay technologies or target classes above the cutoff for each filter. Filters with one to three assay technologies or target classes above the cutoff were considered biased. Once too many (i.e., more than three) assay technologies or target classes are above the bias cutoff, this filter is considered as having overall high promiscuity but no actual assay technology or target class bias.
Statistical Methods
An exact test for proportions was used to compare the fraction of noisy compounds identified by the various filters to the overall fraction of noisy compounds found in the GSK HTS collection, which is pOverall = 0.1287. This fraction was calculated by taking the ratio of the total number of noisy compounds (i.e., compounds with IFI > 2) to the total number of compounds in the GSK HTS collection. These significance tests were used to classify filters as “potential useful,” “ambiguous,” or “not useful,” as described below. Two-sided tests with a p value < 0.05 were used to determine significance.
Results
Promiscuity Profile of GSK Collection
As shown in Figure 2 , a large proportion of compounds in the GSK collection are dark chemical matter (48.3% did not hit at 50% inhibition or greater in any HTS assay, including results for kinases). There is only a small proportion (0.5%, not including kinases) of very noisy compounds that were for the most part removed from the screening collection soon after they were identified in 2008.
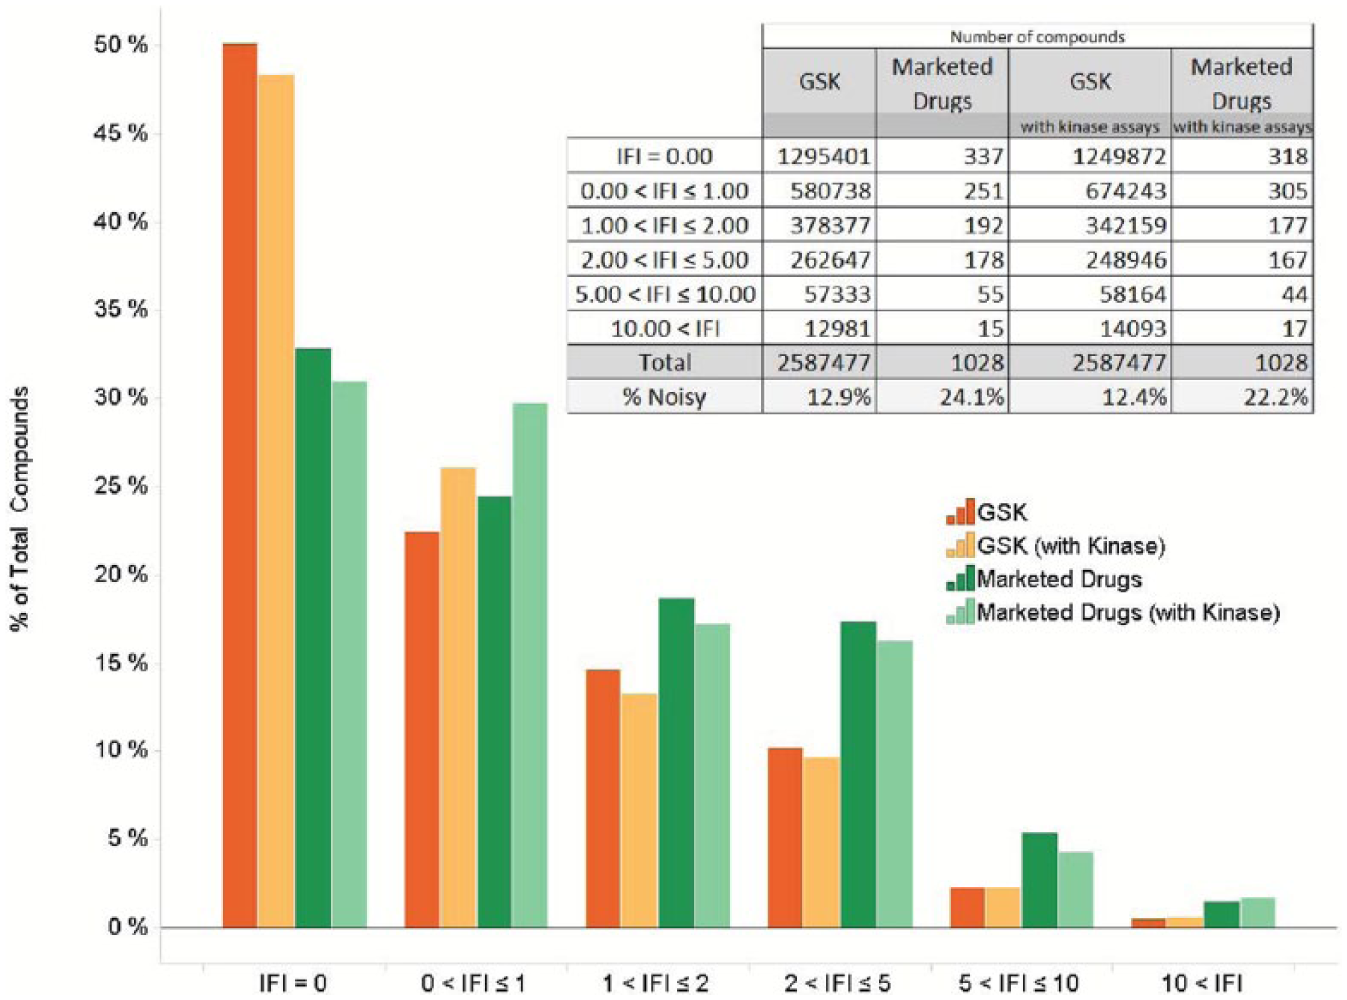
The IFI distribution of the GSK collection and 1090 marketed drugs routinely tested in GSK HTS screens.
Promiscuity Profile of Some Approved Drugs
The IFI profile of marketed drugs included in the GSK collection is also shown in
Figure 2
. Interestingly, it is quite similar to the profile of the whole collection. There are many drugs in the inactive bin (33%). It should be noted that (1) some of these drugs are agonists or activators (not captured by IFI) and (2) the collection of assays tested in GSK did not include every drug target. As previously described,
35
there are also some drugs exhibiting noisy behavior at 10 µM. Upon further analysis of the 15 noisiest marketed drugs (
Dark Chemical Matter
The estimated proportion of dark chemical matter in the Novartis collection (14%) 34 contrasts with the value of 48.3% for the GSK collection hereby reported. This difference could be due to the nature of the chemical compounds in every collection or the type of assays run. Indeed, the GSK collection has been largely populated with compounds selected to maximize chemical diversity, and the proportion of inactive compounds closely follows the results of a simulation based on our mathematical model 5 when this collection is presented in silico against a typical portfolio of screens. In contrast, a chemogenomics model as pursued by Novartis might be expected to yield more compounds with multiple activities. Another plausible explanation for the difference observed may result from using cutoffs based on statistical analysis of activity distribution to define hits per assay even if applying “a particularly stringent definition for biological inactivity in an assay (absolute z-score < 2)” (Novartis criterion) instead of the uniform 50% inhibition used to determine IFI (GSK criterion). Statistical cutoffs based on 3 standard deviations of negative controls or average activity across all compounds tested in HTS tend to be far lower than 50% inhibition and do include a significant proportion of random false positives. It should be noted that using a 50% inhibition cutoff is likely to result in a higher false-negative rate.
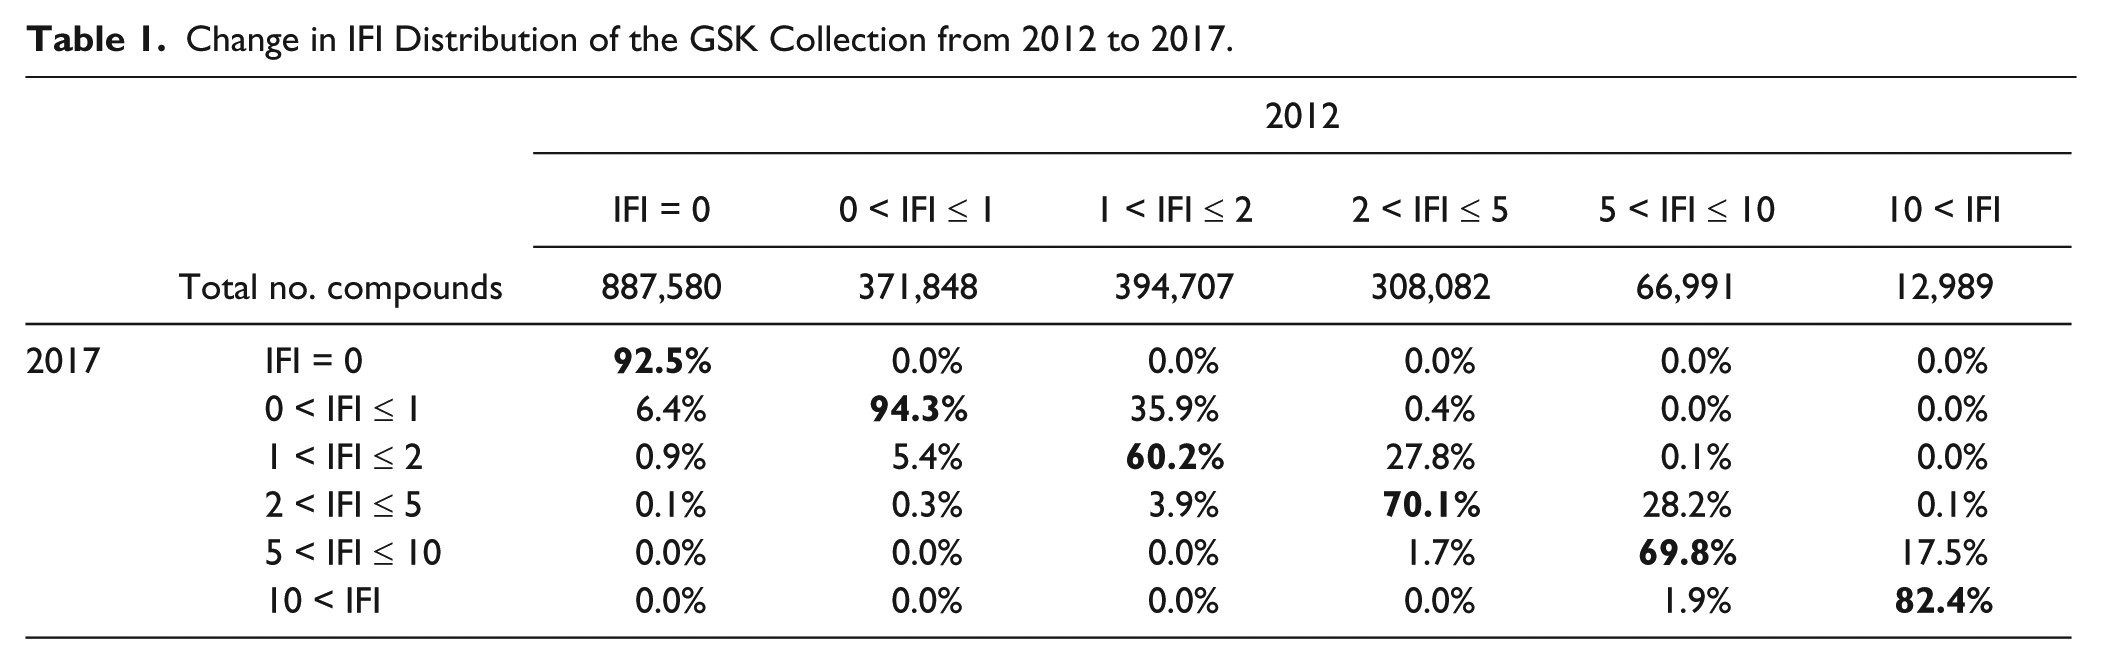
When IFI values recorded in 2012 for about 2 million compounds are compared with their 2017 values with 88 additional assay results, some interesting trends are observed ( Table 1 ). As described by Novartis’s authors, 34 dark chemical matter is not expected to be dark forever. When tested against different targets, 7.4% of the 2012 inactive compounds do exhibit some level of activity. Unexpectedly, 0.1% even exhibit a somewhat noisy behavior (i.e., 2 < IFI ≤ 5). Analysis of the activity profile of these compounds shows that most are kinase inhibitors that hit phenotypic assays (not excluded from the IFI analysis). Every IFI bin shows consistency between 2012 and 2017 classification, with more compounds changing bins from the intermediate levels (bold, Table 1 ).
Change in IFI Distribution of the GSK Collection from 2012 to 2017.
Definition of New Nuisance Filters
When the structures of nuisance compounds in the GSK collection were analyzed, some new substructure filters were identified between 2008 and 2010 using a variety of approaches. Data-driven analysis 37 was developed initially for analysis of HTS data. A variation on the method to use binary class information has been used successfully to identify chemotypes unstable in DMSO.38,39 As IFI is on a scale of 0%–100% (though heavily skewed to the right for our collection, as the majority of compounds have IFI values ≤ 1), it is a natural end point for data-driven analysis. A number of whole-molecule and substructure-type descriptors are used to label the molecules, with each label being considered independently to assess whether compounds with the label have a significantly higher mean IFI than the mean of the whole data set (see Harper et al. 37 for details). Descriptors considered here include reduced graphs 37 and reduced graph fragments, Bemis–Murcko frameworks 40 (full atom, bond graph, and graph), rings and ring assemblies, recap fragments, 41 and substructure matches against previously defined filters.
New filters were derived from the analysis of significant descriptors, tested for specificity and agreed on by chemists involved in hit triage. Examples are shown in
Table 2
. Note that since originally described internally, some of these filters have been published with similar structural information (e.g., azapteridines, described in 2012 by Bruns and Watson
16
). A visual summary of the process described above to identify nuisance filters is included in the supplemental material (
Nuisance Filters Identified by Structure Analysis of Noisy Compounds in the GSK HTS Collection.
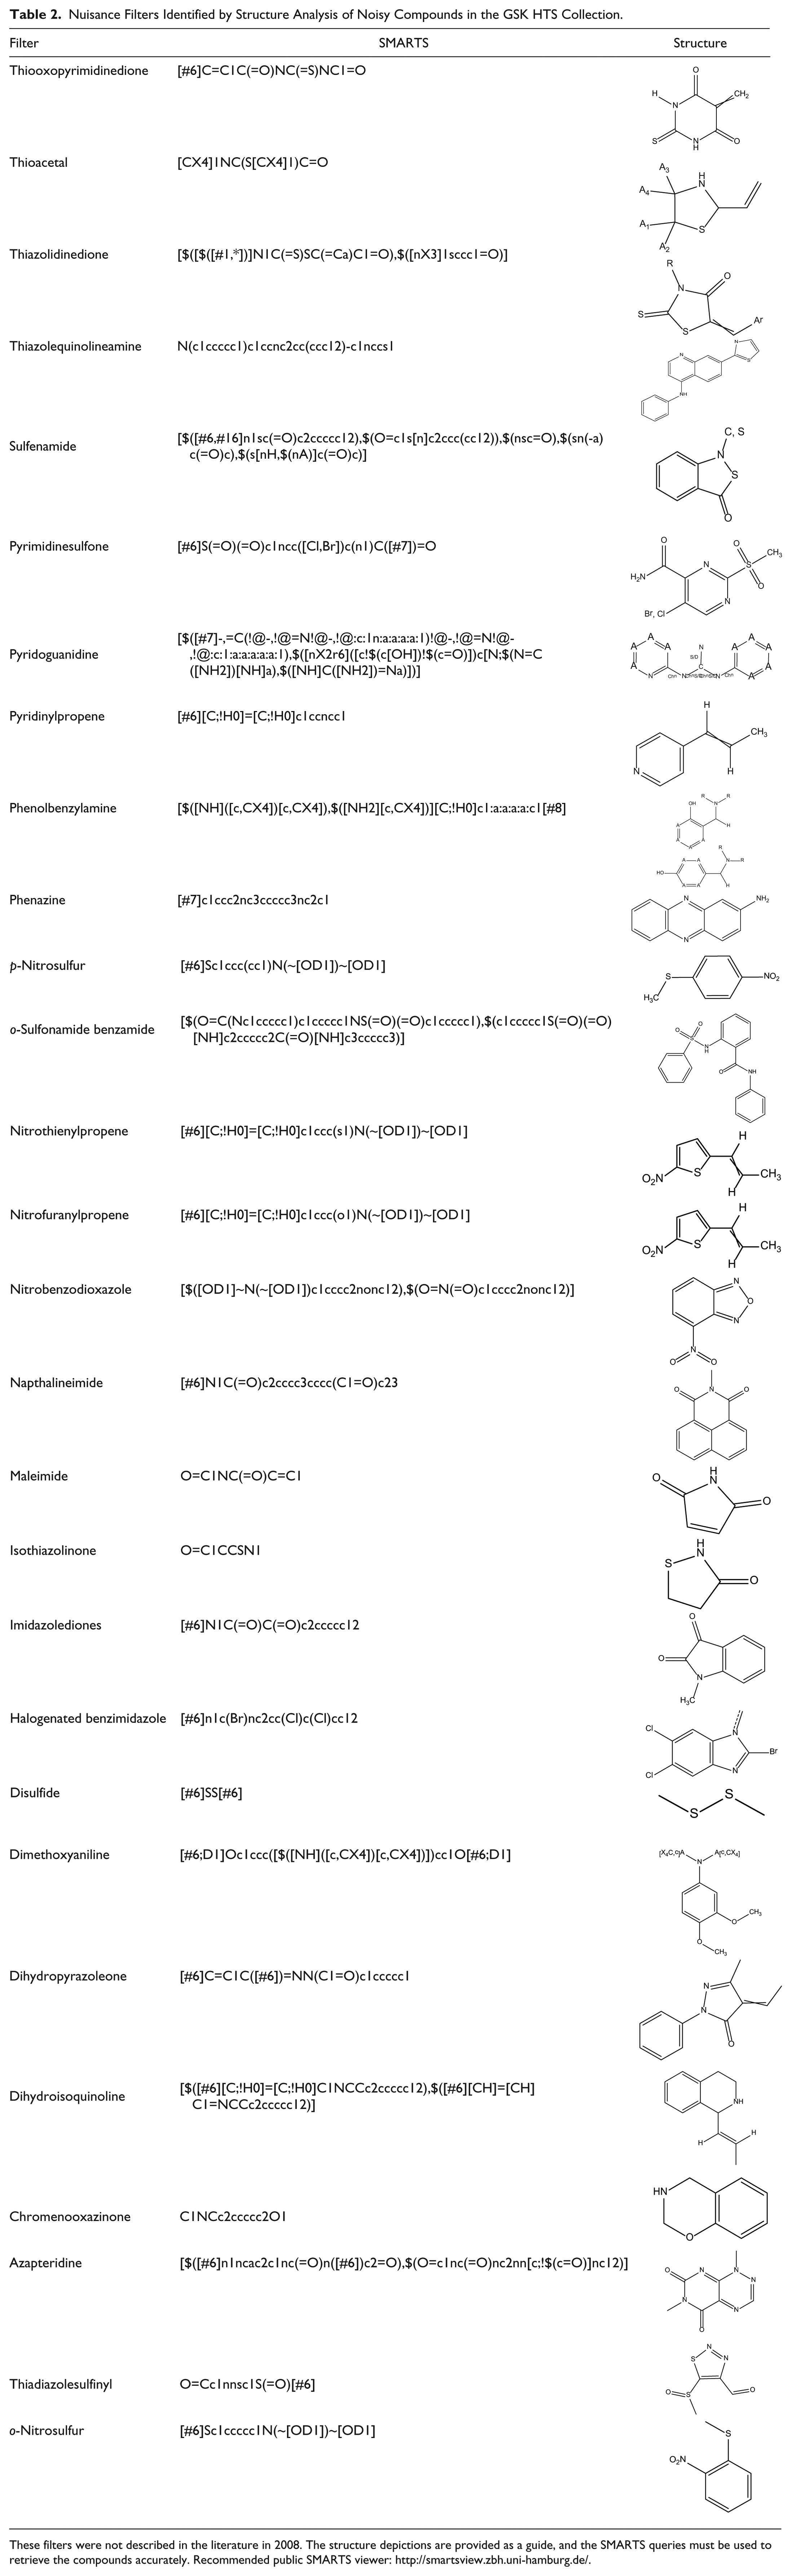
These filters were not described in the literature in 2008. The structure depictions are provided as a guide, and the SMARTS queries must be used to retrieve the compounds accurately. Recommended public SMARTS viewer: http://smartsview.zbh.uni-hamburg.de/.
Analysis of Nuisance Filters
The promiscuity profile of nuisance filters in the GSK collection is shown in
Figure 3
. A perfect nuisance filter would identify a set of compounds that are all noisy (the noisy fraction would be 1). There are only two filters in this category that happen to identify the same number of compounds in the GSK collection (14) and thus appear as a single overlapping dot in the scatterplot. These filters are thiadiazolesulfinyl (described in
Table 2
) and dihydroxybenzene.
8
On the other end of the spectrum, there are eight apparently useless filters that fail to identify even a single noisy compound in the GSK collection. The identity and characteristics of all filters showed in this plot are available in
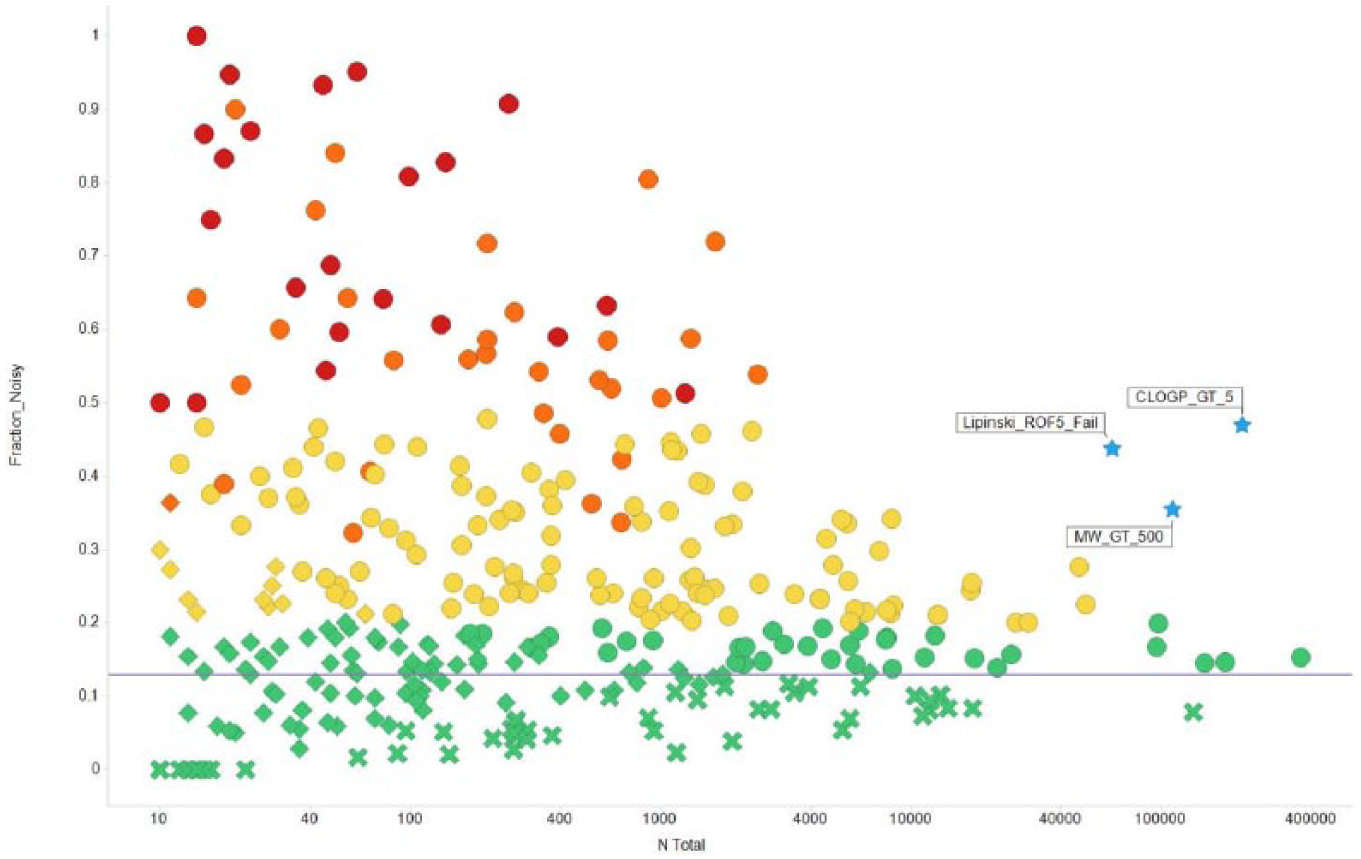
Overview of nuisance filters analyzed. “N Total” represents the number of compounds in the GSK collection identified by every filter, and “Fraction Noisy” the fraction of compounds in every filter showing IFI > 2. Only unique and head-of-family filters with at least 10 compounds tested are shown. Shapes depict labels by statistical analysis: potentially useful (circles), ambiguous (diamonds), and not useful (crosses). Colors indicate recommended course of actions: remove (red), extreme caution (orange), proceed with caution (yellow), and not a PAIN (green). The physicochemical filters are labeled and shown as blue stars.
For many published filters (96), there were < 10 compounds in the GSK collection and they are not subject to further analysis (
Significantly larger than the overall fraction of noisy compounds, which is pOverall = 0.1287 (see Statistical Methods section), then this filter is labeled “potentially useful” in identifying nuisance compounds
Not significantly different from the overall fraction of noisy compounds (pOverall = 0.1287), then the filter is labeled “ambiguous” in identifying nuisance compounds
Significantly smaller than the overall fraction of noisy compounds (pOverall = 0.1287), then this filter is labeled “not useful” in identifying nuisance compounds
Figure 4
shows examples of the distribution of IFI bins for all compounds in filters in the three categories identified.
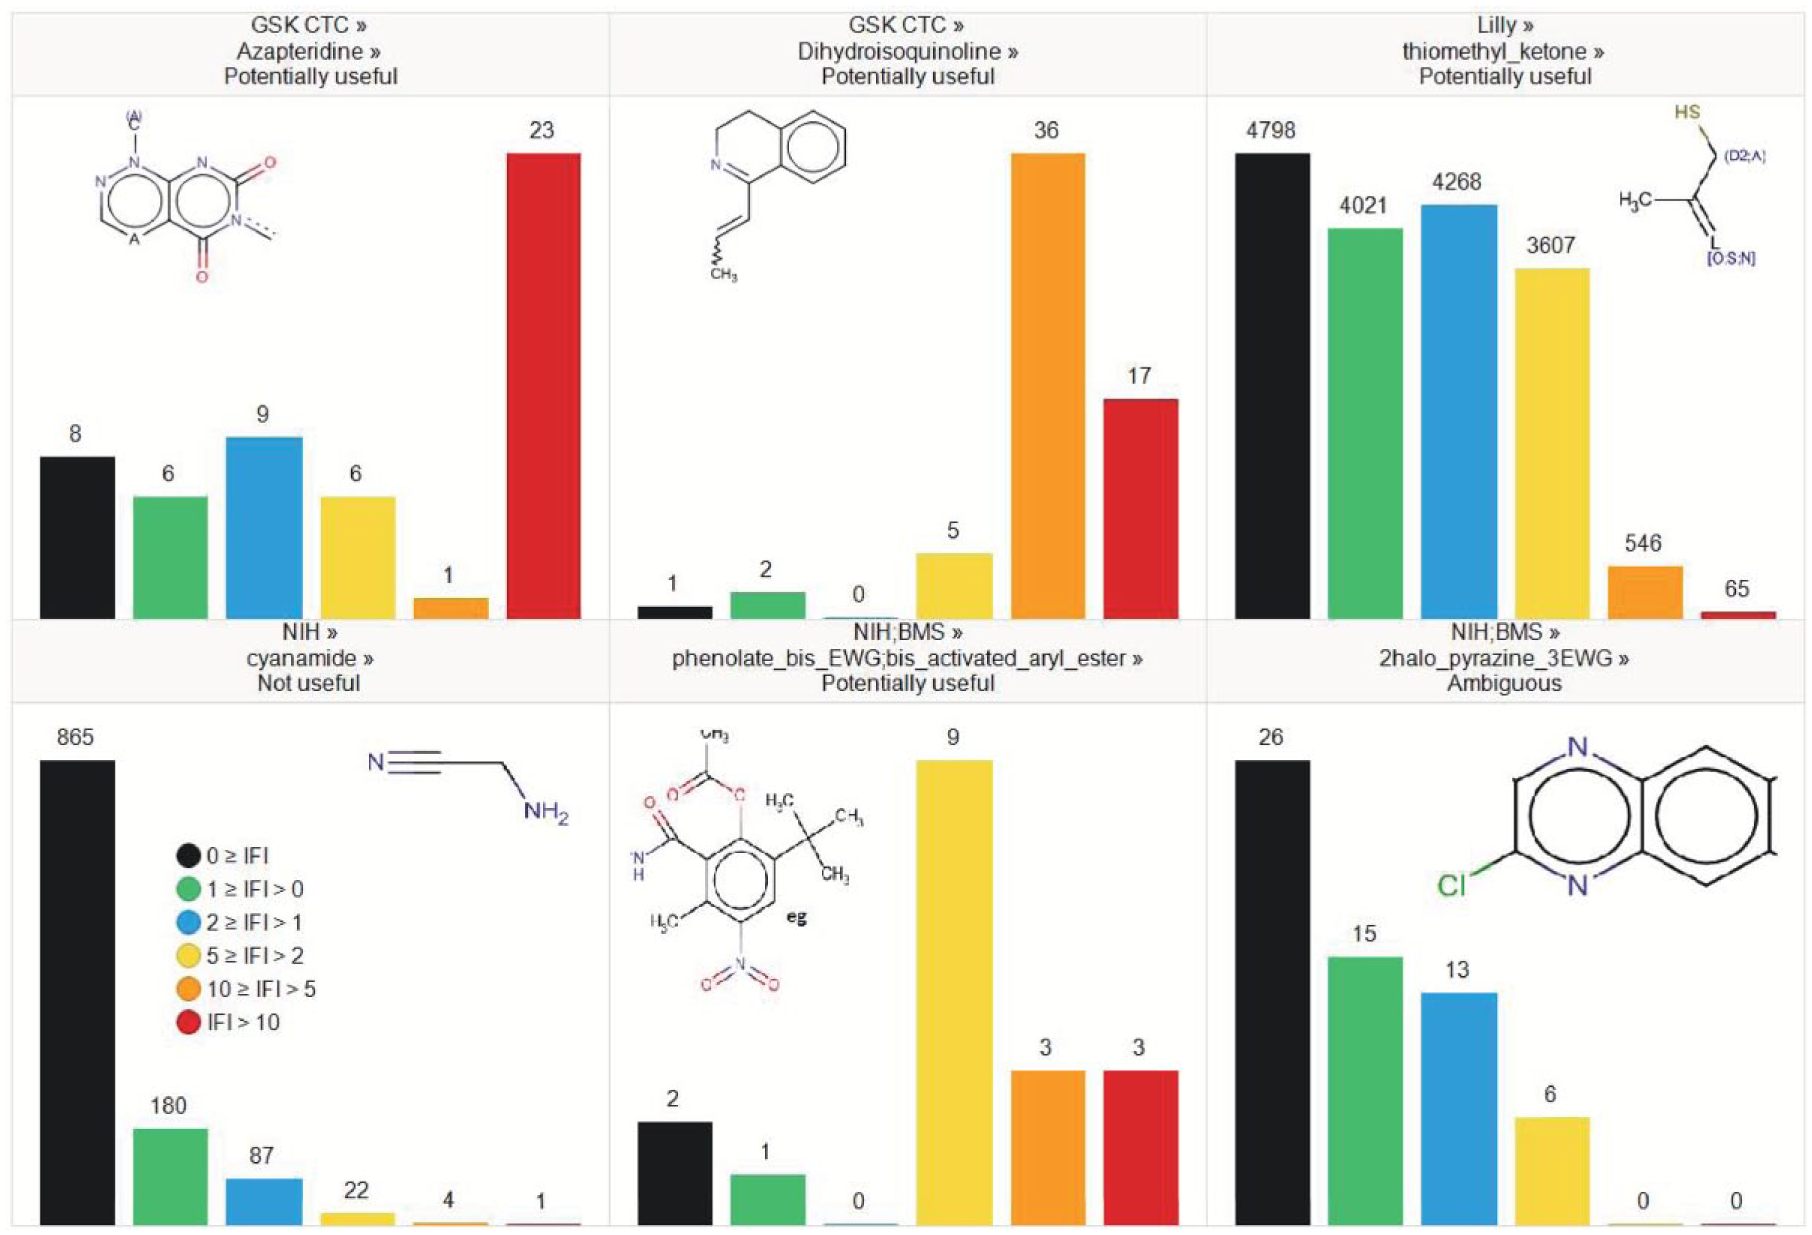
Promiscuity profile for a few nuisance filters exemplifying the differences observed in enrichment in noisy compounds.
Using the statistical criteria above, we identified 198 potentially useful, 102 ambiguous, and 47 not useful filters. However, practical application of filters is not a binary decision of “screen” or “not screen.” Compounds can be kept in a collection but marked as suspicious; a compound class may be kept in the collection but not added to by further acquisitions. For some of the filters with large membership, there is a loss of many compounds with no evidence of bad behavior, for example, the ChEMBL Hetero-Hetero filter identifies 55,350 noisy compounds but also labels 305,470 well-behaved compounds. Removal of all these compounds would seriously degrade the hit-finding potential of a compound collection.
There is also the degree of noisiness, for example, the small number of biotin derivatives in the set are noisy (18/20 with IFI > 2) and often very noisy (12/20 with IFI > 5), presumably in specific assay formats.
Statistical significance can mask limitations due to the domain of applicability of the filter. For example, the ChEMBL Filter34_isotope filter (containing elements that are not natural isotopes) has 8/14 matches from the same chemotype, varying in the amine of the amide (and position of the isotope). Outside of the chemotype, it is not clear why deuterated compounds would be frequent hitters.
At the lower end, there are filters that clearly do not label frequent hitters but do remove compounds that it would be sensible not to work on. For example, nitrosamine is a known problematic structure due to genetic toxicology. 42
Therefore, we have taken the initial filter classification and labeled it according to recommended action:
Fraction noisy ≤ 0.2:
This is not a filter that describes frequent hitters or cross-assay interference. It may describe compounds that are not desirable due to other effects.
For compounds with fraction noisy > 0.2, three further criteria are used: ○ p value (two sided exact) < 0.05 ○ Fraction noisy ≥ 0.5 ○ Fraction noisy (IFI_10) ≥ 0.1
If a filter meets all three criteria, If a filter meets two of the criteria,
The remaining filters, which show some but not overwhelming evidence of high IFI, are marked
In summary, as disclosed in
The “extreme caution” and “removal” categories collectively identify 20,445 compounds from the GSK collection, of which 11,745 (57%) are noisy. The “proceed with caution” category identifies 830,977 compounds, of which 277,970 (33%) are noisy, the majority of which (166,451, or 60%) are marked by the physicochemical filters of clogP > 5, molecular weight > 500 Da, or violators of Lipinski’s rule of 5 (Ro5). 43 As shown in Figure 3 , the fraction of noisy compounds among those with a molecular weight > 500 (35% noisy), clogP > 5 (47%), and Lipinski’s Ro5 fail (44%), corroborating the well-documented promiscuity associated with these properties. 44
These proportions highlight the difficulties associated with the derivation of “nuisancephores”: many compounds identified by these filters are inactive, and complete removal of these compounds from a screening collection using literature PAINS filters is not recommended. The drafting of fit-for-purpose substructure filters requires close attention to detail and, ideally, deep understanding of the mechanism of action that explains the pan-active behavior associated with the nuisancephore.
Target Class or Assay Technology Bias
High promiscuity might be associated with biologically meaningful pan-activity, as in the case of kinase inhibitors. It can also be the result of assay technology-specific interference without a detrimental effect in medicine (e.g., optical interference).
Eight potentially useful filters were identified as showing target bias in up to two target classes. These filters are shown in
Twenty-one potentially useful filters were identified as showing assay technology bias in up to three technology classes, with most biases occurring in three technology classes: “other technologies,” “absorbance,” and “alphalisa.” These filters are marked accordingly in
The relatively low number of filters with target class (8/196) or assay technology bias (21/196) informs the debate about how universal filters can be described using a small number of assays. As can be observed in
Utility of Abbott Tiers
In addition to structural filters, there is a large body of literature that attributes responsibility for the nuisance behavior of HTS compounds to physicochemical properties45,46 (e.g., molecular weight, clogP, rotatable bonds, and a combination of properties and activity). The Abbott Physicochemical Tiering 47 system groups compounds based on physicochemical properties, representing a pragmatic approach in the selection of hits to follow-up, without removing compounds from an HTS collection. There are seven tiers, with Tier 1 compounds satisfying rule of 4 (Ro4), number of aromatic ring (NAR) < 4, and fraction of SP3 carbon atoms (fsp3) > 0.5. Tier 2 compounds satisfy Ro4 and NAR < 4. Tier 3 compounds simply satisfy Ro4. Tier 4 compounds satisfy Ro5, NAR < 4, and fsp3 > 0.5. Tier 5 contains compounds that satisfy Ro5 and NAR < 4. Tier 6 contains those compounds that simply pass Ro5. Tier7 compounds fail Ro5.
Sample Contaminants as Nuisance
Although most publications describing nuisance screening hits have focused on the chemical structures of the false positives, a less widely discussed, but equally common effect, is interference activity due to minor contaminants in the screening samples. Even compounds that appear to be of high purity (defined by liquid chromatography–mass spectrometry [LC-MS] and nuclear magnetic resonance [NMR]) have been shown to lose activity upon re-preparation or enhanced purification due to removal of impurities invisible to these commonly used analytical techniques. Over the years, many potential sources of contamination have been suggested but have ultimately been difficult to prove. Occasionally, these contaminants might even behave as specific effectors (e.g., a plastic contaminant 48 ).
At GSK, we experienced this problem in the evaluation of hits from an HTS campaign looking for inhibitors of the tyrosine kinase ZAP70 using a fluorescence resonance energy transfer (FRET)-based assay. Detailed investigation revealed that the observed inhibition was due to a contaminant introduced during purification by an acidic ion exchange cartridge. Although the exact identity of the isolated contaminant remains unknown, its biological activity was consistent with activity observed with samples where the contaminant was present as a minor component. Activity therefore had been erroneously attributed to the compound structure.
Broader analysis showed that the activity of this contaminant had been observed in several unrelated screens, and the investigation into potential sample contaminant now forms part of our evaluation of putative hits.
Furthermore, some combinatorial arrays seem to be noisy due to the presence of impurities left behind in the synthesis or purification of the compounds, and these impurities can be present in different levels confounding spurious activity from the contaminant with bona fide structure–activity relationship (SAR).
Examples of IFI for a few noisy arrays are included in
Another example of sample contaminants showing inhibitory activity has been observed on samples purified with trifluoroacetic acid (TFA) that upon final evaporation might retain excess acid. Compounds registered as TFA salts in the GSK collection (>200,000) show a fraction of noisy compounds of 19.15%, above the average of 12.85%. Specific assays involving pH-sensitive reactions tend to suffer from this artifact.
Discussion
Nuisance compounds have contaminated hit lists since the early days of HTS. We, like many other groups, find filters essential to prevent the inclusion of undesirable compounds in screening collections and to allow their exclusion from hit lists. It is hard to properly define these filters due to the relatively moderate activity of nuisance compounds when tested against diverse targets using diverse assay technologies, and due to the heterogeneous profile of analogs that often do not exhibit an obvious promiscuous profile. In our work, we have found it necessary to employ a variety of filter strategies: substructures for reactivity, desirability, stability, and true PAINS, as well as molecular property, promiscuity (IFI), and sample provenance considerations.
Throughout this work, we have employed heuristics and customized methods to define the promiscuity of compounds and interrogate the validity of PAINS filters. Other groups have reached similar conclusions using different tools. Most reports have used PubChem, a public repository of screening data on a reasonably sized compound collection. A precedent in a pharma collection was published by Nissink and Blackburn exploring frequent hitters in the AstraZeneca HTS collection. 49
Our evaluation of the published PAINS filters in the GSK screening collection identified some filters that do not group compounds with significant promiscuity. Nevertheless, even these filters might be useful if the potential bioactivity from members of the class can be ascribed to undesirable chemical properties. As with all areas of drug discovery, overreliance on one particular set of rules or principles can be counterproductive. Data-driven analysis combined with good practice in hit qualification is required to ensure the quality of hits selected for progression. 50
Although we have shared a particular classification of PAINS filters, we are also making available relevant data for the readers to draw their own conclusions after contrasting with their own experience.
Supplemental Material
Supp_Material_for_Nuisance_Compounds_PAINS_Filters__by_Chakravorty_et_al – Supplemental material for Nuisance Compounds, PAINS Filters, and Dark Chemical Matter in the GSK HTS Collection
Supplemental material, Supp_Material_for_Nuisance_Compounds_PAINS_Filters__by_Chakravorty_et_al for Nuisance Compounds, PAINS Filters, and Dark Chemical Matter in the GSK HTS Collection by Subhas J. Chakravorty, James Chan, Marie Nicole Greenwood, Ioana Popa-Burke, Katja S. Remlinger, Stephen D. Pickett, Darren V. S. Green, Martin C. Fillmore, Tony W. Dean, Juan I. Luengo and Ricardo Macarrón in SLAS Discovery
Supplemental Material
Supp_Table_2S_Nuisance_Compounds_PAINS_filters__Chakravorty_et_al – Supplemental material for Nuisance Compounds, PAINS Filters, and Dark Chemical Matter in the GSK HTS Collection
Supplemental material, Supp_Table_2S_Nuisance_Compounds_PAINS_filters__Chakravorty_et_al for Nuisance Compounds, PAINS Filters, and Dark Chemical Matter in the GSK HTS Collection by Subhas J. Chakravorty, James Chan, Marie Nicole Greenwood, Ioana Popa-Burke, Katja S. Remlinger, Stephen D. Pickett, Darren V. S. Green, Martin C. Fillmore, Tony W. Dean, Juan I. Luengo and Ricardo Macarrón in SLAS Discovery
Supplemental Material
Supp_Table_3S_Nuisance_Compounds_PAINS_filters__Chakravorty_et_al – Supplemental material for Nuisance Compounds, PAINS Filters, and Dark Chemical Matter in the GSK HTS Collection
Supplemental material, Supp_Table_3S_Nuisance_Compounds_PAINS_filters__Chakravorty_et_al for Nuisance Compounds, PAINS Filters, and Dark Chemical Matter in the GSK HTS Collection by Subhas J. Chakravorty, James Chan, Marie Nicole Greenwood, Ioana Popa-Burke, Katja S. Remlinger, Stephen D. Pickett, Darren V. S. Green, Martin C. Fillmore, Tony W. Dean, Juan I. Luengo and Ricardo Macarrón in SLAS Discovery
Footnotes
Acknowledgements
The authors acknowledge the contributions of many scientists from the department formerly known as Molecular Discovery Research, which created and curated the screening collection and developed and ran the HTS assays that have made this work possible. We are indebted to colleagues that worked with the authors in the GSK Cleaning the Collection team: Andy Brewster, Ralph Rivero, Katherine Widdowson, Sunny Hung, Pat Brady, Ian Churcher, David Drewry, and Tony Jurewicz. We thank Kelly Locke and Mel Leveridge for supplying ZAP70 results. We also thank Michael A. Walters (University of Minnesota, Department of Medicinal Chemistry) and colleagues for inspiring discussions over the years.
Supplemental material is available online with this article.
Declaration of Conflicting Interests
The authors disclosed the following potential conflicts of interest with respect to the research, authorship, and/or publication of this article: All authors were employed by GlaxoSmithKline R&D Pharmaceuticals, and their research and authorship of this article was completed within the scope of their employment with GlaxoSmithKline R&D Pharmaceuticals.
Funding
The authors disclosed receipt of the following financial support for the research, authorship, and/or publication of this article: All authors were employed by GlaxoSmithKline R&D Pharmaceuticals, and their research and authorship of this article was completed within the scope of their employment with GlaxoSmithKline R&D Pharmaceuticals.
References
Supplementary Material
Please find the following supplemental material available below.
For Open Access articles published under a Creative Commons License, all supplemental material carries the same license as the article it is associated with.
For non-Open Access articles published, all supplemental material carries a non-exclusive license, and permission requests for re-use of supplemental material or any part of supplemental material shall be sent directly to the copyright owner as specified in the copyright notice associated with the article.