
Abstract
The Yap-Hippo pathway has a significant role in regulating cell proliferation and growth, thus controlling organ size and regeneration. The Hippo pathway regulates two highly conserved, transcription coactivators, YAP and TAZ. The upstream regulators of the Yap-Hippo pathway have not been fully characterized. The aim of this study was to use a siRNA screen, in a liver biliary cell line, to identify regulators of the Yap-Hippo pathway that allow activation of the YAP transcription coactivator at high cell density. Activation of the YAP transcription coactivator was monitored using a high-content, image-based assay that measured the intracellular localization of native YAP protein. Active siRNAs were identified and further validated by quantification of CYR61 mRNA levels (a known YAP target gene). The effect of compounds targeting the putative gene targets identified as hits was also used for further validation. A number of validated hits reveal basic aspects of Yap-Hippo biology, such as components of the nuclear pore, by which YAP cytoplasmic–nuclear shuttling occurs, or how proteasomal degradation regulates intracellular YAP concentrations, which then alter YAP localization and transcription. Such results highlight how targeting conserved cellular functions can lead to validated activity in phenotypic assays.
Introduction
The Yap-Hippo pathway has been identified as a critical pathway regulating cell growth and organ size. 1 Therefore, regulating transcriptional activity of YAP may have applications in controlling cell division, the proliferation of stem cells, or even adjusting the regeneration of organs for regenerative medicine applications.
The Hippo pathway was first discovered as a developmental pathway controlling organ size in Drosophila, with the overgrowth of the imaginal discs leading to a hippopotamus-like appearance. 2 The final transcriptional stage of signaling by the Hippo pathway is mediated by YAP, which is able to act as both a transcriptional coactivator and repressor. 3 The core of the canonical Hippo pathway consists of a set of kinase effectors that act to phosphorylate the YAP protein, thus preventing its translocation to the nucleus. This signaling cascade is made up of the MST1/2 kinases that form a complex with the SAV1 protein. 4 This kinase complex then acts on the LATS1/2 kinases, which are associated with a regulatory protein MOB1. 5 The LATS1/2-MOB1 complex subsequently phosphorylates the YAP protein (and TAZ, which can also be signaled to by the Hippo pathway). 6
YAP is a transcriptional coactivator and was discovered due to its interactions with the SH3 domain of the YES protein-tyrosine kinase, which is a known oncogene. 7 YAP contains WW domains that are thought to play a role in signaling and protein–protein interactions. 8 Phosphorylation of YAP, on serines 127 and 381, allows the binding of 14-3-3 proteins that sequester YAP in the cytoplasm. 9 Phosphorylation of YAP on serine 381 also allows further phosphorylation of YAP by other kinases so that it can ultimately be degraded by the proteasome. 9 Inhibition of the Hippo kinase cascade leads to YAP translocation to the nucleus, where it interacts with TEAD transcription factors to regulate gene expression for a number of pro-survival and proliferation genes. 10 Many of the components of the canonical Hippo pathway immediately upstream of YAP appear to be conserved across different systems. However, there are reports of different upstream components regulating the pathway in different cell lines. 11
Transient overexpression of YAP protein in the liver has been shown to induce a reversible increase in liver size, 12 and regulation of YAP protein levels by the Hippo pathway has also been show to regulate the size of the liver. 13 Therefore, the aim of this study has been to identify genes that regulate Yap-directed transcriptional activity in liver, using a biliary-derived cell line, with the hope that such targets might serve as a starting point for projects to identify treatments to improve liver regeneration.
This study described the design of a high-content, image-based assay that monitors the ability of treatments causing YAP to translocate to the nucleus, even when cells are present at high density. The screen identified a number of genes that are involved in basic cellular functions, such as nuclear-to-cytoplasmic export or proteolysis, but which score as active in this phenotypic screen. It was possible to validate these hits using an orthogonal assay to monitor activation of YAP-dependent gene expression. In addition, compound inhibitors of these functions also brought about a positive signal in the assay, further confirming that such conserved cellular functions can be identified in specific phenotypic cell-based assays. These results highlight how screens can identify conserved cellular functions as having specific effects on phenotypic assays. Such frequent hitters can be quickly identified in hit lists from phenotypic screens and can be deprioritized so as not to waste resources following up on such generic actives.
Materials and Methods
Cell Culture and siRNA Transfection
The cell line HuCCT1 (Riken Cell Bank cat. RCB1960) was grown in standard RPMI 1640 medium supplemented with L-glutamine, with 10% heat inactivated (HI) fetal bovine serum (FBS) and 1% penicillin-streptomycin (all media and supplements from Invitrogen, Grand Island, NY). The cell line was confirmed to be mycoplasma negative and tested on a regular basis.
Transfection of siRNAs used Opti-MEM Reduced Serum Medium (Gibco, Carlsbad, CA) and Lipofectamine RNAiMAX (Invitrogen). Briefly, the siRNAs were diluted to 206 nM in Opti-MEM, and 4 μL of this solution was added to each well. The Lipofectamine RNAiMAX was diluted 1/50 in Opti-MEM and then incubated at room temperature for 5 to 10 min. Then 4 μL of this solution was added to each siRNA and incubated for 20 to 30 min for complex formation. During this time, the HuCCT1 cells were prepared by treatment with trypsin and incubated at 37 °C for 10 min. The cell density was adjusted to 280 K cells/mL (i.e., ~7000 cells/well in a volume of 25 μL). The transfected cells were then incubated at 37 °C for 48 h in black Greiner cell culture µClear, 384-well plates.
The proteasome inhibitor Bortezomib and the nuclear pore inhibitor KPT-185 were purchased from Selleckchem (Houston, TX, www.Selleckchem.com). The compounds were dissolved in 90% DMSO and diluted to the appropriate concentrations, with the final DMSO concentration being 0.5% at each concentration tested.
High-Content Screening Assay
Screening was conducted as follows: On day 1, cells were transfected with siRNAs as described above. Twenty-four hours before the cells were fixed, Leptomycin B was added to a final concentration of 100 nM to the control wells. After 48 h, cells were fixed with 4% (final concentration) paraformaldehyde solution (Electron Microscopy Sciences, Hatfield, PA) for 15 min at room temperature. The wells were then washed three times with 100 μL of phosphate-buffered saline (PBS) (Amresco, Solon, OH). Cells were permeabilized by addition of 0.1% Triton X-100 (final concentration) in PBS for 15 min at room temperature. Next, the wells were washed three times with 100 μL of PBS before the primary antibody (mouse α-YAP [63.7] antibody, no. sc-101199, Santa Cruz, Dallas, TX) was added at a 1:1000 final dilution with 1.5% bovine serum albumin (Sigma, St. Louis, MO) in PBS. The antibody was incubated at 4 °C overnight. The following day (day 4 of the protocol), the wells were again washed three times with PBS, before the secondary antibody (Alexa Fluor 488-AffiniPure Donkey Anti-Mouse IgG, ImmunoResearch, West Grove, PA) was added at a final 1:1000 dilution with 1.5% BSA/PBS containing Hoechst 33342 (Invitrogen) diluted 1:10,000 and incubated for 2 h at room temperature, before being finally washed three times with PBS. A detailed step-by-step protocol is given in
Image Acquisition
Images were captured using the IN Cell Analyzer 2000 with 1× binning. The Hoechst exposure time was 0.1 s, and the Alexa Fluor 488 exposure time was 0.7 s. Flat-field correction was used for both channels. Screening was conducted using a Nikon, Plan Apo, 10×, 0.45 NA microscope objective.
Image Analysis
Image analysis was conducted using CellProfiler 2.0. The analysis pipeline consisted first of recognition of the nucleus using an Otsu adaptive threshholding algorithm, and then dilation from the nucleus by 20 pixels to define a cytoplasmic region. The amount of YAP staining was quantified in both regions, allowing a nuclear-to-cytoplasmic ratio for the YAP distribution to be calculated. In addition, the number of nuclei recognized was recorded to allow treatments causing changes in cell number to be quantified. Such analysis was routinely run on a Linux cluster using the Jenkins CI software to parallelize the calculations. 14
Hit Identification
Two readouts were then monitored: the nuclear-to-cytoplasmic ratio of YAP staining and the number of cells present in each image. These readouts were then processed using an internally developed software program. The program first corrected these values from each well using logistic regression to correct for possible edge effects, on a plate-by-plate basis. Then the tool normalized the results using cells treated with Leptomycin B as the positive control for YAP accumulation in the nucleus. Cell number was normalized to the median of the untreated, negative control.
Hits were selected as those treatments that did not reduce the cell number by more than 20% compared to the sample average and which increased the nuclear-to-cytoplasmic ratio for YAP to a value of 1.1 or greater. In addition, redundant siRNA activity (RSA) analysis was used to help select gene targets that increase the proportion of YAP in the nucleus. For every gene that was tested, the ranks of the corresponding siRNAs were compared to all other siRNAs using a hypergeometric test, under the null hypothesis that those siRNAs are not significantly enriched toward one end of the distribution. Because RSA relies on enrichment toward one end of the distribution, either genes with a single, but very active, siRNA or genes with multiple, but less active, siRNAs can be detected. Because the hypergeometric test is one-tailed, RSA has to be run twice: once for enhancers and once for inhibitors. 15
qPCR to Measure CYR61 Gene Expression
Hits from the YAP shuttling siRNA screen where selected and tested for their effect on the expression of CYR61 in HuCCT1 cells. Previous experiments had shown that CYR61 expression was YAP dependent, as reported previously.16–18 Actin was used as the endogenous gene control to normalize the CYR61 mRNA levels, as described previously. 19
Eight wells for each of the following siRNA controls (from Qiagen, Valencia, CA) were included for each treatment plate: (1) AllStars negative control, (2) AllStars Cell Death siRNA, and (3) a siRNA against YAP. Transfections were conducted as described for the screening assay. Cell lysate was then prepared by aspirating the culture media using the GNF Systems (San Diego, CA) WDII plate washer, and then the cells were washed with 100 μL of cold PBS, removing as much of the wash solution from each well as possible. The cells were then lysed by the addition of 15 μL of lysis buffer (10 mM Tris-HCl, pH 7.4, 0.25% IGEPAL, 150 mM NaCl, final concentrations, dissolved using DNase/RNase-free water, all from Sigma) as described by Shatzkes et al. 20 The cells were lysed by incubation for 30 min at room temperature. During this time, the PCR master mix (Roche Diagnostics, Indianapolis, IN) was prepared, including Taqman primers for actin and CYR61, and then 900 nL of the master mix was dispensed to the Roche LightCycler 1536 well assay plate using the Thermo Combi nL. The lysate plate was centrifuged for 3 min at 1500 g before 100 nL of lysate was added to the PCR assay plate using the Labcyte Echo 555 (Sunnyvale, CA). The assay plate was again centrifuged to ensure mixing of the solution before being sealed with the PlateLoc for 2 s at 160 °C. The plate was then analyzed in the Roche LightCycler 1536.
Results
Assay Setup
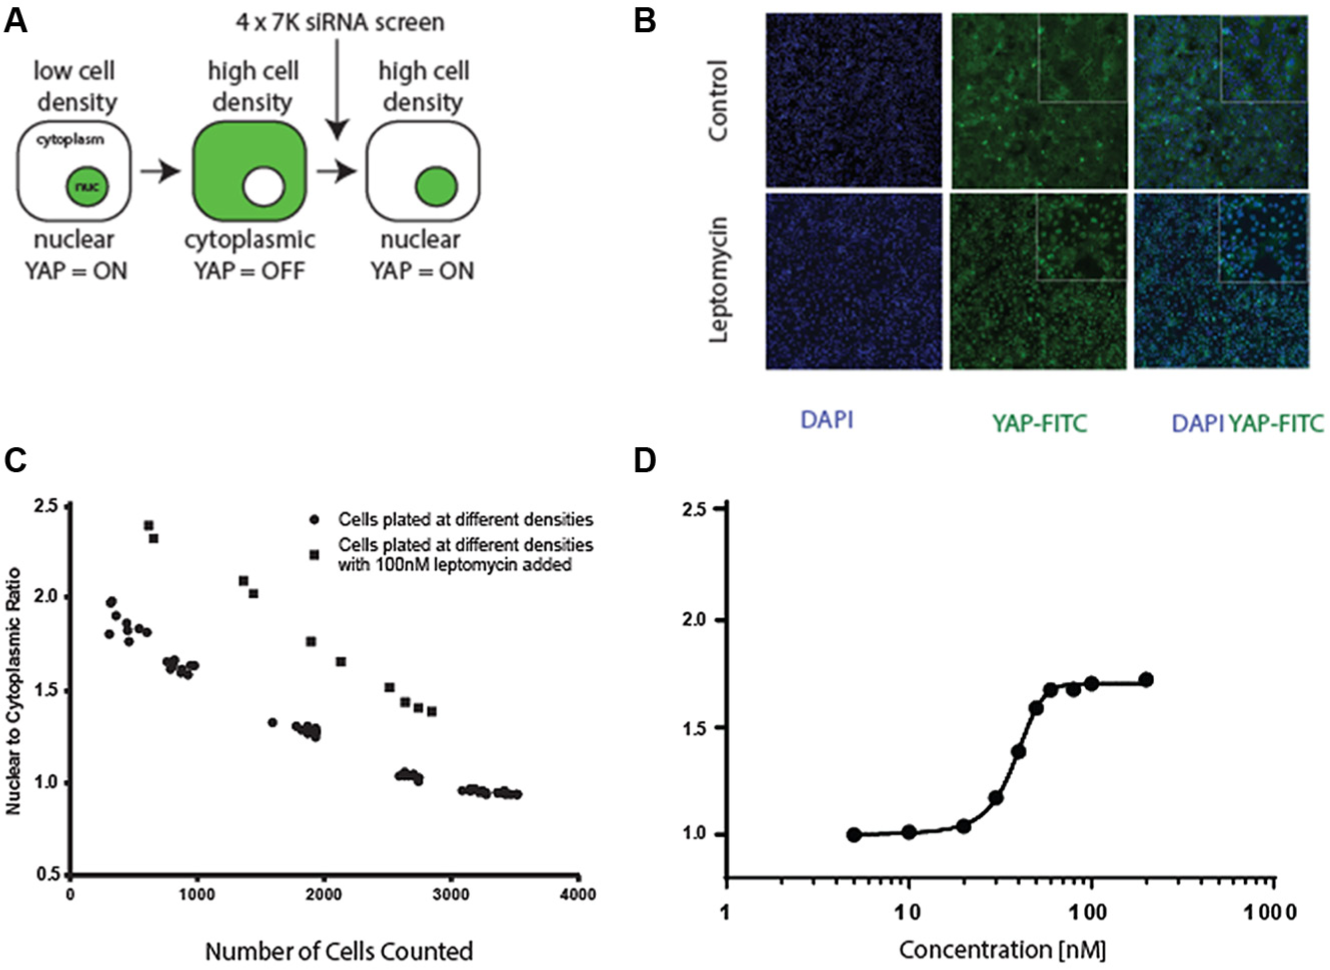
Assay development consisted of three separate stages. First, a cell line was identified where YAP could be clearly seen to translocate between the cytoplasm and the nucleus in response to changes in cell density. Second, siRNA transfection was optimized using cell death caused by siRNAs targeting essential gene functions. Third, an image recognition pipeline was developed using the CellProfiler software 21 to quantify the ratio of YAP present in the cytoplasm and nucleus. One factor making this more difficult is that image recognition at high cell density is generally more difficult, thus requiring careful optimization of the pipeline for cells at high density. Figure 1 gives an overview of assay development, including a schematic representation of the assay strategy, as well as experiments to monitor the effect of Leptomycin as a potential assay control and images of cells treated with Leptomycin.
(
Monitoring expression of genes whose expression is increased by YAP localization in the nucleus was then used as an additional, orthogonal assay with which to validate hits.
Finally, identifying siRNA controls proved to be quite difficult, with a number of gene products reported to be modulated YAP activity failing to show a dramatic effect on YAP translocation. This is exemplified by the effect of LATS1 siRNAs on the translocation of YAP to the nucleus, which only showed a relatively modest change in YAP location in this cell line. In order to identify a control that could be used to monitor assay performance during screening, Leptomycin B was chosen as a technical control. The intracellular localization of the Drosophila homologue Yorkie has been reported to be regulated by export of the protein from the nucleus via the XPO1 nuclear pore, which is inhibited by Leptomycin B. 23 As shown in Figure 1C,D , this proved to be the case, where exposure to Leptomycin B for a period of 24 h resulted in a significant accumulation of YAP in the nucleus of cells, at all cell densities tested, without a major decrease in cell density.
siRNA screening
Once an assay capable of detecting the accumulation of YAP protein in the nucleus of cells grown at high cell density was established, it was possible to use this to optimize the conditions for siRNA transfection (as described in Materials and Methods).
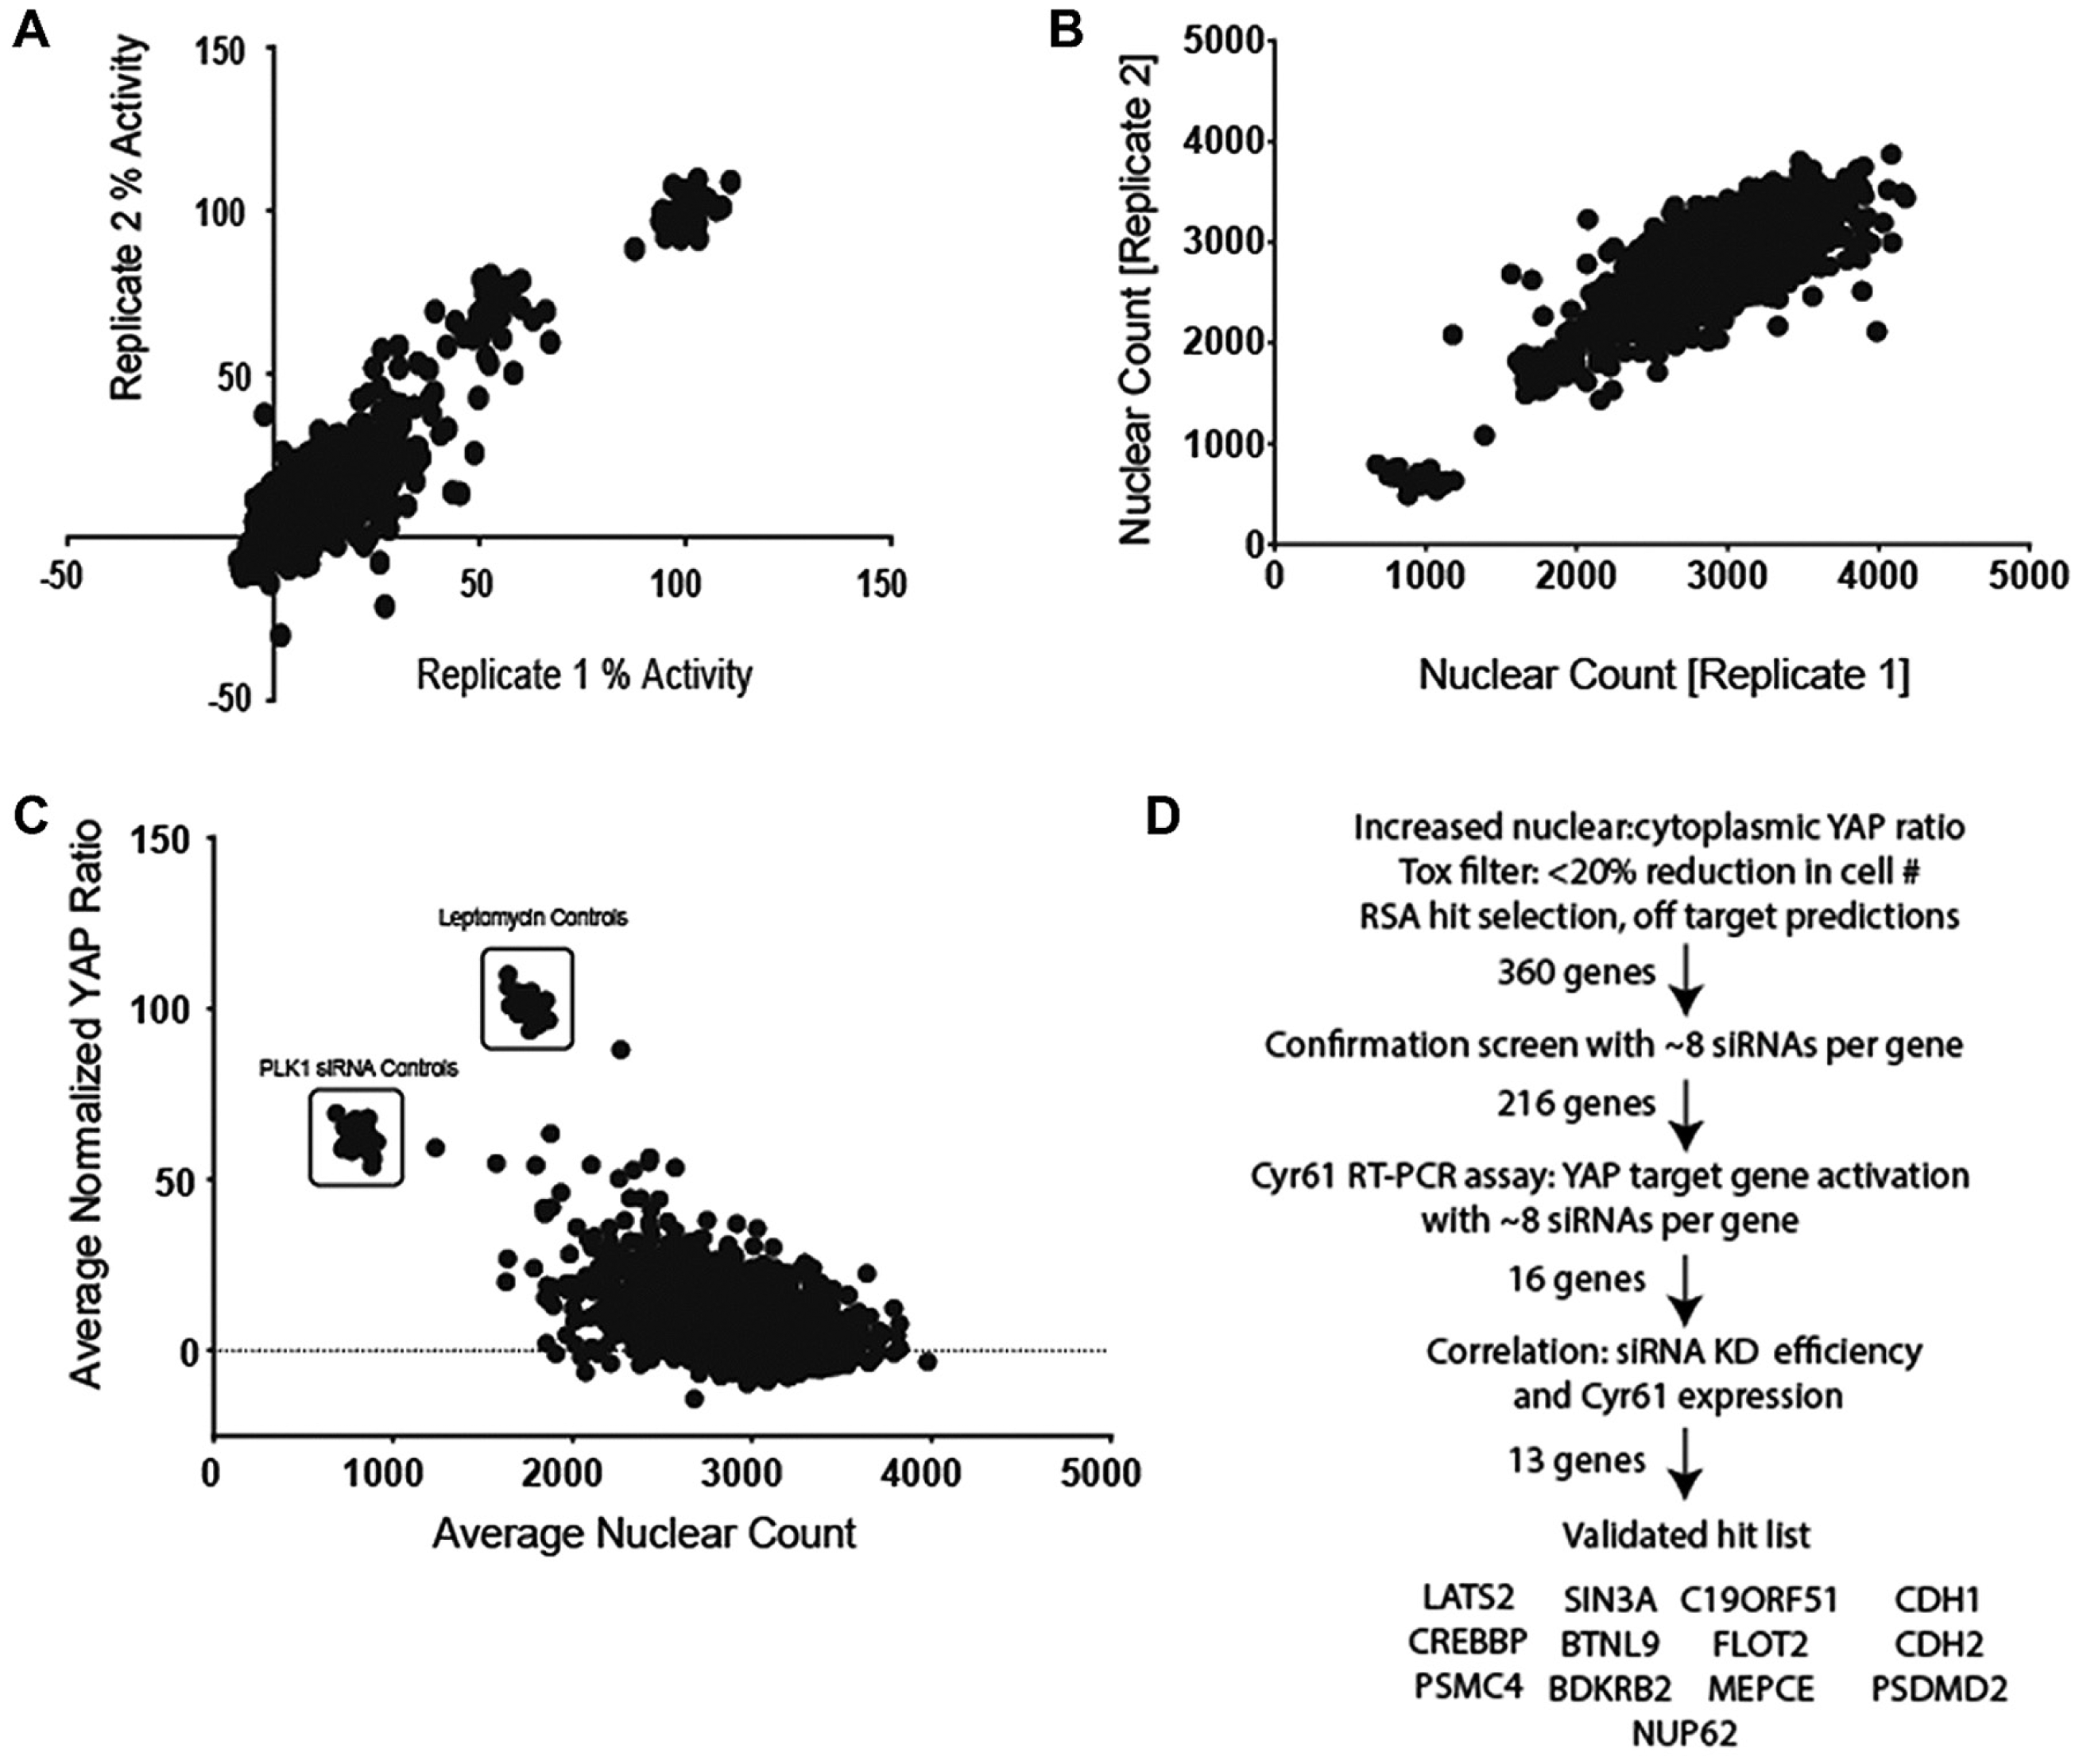
Once optimized, the assay was then used to screen the Qiagen 4 by 7k “Druggable Genome” siRNA library. The primary screening was conducted as two separate run sets so as to monitor interassay variability, as shown in Figure 2A for the normalized percent activity and in Figure 2B for the absolute cell number after treatment, both showing excellent reproducibility.
(
Hits from this screen were then selected in two ways: First, RSA was applied to the averaged data to identify those genes with the greatest effect on YAP translocation. 15 The second method was to review which genes were represented by the most active siRNAs. In both cases, those genes targeted by siRNAs that cause a greater than 20% reduction in cell number were deprioritized because it was obvious from assay development that any treatment lowering cell number will cause YAP to translocate to the nucleus.
Hit confirmation
Hits were confirmed by retesting all the siRNAs for a gene identified as causing YAP translocation to the nucleus, with less than 20% reduction in cell number. Additional siRNAs, from a different vendor, Dharmacon/ThermoFisher (Lafayette, CO), for each gene were also included so that a total of eight siRNAs targeting each gene were tested during validation, as shown in Figure 2C . These additional siRNAs were of different primary sequence and contained different backbone modifications, hopefully reducing the possibility of off-target effects.
Figure 2C emphasizes the difficulty of selecting genes that regulate YAP cytoplasmic-to-nuclear shuttling and accumulation without having an influence on cell number. However, the results were again rank-ordered on a per-gene basis, and those siRNAs whose knockdown increased nuclear accumulation of YAP, with less than a 20% drop in cell number, were selected for further characterization. Figure 2D then gives a flowchart summary of the screening stages, the selection criteria, and the final hit list.
The vast majority of these genes validated as hits have been reported to modulate the YAP-Hippo pathway previously, that is, LATS2 and CREBBP, 24 or are involved in cellular processes known to regulate the YAP-Hippo pathway such as cell–cell contacts (CDH1 and CDH2), 25 cytoskeleton interactions, and cytoskeleton interactions and G-coupled receptors (C19ORF51 or BDKRB2) 26 or membrane-associated proteins such as FLOT2 and BTNL9.
Validation by qPCR
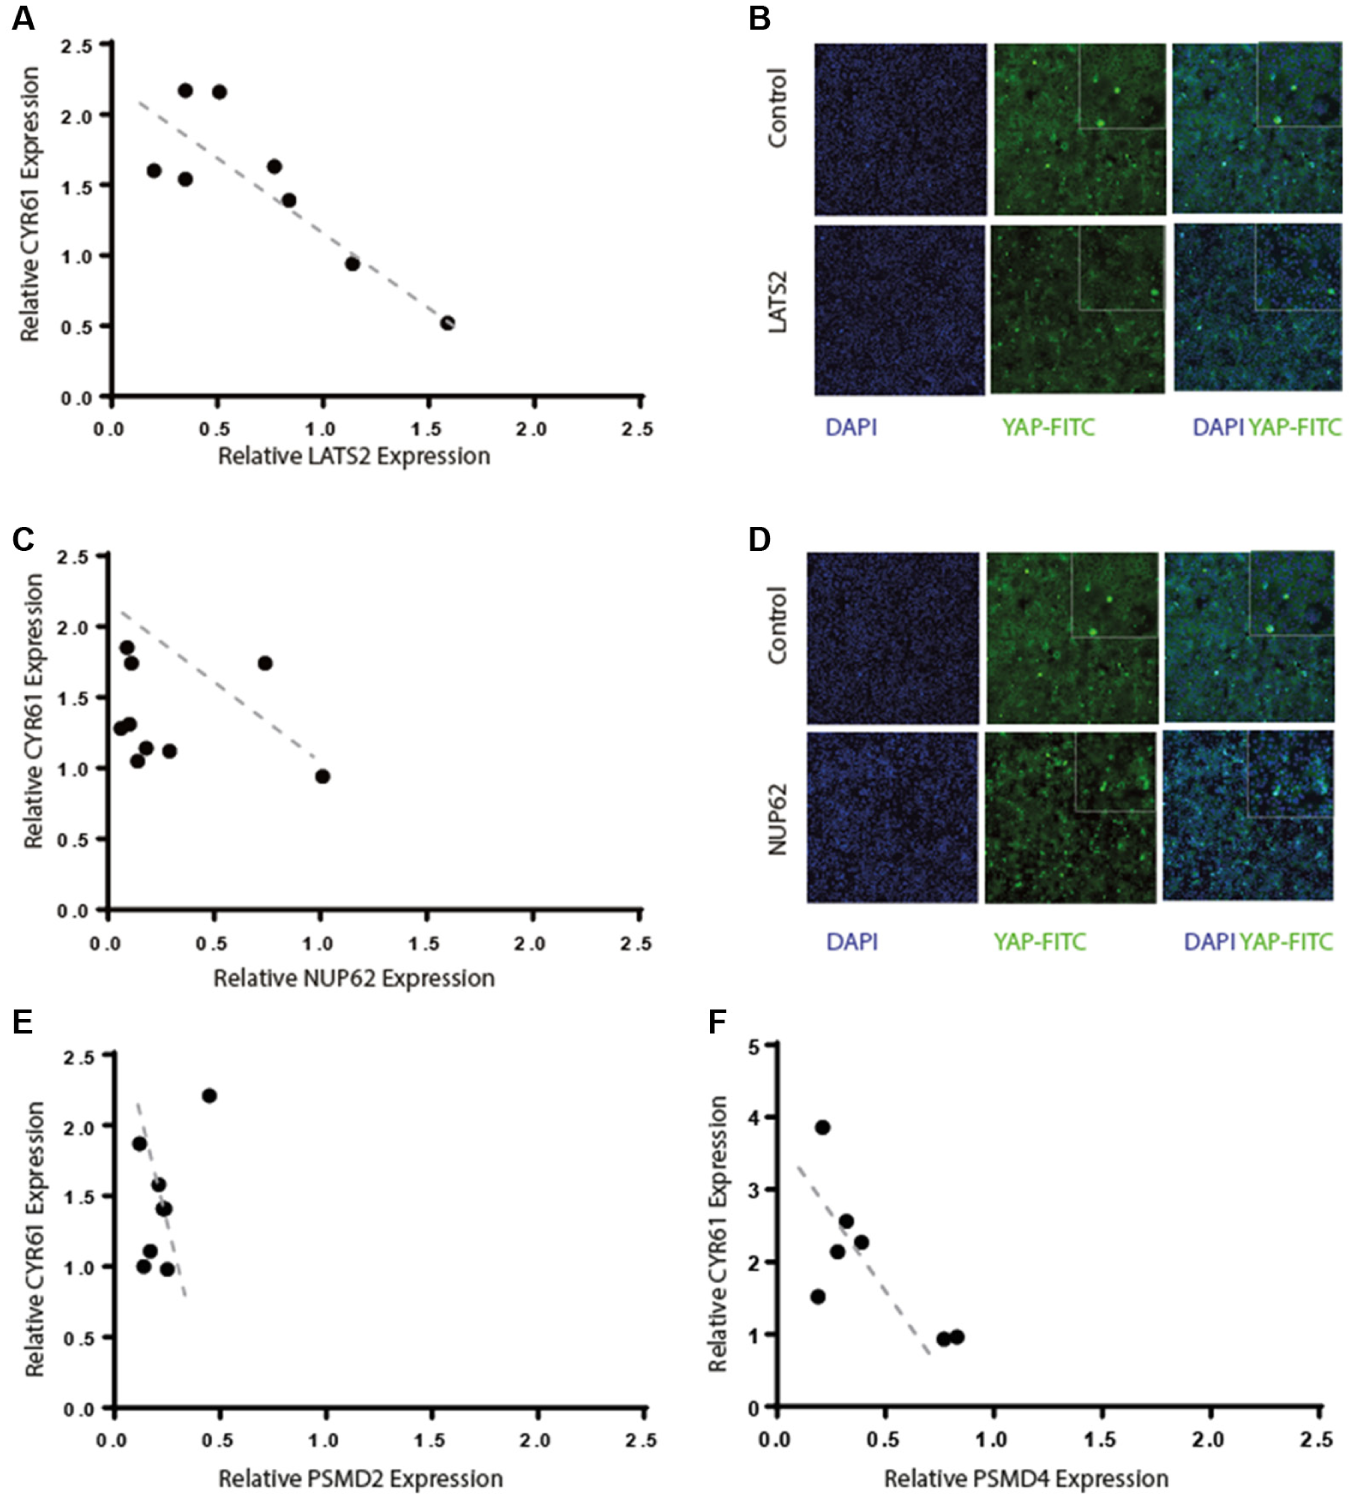
As an orthogonal means to determine if knockdown of the putative hits was having an effect consistent with activation of YAP, expression of the known YAP target gene, CYR61, was measured using qPCR compared to the efficacy of target gene knockdown. Results were normalized to actin levels so as to detect increases in gene expression.
Four sets of siRNAs, targeting four different genes, are highlighted in Figure 3 , showing the effect of knocking down LATS2, a known regulator of YAP (e.g., Guo et al. 27 ), as well as components of the proteasome and the nuclear export pore. Because different siRNAs will reduce the expression of their target gene by different amounts (depending on the mRNA structure and proteins bound to the mRNA), the relationship between target gene knockdown and the increase in CYR61 gene expression was monitored. First, ablation of LATS2 shows a clear inverse correlation between the efficacy of knockdown and induction of CYR61 expression, as expected. Second, the effect of siRNA knockdown of different nuclear pore subunits is shown with the NUP62 (and also NUP98), showing an effect on CYR61 that is loosely related to CYR61 expression. A similar weak correlation between ablation of subunits of the proteasome and increased CYR61 expression is seen. Confounding these results is the influence of cytotoxity caused by knocking down these gene targets for longer time periods, but the accumulation of YAP in the nucleus is clearly seen with knockdown of the nuclear pore component NUP62.
(
In order to confirm that inhibition of these target genes is actually able to act to increase YAP nuclear localization and gene activation, compounds targeting these targets were identified from the literature and tested in the translocation assay as a set of orthogonal probes to test the result of inhibiting these gene targets ( Fig. 4 ).
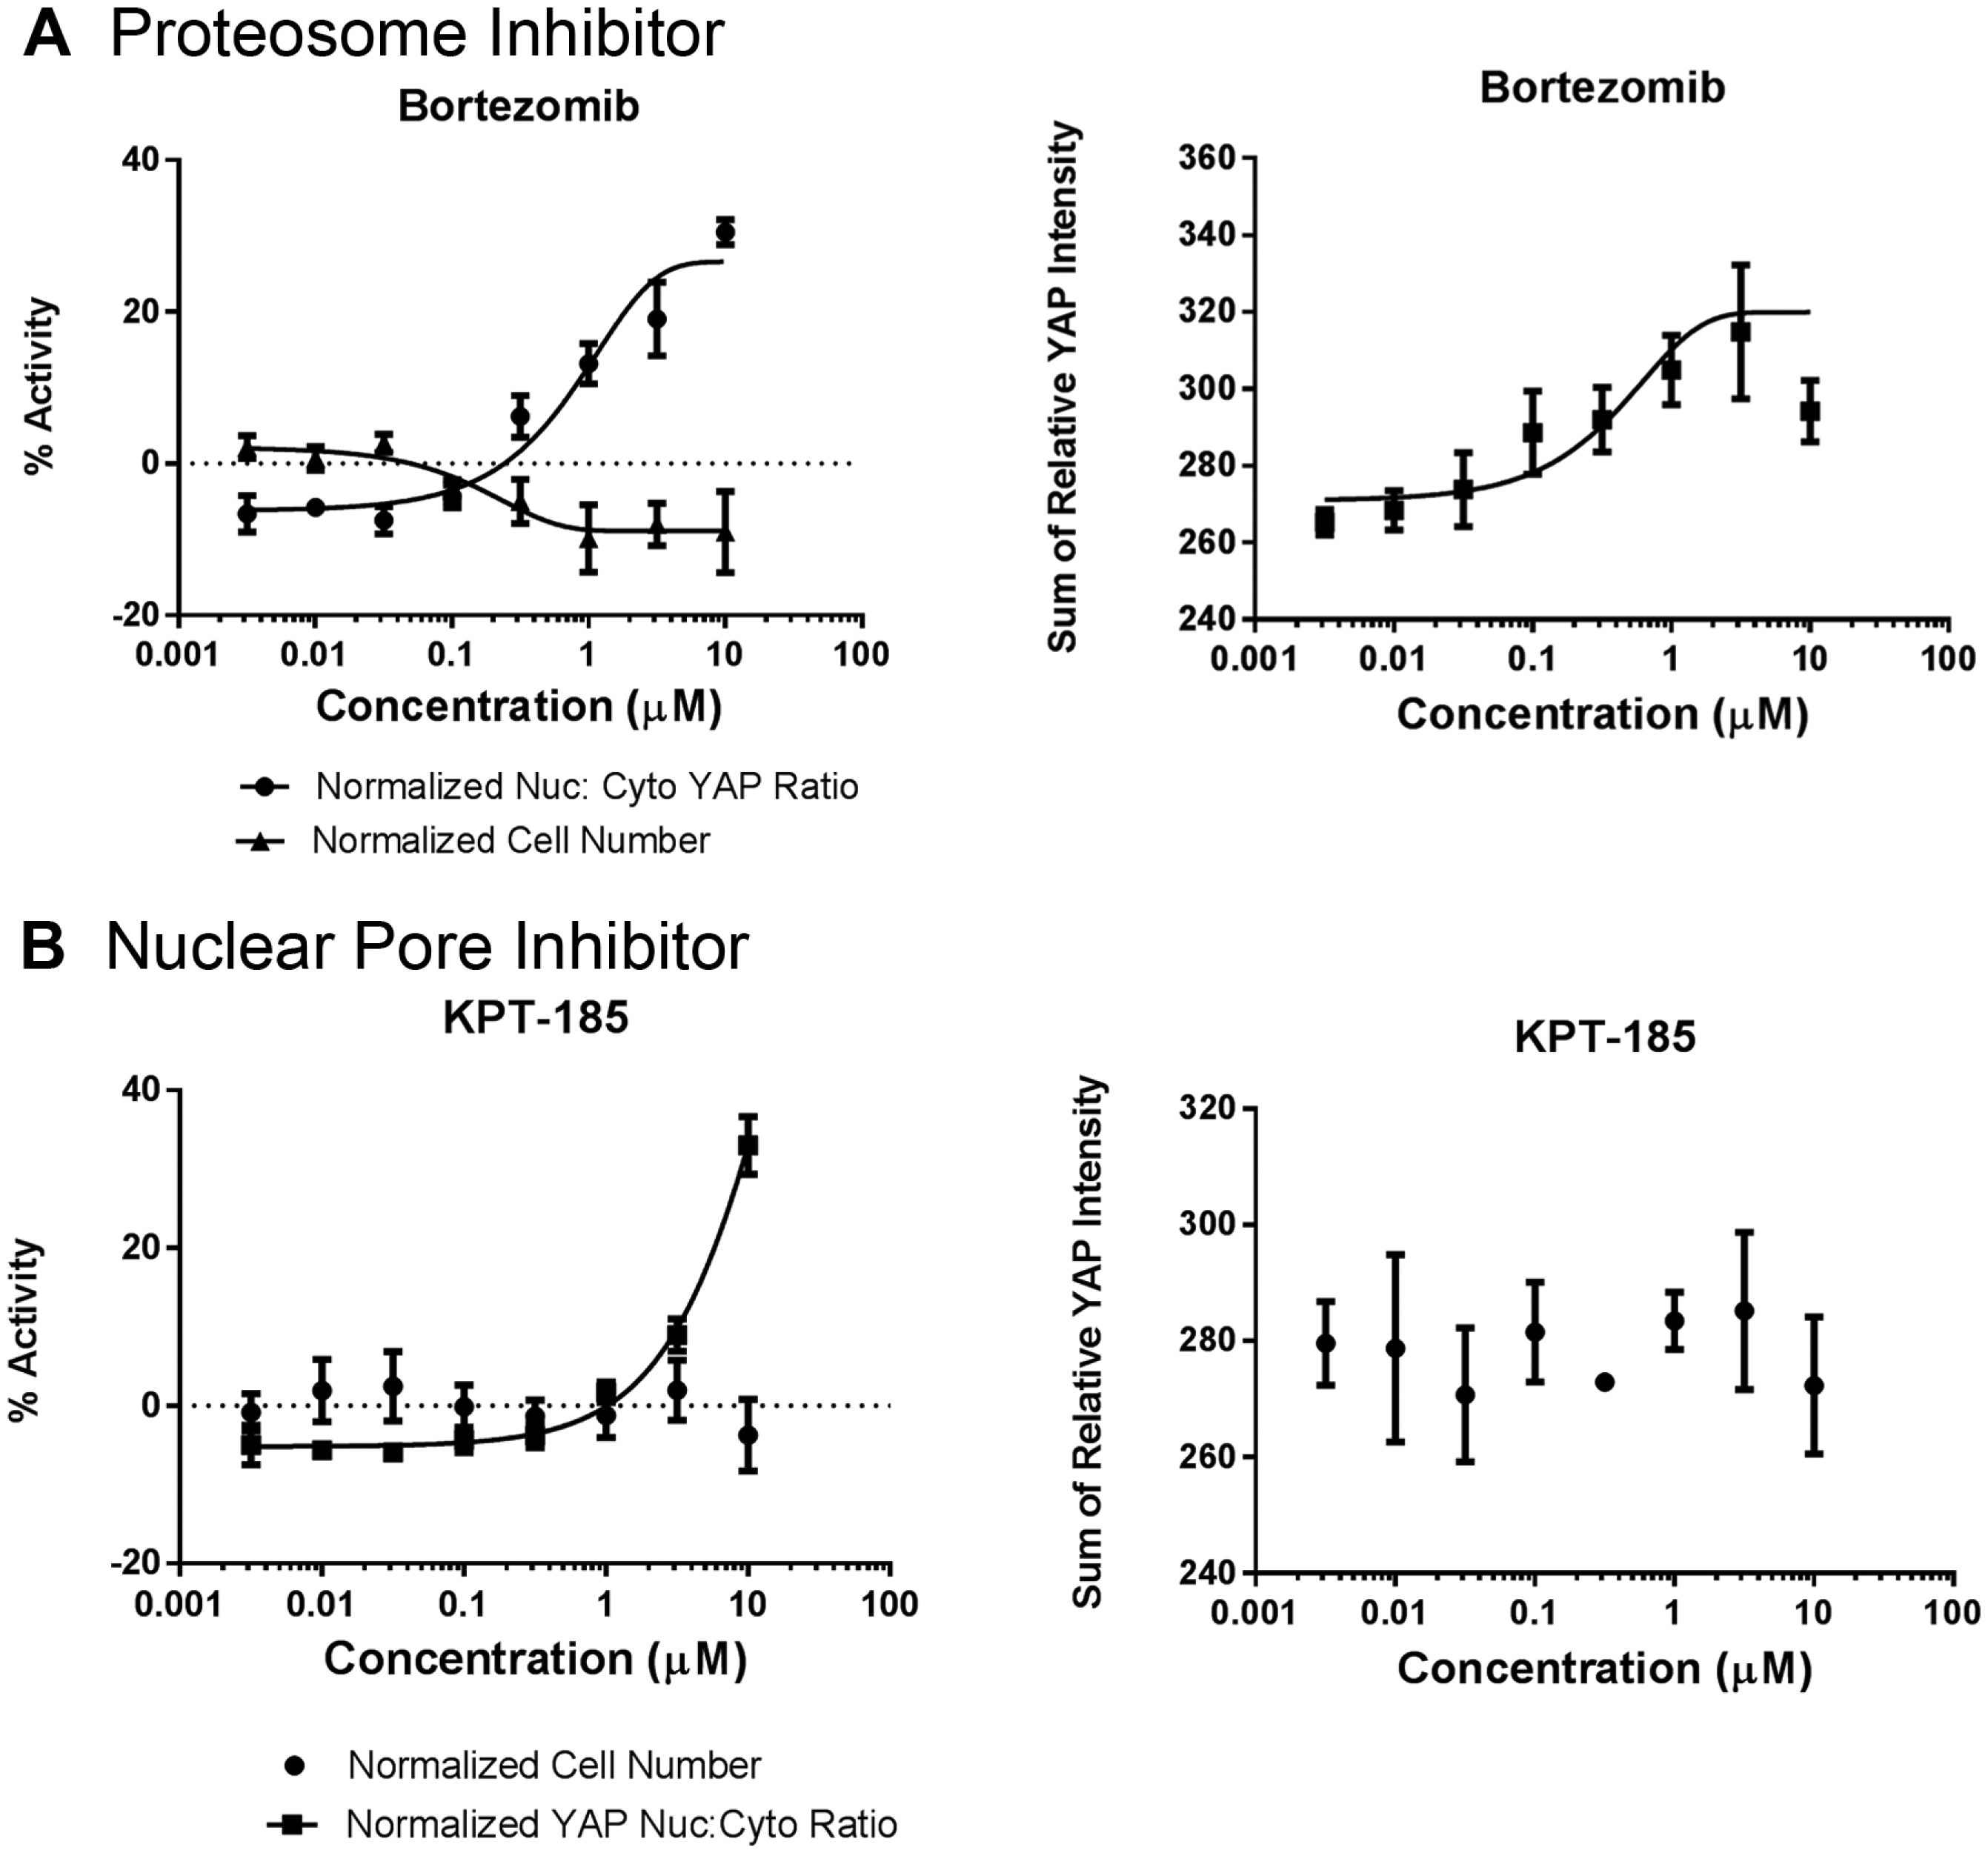
Effect of testing compounds targeting the proteasome and the nuclear pore complex after 4 h incubation. (
The graphs in Figure 4 show the results of testing different compounds targeting the proteasome and nuclear pore. In each case, the compounds showed significantly more toxicity than that observed with just the siRNA targeting these complexes. However, as shown in Figure 4 , by shortening the incubation time, the effect on YAP nuclear accumulation can be seen before significant loss of cells (and cell–cell contact) is seen. This may be due to either faster inactivation of the target (compared to siRNA, leading to a more gradual reduction in protein levels) or the ability of the compound to inhibit the complete protein complex compared to just subunits of either complex, as brought about by siRNAs.
Discussion
This article describes the first screen for factors modulating YAP-directed gene expression in a biliary-derived cell line at high cell density.
Assay development revealed the complexity of such a screen where changes in cell number can lead to false positives. In these experiments, it appeared that siRNAs targeting LATS2 showed activation of YAP, while other reports describe LATS1 being the relevant kinase for inactivation of YAP.28,29 These experiments also highlighted the difficulty of determining the magnitude of the dynamic range of the assay, as even factors known to regulate YAP signaling (i.e., LATS1 and LATS2) were found to only generate a relatively small signal.
During assay development, the issue for redundant genes possibly causing false negatives in siRNA screens was also encountered. Assay development experiments failed to show any activation of YAP by knockdown of MST1 or MST2. This highlights the difficulty of screening for the ablation of single genes when redundancy could mask the effect of reducing the expression of a single gene. It is also possible that in this cell line, and under these experimental conditions, LATS is being activated by other kinases, such as JNK or AMPK, which have also been reported to control LATS activation.30,31
Differences in the time course of activity brought about by siRNAs compared to compounds were observed during assay development (e.g., Leptomycin B showed increased nuclear YAP after only 24 h, compared to 48 h for siRNAs targeting the nuclear pore components). Such differences have been noted by others; for example, small-molecule inhibition of EZH2 was observed with 6 h of compound treatment, compared to 4 days of siRNA treatment. 32 These differences were further confounded because of the different effects these treatments had on cell survival.
The concept of “promiscuous inhibitors” was first described for compounds identified by virtual or high-throughput screening campaigns. 33 These compounds were subsequently shown to be acting by nonspecific aggregation and denaturing of the target enzyme. Further studies then revealed that cell-based screens were also susceptible to the identification of frequent hitter compounds. 34 However, it was proposed that these compounds were active because they were targeting conserved cellular functions leading to alterations in cellular cytoskeleton, chromatin structure, or other conserved cell pathways. This article describes a similar phenomenon where 3 out of the 13 confirmed genes identified by siRNA screening are targeting conserved cellular functions. These hits were further confirmed in assays using orthogonal readouts and so are not artifacts, but are true positives working by the pleotropic effects of these conserved pathways. By reporting these results, it is hoped to help other screening groups identify and deprioritize such hits from their screening results.
In summary, this article has focused on the observation that a number of conserved cellular functions can apparently act to cause activation of YAP-directed transcription. Other components of conserved pathways, for example, ubiquitin, were also identified as hits in the original screen. However, because of the toxicity caused by the knockdown of these genes, it was especially difficult to separate the effect of toxicity, and reduced contacts between cells, from genuine activation of the pathway. The effect of knockdown of essential cellular functions having apparently assay-specific effects has been noted previously 35 and is reminiscent of the effect of compounds targeting conserved cellular functions frequently identified as actives in cell-based assays. 34
The targets identified in this screen were validated using different approaches: First, siRNAs with different sequences and chemical backbones were used. The second method was by showing that these siRNAs were active in an orthogonal measure of YAP activation, that is, activation of CYR61 gene expression. The third method used to validate these hits was by correlating the efficiency of knockdown with activation of CYR61 gene expression. Finally, these gene targets were further confirmed by using compounds as orthogonal inhibitors of these targets. However, this highlights the problem of how to validate other targets identified from siRNA screens. While the use of additional controls (such as the C911 controls 36 ) would further add to confidence in these potential targets, the lack of potent and selective chemical inhibitors still poses a challenge for the validation of genes identified from siRNA screens. Assuming such genes are not essential, it may be possible to use CRISPR/Cas9 to engineer knockout of the target gene as an orthogonal means of target gene validation. 37 But as noted for the difference between compounds and siRNAs, it can be anticipated that total knockout of a gene will result in a different time course of action, 24 or possibly even different phenotypic effects.
Footnotes
Acknowledgements
We would like to acknowledge our colleagues at GNF and within NIBR for their stimulating discussion, comments, and help during the course of this project.
Declaration of Conflicting Interests
The authors declared no potential conflicts of interest with respect to the research, authorship, and/or publication of this article.
Funding
The authors received no financial support for the research, authorship, and/or publication of this article.
References
Supplementary Material
Please find the following supplemental material available below.
For Open Access articles published under a Creative Commons License, all supplemental material carries the same license as the article it is associated with.
For non-Open Access articles published, all supplemental material carries a non-exclusive license, and permission requests for re-use of supplemental material or any part of supplemental material shall be sent directly to the copyright owner as specified in the copyright notice associated with the article.