
Abstract
Antibody-triggered endocytosis (ATE) is a biological mechanism on which many therapeutic strategies are grounded, such as delivery of antibody–drug conjugates (ADCs). Current methods monitoring ATE include confocal Z-stack analysis, acid wash, antibody quenching, and pH-sensitive dye labeling. However, those generate less quantifiable results with low throughput. Here we report a new method referred to as “paired imaging measurement” to analyze ATE using a quantitative algorithm in conjunction with high-content imaging. With two sequential measurements of cell surface antibody employing live cell staining and total antibody by immunostaining before and after cell permeabilization, intracellular antibody undergoing endocytosis can be quantified indirectly. Antibodies against CD98 and transferrin receptor were tested on hCMEC/D3 and hiPSC-derived endothelial cells. The maximal response and potency of endocytosed antibodies were generated with good assay robustness (Z′ > 0.6) and >5-fold signal/background ratio. Antibody endocytosis response ranking is consistent between batches (R2 > 0.9). The obtained results were confirmed by other traditional methods. In conclusion, we have developed a novel method using a quantitative imaging algorithm in conjunction with live cell staining for high-throughput investigation of ATE.
Keywords
Introduction
Antibody is an important modality of therapeutics in the pharmaceutical industry, in addition to small chemical compounds. Some therapeutic antibodies, such as trastuzumab (Herceptin), can bind to cell surface HER2 and exert therapeutic efficacy via receptor-mediated internalization and/or desensitization,1,2 while other antibodies conjugated with small therapeutic compounds (antibody–drug conjugates [ADCs]) can bind to cell surface receptors and undergo endocytosis or internalization, by which the compound as a cargo can reach the intracellular target. For example, gemtuzumab ozogamicin is a CD33 antibody conjugated with a DNA-damaging calicheamicin derivative that has been approved for the treatment of CD33-positive acute myeloid leukemia. 3 Thus, antibody-triggered endocytosis (ATE) or internalization is a critical event that influences the efficacy of therapy and the delivery of sufficient amount of drug, and therefore multiple methods have been developed to monitor and evaluate antibody candidates for their endocytosis capability.2,4–6 Current methods for ATE measurements mainly include Z-stack analysis with confocal microscopy, acid wash or antibody quench to eliminate surface antibody signal, and pH-sensitive dye labels2,4–6 with different pros and cons ( Suppl. Table S1 ). The critical question for all the above-mentioned methods is how to clearly differentiate intracellular endocytosed antibody from cell surface–bound antibody to avoid false-positive signals. To achieve this, Z-stack analysis is usually used to monitor antibody distribution at intracellular focused layers; however, for highly flattened cells, such as hCMEC/D3, signal interference between the cell surface and intracellular layers occurs. Acid buffer with pH 2–3 may be used transiently to wash off surface-bound antibody, but there are two problems: (1) different antibodies may have different sensitivities to acid wash, and therefore the data from different antibodies are not strictly comparable, and (2) sometimes cells are vulnerable to acid wash, leading to increased cell detachment and cell death according to our experience, and this causes false-positive signals based on cell debris. Alternatively, Trypan Blue can be used to quench the signals of a surface antibody labeled with fluorescent probes, or an antibody labeled with pH-sensitive dyes that specifically emit fluorescence signals after being transferred to acidic endosome. However, for those labeling methods, first, different antibodies will inevitably show different labeling efficiencies, which will still make data incomparable for ranking; second, large-scale ATE screening is almost impossible with the labeling methods due to the heavy workload of labeling every antibody; and third, some antibodies may display a decreased binding capacity caused by dye labeling,7,8 and thus false-negative results may be generated. Furthermore, those methods are also tedious with low throughput and limited quantification capability.
High-content imaging, in conjunction with quantitative imaging algorithm-based analysis, is a robust technology developed in recent years. Such high-content imaging is often used for phenotypic screening, especially in some diseases, such as central nervous system (CNS) drug discovery, because some functional phenotypes are highly structure dependent, such as synapse formation and neurite outgrowth,9–12 for which application of imaging algorithms is important. Compared with other detection methods, such as Western blotting and enzyme-linked immunosorbent assay (ELISA), one advantage is the robust capability in quantification with flexible algorithm setting, which allows the maximal chance to detect phenotypes of interest. Usually the imaging assay requires a smaller number of cell samples in multiwell plates and can provide multiparallel and in situ information with greatly increased sensitivity and specificity in a highly efficient manner. Therefore, such analysis employing quantitative imaging algorithms is also referred to as “in-cell Western” and is widely used in drug discovery nowadays.9,11,13 The paired imaging measurement we have developed can be quantitative with high throughput and minimize false positives.
Materials and Methods
Cell Culture and Antibodies
hCMEC/D3 cells were purchased from Millipore (Long Island City, NY, cat. no. SCC066) and plated at 3 × 10⁵ cells/mL and cultured in EndoGRO MV Basal Medium (Millipore, cat. no. SCME-BM) with fetal bovine serum (FBS),
The human iPSC (GM25256) line was obtained from Coriell Research Institute (Camden, NJ) and was differentiated into endothelial cells by using a modified protocol, as described.15,16 Briefly, after a 6-day culture of the human iPSC line in unconditioned medium with DMEM/Ham’s F-12 (ThermoFisher, cat. no. 11330057) containing 20% Knockout Serum Replacement (Thermo Fisher, cat. no. 10828-028), 1% MEM Non-Essential Amino Acid (ThermoFisher, cat. no. 11140050), 1%
Antibodies used in the study include, for CD98hc, SC-59145 and SC-376815 from Santa Cruz (Santa Cruz, CA); Ab2528, Ab23495, and Ab193364 from Abcam (Cambridge, UK); MAB1721 from Abnova (Taipei, Taiwan); LS-C188834 and LS-C179515 from Lifespan Bio (Seattle, WA); OASA02585 from Aviva Systems Bio (San Diego, CA); Novoprotein 105212 (Summit, NJ); and MAB5920 from R&D Systems (Minneapolis, MN); for transferrin receptor (TfR), Abcam Ab1086; for CD31, Abcam Ab28364; and for IGF-1 receptor β (IGF1R), CST 3027S from Cell Signaling Technology (Danvers, MA). Isotype antibodies were mouse IgG1 (ThermoFisher, MA5-14453) and mouse IgG2a (ThermoFisher, MA5-14447); fluorescent-tagged secondary antibodies were anti-mouse IgG-FITC (ThermoFisher, cat. no. F2761) and anti-rabbit IgG-FITC (ThermoFisher, cat. no. F2765).
Paired Imaging Measurement for Antibody-Triggered Endocytosis
As shown in Figure 1 , cells were first placed at 4 °C for 15 min, and then culture medium was gently changed with 4 °C fresh medium containing antibody at 10 nM or 10 µg/mL as a starting concentration for serial threefold dilutions unless stated otherwise. Cells were placed at 4 °C to allow prearrest of the antibody onto cell surface for 1 h and then transferred to a 37 °C incubator with an open lid. Endocytosis usually occurs at 37 °C from 5 min up to 120 min. Fifteen minutes after placing the cells at 37 °C was selected as the optimal time point to stop the endocytosis. The selection of the 15 min time point was based on preexperiments showing that 15 min was the peak time, with gradual reduction afterwards for 2 h for the positive control antibody SC-59145 (data not shown). Ideally, a time point before the first round of endocytosed CD98 to recycle back to the cell membrane should be selected, because the recycled CD98 will be artificially counted as surface proportion without endocytosis occurrence according to our method principle, and CD98’s recycling time is 20–30 min, as reported. 17 At the end of time, cells were placed on ice to stop the endocytosis and then briefly washed with 200 µL ice-cold DPBS twice. After a brief rinse with DPBS, the second fluorescent antibody (1:500 dilution) in fresh cell medium was added to cells for live cell staining of surface-bound antibody at 4 °C for 30 min, avoiding light from this step until the first measurement of surface-bound antibody signal was done. At the end of live cell staining, the cells were briefly washed three times with 200 µL of ice-cold DPBS and fixed with 4% paraformaldehyde (Sigma, cat. no. HT501128) for 15 min at room temperature. Hoechst 33342 (10 ng/mL, ThermoFisher, cat. no. H3570) was then used to stain the cell nucleus for 20 min.
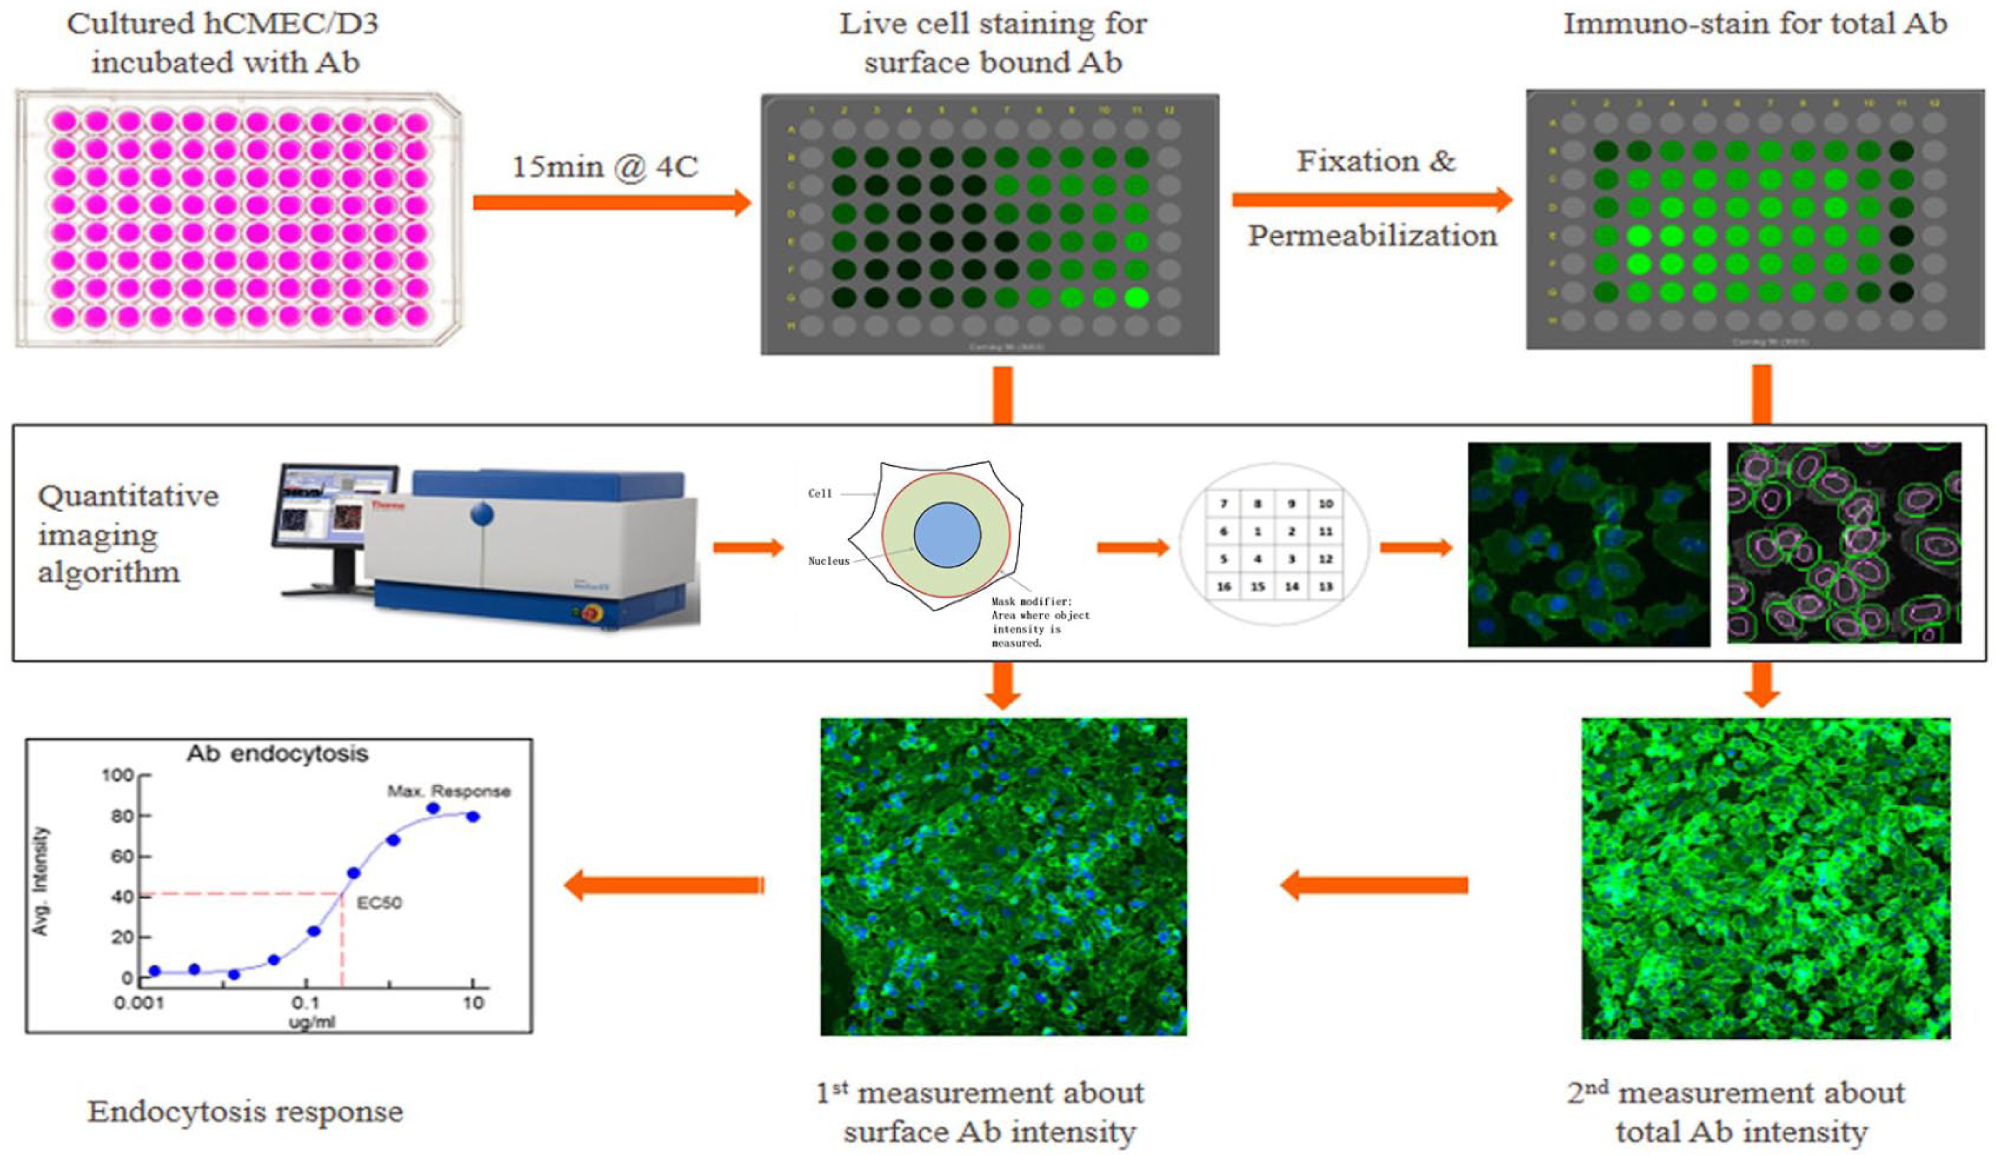
Workflow for paired imaging measurement in measuring ATE. The sequential steps of ATE in cells include live cell surface staining, quantitative analysis with an imaging algorithm and target activation protocol, a second intracellular staining after cell permeabilization, measurement of the antibody average intensity, data analysis, and finally, curve fitting for endocytosis kinetics. Ab = antibody.
The cell plate was washed with DPBS, and then cell imaging measurement was conducted by employing a Cellomics ArrayScan instrument to determine the intensity of cell surface–bound antibody by using a so-called target activation protocol. When cell confluency was above 80%, six fields were selected maximally in each well from a 96-well plate at 10-fold magnification, and six fields were selected in the same position for paired imaging measurements since this reduces data variation. The average intensity of surface-bound antibody was calculated based on the mask region (green circle in Fig. 1 ) around the cell nucleus with an extending diameter of 6 (which is an arbitrary number defined in Cellomics based on pixel numbers) to cover most of the cytoplasm. The cell number was calculated by counting the cell nucleus as an internal control. This allowed the number of viable cells in different groups to be comparable. After the first measurement, cells were permeabilized with blocking buffer containing DPBS, 3% horse serum (Thermo Fisher, cat. no. 26050070), and 0.4% Triton X-100 (Sigma, cat. no. 93443) at room temperature for 30 min. The second fluorescent antibody solution (1:500 dilution) in blocking buffer was then added to the cells to stain the intracellular endocytosed antibody at 4 °C for 30 min. Similarly, after three brief washes with DPBS, the plate was processed for cell imaging by employing the same protocol used in the first measurement. The second measurement signal included both the extracellularly surface-bound antibodies detected in the first measurement and the intracellularly endocytosed antibodies because cell membrane had been permeabilized. The two measurements should ideally be carried out during the same day to exclude day-to-day instrumental variation. The intensity difference between the first and second measurements of the same well can be considered as the signal derived from the intracellularly endocytosed antibody.
Confocal Microscopy Analysis of Antibody Endocytosis
Cells were applied with endocytosis assay procedures similar to those described above, except that an acid wash was done for 3 min at room temperature to wash off surface-bound antibodies before fixation. The acid wash buffer contained 0.1 M glycine, 20 mM magnesium acetate, and 50 mM potassium chloride at pH 2.2. Cells cultured on coverslips were fixed, permeabilized, and underwent a staining process similar to that described above, with the addition of 2.5 µM Dil (Molecular Probes, Eugene, OR, cat. no. C7000) to show the cell membrane boundary as the last step. Coverslips were then placed on glass slides (Fisher Scientific, Pittsburgh, PA, cat. no. 12-550-15) with mounting medium (Agilent, Santa Clara, CA, cat. no. S3025) and dried overnight. Observation at 20- or 40-fold magnification (oil lens) was done with a Zeiss Laser scanning confocal microscope LSM710 NLO. The Z-stack setting covered the whole vertical axis of cells. Zeiss ZEN 2010 software was used to collect images and reconstitute the ortholog picture.
Endocytosis Triggered by Antibodies Labeled with pH-Sensitive Dye
Several antibodies (40–100 µg/antibody) were labeled with a pH-sensitive dye pHrodo Red using a kit from Molecular Probes (cat. no. MP35363). The degrees of labeling (DOLs) for all labeled antibodies were between 1.4 and 2.6. The same endocytosis procedure was used for labeled antibodies, except that Hoechst 33342 was added together with the antibody solution for live cell staining. After endocytosis for 30 min at 37 °C and a brief wash with fresh culture medium, 100 nM LysoTracker Deep Red (Thermo Fisher, cat. no. L12492) was added to stain acidic organelles such as endosomes to confirm the signal specificity of pH-sensitive dye-labeled antibodies. The plates were then analyzed with the Cellomics ArrayScan through three channels of 361, 555, and 647 nm, respectively, for cell nuclei, pH-sensitive labeled antibodies, and intracellular endosomes. The antibody average intensity at 555 nm directly reflects the antibody endocytosis response when it has a good overlay with the signal of endosomes at 647 nm.
Data Analysis
Images collected from cell imaging experiments using the Cellomics ArrayScan were analyzed with vHCS Scan version 6.1.0, and the VTi model was used. Full concentration curves and antibody potency data were generated with XLfit version 5.5.0, and general pharmacology model 251 was selected to fit curves. Other data, figures, and statistics were analyzed with Excel 2013. Error bars were presented by standard deviation. Statistical difference was defined by p < 0.05 of the Student t-test. Assay robustness analysis was performed using parameters such as Z′, the signal/background ratio within batches, and the regression value (R 2 ) between batches.
Results
Linear Range of Antibody Average Intensity Collected from Automated Cell Imaging Measurements
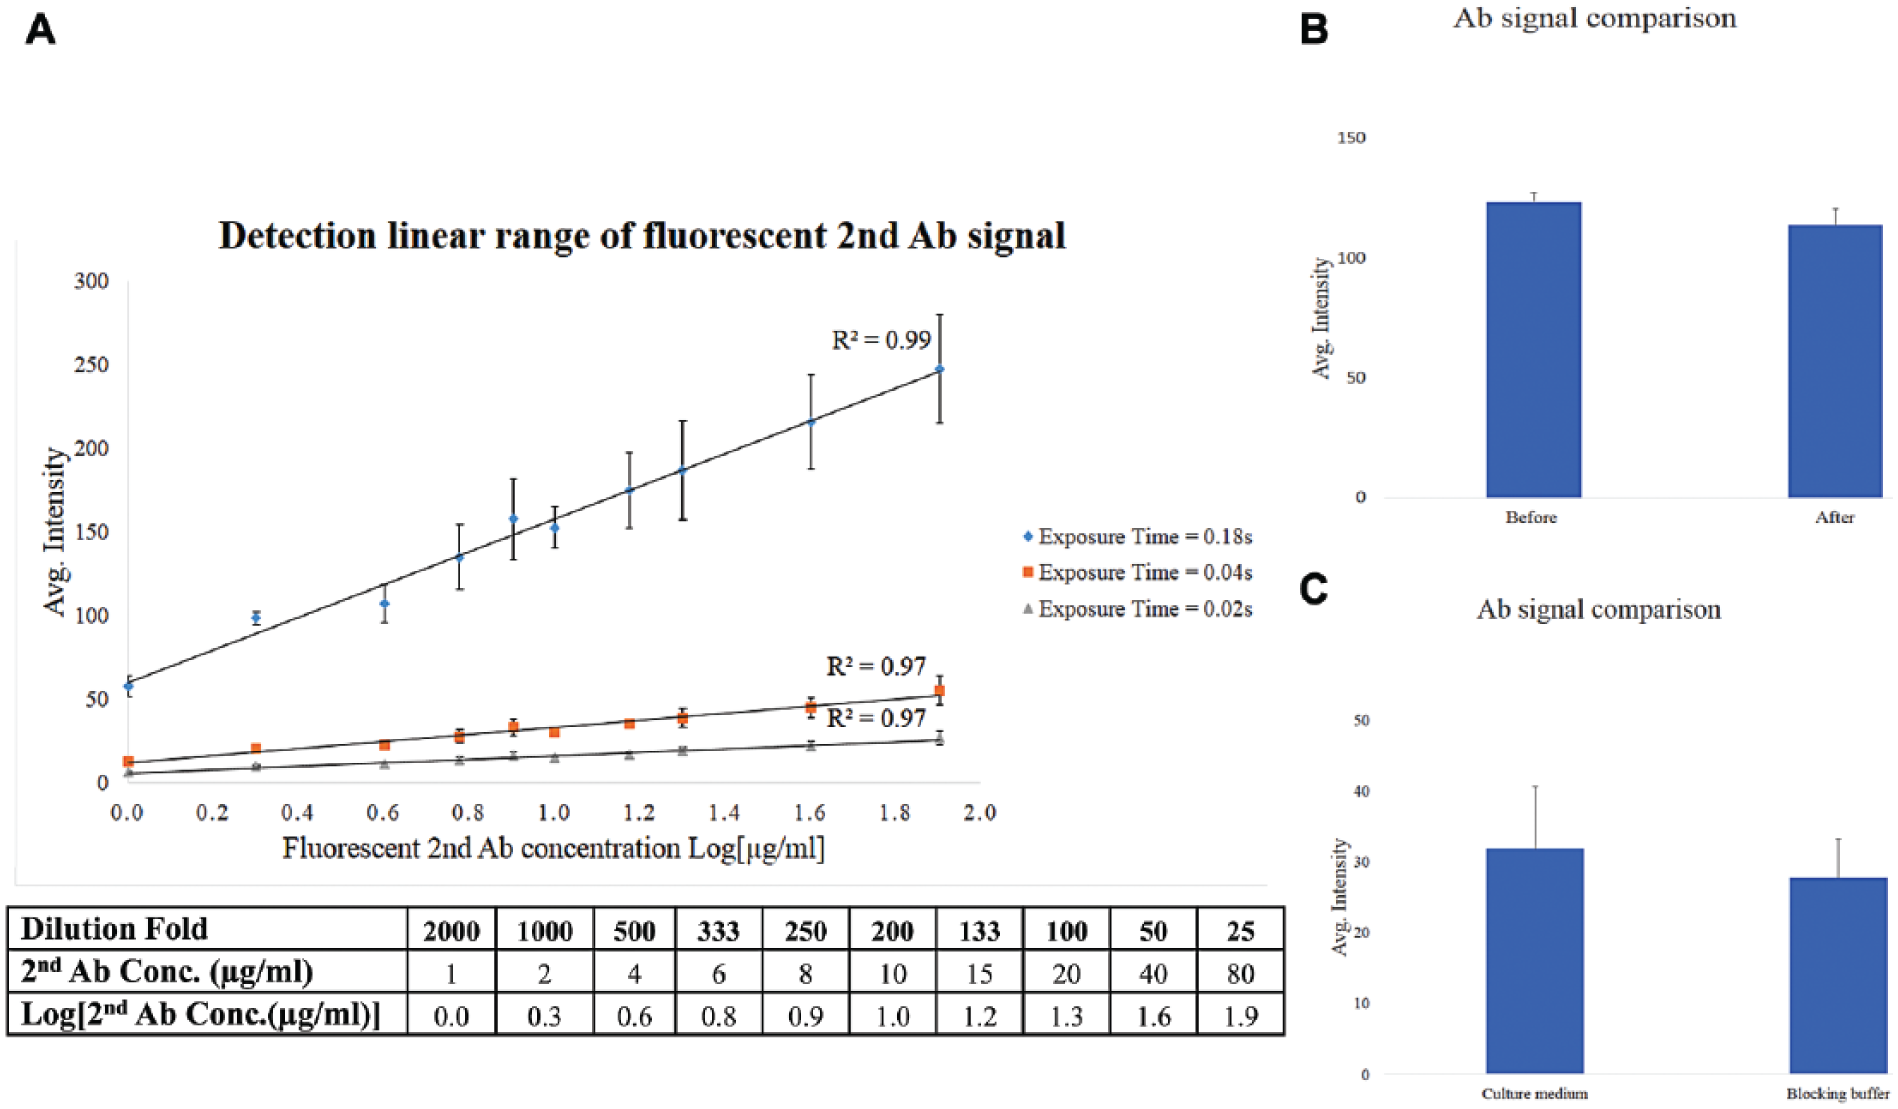
Since the key rationale for paired imaging measurement is to quantify endocytosed antibodies based on the subtraction of two independent measurements, our primary validation was to have the antibody average intensity obtained from the Cellomics system located within a linear range, allowing for subtraction. With a positive control antibody (SC-59145) against CD98 for endocytosis in hCMEC/D3, a wide range of dilutions were used for the second antibody for testing, as shown in Figure 2A . First, the well with the highest concentration of SC-59145 was measured with an autoexposure model and a proper range of exposure time was obtained. Then, three different exposure times were tested, as shown in Figure 2A , to identify that the linear range of average intensity was from 0 to 300, and the linearity was with R2 > 0.97 at different exposure times.
Method validation. (
Application of Live Cell Staining for Paired Imaging Measurements of Endocytosed Antibodies
The main reason to employ live cell staining for the measurement of antibody endocytosis is that live cell staining only detects surface antibodies outside intact cell membranes, 18 therefore precisely evaluating the surface antibody proportion. To quantify antibody endocytosis, it is necessary to further confirm that there is no potential interference from live cell staining on the final readout for the endocytosis; that is, the surface antibody signal obtained from the first measurement will not be significantly changed due to the fixation, permeabilization, and blocking buffer rinse required for the second measurement. One positive control antibody (SC-59145) was used to test this. An experiment was designed to perform the second measurement in the absence of the second antibody. It was found that there was no significant difference in signal for the surface-bound antibody, as shown in Figure 2B before and after the second measurement. In addition, two different staining buffers were used in paired measurements. In the first live cell staining, cell culture medium containing 3%–5% FBS was used, while in the second staining, a blocking buffer containing DPBS, Triton X-100, and 3% horse serum was used. Results confirmed that there was no significant difference of staining intensity in these two conditions for the positive control antibody Ab23495, as shown in Figure 2C . Taken together, our studies excluded major potential interference and confirmed that live cell staining can be adapted to paired imaging measurements for quantification of antibody endocytosis.
Robustness and Consistency of Paired Imaging Measurements
Two positive and two negative antibodies were first selected based on Z-stack confocal microscopy analysis on hiPSC-derived endothelial cells ( Fig. 3A ) for paired imaging measurements. The hiPSC-derived endothelial cells were validated with the expression of endothelial markers, including the von Willebrand factor (VWF), Ulex Europaeus Agglutinin I, and tight junction markers (ZO-1, claudin-5, and occludin) (data not shown). As shown in Figure 3B , both positive controls AB23495 and Ab2528 showed a significant signal increase in the second measurement after cell permeabilization, while the negative controls SC-376815 and IgG had little effect. The quantitative result from paired imaging measurements was consistent with Z-stack confocal microscopy analysis. Signal/background ratios of >5-fold and Z′ values of >0.60 were obtained if evaluated with the positive control antibodies Ab2528, SC-59145, and Ab23495, respectively.
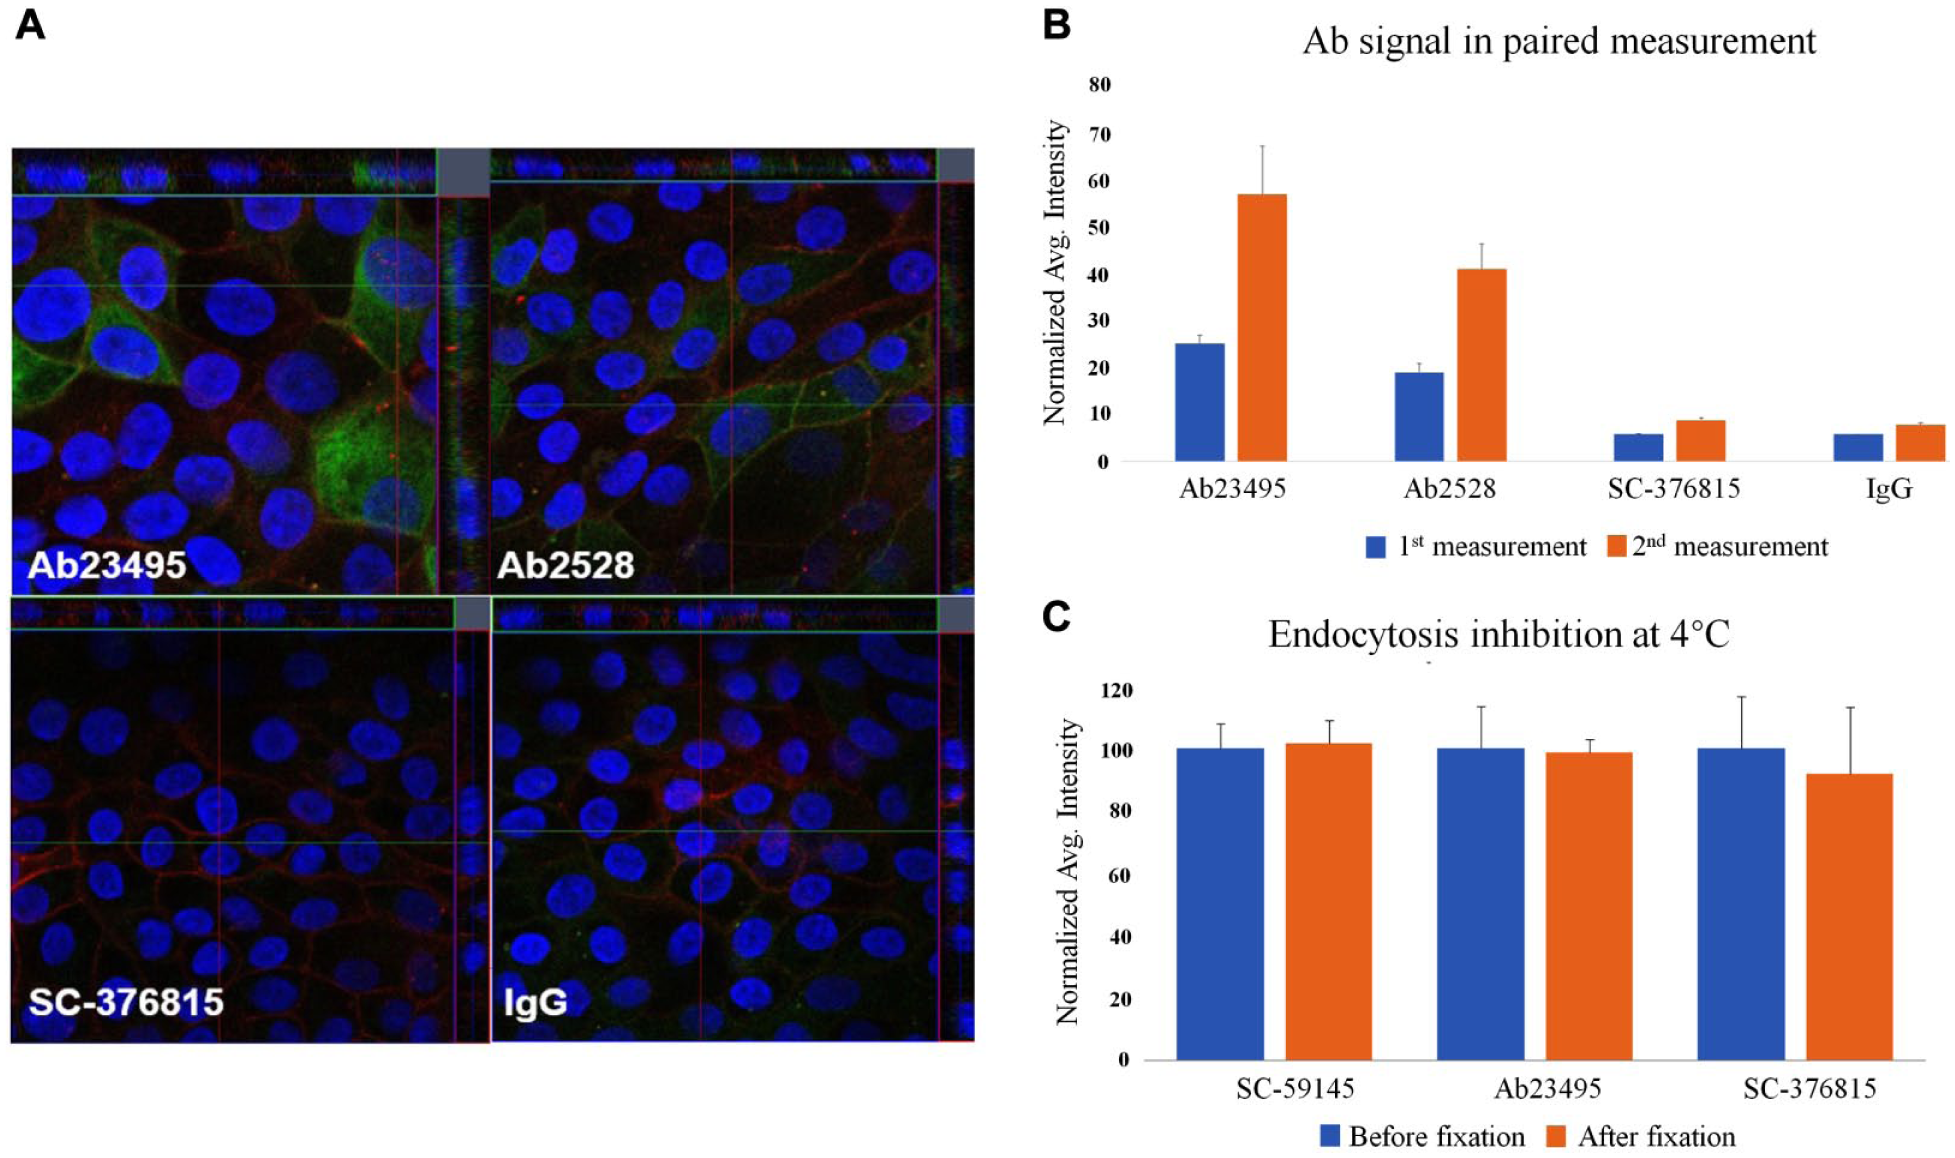
The first-step confirmation about paired imaging measurement with four control antibodies with or without endocytosis. (
Antibody Endocytosis Results Obtained from Paired Imaging Measurements
Eleven antibodies for CD98 and one IgG control (shown in Suppl. Table S2 ) were selected to perform paired imaging measurements to test whether consistent ranking for their endocytosis capabilities can be obtained. A greater signal difference between two measurements was observed for the positive control SC-59145 than for MAB5920, while there was no difference between the two measurements for the negative control antibody, SC-376815 ( Fig. 4A ). Subtraction of two paired measurements results in the concentration curves for antibody endocytosis, as shown in Figure 4B , including maximal responses and potencies, reflecting an antibody’s specific properties. To make data between different batches of experiments comparable, antibodies’ maximal responses were normalized by setting the positive antibody response of SC-59145 as 100 in each batch. The reason that the maximal response of antibody endocytosis was selected for primary ranking is based on the following considerations: (1) the maximal endocytosis response governs the absolute amount of antibody internalized into cytoplasm, and this is critical for therapeutic purposes, such as the delivery of ADC;19,20 (2) usually, antibodies’ potencies are all sufficiently high with no significant differentiation, as shown in Supplementary Table S2 , and the potencies of endocytosed antibodies range from 0.1 to 5.1 µg/mL, which are all at the nanomolar level;21,22 and (3) an antibody’s potency is usually reflected by the relative EC50, which is relevant to its maximal response, but since different antibodies have different maximal responses, it may be misleading for the overall judgment about the antibody’s capability in triggering endocytosis. Taking the curves in Figure 4C as an example, Novopro 105212 and SC-59145 showed similar EC50 values of ~1 µg/mL, while their actual capabilities in triggering endocytosis were hugely different. LS-C188834 was more potent than SC-59145 in triggering endocytosis, but it had a smaller response than SC-59145. Therefore, we suggest that the maximal response be the primary consideration for antibody endocytosis ranking; however, a comprehensive view of the EC50 and the curve slope is also recommended. Based on the above considerations, the ranking order for the 12 tested antibodies according to three independent batches of experiments is shown in Supplementary Table S2 . To further check the repeatability of the antibody ranking obtained from different batches, the correlation between any two batches was analyzed, as shown in Figure 4D . R2 ≥ 0.9, indicating that consistent ranking results can be obtained by this method.
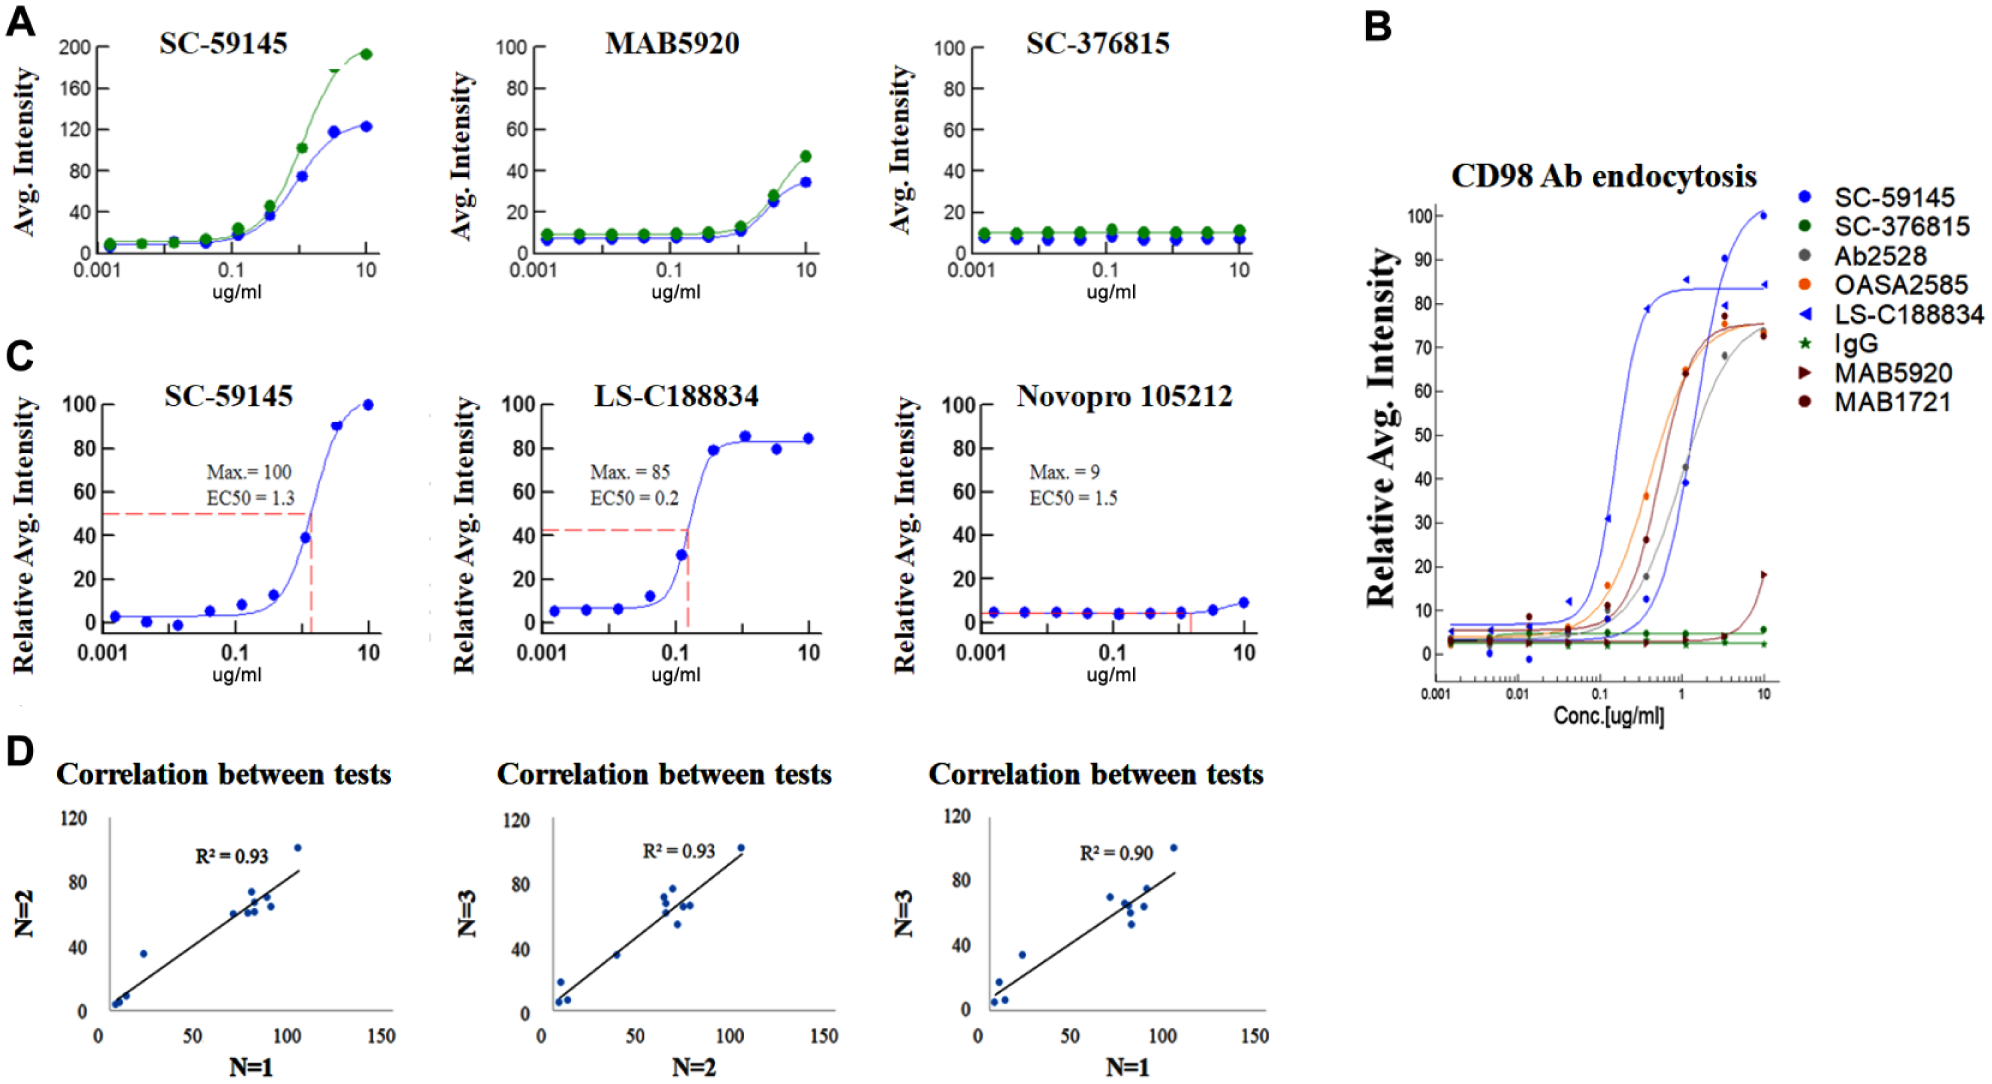
Antibody endocytosis curve fitting by paired imaging measurement. (
Results Obtained from Paired Imaging Measurements, Z-Stack Confocal Microscopy Analysis, and pH-Sensitive Dye Labeling Methods Are Consistent
In addition to Z-stack analysis on ATE using hiPSC-derived endothelial cells as described above, a similar study was performed with the 12 tested antibodies by using the immortalized endothelial cell line hCMEC/D3. Figure 5 shows the vertically middle focused layer across the cell nucleus in the Z-stack, to maximally present the intracellular signal without surface interference. Qualitative and consistent results were seen between Z-stack analysis and paired imaging measurements ( Suppl. Table S2 ) for all tested antibodies.
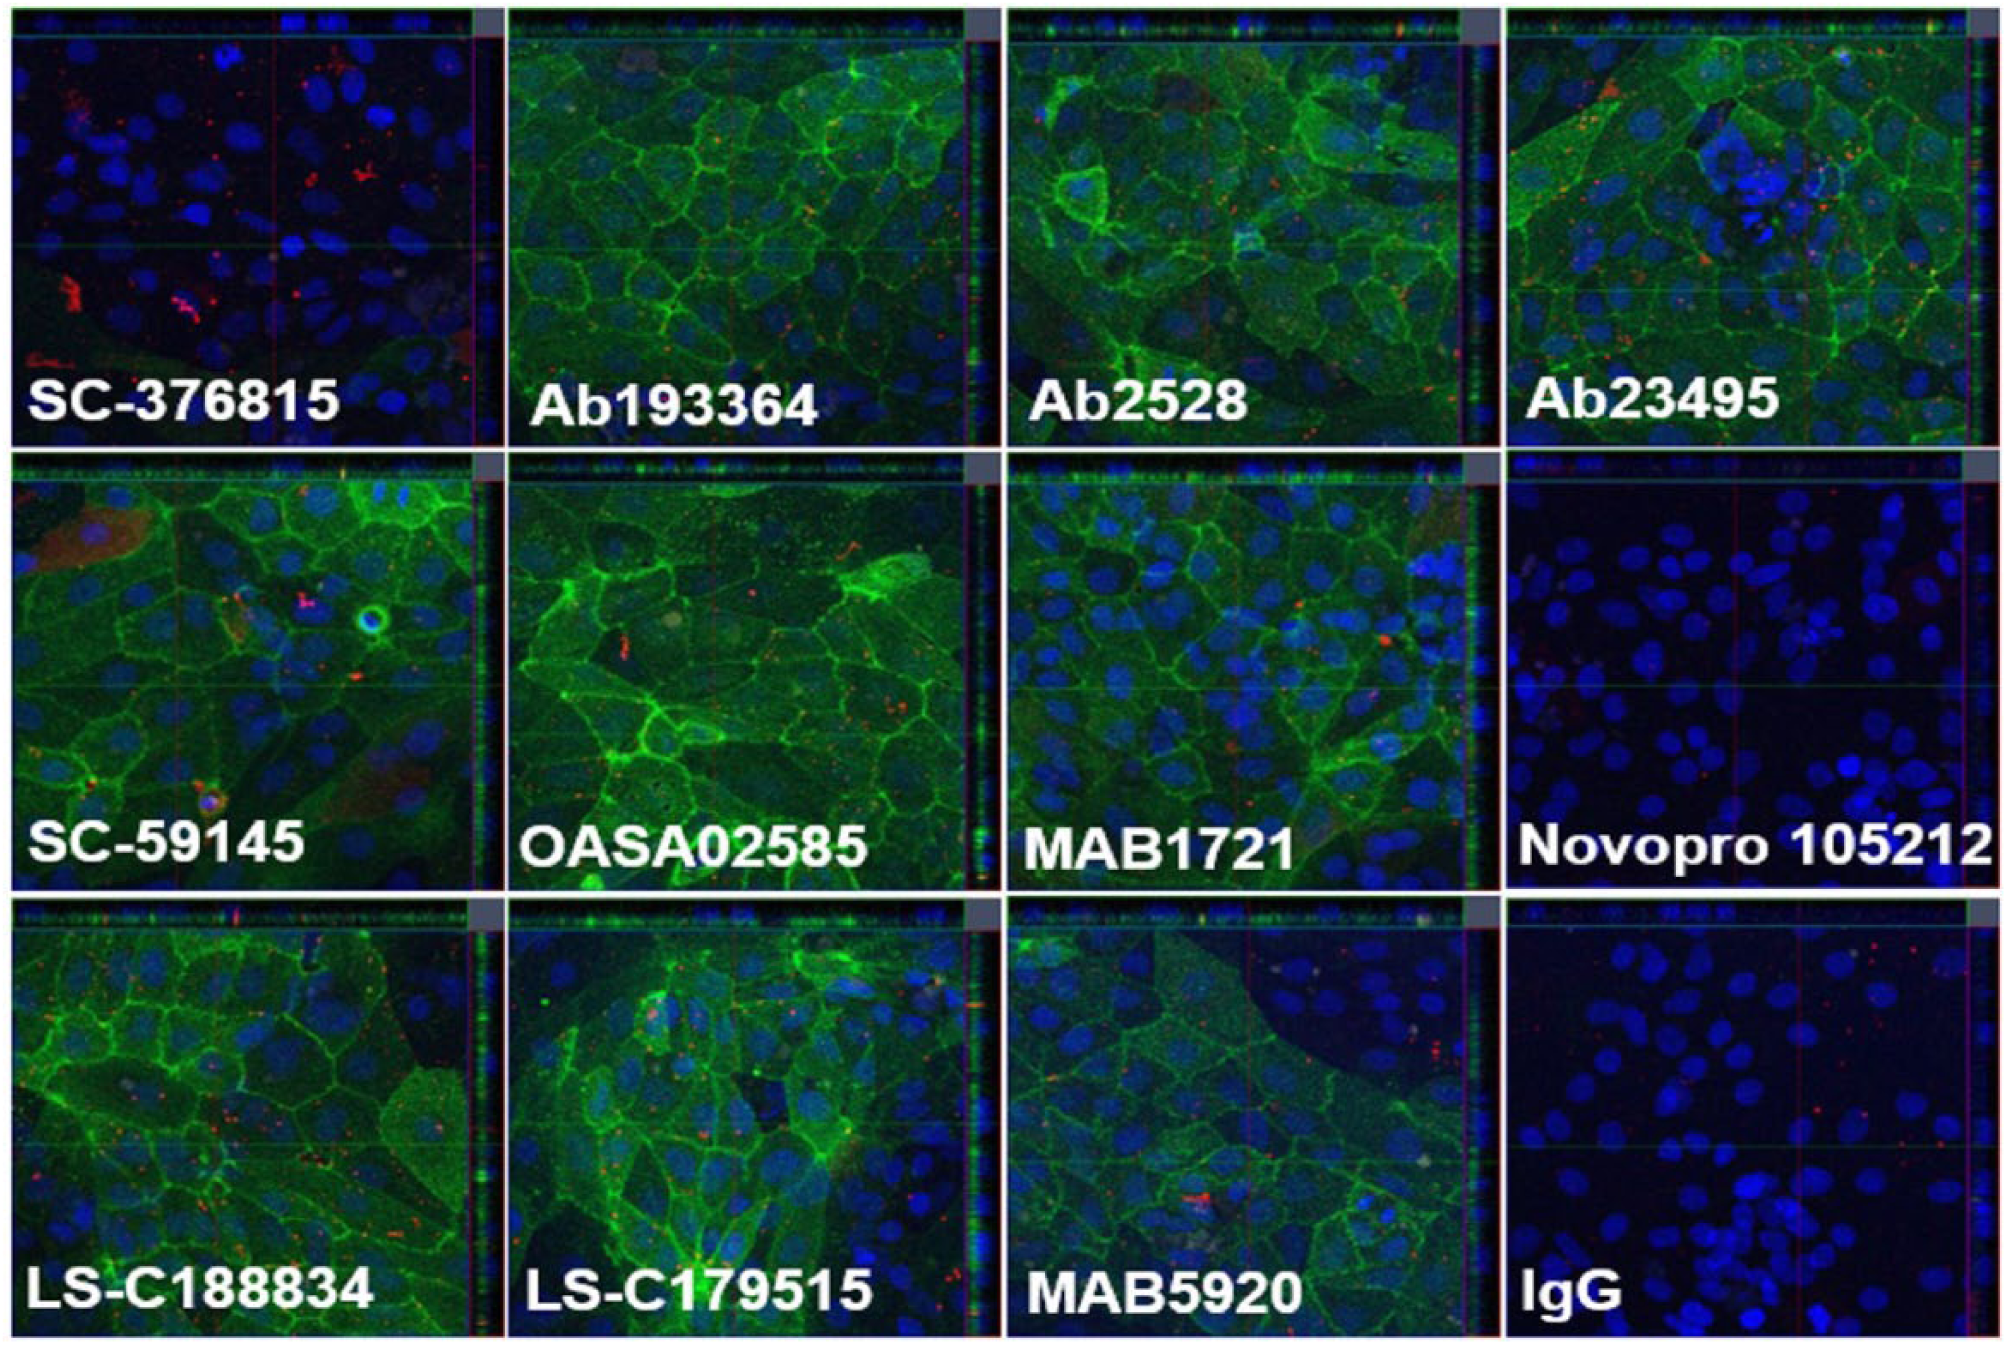
Confocal imaging for 12 CD98 antibodies in hCMEC/D3 (×20). The green signal is for endocytosed antibodies recognized by the second fluorescent antibody. The blue signal is for DAPI.
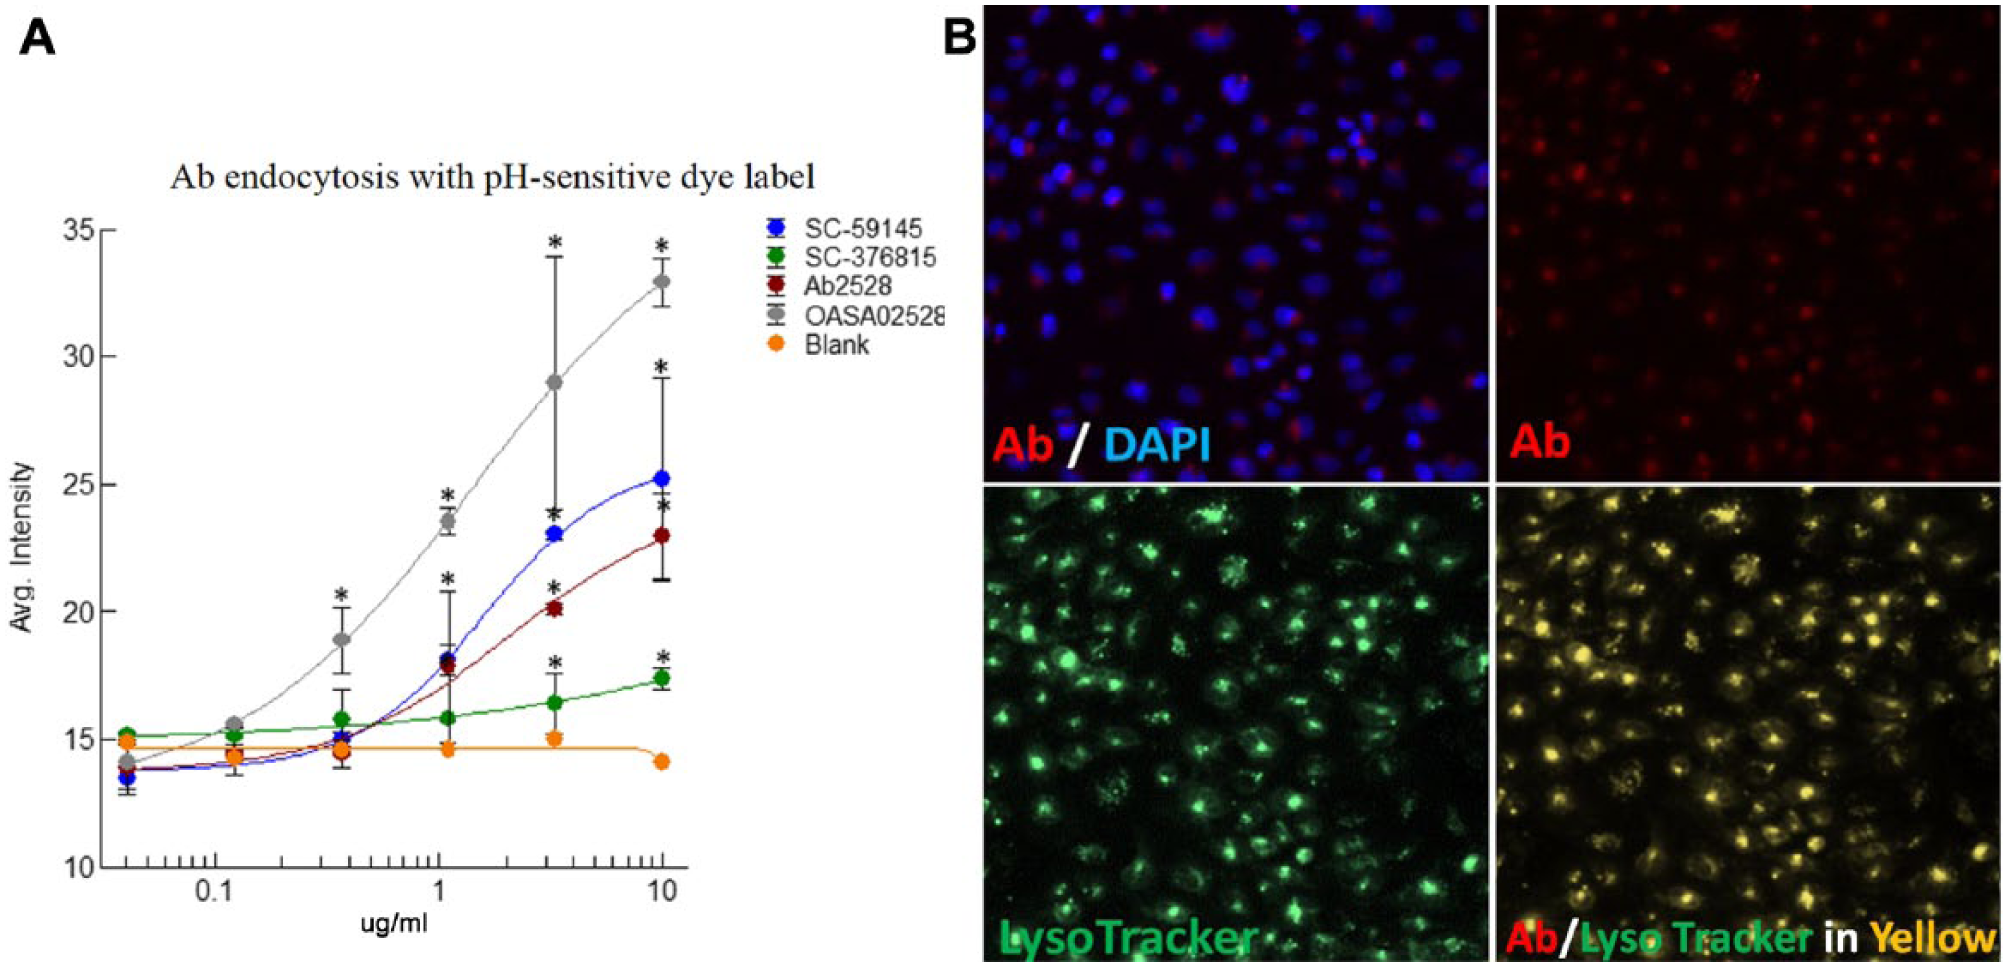
Furthermore, three positive antibodies (SC-59145, Ab2528, and OASA02528) and a negative control antibody (SC-376815) were tested in paired imaging measurements to determine whether the results are comparable to and consistent with those obtained by the pH-sensitive dye labeling method. As shown in Figure 6A , the signal window of the latter method was relatively smaller than that generated by paired imaging measurements, possibly because of a low DOL with suboptimal labeling efficiency. However, a good correlation was observed between the two methods. All three positive antibodies showed significant endocytosis signals compared with the blank group at concentrations from 0.4 to 10 µg/mL. The negative control antibody, SC-376815, also showed a slightly increased signal at 3 and 10 µg/mL, possibly because of unspecific binding and internalization at the high concentration. To confirm that the signal from the pH-sensitive dye labeled antibody is specific, LysoTracker was used to demonstrate that the antibody signal was colocalized to endosomes ( Fig. 6B ).
Validation with pH-sensitive dye label method. (
To further validate the methodology for other targets and cell types, antibodies against IGF1R, TfR, and CD31 were selected for testing on hCMEC/D3 cells. Some of the antibodies targeting intracellular epitopes were selected as negative controls, such as CD31 and IGF1R antibodies because they do not recognize extracellular epitopes. TfR antibody Ab1086 recognizes an epitope of the extracellular domain of TfR. A concentration-dependent increase in antibody endocytosis signal was observed ( Suppl. Fig. S1A ). The typical puncta structure induced by TfR antibody endocytosis was also observed in Cellomics images ( Suppl. Fig. S1C ). However, the maximal response window was less than the positive control CD98 antibody SC-59145, which may be due to insufficient incubation time used for TfR antibody endocytosis on the same plate together with antibodies against other targets such as CD98. It is also possible that the TfR antibody has intrinsically weaker capability in driving TfR internalization. Other antibodies, such as insulin receptor antibody, had similarly negative results as the IGF1R and CD31 antibodies because of the extracellular epitope, and therefore only CD31 and IGF1R antibody data were shown. In addition to testing on hCMEC/D3 cells, CD98 antibodies were also tested at a single concentration of 10 nM on hiPSC-derived endothelial cells with confocal Z-stack analysis, and a qualitative correlation between the two cell lines is seen on control antibodies in Figure 3 . However, since hiPSC-derived endothelial cells underwent a long induction time for differentiation, heterogenicity in cell differentiation and cell viability led to high variation in the cell-to-cell response in endocytosis, as seen in Figure 3A . Supplementary Figure S1B shows paired imaging results on hiPSC-derived endothelial cells, and it has good correlation with the results from hCMEC/D3 cells, possibly because they both have endothelial cell properties.
Discussion
The key rationale for paired imaging measurements is to use an imaging algorithm in conjunction with live cell staining for an indirect high-throughput quantification of ATE. The advantages of this methodology over other methods are as following: improved assay robustness, ease of use and standardization, fewer steps for reduced variations, and higher throughput with 96- or 384-well plates. These improvements are mainly due to the application of robust imaging algorithms, which can be designed empirically and flexibly as needed.9,11 Based on our experience, it is highly recommended that the positive and negative antibodies should be validated by other methods, such as Z-stack analysis. Other parameters should include a linear signal range, instrument stability, and signal comparability between different staining buffers. As false-positive and false-negative results are highly likely to be generated if any of the above parameters is suboptimal, for example, if overexposure time is taken, the overexposed intensity will be excluded for calculation; therefore, the wells with exceeding intensity (such as the well with a positive control antibody at the highest concentration) will generate a drop in data value. To avoid the above issues, we highly suggest performing this experiment within 1 day, detecting signal in the same and short interval, such as 1 h after staining, and conducting preexperiments for the validation, as we showed here.
Photobleaching is an inevitable issue for fluorescent-based study. However, since both measurements were immediately carried out after staining, photobleaching only minimally influenced surface antibody signal, as it was read twice, while the intracellular antibody was only read once in the second measurement. According to our method principle reflected in a simplified formula, Intracellular Ab ↓ = Total Ab ↓ (second measurement) – Surface Ab (first measurement), where Ab is antibody, the final calculated intracellular value would artificially become smaller (denoted as ↓) because the surface value in the second measurement would become smaller compared with the surface value measured in the first time because of photo-bleaching. Biologically, this means that some marginally positive antibodies will be counted as negative ones, and this is an acceptable situation for our assay in practice since our purpose is to screen antibodies with robust endocytosis response.
Another advantage of paired imaging measurements is that antibody surface-binding affinity and antibody endocytosis capability can be determined in a clear and quantitative manner that differentiates these two capabilities of the same antibody, as shown in Figure 3B . In fact, Ab2528 and Ab23495 share a similar degree of surface binding; however, the latter shows a higher endocytosis response than the former. It is known that some antibodies, such as MAB5920, showed consistently low surface-binding affinity and low endocytosis capability, indicating that low binding affinity leads to low endocytosis in most cases ( Fig. 4A ). As some studies reported, antibodies with moderate binding affinity usually have high endocytosis capability because the antibody is easy to attach to or detach from the receptor during vesicle trafficking.19,22–24 The method of paired imaging measurements can be useful in exploring the relationship of antibody binding affinity and its capability to trigger endocytosis, enabling better prediction and mechanistic studies.
A high-content cell imaging system is essential for this methodology, and in our studies a Cellomics ArrayScan was utilized. Other high-content imaging instruments and software may also be employed, such as Operetta (PerkinElmer, Waltham, MA) and Incell (Incell Corporation, San Antonio, TX). Other imaging software may also be useful, such as Columbus and CellProfiler.4,25,26 Before starting experimental testing, series validations of the instrument stability, which is related to the lamp power quality, are critical. In fact, 1-day repeating tests and day-to-day comparisons should be carried out in advance to make sure that there is no intrinsic signal decline.
It is worth noting that ATE or internalization is also an important mechanism in oncology endowed with potential therapeutic value.1,2,19 We did not explore its application in oncology because of our different research focus. This method can be further evaluated and applied to the studies of therapeutic antibodies in oncology.
In summary, the paired imaging measurement is a novel quantitative methodology for high-throughput determination of ATE on cultured cells. It reduces tedious steps in other traditional methods, such as antibody labeling and quenching. The method capitalizes on the robustness of the in situ quantitative imaging algorithm in conjunction with live cell staining. It is a new method tool for quantitative analysis of ATE or internalization and may be employed for large-scale screening in therapeutic antibody discovery.
Supplemental Material
DISC761355_Supplementary_Material – Supplemental material for Quantitative Algorithm-Based Paired Imaging Measurement for Antibody-Triggered Endocytosis in Cultured Cells
Supplemental material, DISC761355_Supplementary_Material for Quantitative Algorithm-Based Paired Imaging Measurement for Antibody-Triggered Endocytosis in Cultured Cells by Sophie Gong, Yuan Li, Wenji Su, Yu Ding, Jiaqi Lu, Kelly Dong, Steve Hood, Wandong Zhang and Georg C. Terstappen in SLAS Discovery
Footnotes
Acknowledgements
The authors would like to thank Dr. Aaron Cheng at GSK for providing and testing hCMEC/D3 cells.
Declaration of Conflicting Interests
The authors declared no potential conflicts of interest with respect to the research, authorship, and/or publication of this article.
Funding
The authors disclosed receipt of the following financial support for the research, authorship, and/or publication of this article: The funding of this work was from GlaxoSmithKline.
Supplementary material is available online with this article.
References
Supplementary Material
Please find the following supplemental material available below.
For Open Access articles published under a Creative Commons License, all supplemental material carries the same license as the article it is associated with.
For non-Open Access articles published, all supplemental material carries a non-exclusive license, and permission requests for re-use of supplemental material or any part of supplemental material shall be sent directly to the copyright owner as specified in the copyright notice associated with the article.