
Abstract
Kynurenine 3-monooxygenase (KMO) is a well-validated therapeutic target for the treatment of neurodegenerative diseases, including Alzheimer’s disease (AD) and Huntington’s disease (HD). This work reports a facile fluorescence-based KMO assay optimized for high-throughput screening (HTS) that achieves a throughput approximately 20-fold higher than the fastest KMO assay currently reported. The screen was run with excellent performance (average Z′ value of 0.80) from 110,000 compounds across 341 plates and exceeded all statistical parameters used to describe a robust HTS assay. A subset of molecules was selected for validation by ultra-high-performance liquid chromatography, resulting in the confirmation of a novel hit with an IC50 comparable to that of the well-described KMO inhibitor Ro-61-8048. A medicinal chemistry program is currently underway to further develop our novel KMO inhibitor scaffolds.
Keywords
Introduction
The kynurenine pathway (KP) is the major route of tryptophan metabolism, ultimately resulting in the de novo synthesis of the essential cellular cofactor nicotinamide adenine dinucleotide (NAD+). 1 However, dysregulation of this pathway results in the accumulation of the neurotoxic metabolites 3-hydroxykynurenine (3-HK) and quinolinic acid (QUIN; Fig. 1 ). These have been implicated in the progression of neurodegenerative disease, including Huntington’s disease (HD), Alzheimer’s disease (AD), and amyotrophic lateral sclerosis (ALS; or motor neurone disease [MND]).2–7 There is also increasing appreciation that excess QUIN may play a role in major depression, 8 suicidality, 8 and other neuropsychiatric conditions. 9
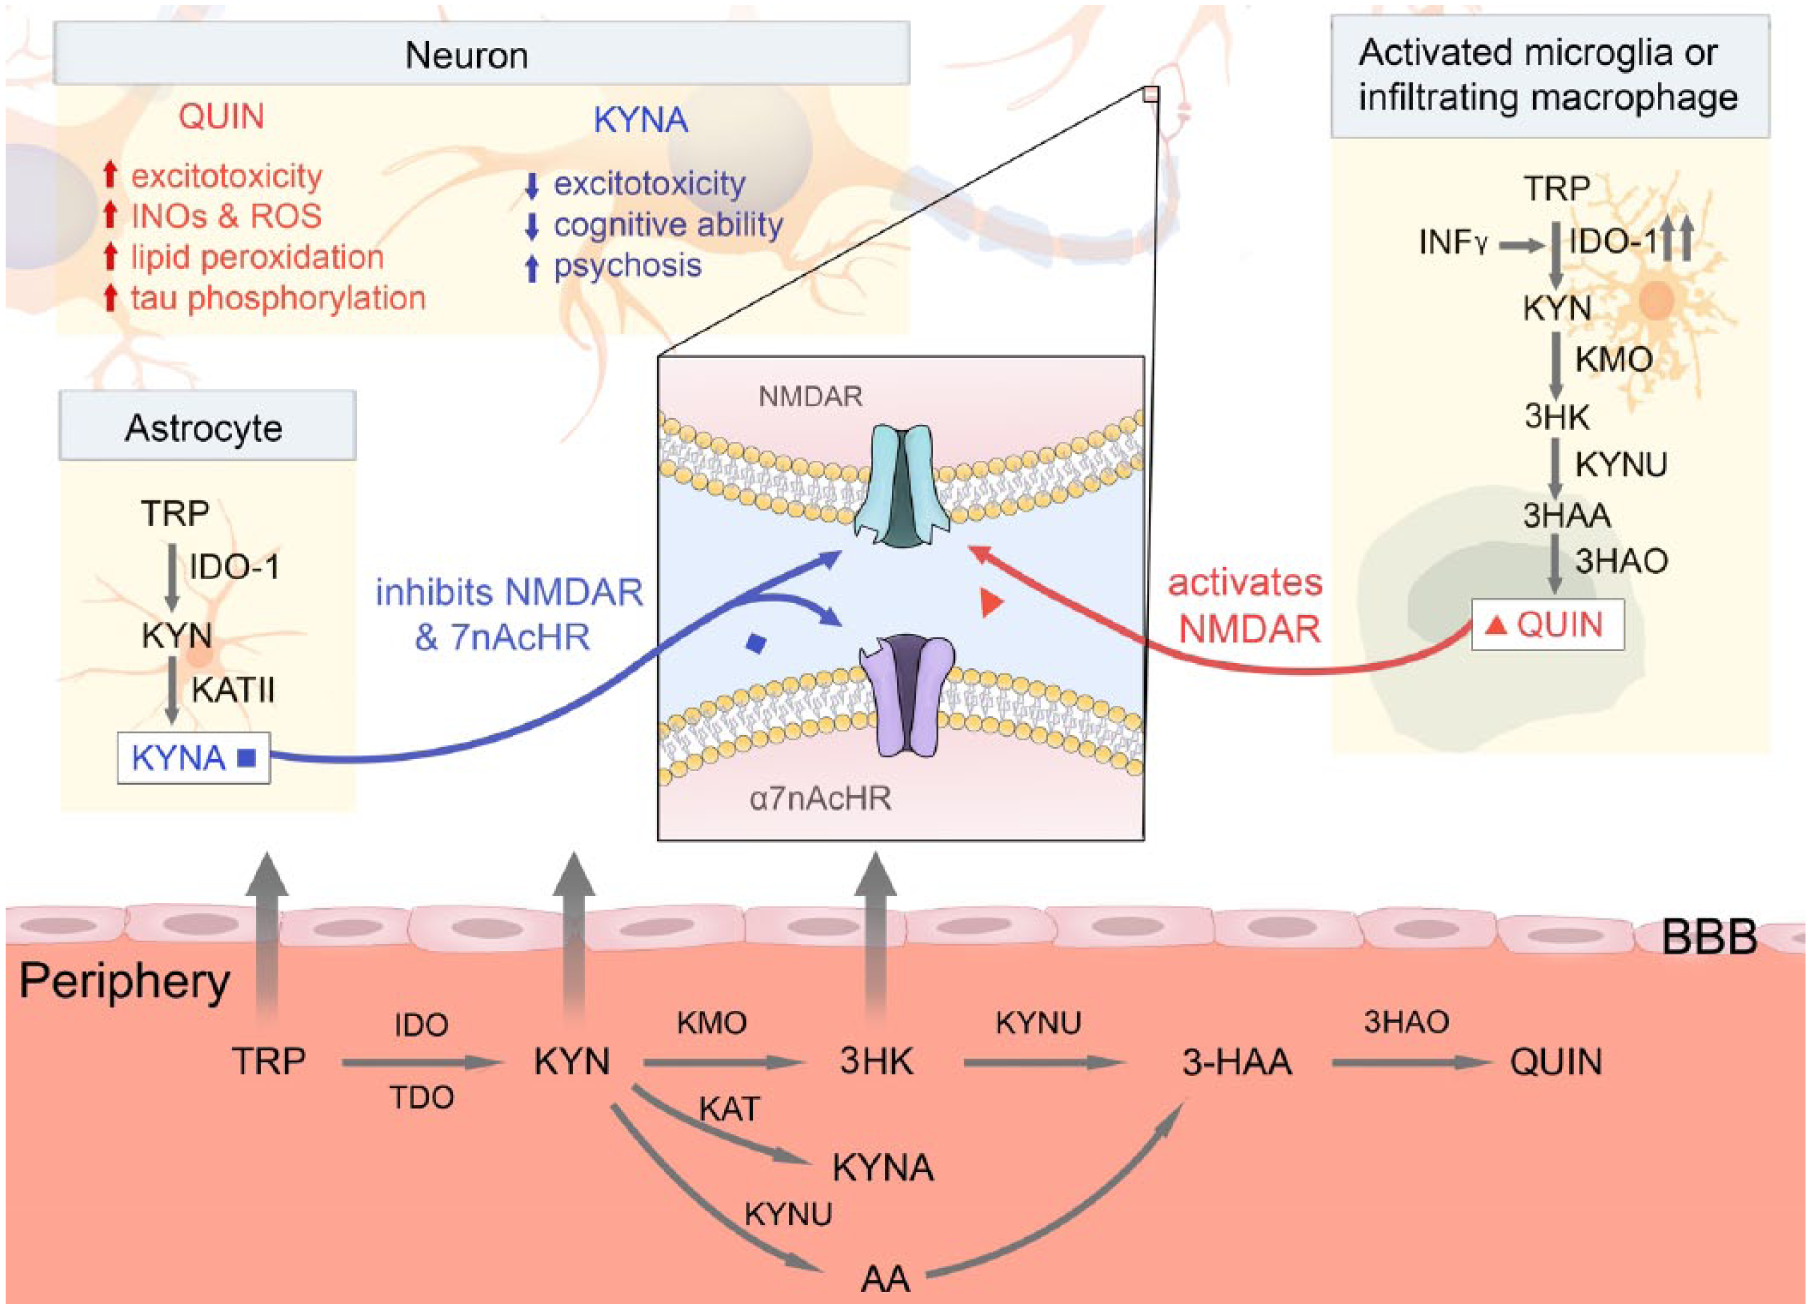
Schematic highlighting the key KP metabolites and cell types implicated in the pathogenesis of neurodegenerative disease. Tryptophan (TRP), KYN, and 3-HK are actively transported across the blood–brain barrier (BBB), where they are converted into neuroprotective kynurenic acid (KYNA) by astrocytes and neurotoxic QUIN by activated microglia and infiltrating macrophages. QUIN and KYNA then play complementary roles, activating and inhibiting the NMDA receptor, respectively. In the major neurodegenerative diseases, imbalances in this pathway result in increased excitotoxicity, increased production of reactive oxygen species (ROS) and inducible nitric oxide synthase (iNOS), and increased lipid peroxidation. AA = anthranilic acid; 3-HAA = 3-hydroxyanthranilic acid; IDO = indoleamine 2,3-dioxygenase; TDO = tryptophan dioxygenase; KAT = kynurenine aminotransferase; KYNU = kynureninase; 3HAO = 3-hydroxyanthranilic acid oxygenase; NMDAR = N-methyl-
Kynurenine 3-monooxygenase (KMO) plays a central role in the KP, where it catalyzes the conversion of kynurenine (KYN) to 3-HK in the presence of β-nicotinamide adenine dinucleotide 2′-phosphate (NADPH) as an electron donor ( Fig. 2A ). 10 Due to its location at a branch point in the KP, KMO activity plays a vital role in KP metabolite homeostasis. Inhibition of KMO is hypothesized to shift the KP away from the production of neurotoxic QUIN and toward neuroprotective KYNA, thereby reducing QUIN-induced excitotoxicity, highlighting its role as a potential therapeutic target. A number of proof-of-concept studies in animal models of neurodegenerative disease have demonstrated a positive effect via modulation of the KP in the periphery. 11
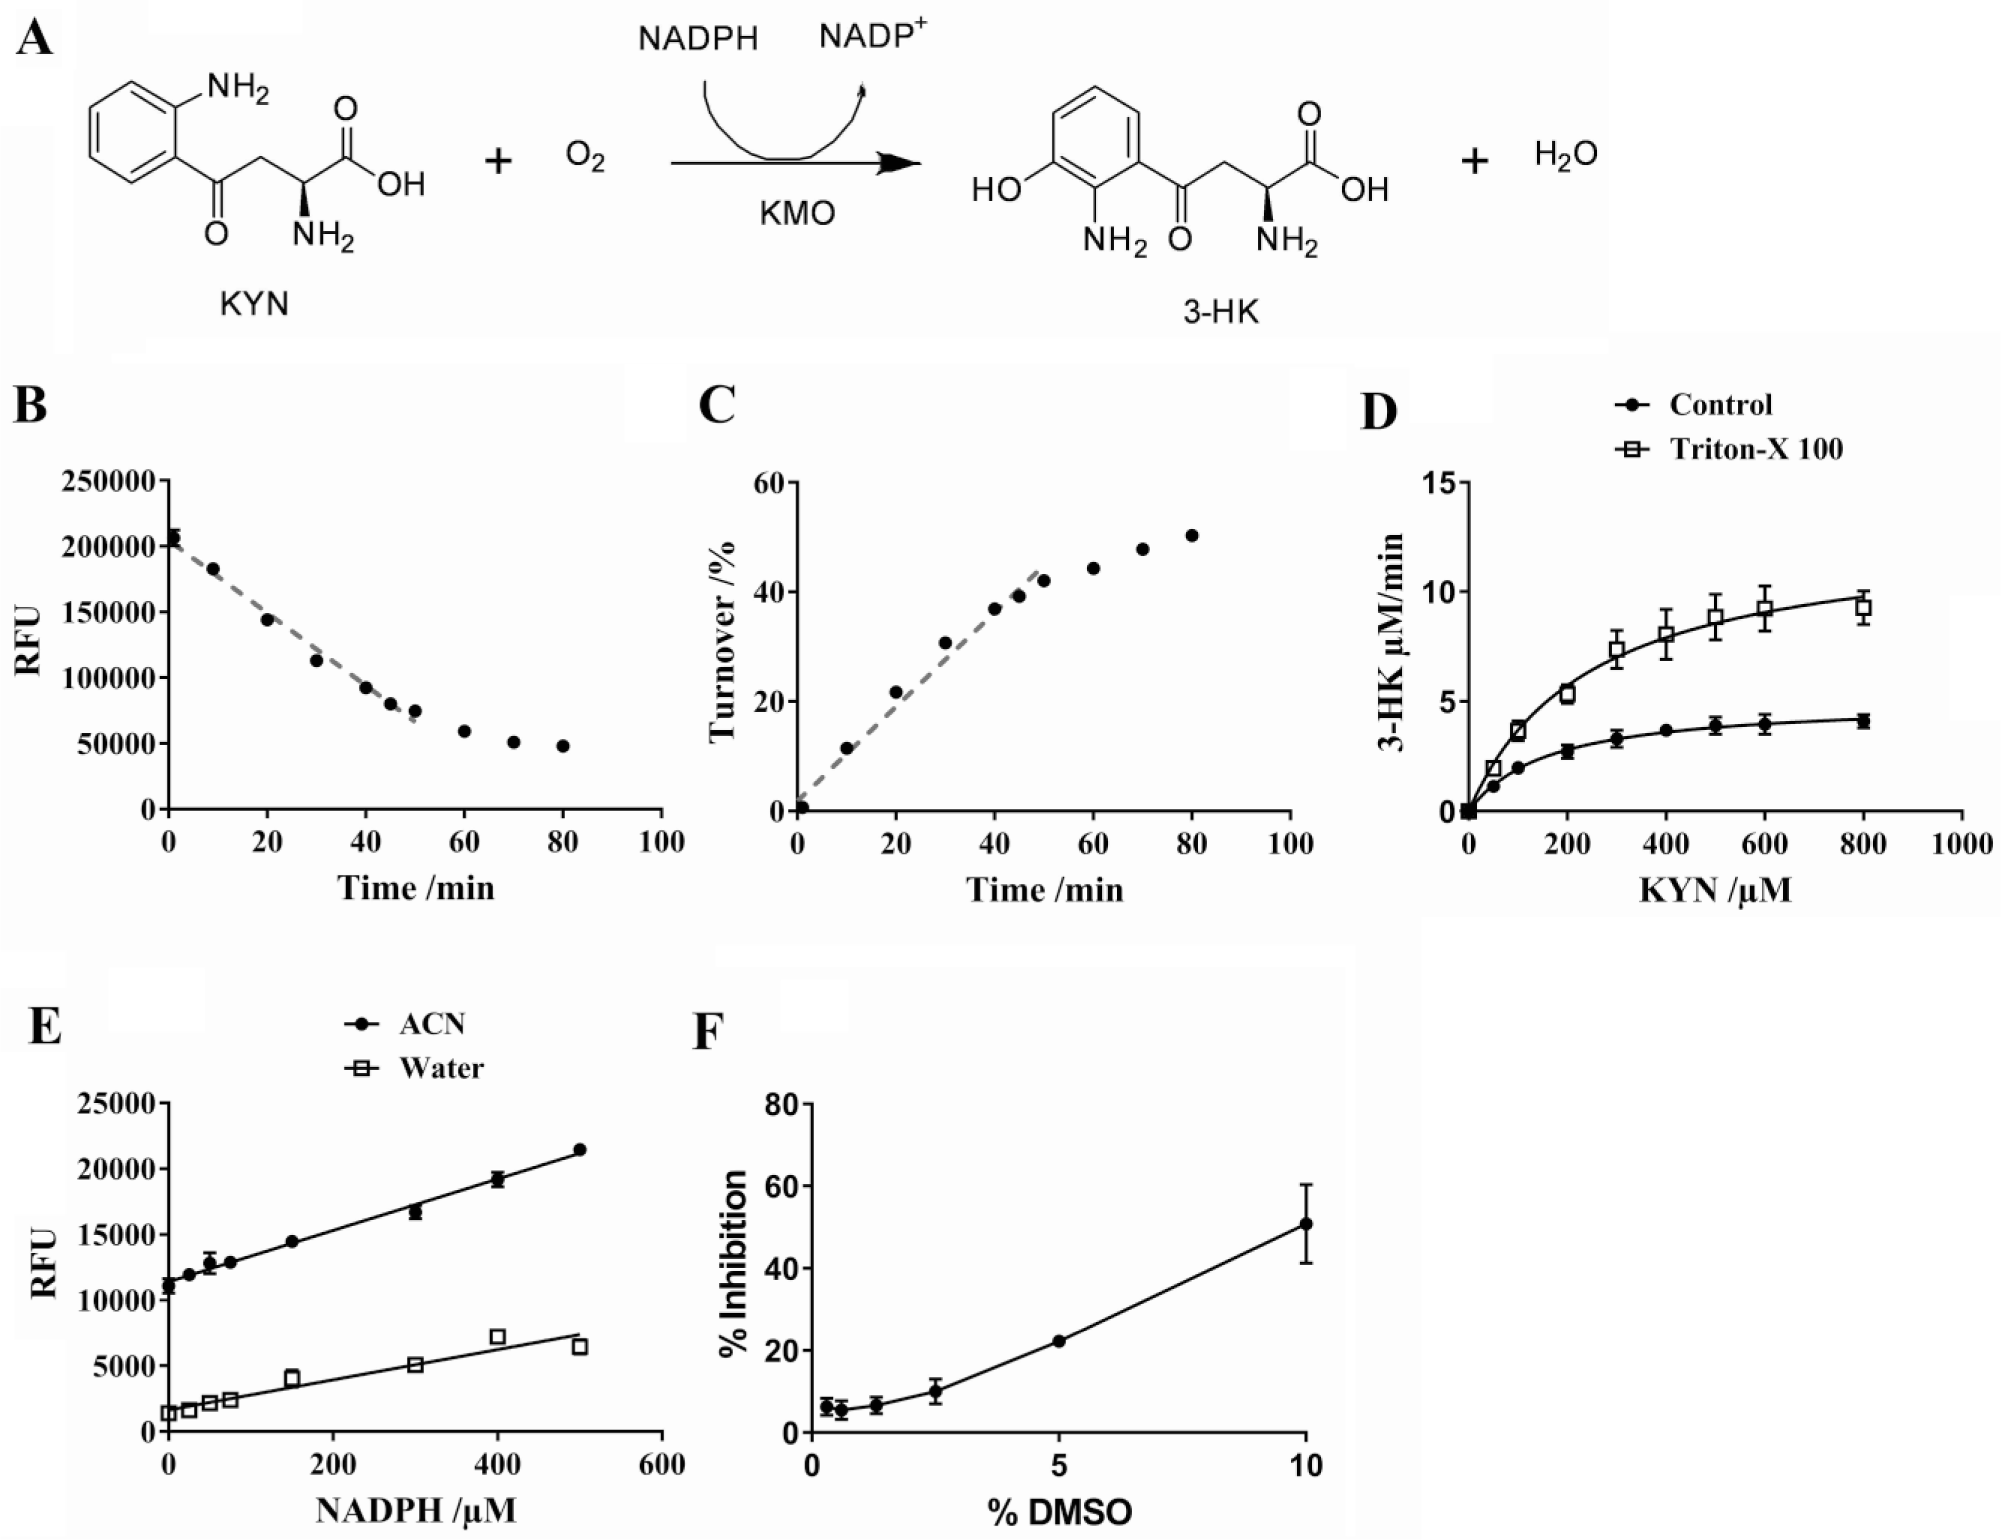
Enzymatic reaction and key assay parameters. (
However, the inability of current KMO inhibitors to effectively cross the blood–brain barrier 12 is problematic but presents an opportunity for drug discovery. A number of KMO assays have been described utilizing analytical technology, including rapid-fire mass spectrometry (MS) 13 and liquid chromatography tandem mass spectrometry (LC-MS/MS). 14 While these have the ability to identify false positives and negatives through the direct quantification of KYN and 3-HK, these methods are not readily available and are expensive and slow relative to fluorescence-based assays. Here, we report a facile fluorescence-based KMO activity assay optimized for high-throughput screening (HTS) and reconfirmed in a primary screen of 110,000 lead-like small molecules that satisfied most Lipinski rule of 5 and CNS permeability criteria.
Materials and Methods
Materials
Biochemical Assays
Initial biochemical KMO assays were performed in a final volume of 30 μL in microcentrifuge tubes containing 50 mM potassium phosphate (pH 7.5), 600 μM NADPH, 600 µM KYN, 40 µM FAD, KMO (0.1 µg/µL, 86 nM), and 0.1% v/v Triton X-100 unless otherwise stated. All reagents were equilibrated at 37 °C prior to use. Test compounds were preincubated at 37 °C for 5 min prior to the addition of equal volumes of
Fluorescence-Based HTS Assay
Single-concentration screening (10 µM in DMSO, final DMSO concentration 0.2%) was performed in batches of 16 plates using assay-ready plates (Compounds Australia, Nathan, Australia) prepared using a central DDR Robot on a BioCel 1200 Platform (Agilent Technologies, Santa Clara, CA) with an Echo 550 liquid transfer system (Labcyte Inc., San Jose, CA) in flat-bottom, low-volume, 384-well plates (Greiner Bio-One, VWR, Murarrie, Australia). DMSO was dispensed into columns 1 and 24 (no KYN, 100% inhibition control) and columns 2 (rows A–H) and 23 (rows I–P) for defining the maximum signal (100% inhibition) and minimum signal (0% inhibition) controls, respectively. An additional positive control containing Ro-61-8048 (final concentration 10 µM) was dispensed into columns 2 (rows I–P) and 23 (rows A–H; midsignal control). Plates were sealed under nitrogen and either used the next day or stored at −80 °C prior to use. Following identification of hits (compounds with greater than 40% inhibition at 10 µM), hits were reconfirmed in triplicate. For dose–response curves, compounds were dispensed into assay-ready plates by Compounds Australia as a 10-point, twofold serial dilution series in 100% DMSO starting at 20 µM, as described for single-concentration screening. Analysis of dose–response curves was performed by EnSpire Software (PerkinElmer, Waltham, MA).
Conditions for the high-throughput assay were the same as described above, except the final assay volume was 10 µL. Assays were performed by initially dispensing (Multidrop 384 reagent dispenser; Thermo Scientific, Waltham, MA) 5 µL of two times master mix preincubated at 37 °C (100 mM potassium phosphate, 1200 µM NADPH, 80 µM FAD, 0.2 µg/µL recombinant human KMO (rhKMO) and 0.2% v/v Triton X-100) into assay-ready plates containing predispensed test compounds and incubating for 5 min at 37 °C; evaporation was mitigated by use of lids and a humidified atmosphere. Enzymatic reactions were initiated with the addition of two times substrate (1200 µM KYN) and incubated at 37 °C for 45 min prior to the addition of 5 µL of ACN stop solution. Fluorescence was then measured at room temperature using an EnSpire Multimode plate reader equipped with a quad-monochromator (excitation 340 nm, emission 460 nm).
Chemical Library
We screened compounds from the Walter and Eliza Hall Institute Compound Catalogue (WECC) library. This library is composed of roughly 114,000 “lead-like” low-molecular-weight synthetic organic compounds and is focused on chemical diversity, covering many unique chemotypes. The compounds generally comply with Lipinkski’s rule of 5 and were assessed in terms of the presence of redox active and reactive groups, and toxicophoric and key physical properties, including blood–brain barrier penetrability, number of chiral centers, and Fsp3 character.
UHPLC Analysis
KYN and 3-HK were quantified using an Agilent 1290 UHPLC system equipped with a G4212A variable-wavelength detector and a Zorbax RRHD Eclipse Plus C18 2.1 × 150 mm, 1.8 µm column (Agilent Technologies, North Ryde, Australia) in accordance with published methods. 15 A mobile phase consisting of 0.1 M sodium acetate, pH 4.65, was run isocratically through the system at 0.75 mL/min, and the column was maintained at 38 °C. KYN and 3-HK were cocurrently measured via absorbance at 365 nm following a 5 µL injection onto the column. The run time for each sample was 4.3 min, with 3-HK and KYN eluting at 1.2 and 3.0 min, respectively.
Data Analysis
UHPLC
Using the integrated peak area data from UHPLC analysis, concentrations were interpolated from standard curves and the conversion of KYN to 3-HK within a sample was expressed as a percentage using eq 1.

Percentage inhibition could then be expressed as a percentage of the minimum (0% inhibition) control. Steady-state enzyme kinetic data were fitted using nonlinear regression to the Michaelis–Menten equations using GraphPad Prism 7 (GraphPad Software, La Jolla, CA).
Fluorescence-Based HTS Assay
The percentage inhibition of an inhibitor was calculated as shown in eq 2.
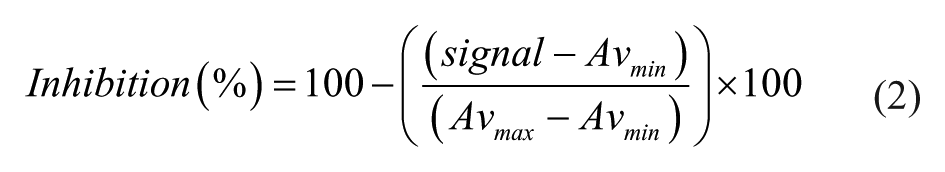
where Avmax = the observed enzyme activity measured in the presence of all assay components and Avmin = the observed enzyme activity measured in the presence of all assay components except substrate, KYN.
Results and Discussion
Fluorescence-Based Assay Development
Several assays monitoring the consumption of the KMO fluorescent enzymatic cofactor NADPH have been reported and validated.16–18 These assays are advantageous in that they are simple and cost-effective, but to date, none have been optimized for HTS. Additionally, as substrate consumption assays have a restricted signal-to-background ratio (S/B) range and often require increased enzymatic turnover, they may be less than ideal for HTS. However, by necessity, a substrate consumption strategy was the only viable option for our fast HTS assay.
Although these assays are also susceptible to interference by some fluorescent test compounds (signal quenching and/or autofluorescence), these compounds can often be identified during screening and excluded in future validation. This includes use of additional steps, such as assessing compound fluorescence in a buffer-only system or prereading the plate prior to the addition of substrates. The main advantages of this system over others include a significantly higher throughput (~2 min/384-well plate), compared with that of both rapid-fire MS (45 min/384-well plate) and LC-MS/MS (~9 h/384-well plate) assays, and a significant reduction in cost and increased availability of the required instrumentation.
Assay kinetic parameters were first assessed by UHPLC prior to moving to the fluorescent 384-well-plate-based format. The assay was shown to be linear with respect to time up to 50 min in the fluorescence-based assay system and also in the UHPLC assay ( Fig. 2B , C ). Vint and Vmax were shown to be 6.4 ± 0.4 µM/min and 12.8 ± 1.1 µM/min, respectively ( Fig. 2D ). DMSO tolerance was also assessed with no significant effect seen up to 2.5% DMSO ( Fig. 2F ).
The key kinetic parameter, Km, was 256 µM ( Fig. 2D ), as determined by UHPLC. Previously reported Km values for KYN seemed to reflect the membrane-bound status of the KMO enzyme. In studies using membrane-associated enzyme, lower Km values were found (7 and 14 µM),13,14 whereas a higher Km value (approximately 90 µM) can be calculated from data reported by others 16 for detergent-solubilized recombinant human KMO, which is comparable to our Km value. It is also interesting to note that treatment of KMO with a membrane-solubilizing concentration of detergent resulted in an increase of Km from 7 to 42 μM, 13 further indicating that the membrane environment influences Km by enhancing substrate binding.
While it is ideal that HTS assays are designed with substrate concentrations at or below Km, to equally favor detection of inhibitors of all classes, increasing substrate concentration improves Z′. In balancing these priorities, we selected a KYN concentration approximately two times Km. As shown by Acker and Auld, [S]/Km ratios under 5 do not appreciably impair detection of competitive inhibitors. 19
As reported by Simeonov et al., about 5% of compounds fluoresce in the blue emission in typical low-molecular-weight compound libraries. 20 To reduce the rate of detection of false-positive autofluorescent compounds, we attempted to red-shift our assay by using the diaphorase-resazurin-coupled NADPH quantification method. 21 However, this resulted in a significant increase in the variance of fluorescence signals. We therefore adopted two approaches to reduce false positives, as outlined below.
Once key kinetic parameters were established, the assay was transferred to a 384-well, low-volume plate format. A low concentration of Triton X-100 detergent was included to prevent the adsorption of the enzyme on the plastic tubing of the Multidrop reagent dispenser. This also increased enzymatic turnover (as shown by a doubling of Vmax), presumably by preventing protein aggregation and stabilizing the hydrophobic membrane-anchoring domain ( Fig. 2D ). Additionally, inclusion of detergent reduces compound aggregation, in turn reducing the occurrence of nonspecific enzyme inhibition. 22
An organic stop solution, ACN, was chosen to reduce the formation of bubbles in the reaction mixture, resulting in improved coefficients of variation (CVs) in the high, mid, and low range. It also increased the slope of the standard curve approximately twofold (from 11.47 to 19.53; Fig. 2E ).
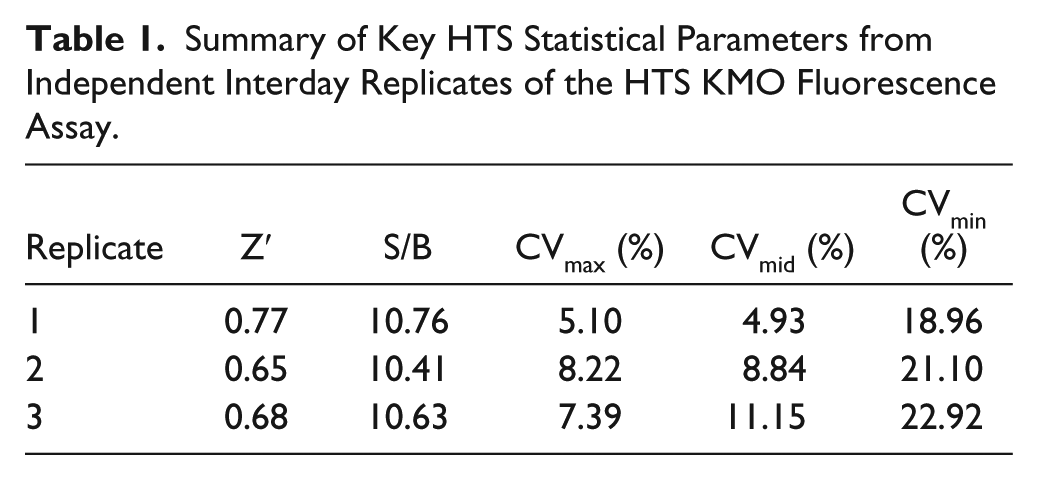
Preliminary assessment of key HTS criteria, including Z′, S/B, and CVs (%) at the high, mid, and low range, was achieved by running three 384-well plates as independent interday replicates to assess assay robustness. A summary of the key results is presented in Table 1 . From this, the assay was shown to meet or exceed all statistical parameters used to describe a robust HTS assay, including Z′ > 0.4, CVmax and CVmid ≤ 20%, and CVmin ≤ 20% or SDmin ≤ min signal. 23
Summary of Key HTS Statistical Parameters from Independent Interday Replicates of the HTS KMO Fluorescence Assay.
HTS Assay
A primary screen of 110,000 compounds screened in singlet at 10 µM was run to further confirm assay robustness. Control charts from the full 110,000-compound screen showed excellent assay performance across 341 plates, with average values for most plates being within 2 SD of the mean, except for those affected by human error ( Fig. 3 ). As a first-pass process to identify false positives, hits that produced fluorescence readings 1.2-fold greater than those produced by the prereaction concentration of NADPH were identified as false positives and excluded (76 compounds). The overall reproducibility between the controls on each plate was high, with an average Z′ of 0.80 ± 0.05, S/B of 17.7 ± 3.9, 100% inhibition control of 39,322 ± 2396 RFU, Ro-61-8048 control of 20,593 ± 822 RFU, and 100% activity control of 2397 ± 893 RFU. The CVs for the high, mid, and low controls were 5.8%, 7.3%, and 5.8%, respectively, well below the 20% threshold cited as acceptable. 23 Our S/B value was much greater than the expected value of 2 (i.e., 50% substrate consumption). Potential explanations for the increased S/B include the known spontaneous degradation of NADPH in phosphate buffers 24 and the possibility that KYN and 3-HK quench NADPH fluorescence (as they both absorb at 365 nm).
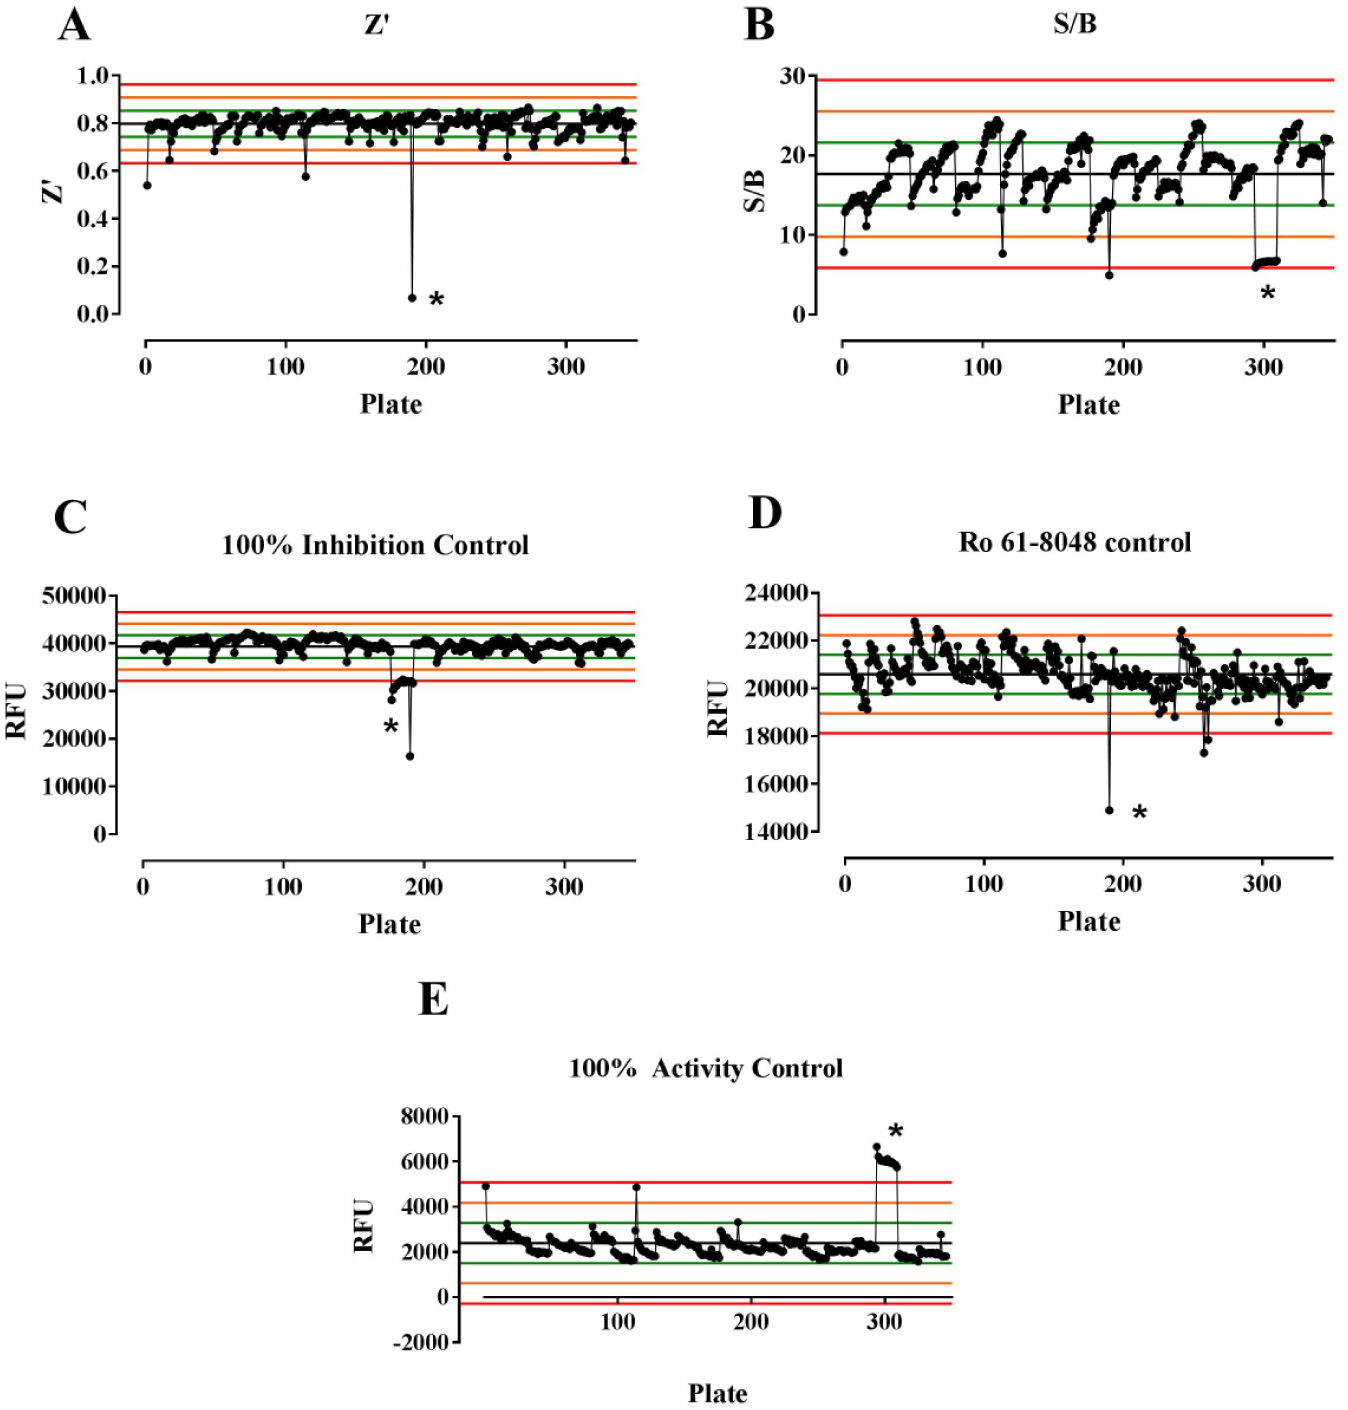
Control charts for Z′ (
From the primary screen, the top 490 compounds were selected for hit reconfirmation in triplicate. The reconfirmation rate was 90%, relative to the primary screen, with a result being defined as reproducible if it differed by no more than 15 points from the percent inhibition determined in the primary screen. As for the primary screen, a further 18 of these 490 compounds (3.67%) were excluded because of excessive fluorescence.
The top 128 compounds (minimum 52% inhibition) identified in the triplicate confirmation screen were then selected for triplicate 10-point dose–response testing starting at 20 µM in a 1:2 dilution series. Additionally, a second process was used to identify false positives prior to UHPLC validation, whereby samples were also plated in duplicate at 20 µM and screened in the assay system (without KMO) to assess fluorescence. This resulted in the further exclusion of 56 compounds. A small subset of the 72 remaining molecules (0.07% hit rate) were selected and sourced for validation via UHPLC. Dose–response curves for two representative hits (MQ 1 and MQ 2) with varying activities are shown in
Figure 4A
. The KMO inhibitor, Ro-61-8048 (IC50 0.78 ± 1.0 µM in our assay), was included as a reference positive control. Several hits were validated with activity profiles similar to those of Ro-61-8048. Representative compound
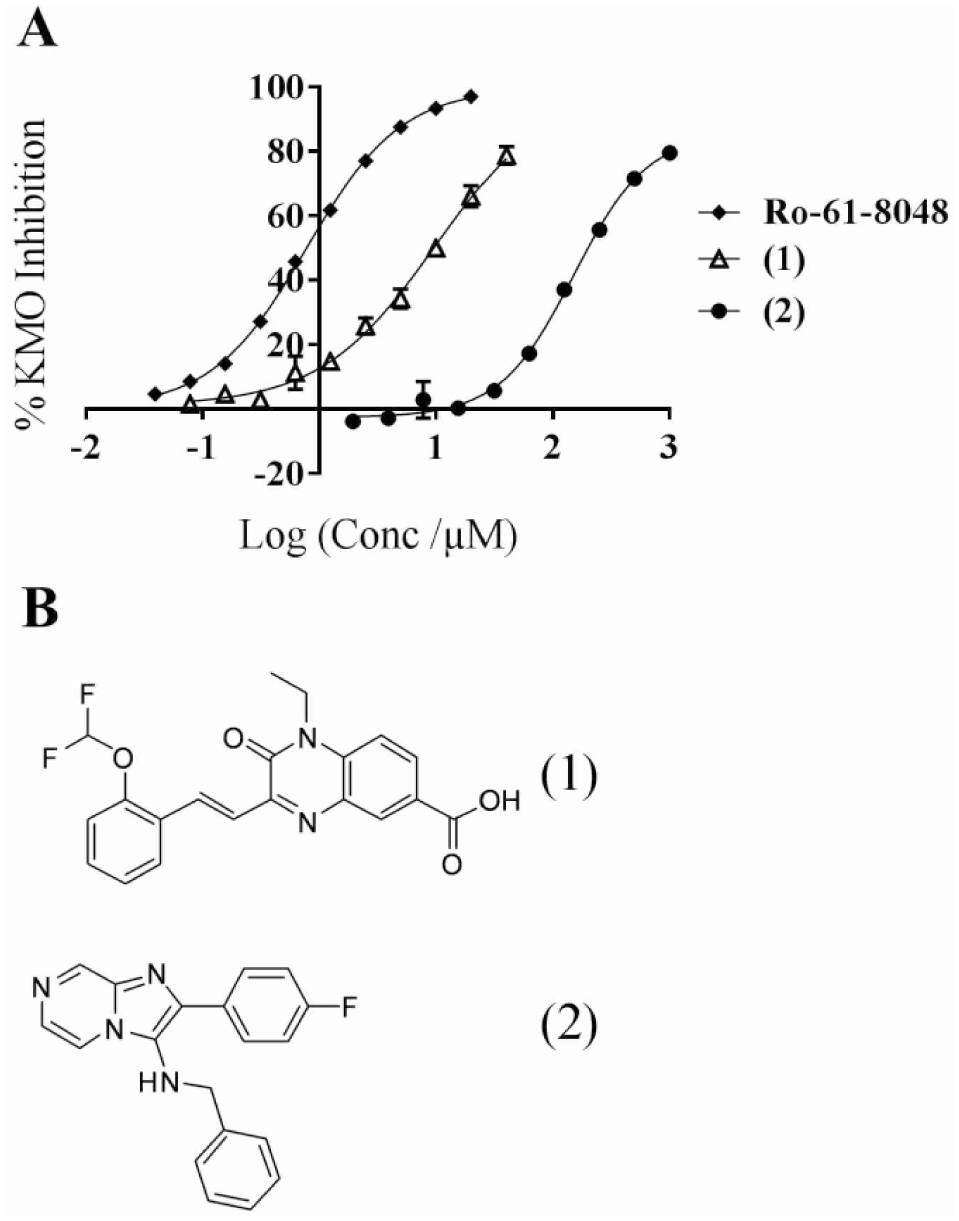
(
Footnotes
Acknowledgements
We thank Stephanie L. Rayner, Department of Biomedical Sciences, Macquarie University, for assistance in preparing Figure 1. High-throughput screening was performed as a fee-for-service at the Drug Discovery Centre, Children’s Cancer Institute of Australia, University of New South Wales, NSW, Australia, and we thank Drs. Greg Arndt, Tim Failes, and Anna Mariana and Mr. Richard Elliot for excellent technical support.
Declaration of Conflicting Interests
The authors declared no potential conflicts of interest with respect to the research, authorship, and/or publication of this article.
Funding
The authors disclosed receipt of the following financial support for the research, authorship, and/or publication of this article: The authors gratefully received financial support for the research from the Alzheimer’s Drug Discovery Foundation, New York, New York (grant awarded to GJG and DBL 2015-2016).