
Abstract
Kynurenine monooxygenase (KMO) catalyzes the conversion of kynurenine to 3-hydroxykynurenine. Modulation of KMO activity has been implicated in several neurodegenerative diseases, including Huntington disease. Our goal is to develop potent and selective small-molecule KMO inhibitors with suitable pharmacokinetic characteristics for in vivo proof-of-concept studies and subsequent clinical development. We developed a comprehensive panel of biochemical and cell-based assays that use liquid chromatography/tandem mass spectrometry to quantify unlabeled kynurenine and 3-hydroxykynurenine. We describe assays to measure KMO inhibition in cell and tissue extracts, as well as cellular assays including heterologous cell lines and primary rat microglia and human peripheral blood mononuclear cells.
Introduction
Huntington disease (HD) is an autosomal dominant, progressive neurodegenerative disease caused by an expanded CAG repeat sequence in the 5′-region of the huntingtin gene (HTT). HD is characterized by motor, psychiatric, and cognitive deficits, with broad neuronal loss in the basal ganglia and several cortical areas.1,2
The tryptophan/kynurenine catabolic pathway is an area of interest for the development of potential therapies for HD and other neurological disorders. 3 Several kynurenine metabolites can modulate the inflammatory response and neurotransmission or display neurotoxic properties. 4 Kynurenine 3-monooxygenase (KMO) is an NADPH-dependent flavoprotein hydroxylase localized to the outer mitochondrial membrane that catalyzes the conversion of L-kynurenine (KYN) to 3-hydroxykynurenine (3HK) and is localized primarily in microglial cells in the brain.5,6 In the periphery, cells of monocyte/macrophage lineage, as well as liver, lung, and kidney, express the highest KMO activity. In HD, KMO activity appears increased in HD mouse models as well as in postmortem human tissues. 6 The increase in 3HK levels in brain tissues suggests a potential contribution of KMO to disease pathogenesis. Inhibition of KMO enzymatic activity would lower the concentrations of the presumed endogenous toxins 3HK and quinolinic acid (QUIN). Indirectly, through an elevation of kynurenine, the metabolites kynurenic acid (KYNA) and anthranilic acid (AA) would be increased. KYNA elevation has been associated with neuroprotective effects in several neurodegenerative conditions. 7 Given the reported alterations in kynurenine metabolites in HD and functional data showing that KMO inhibition/genetic deletion can protect against mutant Htt-driven toxicity in flies, yeast, and mice, KMO has become a target to treat HD symptoms.6,8,9
We initiated a medicinal chemistry program to develop highly potent and selective inhibitors of KMO that are chemically and metabolically stable, as well as display adequate pharmacokinetic characteristics for use in the in vivo proof-of-concept studies with potential for clinical therapeutic development for HD. The optimization of mass spectroscopy techniques has facilitated both the mechanistic understanding of enzymatic reactions and the development of selective modulators of enzyme activity in a high-throughput manner. The direct measurement of product, substrate, or substrate intermediates, without labels or indirect measures of enzymatic activity, has enhanced our ability to eliminate false hits during screening campaigns.10,11 Here we report on biochemical and cell-based KMO-dependent assays to monitor KMO catalytic activity by relative quantification of the formation of hydroxylated product 3HK while monitoring the disappearance of unlabeled KYN by liquid chromatography/tandem mass spectrometry (LC/MS/MS). We also describe the accuracy, precision, and overall performance characteristics of these assays, which were used to identify a novel series of KMO inhibitors.
Materials and Methods
Isolation and Purification of the KMO Enzyme by Subcellular Fractionation of Liver Lysates
We purified KMO enzyme from liver lysates by subcellular fractionation. Livers were obtained as follows: Rattus norvegicus (Wistar rat, rKMO) and Mus musculus (C57 BL/6J mouse, mKMO) from internal colonies. Canis lupus familiaris (beagle dog, dKMO) and Macaca fascicularis (cynomolgus, cyKMO) samples were obtained from LPT (Hamburg, Germany). Homo sapiens (human, hKMO) and Macaca mulatta (rhesus macaque, rhKMO) samples were obtained from BioCat GmbH (Heidelberg, Germany). All liver samples had been snap-frozen at the time of collection. On the day of processing, livers were thawed on ice for 30 min and minced with scissors. All steps of enzyme purification were performed at ~4 °C. Samples were homogenized with a glass-glass homogenizer in preparation buffer (10 mL/g tissue, 20 mM HEPES [pH 7.3], 0.32 M sucrose, 10 mM KCl, and 1 mM EDTA, freshly prepared and kept in icy water). The homogenate was centrifuged at 1000 g (Sorvall, RC5C Plus, Thermo Scientific, Langenselbold, Germany), 4 °C for 5 min. The supernatant was collected and centrifuged at 17,000 g (Sorvall, RC5C Plus), 4 °C for 10 min. Pellets were resuspended in 15 mL preparation buffer (wash step) and centrifuged at 17,000 g. The above steps were repeated four times. The final pellet was resuspended in preparation buffer (2.5 mL/g original tissue wet weight). Total protein content was determined using the Bradford test and bovine serum albumin (BSA) as standard. Final protein concentration was adjusted to 1.5 mg/mL using preparation buffer. Aliquots were snap-frozen and stored at −80 °C for up to 3 months.
Molecular Biology, Antibodies and Cell Culture
Complementary DNAs (cDNAs) encoding human, rat, and mouse KMO were purchased from Origene (Rockville, MD). Coding sequences were cloned into a modified pFBneo-vector and cell lines stably expressing the respective orthologues established using Moloney murine leukemia viruses (MMLV) following the manufacturer’s instructions (Agilent Technologies, Waldbronn, Germany). pFBneo-vectors were co-transfected with helper plasmids using Lipofectamine 2000 (Invitrogen, Darmstadt, Germany) into HEK293 cells. After 2 days, viral particles were harvested from the supernatant, sterile filtered, and added to Chinese hamster ovary (CHO) cells for transduction. After 2 days of incubation at 37 °C and 5% CO2, neomycin/G418 was added (600 µg/mL) to growth medium consisting of Dulbecco’s modified Eagle’s medium (DMEM), 10% fetal bovine serum (FBS), and 4 mM glutamine. Clonal lines were obtained by limited dilution.
Immunostaining
Cells were fixed with formalin (4% paraformaldehyde [PFA], 4% sucrose, 1× phosphate-buffered saline [PBS]) for 15 min at room temperature. After blocking with PBS + 3% BSA and 5% goat serum for 1 h, cells were incubated with rabbit anti-KMO antibody 10698-1-AP (1:100 dilution; Proteintech Group, Chicago, IL) for 1 h at room temperature. Alexa Fluor 555 goat anti–rabbit IgG A21429 (1:1000 dilution; Life Technologies, Darmstadt, Germany) was used as a secondary antibody. Cells were imaged with the Opera High-Content Screening system (PerkinElmer, Hamburg, Germany).
Biochemical Assays
Biochemical KMO assays were performed in 384-well plates (Matrix Screen Mate; Thermo Fisher Scientific, Hudson, NH) in a final volume of 40 µL of 100 mM potassium phosphate (pH 7.4), 200 µM NADPH, 0.4 U/mL glucose 6-phosphate dehydrogenase, and 3 mM D-glucose 6-phosphate. The reaction mixture consisted of test compound, enzyme preparation, NADPH, and L-kynurenine sulfate (Sigma-Aldrich, Schnelldorf, Germany).
Eight concentrations of test compound, prepared from a 10-mM stock in 100% DMSO, were used. Dilutions (1:33.3, by volume) were made in assay buffer immediately before the incubations, and an aliquot (4 µL) of each was transferred into assay wells containing 24 µL of predispensed assay buffer. Test compounds were preincubated for 5 min at 25 °C after addition of 8 µL of enzyme preparation (0.1 mg protein/mL; specific activity of 1300 ± 250 nmol/[L·min·mg] rat and mouse liver lysate, 400 ± 175 nmol/[L·min·mg] human liver lysate). Reactions were started by addition of 4 µL of the 10-fold concentrated substrate solution. Final concentrations ranged from 3.0 to 0.0014 µM in 0.3% DMSO. Incubations were performed for 60 min at 25 °C and terminated with 40 µL of 10% trichloroacetic acid (TCA), vortexed, and centrifuged (5 min at 4000 rpm, 4 °C). Then, 25 µL supernatant was submitted to LC/MS/MS.
Enzyme activity kinetic constants KM and Vmax were calculated by fitting the data obtained from saturation experiments to the Michaelis-Menten equation. Incubation times and total protein concentrations were kept constant. Substrate concentration was varied between 0 and 500 µM KYN.
Each IC50 was determined in triplicate in at least two individual assay runs (n ≥ 2). Assay performance was monitored by calculating Z′ factors derived from the control wells.
Assays to determine the impact of plasma protein on the activity of test compounds were performed in the presence of 3 mg/mL species-specific plasma protein (Bioreclamation, Westbury, NY). Plasma protein predilutions were prepared in assay buffer using a 60-mg/mL total protein stock. Data were analyzed using GraphPad Prism (GraphPad Software, San Diego, CA).
Nature of the KMO Inhibitor-Enzyme Interaction
Reversibility
A rapid dilution experiment to monitor the reversibility of the interactions between compounds and KMO was used. Compounds were incubated at 10-fold the IC50 for 10 min, followed by a rapid 1:100 dilution. Here, kynurenine was added to the reaction. The reaction was monitored in a pseudo-kinetic mode where it was stopped at 0, 10, 20, 30, 40, 50, and 60 minutes. The percentage of turnover was plotted against incubation time for (a) a fully inhibited reaction (100-fold molar excess of inhibitor), (b) the rapid dilution, and (c) a completely noninhibited reaction. 12
Substrate Competitive Inhibition
A substrate titration experiment of steady-state velocity in the presence of varying inhibitor concentrations was used to determine substrate competitive inhibition. KM and Vmax were experimentally determined as above in the absence and presence of compounds at concentrations close to their IC50 (0, 0.5, 1.0, 1.5, and 2·IC50). Substrate was varied between 0 and 500 µM KYN. Data were analyzed using GraphPad Prism software applying the competitive inhibition model. Kinetic parameters were calculated according to the following equation: v = Vmax · [S]/([S] + KM · (1 + [I]/Ki)).
Selectivity Assays
The activity of Kynureninase (human recombinant hKYNU; R&D Systems, Minneapolis, MN) and Kynunerine aminotransferase (KAT, isolated from mouse kidney) were evaluated to assess compound selectivity. hKYNU assays were performed with 10 nM hKYNU at 37 °C in a 100-µL volume. Assay plates used were black, polystyrene 384-well plates (Matrix Screen Mates; Thermo Fisher Scientific). The buffer system used was 50 mM Tris-HCl (pH 8.0), 0.05% Brij-35, and 5 µM pyridoxal 5′-phosphate (PLP). Reactions were started by adding 3HK (100 µM). A kinetic readout monitoring fluorescence intensity increase caused by 3-hydroxyanthranilic acid (3HAA) formation on a Tecan Safire XFLUOR4 (version V 4.51; Tecan, Männedorf, Switzerland) at 37 °C was used. The following readout parameters were set: excitation wavelength, 315 nm; emission wavelength, 415 nm; excitation bandwidth, 7.5 nm; emission bandwidth, 7.5 nm; gain, 97; flashes, 3; integration time, 40 µs; Z-position, 7500 µm; number of kinetic cycles, 30; and kinetic interval, 88 s. Tecan Safire software (XFLUOR4, version V 4.51; Tecan) was used for sample acquisition and data analysis.
KAT assays were performed according to Rossi et al. 13 and Han et al. 14 at 37 °C in the presence of compounds in clear, polypropylene 384-well plates (Matrix Screen Mates; Thermo Fisher Scientific). Final volume was 40 µL and total protein concentration was 0.025 mg/mL in 150 mM Tris-acetate (pH 7.4), 1 mM 2-oxoglutarate, 70 µM PLP, and 5 mM β-mercaptoethanol. Reactions were initiated by addition of KYN (100 µM), incubated for 120 min, terminated by addition of 40 µL 10% TCA, vortexed, and centrifuged (5 min at 4000 rpm, 4 °C), and 25 µL of the supernatant was submitted to LC/MS/MS.
The IC50 values were determined from 8-point serial 3-fold dilutions performed as described above.
Cell-Based Assays in CHO Cells Expressing Exogenous Human, Rat, or Mouse KMO
KMO-expressing CHO-K1 cells were maintained in DMEM culture medium in T75 flasks for up to 25 passages. The 96-well assay plates (CellStar; Greiner, Frickenhausen, Germany) were prepared by seeding 20,000 cells/well in 100 µL growth medium. After culturing overnight, the medium was exchanged with OptiMem (Invitrogen, Life Technologies Corporation). Serial dilutions of test compounds were added in 0.15% DMSO (v/v) and preincubated for 30 min at 37 °C, 5% CO2. The assay was started by addition of 100 µM KYN. After a 20-h incubation, 100 µL of the supernatant was transferred to a 96-well readout plate containing 100 µL of 10% TCA (v/v) solution. Following centrifugation for 5 min at 4000 rpm, plates were stored at 4 °C until analysis. An aliquot (25 µL) of each supernatant was submitted to LC/MS/MS analysis.
Primary Rat Microglia Assay
Wistar rat E17 embryos were used to prepare mixed glial cultures, essentially as described in Théry et al. 15 and Dobbertin et al. 16 The microglia were “shaken off” on a horizontal shaker at 130 rpm for 2 to 3 h while astrocytes remained adherent. The medium containing microglia was collected in 50-mL Falcon (BD Biosciences, Heidelberg, Germany) tubes and centrifuged for 10 min at 750 rpm. Microglia pellets were resuspended in 3 mL of medium and pooled. After counting, primary microglia were seeded in coated 96-well plates with 8000 cells and 140 µL per well.
The next day, microglial cultures were stimulated with 100 ng/mL lipopolysaccharide (LPS). Compounds were added to the cells 24 h poststimulation. Incubation times, sampling, and LC/MS/MS and data analysis was identical to above-described methods.
Human Peripheral Blood Mononuclear Cells (hPBMCs) Cell-Based Assay
Human peripheral blood mononuclear cells (hPBMCs) (Cellular Technology Limited [CTL], Cleveland, OH) were thawed according to the supplier’s instructions in 1 × CTL-AntiAggregate Wash Solution and seeded in serum-free CTL-Test Medium supplemented with 2 mM L-glutamine and penicillin/streptomycin. After 7 to 8 h, a total of 2E+05 PBMCs per well in 70 µL medium were seeded into 96-well black µClear plates (Greiner). After overnight incubation, hPBMCs were stimulated by addition of 10 µL phorbol 12-myristate 13-acetate (PMA) solution in serum-free CTL-Test Medium (Sigma-Aldrich) at a concentration of 50 nM. Compounds were diluted in CTL-Test Medium and added 8 h after stimulation. Preincubation with compounds, reaction initiation, and sample processing were identical to those described for CHO cells. Conditions of LC/MS/MS and data analysis were identical to above-described methods.
Detection by LC/MS/MS Analysis
The LC/MS/MS system used for the KMO and KAT inhibition assays consisted of a Waters Acquity UPLC (Waters Corporation, Milford, MA) equipped with an Acquity Sample Organizer, Acquity Binary Solvent Manager, Acquity PDA Detector, and Acquity Sample Manager with a 5-µL sample loop. This LC system was interfaced with a Waters TQD triple quad mass spectrometer equipped with an electrospray ion source operating in the positive mode. Source parameters were set as follows: polarity, ES+; capillary, 4 kV; cone voltage, 18 V; collision energy, 9 V; cone gas flow, 50 L/h; collision gas flow, 0.2 mL/min; source temperature, 150 °C; desolvation temperature, 500 °C; and desolvation gas flow, 1200 L/h.
MassLynx software (Waters, version 4.1) was used to control sample acquisition and data analysis. The mass spectrometer was tuned and calibrated according to the manufacturer’s recommendations.
For KMO, matrix components, KYN, and 3HK were separated using an Acquity UPLC BEH C18 column (1.7 µm; 2.1 × 50 mm, Waters) connected to a filter guard. Flow rate was 1 mL/min and column temperature was 40 °C. Mobile phase
For KAT, matrix components, KYN, and KYNA were separated using an Acquity UHPLC BEH C18 column (1.7 µm; 2.1 × 50 mm, Waters) connected to a filter guard. Flow rate for analysis was 1 mL/min at a column temperature of 40 °C. Mobile phases:
Results
Development of a Sensitive and Specific LC/MS/MS Method to Monitor the Conversion of KYN to 3HK
We developed a high-throughput, sensitive, and specific ultra-high-performance liquid chromatography (uHPLC)/MS/MS method to monitor the percentage conversion of KYN to 3HK (
Biochemical Assays
A representative example of KMO activity in human liver lysates is shown in Figure 1 . Total protein and incubation time-dependent product formation was observed ( Fig. 1A ). A decrease in KYN was monitored in parallel to 3HK formation to verify that substrate was not turned over by other enzymes present in the lysates ( Fig. 1B ). Product stability was monitored over 90 min at 2.5 and 10 µM 3HK in the presence of 0.15, 0.3, or 0.45 mg total protein/mL. No product depletion was detected during this time interval. The velocity versus total protein concentration plot ( Fig. 1C ) indicates a protein concentration-dependent increase in velocity for ≥0.3 mg/mL total protein. At lower protein concentrations, the reaction velocity might be affected by reduced protein stability and thus shows nonlinear behavior.
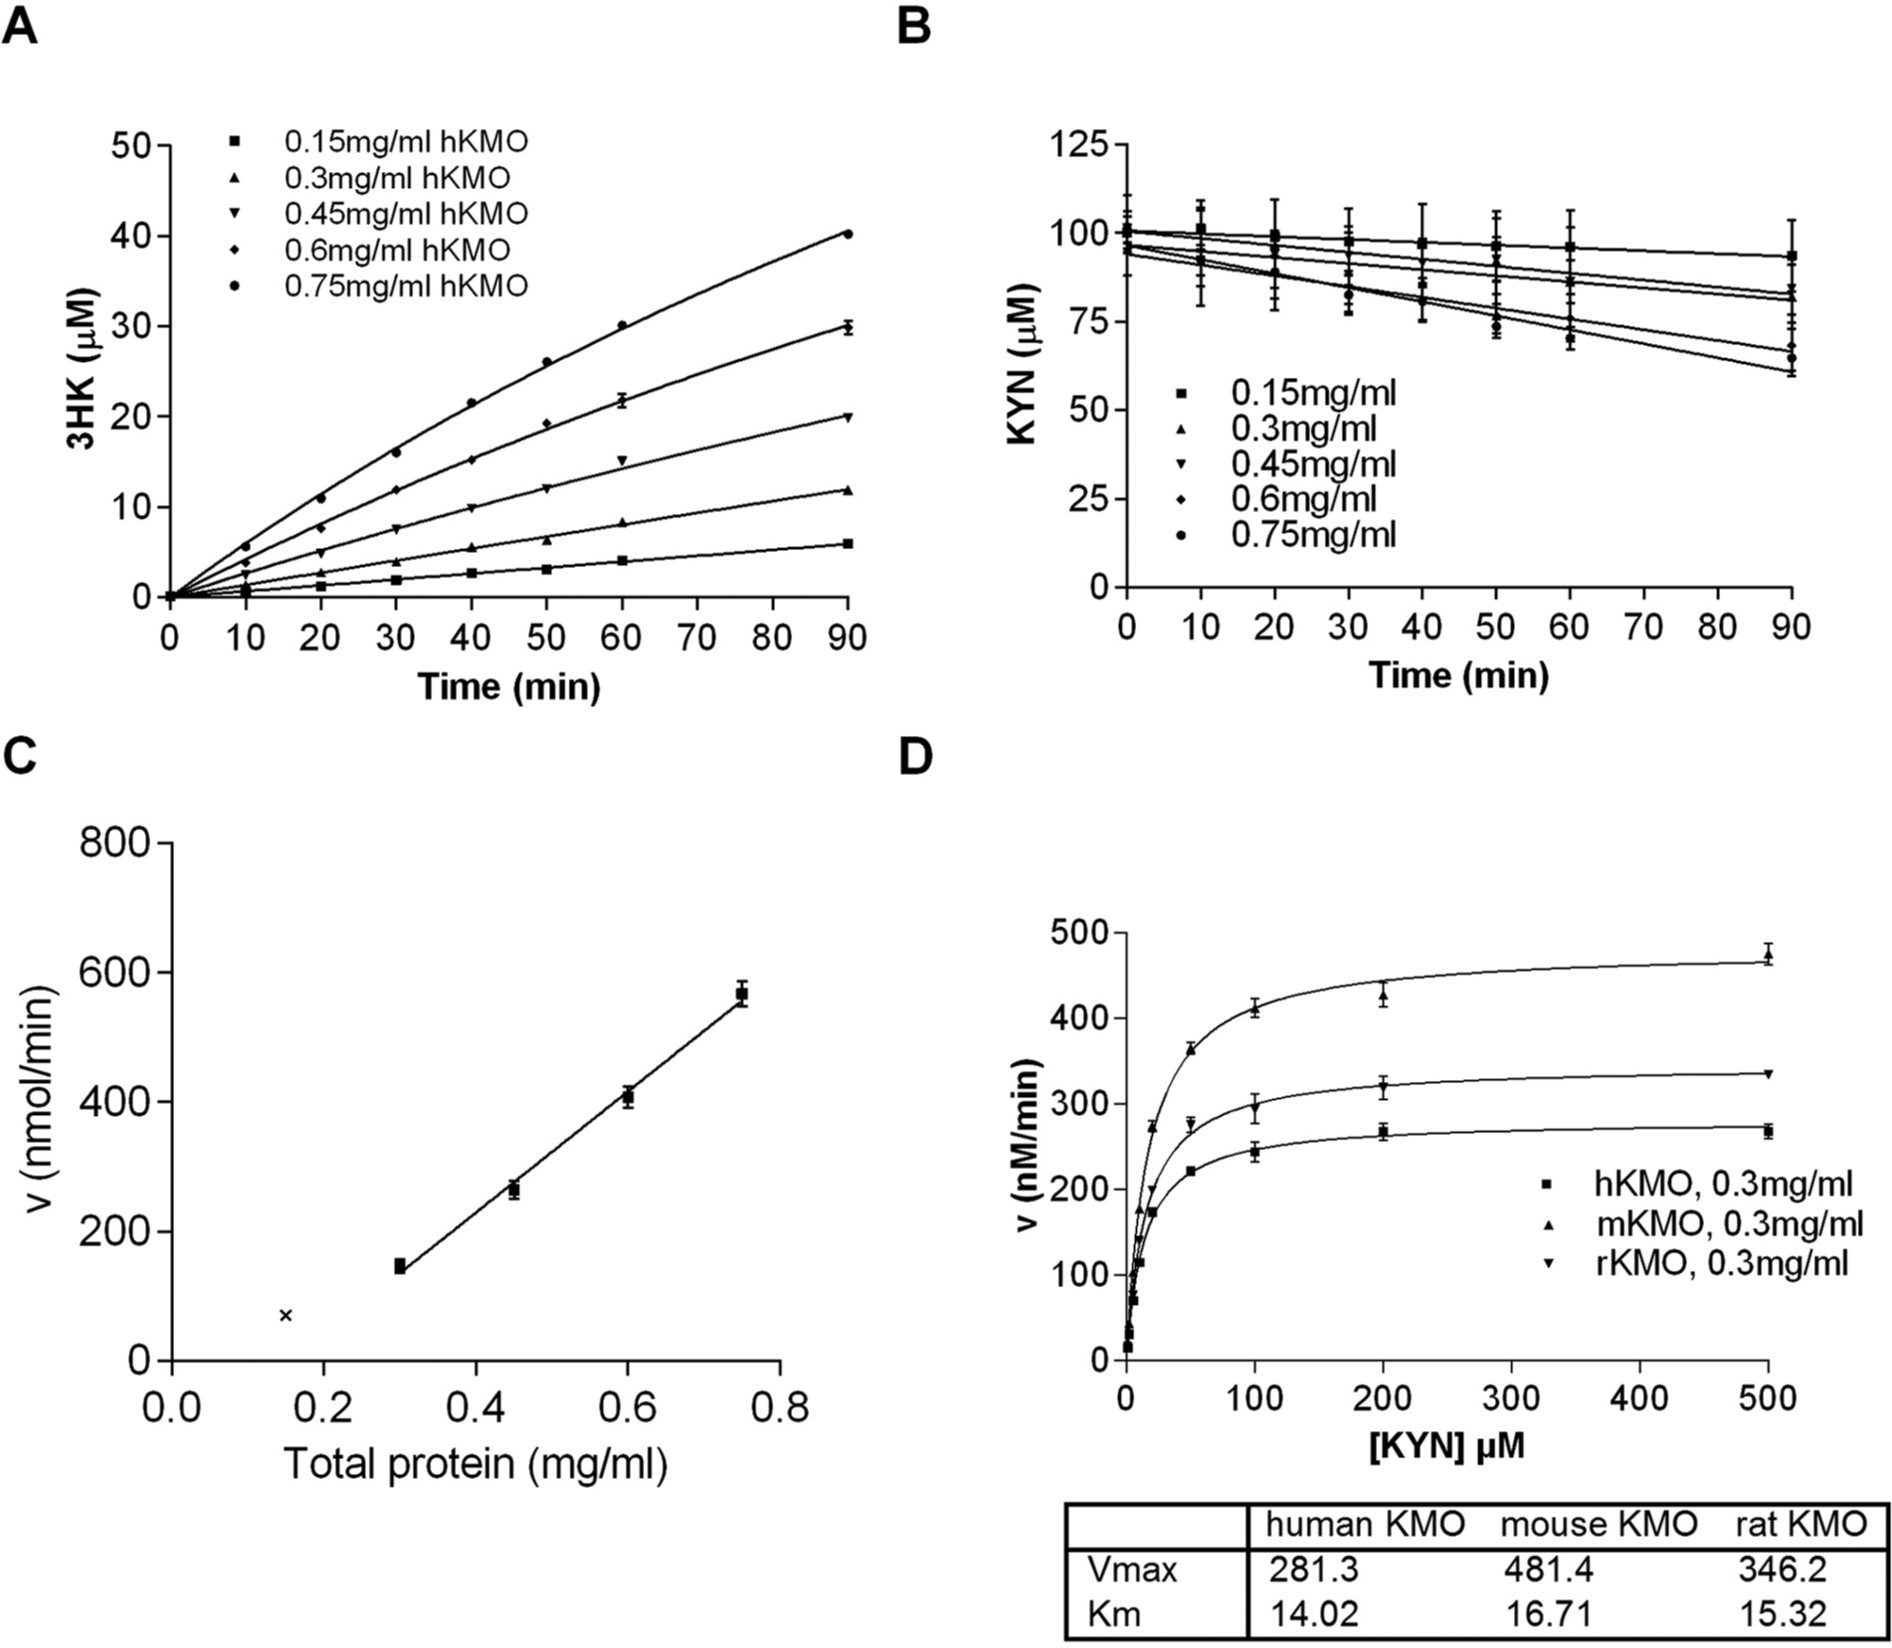
Lysate-based measurements of kynurenine monooxygenase (KMO) activity and 3-hydroxykynurenine (3HK) production using liver extracts by liquid chromatography/tandem mass spectrometry. (
The KM and Vmax for KYN for all species and tissue extracts were determined. For human liver KMO, the KYN KM was 14.0 µM ( Fig. 1D ), in good agreement with a previous report. 17 The KM values for KMO orthologues were consistent with available reports ( Fig. 1 and Table 1 ). We selected a KYN concentration of 20 µM for all liver extract–based assays (biochemical assays) to be close to the KM.
Kinetic Parameters Determined for L-kynurenine in Biochemical Kynurenine Monooxygenase Assays for Different Species.
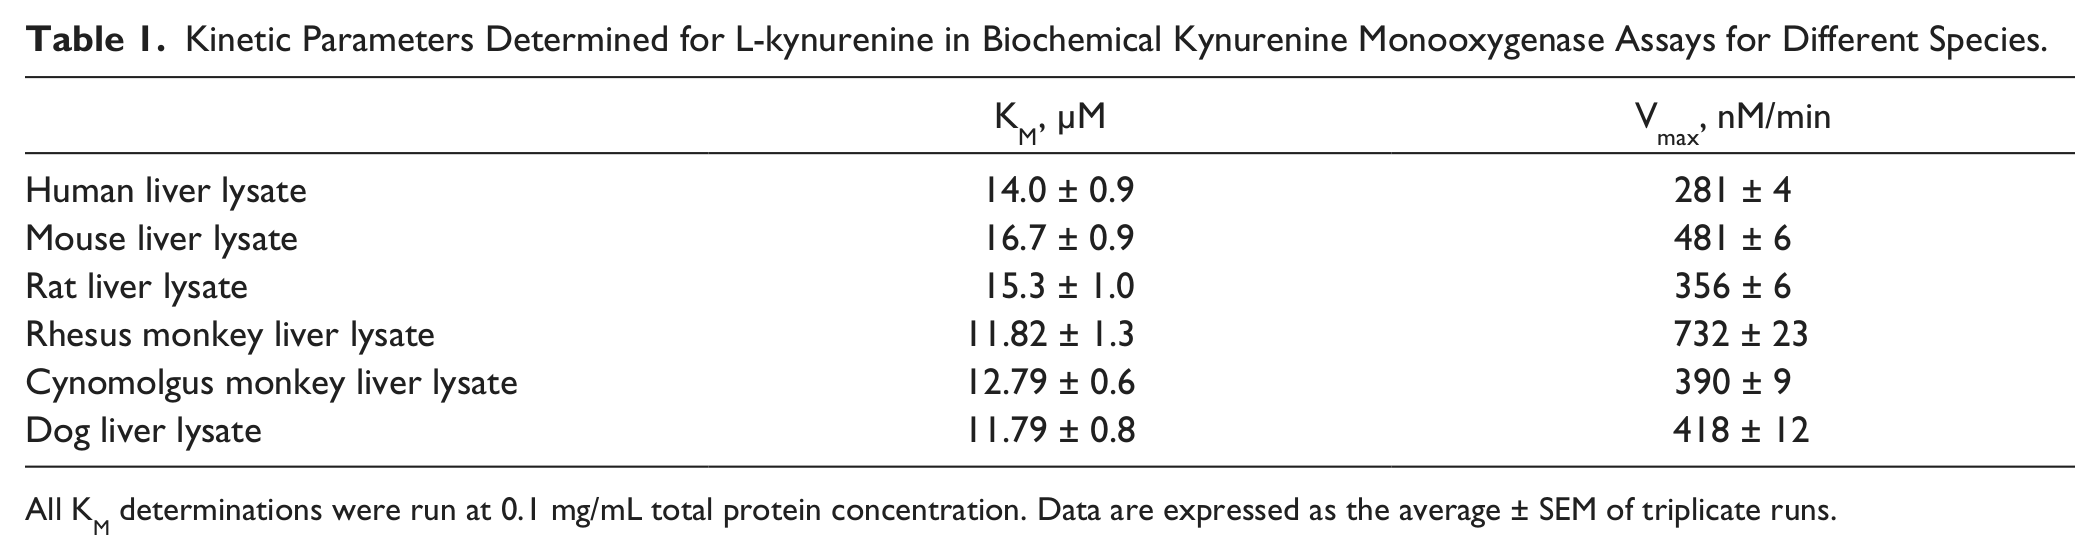
All KM determinations were run at 0.1 mg/mL total protein concentration. Data are expressed as the average ± SEM of triplicate runs.
Three well-characterized KMO inhibitors (Ro-61-8048, 18 UPF 648, 19 and a des-amino analogue of the less potent inhibitor FCE-28833 20 ) derived from different chemical classes with potencies ranging from 0.4 to 40 nM were selected as a test set. Determined compound potencies were in agreement with published results ( Fig. 2 and Table 2 ).
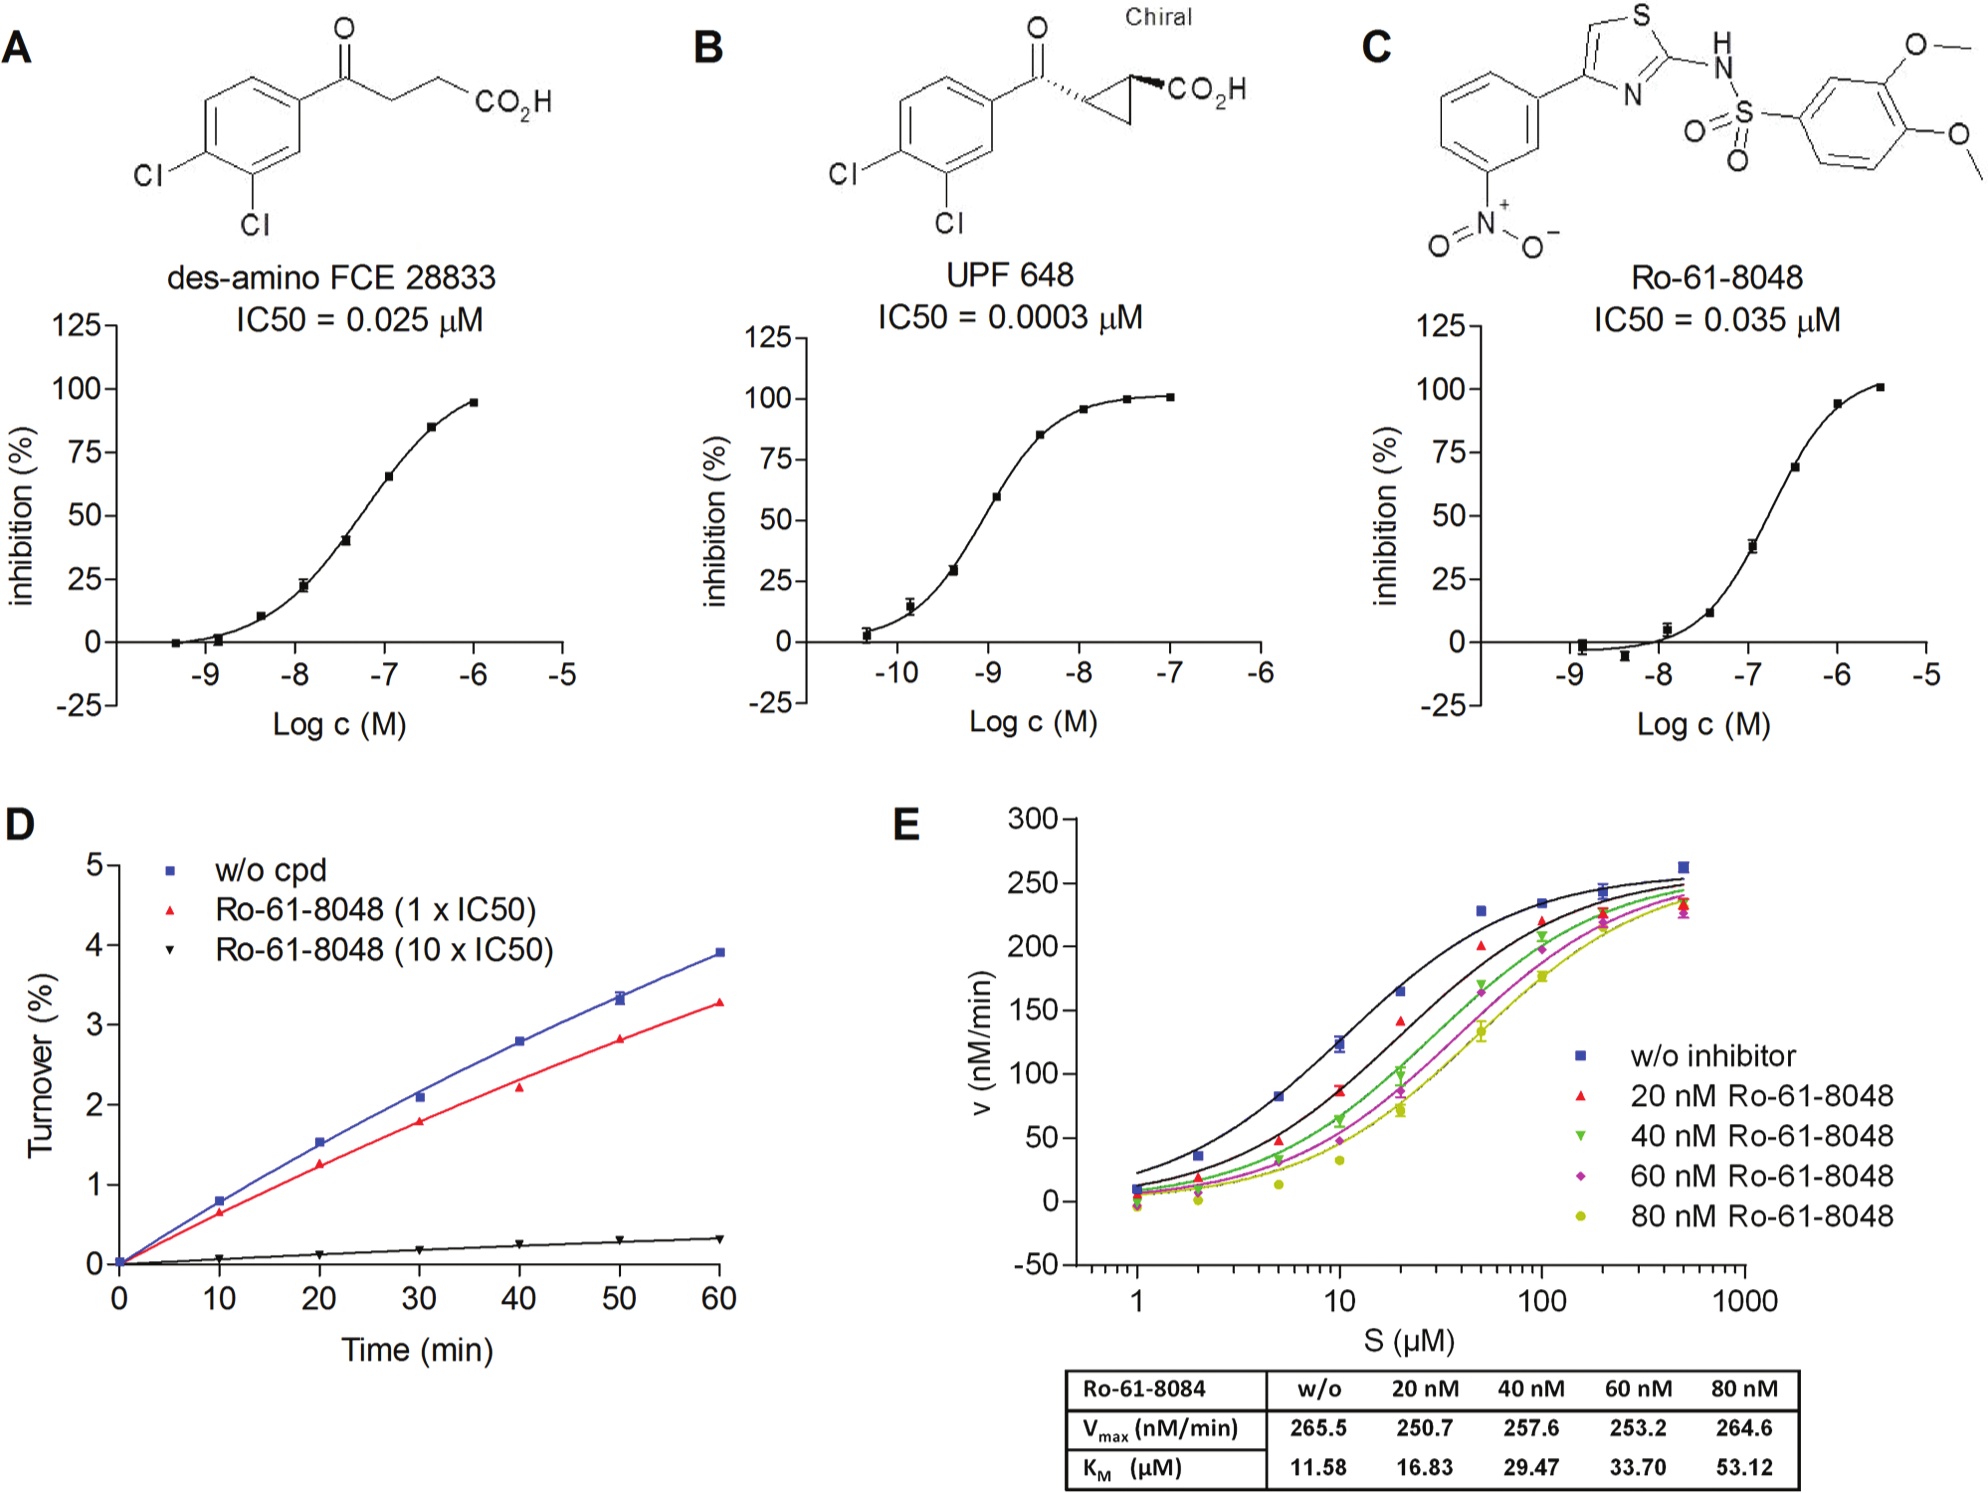
Characterization of lysate-based assays to measure kynurenine monooxygenase (KMO) activity. (
Comparison of IC50 Data for Reference Inhibitors Tested in Biochemical and Cellular KMO Assays for Different Species and Cell Types, Including Primary Cells (hPBMCs and Rat Microglia) and the ATPLite Cytotoxicity Assay Run with the hKMO-Expressing CHO Cell Line.
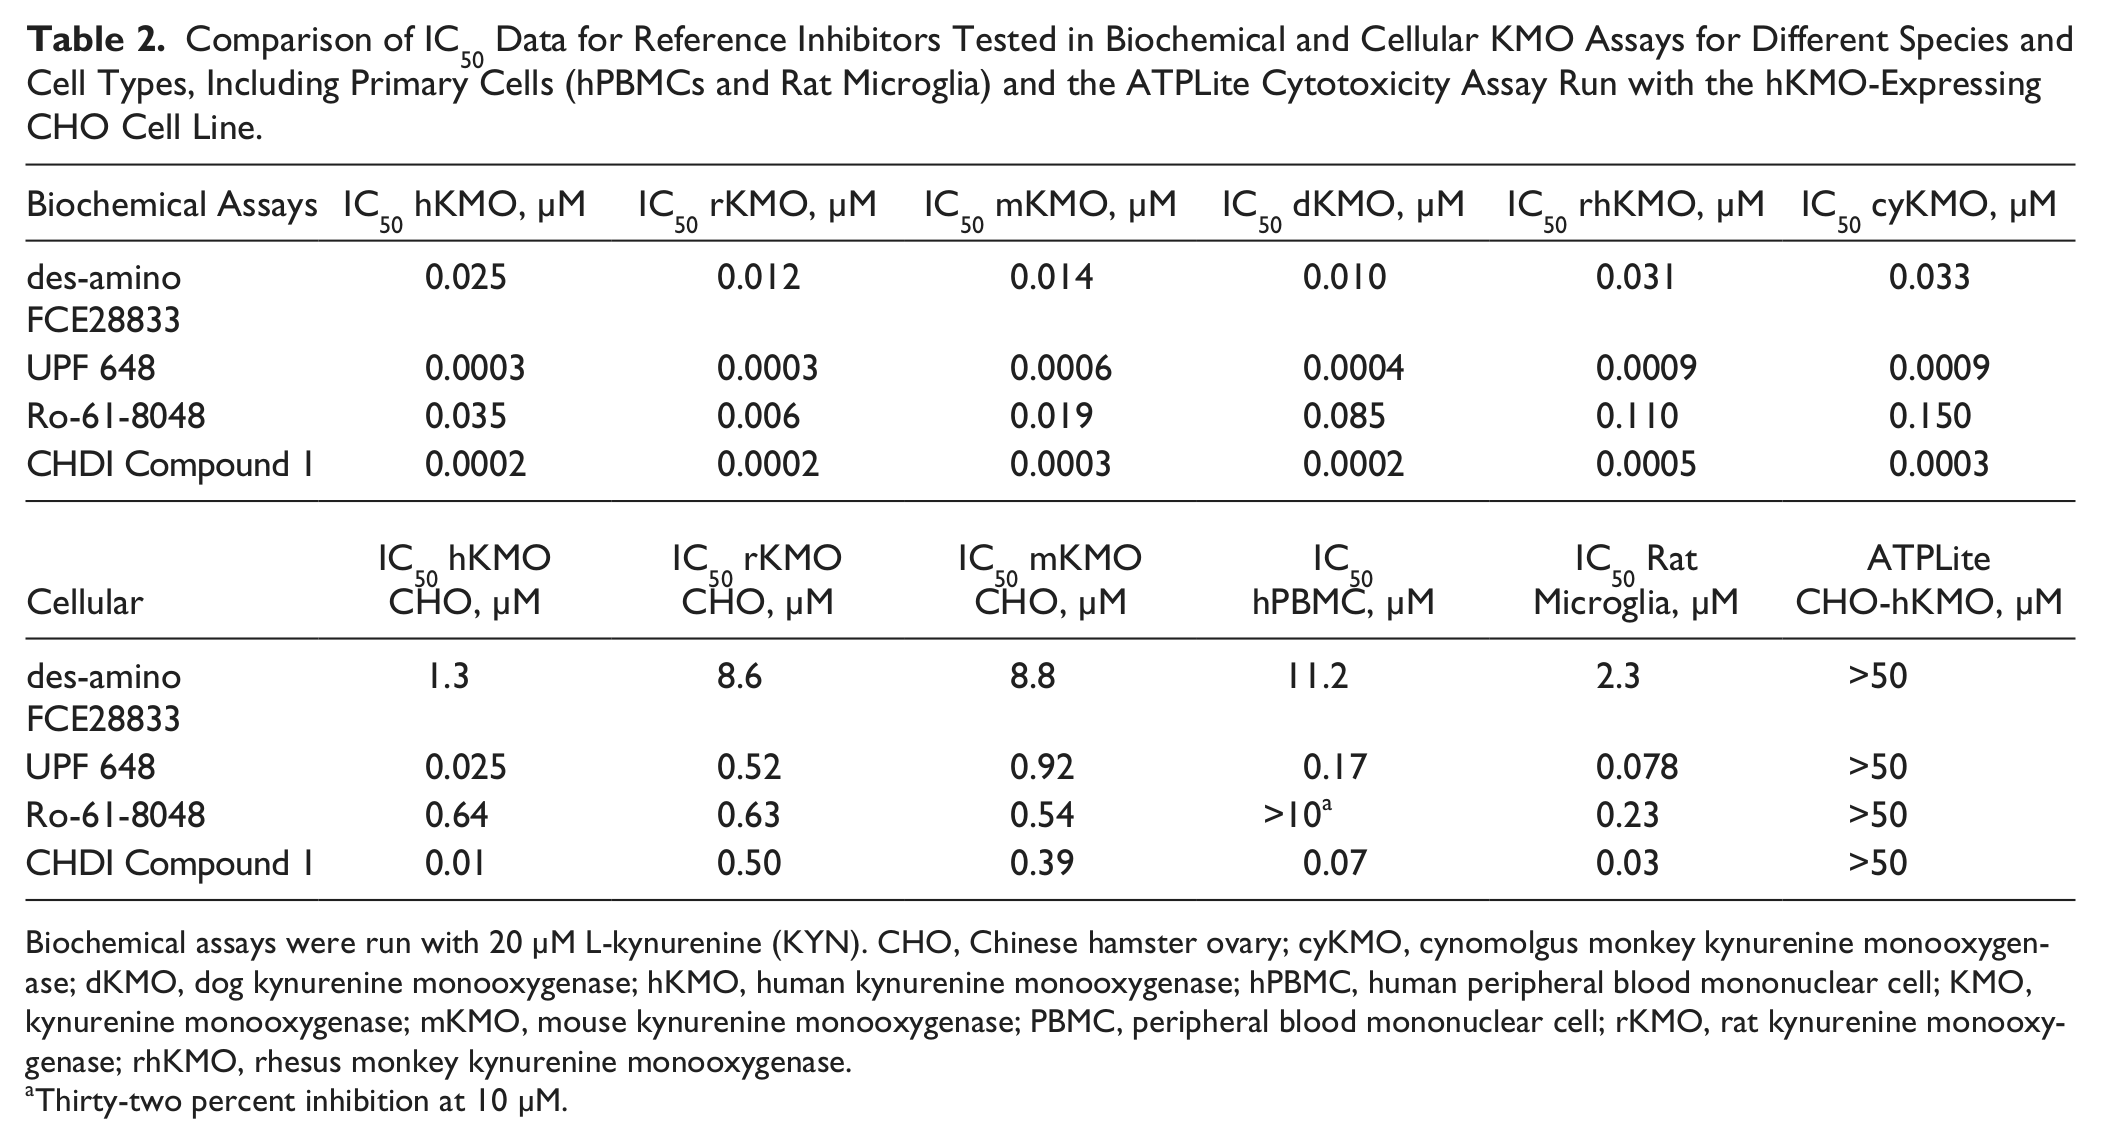
Biochemical assays were run with 20 µM L-kynurenine (KYN). CHO, Chinese hamster ovary; cyKMO, cynomolgus monkey kynurenine monooxygenase; dKMO, dog kynurenine monooxygenase; hKMO, human kynurenine monooxygenase; hPBMC, human peripheral blood mononuclear cell; KMO, kynurenine monooxygenase; mKMO, mouse kynurenine monooxygenase; PBMC, peripheral blood mononuclear cell; rKMO, rat kynurenine monooxygenase; rhKMO, rhesus monkey kynurenine monooxygenase.
Thirty-two percent inhibition at 10 µM.
As a primary criterion for acceptance of results, Z′ values and responses of standard inhibitors were recorded. Representative results are summarized in
Nature of the KMO Inhibitor-Enzyme Interaction
Using a rapid-dilution method where enzyme activity recovers with fast-binding reversible inhibitors while irreversible inhibition or molecules with slow koff leads to enzyme inhibition even after the rapid dilution step, we showed that Ro-61-8048 and UPF 648 inhibited KMO in a rapid and reversible manner ( Fig. 2D for Ro-61-8048), consistent with previous work. 18
We also tested for substrate competitive inhibition using a substrate titration experiment of steady-state velocity in the presence of varying inhibitor concentrations.
21
While the Vmax value remained constant with increasing compound concentrations, the KM increased considerably (
Fig. 2E
for Ro-61-8048), suggestive of a substrate competitive inhibition mode. To determine the potential for plasma protein binding and to identify molecules that might display poor distribution or potency when administered to animals, we performed biochemical assays in the presence of plasma proteins (plasma-shift). The change in potency was used to rank order compounds prone to interactions with plasma proteins. As an example, tool compounds UPF 648 and Ro-61-8048 (
Fig. 3A
,
B
and
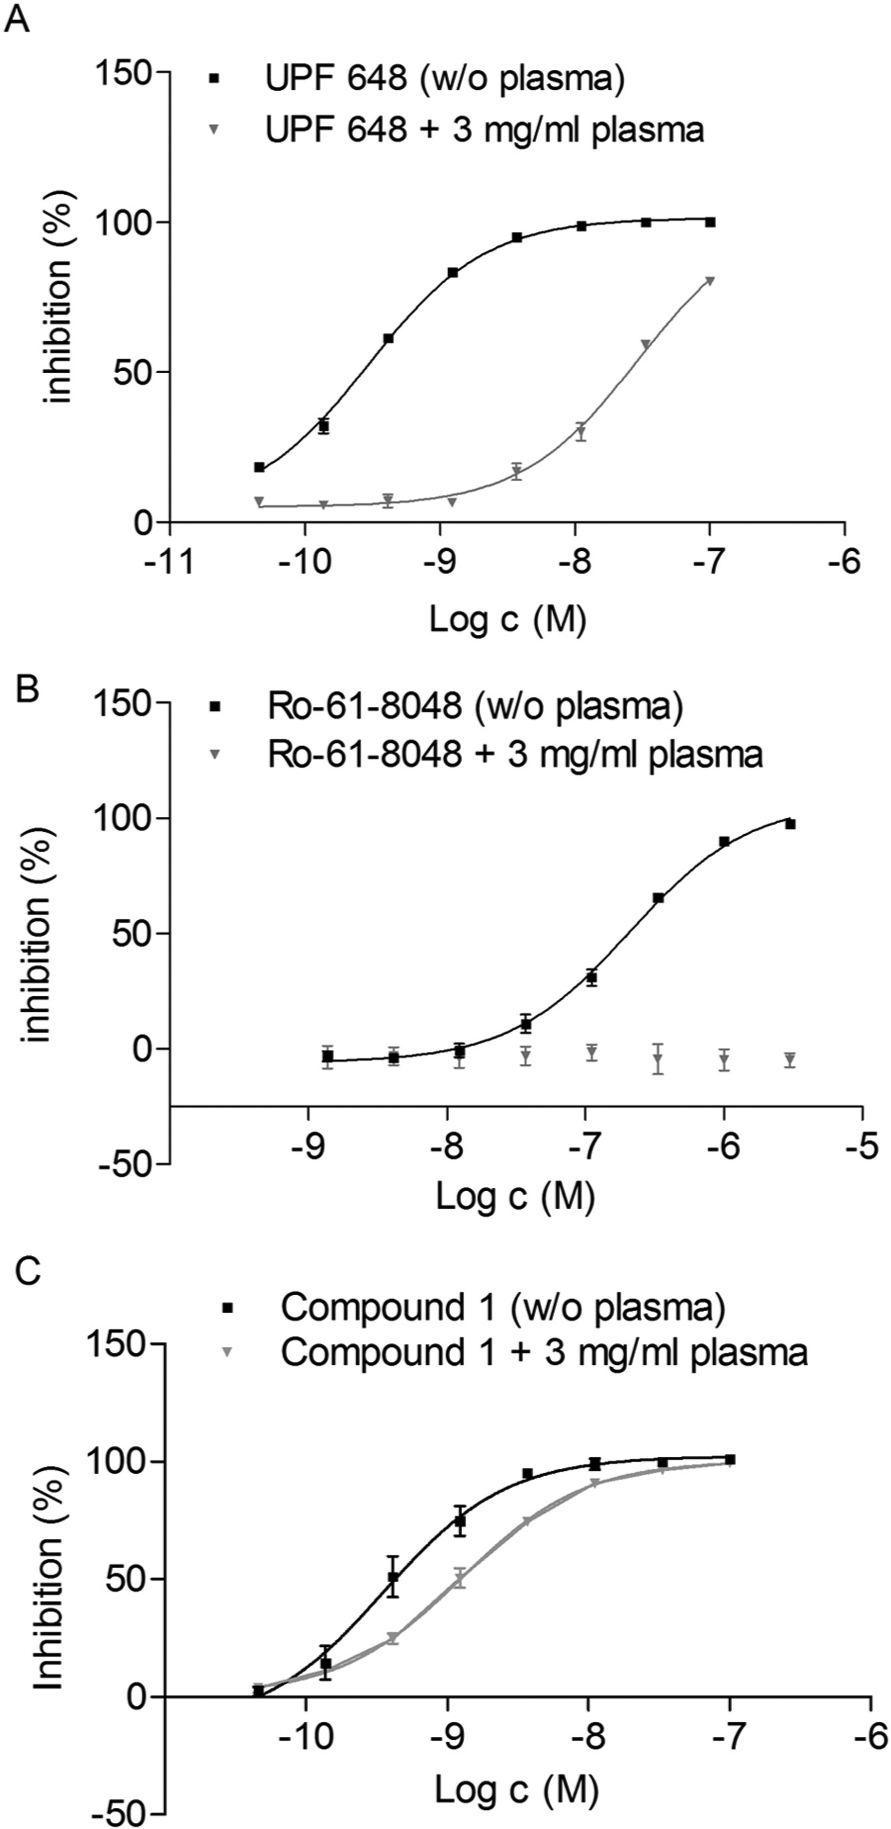
Evaluation of the effects of human plasma on the potency of the kynurenine monooxygenase (KMO) inhibitors. (
Selectivity assays were established with other kynurenine-consuming enzymes (KAT and KYNU) using protocols adapted from literature.13,14 KAT converts KYN to KYNA, and KYNU converts both KYN and 3HK to AA and 3HAA, respectively. The test compounds specifically inhibited KMO, as shown in
Development of KMO Cellular Assays
Previously described cellular KMO activity assays used complex and indirect measures to infer KMO activity.22,23 Therefore, we adapted the LC/MS/MS method to monitor 3HK production in various cell types, using CHO cells expressing exogenous KMO or primary cells expressing endogenous KMO (rat microglia and human peripheral blood cells). We generated CHO-K1 cell lines stably expressing various KMO orthologues (rat, mouse, and human). KMO expression was confirmed by Western blot and immunofluorescence staining using a KMO-specific antibody. We also confirmed the mitochondrial localization of exogenously expressed KMO proteins in the transfected cells (
To eliminate the possibility of a decreased KYN to 3HK conversion as a consequence of toxicity of a test compound, we included an ATPLite assay (PerkinElmer) as a cytotoxicity readout. The tested compounds did not show any appreciable effects in this assay ( Table 2 ). To monitor KMO inhibition in physiologically relevant cellular systems, we adapted these assays to rodent and human primary cells, including rat microglia and human PBMCs. 5
A highly pure microglia preparation was obtained from mixed glial cultures. KMO expression was confirmed by immunofluorescence staining in the absence and presence of LPS (
We used hPBMCs to measure endogenous hKMO activity. In untreated cells from multiple donors, we detected basal KMO activity, as judged by the production of 3HK after exogenous kynurenine administration (
Fig. 4A
). The generation of 3HK was significantly increased by stimulation with PMA in a concentration- and time-dependent manner (
Fig. 4B
).25,26 Other stimuli
27
were explored but did not result in any enhancement of 3HK production (
Fig. 4A
). The generation of 3HK by PMA in hPBMCs can be suppressed by UPF 648, a selective KMO inhibitor (
Fig. 4B
). hPBMCs exposed to PMA expressed significantly higher levels of human KMO, as assessed by immunofluorescence, consistent with activity measurements (
Fig. 4C
,
D
). We optimized the hPBMC assay for the following parameters: cell number, preincubation times with PMA (50 nM), incubation time with compounds, and substrate concentration (not shown). The test set was characterized to demonstrate assay suitability to support a medicinal chemistry program.
Table 2
summarizes compound potencies determined in all cellular assays. While des-amino FCE28833 and UPF 648 were active in the sub-micromolar range in all cellular KMO assays, Ro-61-8048 showed significantly lower IC50 values in the hPBMC assay. That finding was corroborated by testing other structurally related analogues of Ro-61-8048 (not shown). The loss in potency of Ro-61-8048 in the hPBMC assay correlates well with the shift in potency in the human biochemical assays in the presence of plasma (
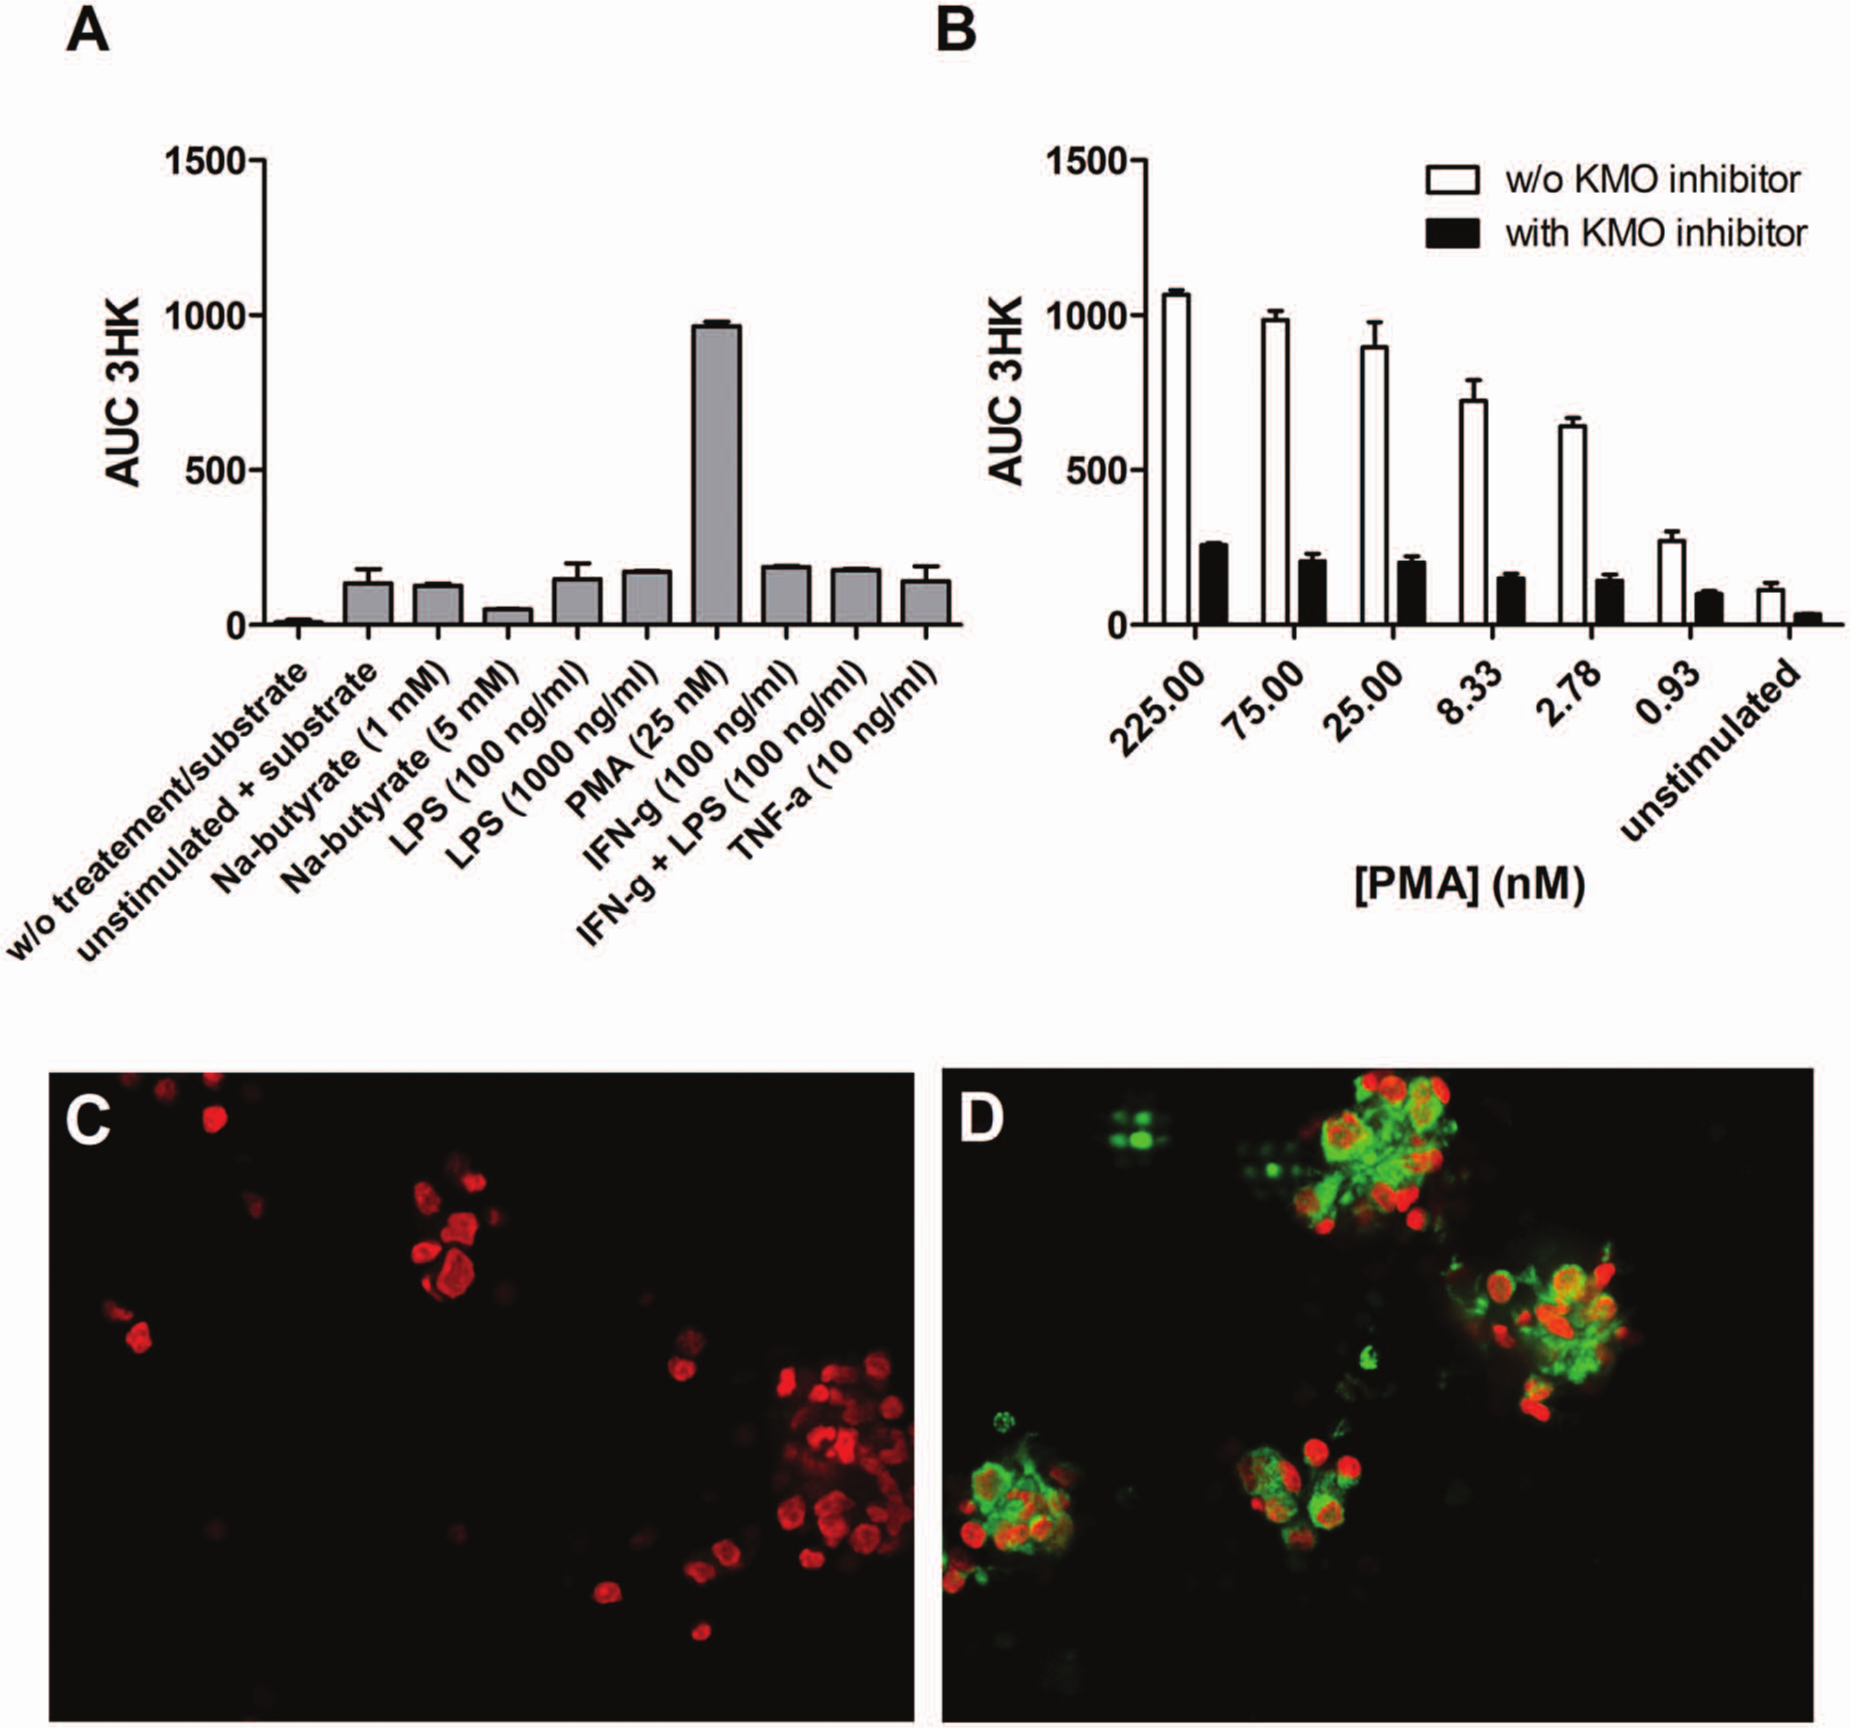
Development of a cell-based assay to measure kynurenine monooxygenase (KMO) activity using primary human peripheral blood mononuclear cell (PBMCs). (
Discussion
The modulation of the tryptophan catabolic pathway and KMO represents an increasing area of interest for central nervous system disorders and for HD. Previously described assays to measure KMO activity used unspecific methods to monitor the conversion of KYN to 3HK, such as the radiometric detection of tritiated water released during hydroxylation of [3,5-3H]kynurenine. 18 This method has disadvantages inherent to working with radiolabeled material and the possibility of evaporation of tritiated water, which might affect the recovery and assay results. Other methods use UV detection of 3HK (absorption at 365 nm) or electrochemical detection after chromatographic separation. 28 These methods are lengthy (approximately 15 min for each sample injection vs 90 seconds by the LC/MS/MS assay) and not specific. For instance, the presence of compounds including 3HK analogues with similar physicochemical characteristics can confound assay results. Other readouts based on NADPH consumption are also not specific and subject to artifacts due to contaminating NADPH-consuming enzymes (i.e., other mitochondrial mono-oxygenases) typically present in crude preparations or by spontaneous NADPH oxidation.16,29
For this reason, we established the MS readout to directly quantify the relative formation of 3-hydroxylated product (3HK) while monitoring the conversion of KYN (unlabeled and underivatized). The throughput achieved in a 384-well plate format allows for the analysis of about 1000 data points per day, enabling medicinal chemistry programs. Another advantage of this method is the simultaneous monitoring of both substrate and product. While we focused on product detection for data analysis, substrate concentration was recorded, providing additional information during compound profiling (e.g., substrate stability, substrate consumption by contaminating enzymes, pipetting errors). Because KMO is a membrane-associated mitochondrial protein, we used enriched mitochondrial fractions to preserve the native conformation. When comparing the KM values of KYN on the KMO enzyme obtained in tissue extracts with published findings, we found them to be in good agreement. Furthermore, KM values for KYN using liver lysates from several species were similar, which allows us to perform all assays under the same conditions (at 20 µM KYN). Since the KMO inhibitors interact with the enzyme in a rapid and reversible manner, this approach also facilitates a direct comparison of different assay results.
We next evaluated the ability to detect KMO activity from intact cells using the above method. Previously described assays relied on indirect readouts measuring quinolinic acid (QUIN) release after interferon (IFN)-γ stimulation in monocytic cell lines such as THP-1 or U937 22 and in monocyte-derived macrophages (MDMs). 23 Here, KMO inhibition decreases QUIN accumulation in IFN-γ–stimulated cells. These assays might be subject to false-positive results due to compounds modulating other pathway enzymes. To circumvent this issue, we optimized the LC/MS/MS methods for cell assays including primary cultures by taking advantage of factors previously reported to increase KMO expression. 30
In summary, we have demonstrated that the use of MS-MRM as a detection method with crude enzyme preparations and cells is suitable for monitoring KMO activity. In addition, we determined the potency of KMO inhibitors using lysates from several species of relevance to drug discovery, including rodents, dogs, nonhuman primates, and humans. The KM determination for KMO orthologous in several of these species has not been reported previously.
The use of MS-MRM detection to quantify the conversion of KYN to 3HK as a relative measurement of KMO activity allows a more accurate and efficient screening of this class of enzymes in multiple assay formats and therefore is suitable to support a medicinal chemistry program. This screening cascade allows for a full characterization of up to 50 putative KMO inhibitors within 2 weeks. The results of our medicinal chemistry program using the methods described in this article will be reported elsewhere.
Footnotes
Acknowledgements
The authors thank Janet M. Leeds and Eric Schaeffer for their contributions to this work, and Simon Noble for comments on the manuscript.
Declaration of Conflicting Interests
Evotec conducted the research described through a fee-for-service agreement for CHDI Foundation. As employees of CHDI Management and advisors to CHDI Foundation, MB, LT-S, CD, and IM-S were all intimately involved in the study design, data collection and analysis, decision to publish, and preparation of the manuscript.
Funding
This work was funded and conducted through fee-for-service contract research on behalf of CHDI Foundation, a privately funded nonprofit biomedical research organization exclusively dedicated to developing therapeutics that slow the progression of Huntington’s disease.
References
Supplementary Material
Please find the following supplemental material available below.
For Open Access articles published under a Creative Commons License, all supplemental material carries the same license as the article it is associated with.
For non-Open Access articles published, all supplemental material carries a non-exclusive license, and permission requests for re-use of supplemental material or any part of supplemental material shall be sent directly to the copyright owner as specified in the copyright notice associated with the article.