
Abstract
CD73/Ecto-5′-nucleotidase is a membrane-tethered ecto-enzyme that works in tandem with CD39 to convert extracellular adenosine triphosphate (ATP) into adenosine. CD73 is highly expressed on various types of cancer cells and on infiltrating suppressive immune cells, leading to an elevated concentration of adenosine in the tumor microenvironment, which elicits a strong immunosuppressive effect. In preclinical studies, targeting CD73 with anti-CD73 antibody results in favorable antitumor effects. Despite initial studies using antibodies, inhibition of CD73 catalytic activity using small-molecule inhibitors may be more effective in lowering extracellular adenosine due to better tumor penetration and distribution. To screen small-molecule libraries, we explored multiple approaches, including colorimetric and fluorescent biochemical assays, and due to some limitations with these assays, we developed a mass spectrometry (MS)-based assay. Only the MS-based assay offers the sensitivity and dynamic range required for screening small-molecule libraries at a substrate concentration close to the Km value of substrate and for evaluating the mode of binding of screening hits. To achieve a throughput suitable for high-throughput screening (HTS), we developed a RapidFire–tandem mass spectrometry (RF-MS/MS)-based multiplex assay. This assay allowed a large diverse compound library to be screened at a speed of 1536 reactions per 40–50 min.
Introduction
Multiple immunosuppressive mechanisms impede antitumor immunity. Among them, the accumulation of extracellular adenosine is a potent and widespread strategy exploited by tumors to escape immunosurveillance through production of adenosine via CD39 and CD73 and activation of purinergic receptors.1–6 The therapeutic potential of blocking CD73-dependent adenosine-mediated immunosuppression to reinstate antitumor immunity is being actively explored.7–15 In fact, an antibody directed against CD73 (MEDI9447) recently entered the clinic, targeting solid tumors (Hay et al. 2016/NCT02503774). CD73 catalyzes conversion of adenosine monophosphate (AMP) to adenosine (ADO) and free phosphate. This reaction is a rate-limiting step in the ADO pathway; therefore, CD73 is considered a potential drug target. Although targeting this enzyme using antibody-based antagonists is being actively explored by several pharmaceutical companies and academic groups, using small molecules to inhibit its catalytic activity is gaining interest from the drug discovery community because of the potential for better tissue penetration, better oral bioavailability, easier control of treatment dosage, and lower cost of developing small-molecule drugs.
To facilitate the study of CD73 enzymatic activity, a few CD73 biochemical assays have been reported and used for characterizing CD73, and applied toward the identification of CD73 inhibitors. These assays include a capillary electrophoresis–based 16 or high-performance liquid chromatography (HPLC)-based 17 (which quantifies substrate AMP and product ADO), radiometric assay that quantifies [³H]adenosine converted from [³H]adenosine-5′-monophosphate (AMP) by CD73, 18 a luciferase-based assay that quantifies the reduction of CD73 substrate AMP, 19 and a malachite green–based colorimetric assay that quantifies free phosphate. 20 Among these assays, the capillary electrophoresis and HPLC assays are not readily suitable for high-throughput screening (HTS) due to their low throughput. The malachite green assay requires high substrate concentration (75 µM) and is highly sensitive to the phosphate-containing buffers common in medium and other sample preparations used in screening. In addition, the malachite green assay requires quenching with acid that is not compatible with sensitive HTS equipment. Although the radiometric assay is about 30-fold more sensitive than the malachite green assay, its assay throughput is low, and it involves handling of radioactive material 3H. 18 The luciferase-based assay makes use of the Promega CellTiter-Glo (CTG) kit, which measures ATP levels through the luciferase-linked emission of light accompanying catabolism of ATP to AMP and free diphosphate. The luciferase reaction of the CTG kit is inhibited by AMP and therefore yields little or no light in the presence of AMP. Addition of soluble recombinant CD73 to a mixture of ATP and AMP in the appropriate buffer results in the conversion of AMP and relief of AMP-mediated inhibition of the CTG reaction. The resultant increase in ATP detection (detected as light in the CTG assay) is directly proportional to CD73 enzyme activity. Although the luciferase-based assay can be conducted at high throughput, it requires the CD73 reaction to be conducted at 37 °C and needs high substrate concentration (300 µM) to ensure assay sensitivity and robustness. 19 To balance the opportunities to identify inhibitors of all modalities that may be present in a compound library, an assay that can be applied at a substrate concentration close to its Km value is desirable. 21 Besides the luciferase assay ( Fig. 1A ) and malachite green assay ( Fig. 1B ) described above, we also evaluated two new transcreener assay formats. One monitors the reduction of AMP using a transcreener AMP system 22 ( Fig. 1C ), and the other quantifies ADO using a transcreener adenosine diphosphate (ADP) system 23 coupled to an adenosine kinase reaction and with the fluorescence polarization readout ( Fig. 1D ). All of these assays failed to offer sensitivity to be used at or near the Km substrate concentration; therefore, screening using these assays will be unlikely to identify AMP competitive inhibitors. We then developed a mass spectrometry–based assay that allows quantifying AMP and ADO at a substrate concentration close to Km value ( Fig. 1E ). This assay can be applied for both recombinant human CD73 and CD73pos cells. To improve its throughput, we adopted a multiplexing assay idea previously described by Leveridge et al. in analyzing a panel of histone H3-derived peptides used as the substrates of JmjD2d H3K9me3 demethylase. 24 Here, we ran CD73 reactions in a multiplexing format in which four CD73 reactions were conducted on individual 384-well assay plates using four different stable isotope-labeled adenines. Multiple reaction monitoring (MRM) fragments that were monitored and quantified correspond to the adenine ring of these molecules ( Fig. 1E ). Four reaction plates were pooled after CD73 reaction and quenching. The mixture of four CD73 reactions on the pooled assay plate was injected and analyzed simultaneously using ultrafast RapidFire–tandem mass spectrometry (RF-MS/MS). 25 This assay allowed us to complete an HTS of 762,400 compounds using recombinant CD73 at a rather high speed (384 × 4 reactions every 40–50 min.). The wide dynamic range, high sensitivity, and specificity of this assay also enabled us to study the mode of inhibition and evaluate inhibitory activity in a cellular context. Here, we describe the development, validation, and application of this assay in an HTS campaign.
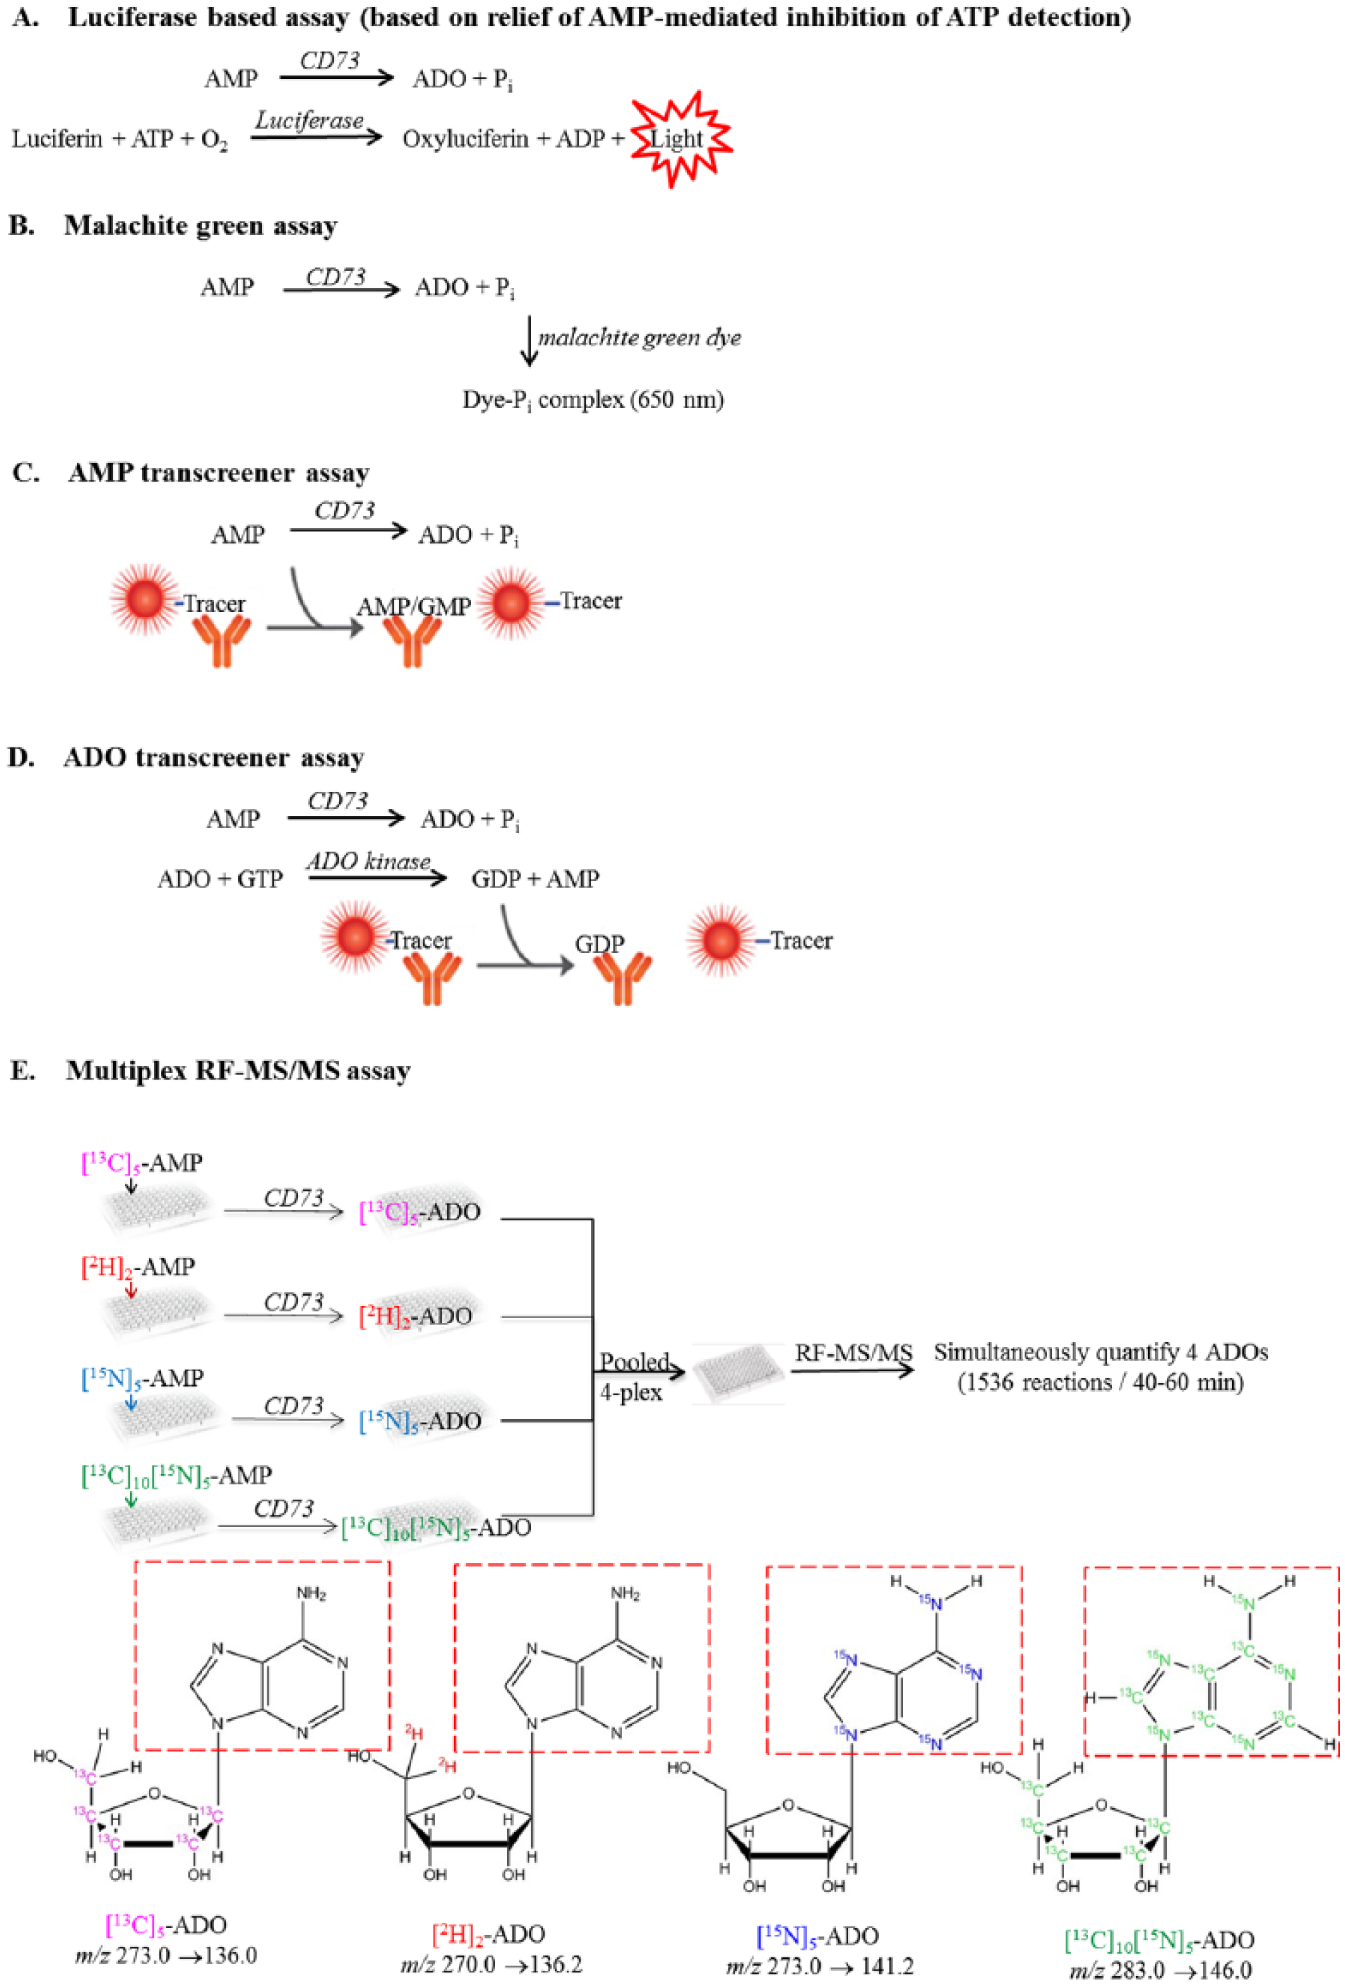
The principle of various CD73 biochemical assays. (A) Luciferase-based assay: The assay measures the depletion of adenosine monophosphate (AMP) indirectly through relief of AMP-mediated inhibition of adenosine triphosphate (ATP) detection in a luciferase-based system. (B) Malachite green colorimetric assay: The assay measures the free phosphate produced from the CD73 reaction using malachite green dye. (C) AMP transcreener assay: The assay measures the depletion of AMP in the CD73 reaction by measuring the decrease of fluorescence polarization of anti-AMP antibody to AMP tracer. (D) Adenosine (ADO) transcreener assay: The assay indirectly measures the production of ADO from the CD73 reaction by measuring guanosine diphosphate (GDP), which is a product of the adenosine kinase coupling reaction. (E) Mass spectrometry (MS)-based assay: Four CD73 reactions using four isotopic-labeled AMP ([13C]5-AMP, [2H]2-AMP, [15N]5-AMP, and [13C]5[15N]5-AMP) were run on individual assay plates. After quenching, the individual assay plates were pooled and injected into the mass spectrometer using RapidFire. Four different mass transitions were measured simultaneously. The structures of the fragments used for tandem MS (MS/MS) quantification are shown in red dotted rectangles.
Materials and Methods
Chemicals
Adenosine 5′-(α,β-methylene) diphosphate (AMPCP), ADO, and formic acid were purchased from Sigma-Aldrich. [15N]5-AMP and [13C]10[15N]5-AMP were purchased from Silantes GmbH (cat. 123303801 and 123603801, respectively). [2H]2-AMP was purchased from Omicron Biochemicals (cat. NCT-002).
Synthesis of [13C]5-AMP
In a vial (dry, under N2 atmosphere), (2R,3R,4S,5R)-2-(6-amino-9H-purin-9-yl)-5-(hydroxymethyl-13C)tetrahydrofuran-3,4-diol-2,3,4,5-13C4 (0.1 g, 367.37 µmol) was put in suspension (dissolution was not complete at the time of phosphorus oxychloride addition) in trimethyl phosphate (0.5 mL, 4.32 mmol), and the mixture was cooled down to 0 °C with an ice bath. Phosphorus oxychloride (37.66 µL, 404.10 µmol) was added dropwise over the course of a minute. The resulting mixture was stirred at 0 °C for 4 h. Liquid chromatography–mass spectrometry (LC-MS) at time equal to 0.33 min ([M+H+] = 353) showed that the reaction was complete. The mixture was added to cold diethyl ether (100 mL) to precipitate the product. The precipitate was recovered by decantation after centrifugation (1 min @ 1500 rpm) and dissolved in cold water. This aqueous solution was injected on a semipreparative column (Clarity-Oligo, 250 × 21 mm) and eluted with an ammonium bicarbonate buffer (0.01 M at pH 7.6) and acetonitrile (100:0 to 50:50 in 20 min, flow rate at 20 mL/min). The fractions containing the product were freeze-dried. ((2R,3S,4R,5R)-5-(6-amino-9H-purin-9-yl)-3,4-dihydroxytetrahydrofuran-2-yl-2,3,4,5-13C4)methyl-13C phosphate (42 mg, 119.26 µmol, 32.5% yield) was isolated. Proton nuclear magnetic resonance (1H NMR) (400 MHz, D2O) δ (ppm): 8.36 (s, 1H); 8.13 (s, 1H); 6.19 and 5.77 (br s, 1H, 13C-1H J = 168 Hz); 4.78 and 4.53 (br s, 1H); 4.41 (br s, 1H); 4.16 and 3.80 (br s, 2H, 13C-1H J = 144 Hz); 4.16 and 4.04 (br s, 1H). 13C (101 MHz, D2O) δ (ppm): 87.19 (dt, J = 42.3, 3.8, 3.5 Hz), 83.98 (ddd, J = 42.6, 38.5, 8.8 Hz), 74.34 (dd, J = 42.3, 37.7 Hz), 70.24 (td, J = 38.1, 3.5 Hz), and 64.26 (dd, J = 42.6, 4.9 Hz). Natural abundance nuclei were not detected due to the difference in sensitivity.
Recombinant Human CD73
A DNA sequence encoding a native peptide secretion signal, followed by CD73 extracellular domain W21-S549 (ABA39834.1 / g76152332) with (His)6 at the C-term, was generated by a synthetic gene approach. NheI and HindIII sites were also added respectively at 5′ and 3′ of the synthetic DNA fragment. The fragment was cloned into the mammalian expression vector between NheI and HindIII sites to obtain the final expression vector.
CD73-His was produced in suspension-cultivated HEK293-FS cells (Invitrogen). The plasmid described above, complexed with 293fectin (Invitrogen), was transiently transfected. The culture supernatant containing the secreted protein was harvested 7 days post transfection, centrifuged, and filtered with 0.22 µm membrane. CD73-His was enriched by affinity chromatography on IMAC (HisTrap, GE Healthcare) using imidazole gradient in phosphate-buffered saline (PBS). The fractions containing CD73-His were pooled and purified by size exclusion chromatography (SEC; Superdex 200, GE Healthcare) equilibrated with PBS. All purifications were monitored by measuring the ultraviolet (UV) absorbance at 280 nm. Elution fractions were analyzed by SDS-PAGE (sodium dodecyl sulfate–polyacrylamide gel electrophoresis). Final protein product is 98% pure (analyzed by Agilent Bioanalyzer 2100), is a dimer (analyzed by analytical SEC), and has molecular weight of 58,806 Da (after deglycosylation and reduction; analyzed by Agilent 6230B TOF LC/MS system; calculated molecular mass: 58,808.2 Da). Protein concentration was determined using a calculated extinction coefficient of CD73-His at 280 nm (0.96 at 1 mg/mL).
RF-MS/MS Assay Using Recombinant CD73
Using [15N]5-AMP as a substrate, assay buffer optimization was performed by varying the concentrations of NaCl (0 to 150 mM), ZnCl2 (50 µM to 2 mM), MgCl2 (0 to 2 mM), DTT (0 to 1 mM), and DMSO (0 to 5%) in 50 mM Tris HCl pH 7.4. Triton X-100 and Tween 20 were evaluated for their ability to stabilize low-concentration CD73 for up to 180 min. To determine the CD73 concentration and reaction time that allowed determination of reproducible and robust initial velocities, CD73 reaction progression at various enzyme concentrations was monitored. CD73 reaction was monitored by quantifying [15N]5-ADO converted from [15N]5-AMP. CD73 reactions under optimized assay conditions were conducted in a 20-µL volume in a 384-well microplate (Greiner Bio-One, cat. 781280) in a buffer containing 50 mM Tris-HCl, pH 7.4, 0.005% TX-100, and 1% DMSO. Vmax and Km were determined with 0.075 nM enzyme and varied substrate concentrations. Initial velocity data were fit to the Michaelis–Menten equation using GraphPad Prism (GraphPad Software, version 6). To evaluate inhibitory activity of compounds, an acoustic liquid-handling system, Echo 555 (LabCyte), was used to dispense compound DMSO stock into 384-well plates (Echo_384PP, LabCyte, cat. P-05525). Testing compounds were incubated with CD73 for 1 h at room temperature (RT) before reaction was initiated by adding substrate (final CD73 at 0.075 nM and substrate at 5 µM). CD73 reactions were quenched after 8–10 min with 20 µL of 1.6 µM ADO and 2% formic acid in water. The reaction mixture was diluted 20-fold with water and subjected to RF-MS/MS analysis.
The RapidFire 300 (Agilent Technology) high-throughput system (RF) was coupled to a TSQ Vantage triple-stage quadrupole mass spectrometer (Thermo Fisher Scientific) operated in electrospray positive-ion mode. A Hypercarb type D (Agilent cat. G9203-80106) cartridge was used for sample trapping and elution. Samples were aspirated for 600 ms, followed by 3000 ms loading and washing with mobile phase A of 20 mM ammonium bicarbonate in water at a flow rate of 1.2 mL/min. A fixed loop of 20 µL samples was loaded onto the cartridge. Samples were then eluted for 4000 ms with mobile phase B of 0.2% ammonium hydroxide in 45:45:10 acetonitrile–isopropanol–water at a flow rate of 1.0 mL/min, followed by reequilibrating the cartridge with mobile phase A at 1.0 mL/min for 500 ms. The detailed setting for the mass spectrometer parameters was as follows: spray voltage: 3000 V; vaporizer temperature: 300 °C; sheath gas pressure: 30; ion sweep gas pressure: 0; axillary gas pressure: 10 psi; capillary temperature: 350 °C; S-lense RF amplitude: 76; and collision energy: 18 V. MRM transitions for CD73 reaction products [13C]5-ADO, [2H]2-ADO, [15N]5-ADO, [13C]10[15N]5-ADO, and unlabeled ADO (as the internal standard) were m/z 273.0 → 136.0, m/z 270.0 → 136.2, m/z 273.0 → 141.2, m/z 283.0 → 146.0, and m/z 268.0 → 136.2, respectively. The mass window for both parental and daughter ions was set at 0.7 Da. The dwell time for each transition was 25 ms. Peak areas were integrated, and area ratios of labeled ADO to the internal standard were used for ADO quantitation. The mode of inhibition of selected screening hits was evaluated by measuring IC50 values at two substrate concentrations 26 (here, 5 µM and 75 µM).
High-Throughput Screening
A collection of 762,400 compounds was screened using the RF high-throughput MS readout described above on three RF-MS/MS systems: RF coupled with a TSQ Quantiva or TSQ Vantage triple-stage quadrupole mass spectrometer (Thermo Fisher Scientific) or with a Sciex API4000 triple-stage quadrupole mass spectrometer (Applied Biosystems). An automatized flow integrating a Multidrop Combi (Thermo Scientific), an Agilent Bravo, and a Beckman platform was established to process assay plates in an HTS mode. CD73 reactions (40.3 µL) with different isotope-labeled AMPs ([15N]5-AMP, [13C]5[15N]5-AMP, [2H]2-AMP, or [13C]5-AMP) were carried out in separate 384-well assay plates (Greiner Bio-One, cat. 781280). Each reaction solution is composed of 0.075 nM human CD73 and 10 µM of isotope-labeled AMP in 50 mM Tris-HCl, pH 7.4, 0.005% TX-100, and 1% DMSO. Each 384-well assay plate included 16 positive controls (reactions without compound added) and 32 negative controls (pre-quenched reactions). The mean of these controls was used to calculate the percent inhibition (%I) of compounds. The primary screen was conducted at 10 µM compound. Details of the HTS assay protocol are shown in Supplemental Table 1 . A %I value of three standard deviations of the mean (3 SD) was used as the cutoff for selecting primary screening hits. Screener software (Genedata, version 13.0.3-standard) was used for data analyses. Primary hits were confirmed at 10 µM in triplicate, and the confirmed hits were then analyzed in a 10-point dose response from 30 µM in triplicate. A positive control, CD73 inhibitor AMPCP, was included in each plate. Data were globally fit with a four-parameter sigmoidal model using Speed software (Hyphen version 1.0) to obtain IC50, hill slope, minimum inhibition (Imin), and maximum inhibition (Imax). In cases in which the computation failed, the bottom or/and top parameters were fixed, resulting in a three- or two-parameter sigmoidal curve shape, respectively.
Bead-Immobilized Recombinant CD73 Assay
His-tagged recombinant CD73 was captured using Dynabeads His-Tag (Thermo, cat. 10103-D). After the magnetic beads were washed with an assay buffer containing 50 mM Tris-HCl and 0.005% TX-100 (pH 7.4), and pulled down using a magnetic stand, CD73 was added to the beads at a ratio of 1.6 (pmole CD73/µL beads) and incubated with gentle rotation at 25 °C for 30 min. After incubation, beads were washed three times with assay buffer using a 0.22 µm spin filter (Agilent cat. 5185-5990) to ensure all unbound CD73 was washed out, and then resuspended in assay buffer for a final concentration of 0.5 µM immobilized rhCD73 and kept at 4 °C. CD73 reaction was conducted with 0.4 nM beads of captured CD73 and 25 µM [15N]5-AMP at 37 °C in a 384-well microtiter plate using a final reaction volume of 20 µL. After 8–10 min, reaction was quenched with 20 µL quenching solution, diluted 20-fold with MilliQ water, filtered using an AcroPrep 384-well Filter Plate (Pall cat. 5077), and subjected to MS analysis as described above.
Cellular CD73 Assay
MDA-MB231 (human), CORL23 (human), and 4T1 (mouse) cells were respectively trypsinized, counted, and seeded at a density of 5000 cells per well in 96-well plates (Costar cat. 3357) in a final volume of 67 µL cell culture medium. MDA-MB-231 cells (ECACC Sigma cat. 92020424) were cultured in RPMI 1640 medium (Gibco cat. 22400-071) with 10% fetal bovine serum (FBS; Gibco cat. 10082-147). CORL23 cells (ECACC Sigma cat. 92031919) were cultured in RPMI 1640 with 2 mM glutamine (Gibco cat. 25030-081) and 10% FBS (Gibco). 4T1 cells (ATCC cat. CRL-2539) were cultured in RPMI 1640 with 10% FBS (Gibco). The cells were allowed to attach overnight with incubation at 37 °C and 5% CO2 in a humidified tissue culture incubator. Testing compounds were first prepared by serial threefold dilution with DMSO, then further diluted to an appropriate concentration with cell growth media. Diluted compounds (33 μL) were added to exponentially growing cells (to yield 100 μL total volume) and were pre-incubated with the cells for 15–30 min prior to the addition of reaction substrate [15N]5-AMP.
Following incubation of the [15N]5-AMP with the cells, cell medium (100 µL) was filtered through an ultrafiltration plate (350 µL capacity, AcroPrep advance 96-well plates, Omega 10K MWCO, Pall cat. 8034) at 20 oC, 4000 rpm, for 30 min. The filtrates were diluted 20-fold in water spiked with 100 nM [13C]10[15N]5-ADO (Cambridge Isotope Inc. cat. CNLM-3806) as the internal standard. Quantification of cellular ADO was carried out by monitoring the conversion of [15N]5-AMP to [15N]5-ADO using the RF high-throughput MS readout described above.
The Km of AMP using CD73 on COL23 cells was determined using 2.5 to 160 µM [15N]5-AMP. Reaction was quenched at 0, 3, 5, 10, 15, 30, and 45 min with final 1% formic acid to obtain progression curves. Initial velocities data were fitted to the Michaelis–Menten equation using GraphPad Prism version 6.
Results
CD73 Assay Development and Optimization
Using several isotopically labeled AMPs and an ultrafast RF-MS system, CD73 enzymatic reaction can be quantified at a speed of 38 reactions/min. Excellent injection reproducibility (STDV ~4%), signal-to-noise ratio (S/N = 700), and low sample carryover (<5%) were achieved ( Fig. 2 ). With this detection method, we first optimized the buffer components for CD73 reaction. We found that CD73 is at least threefold more active in Tris buffer than in PBS buffer. The effects of salt, bivalent metal ion, reducing agent, detergent, and DMSO were evaluated. An optimal assay buffer condition for a robust and sensitive CD73 reaction was identified (50 mM Tris-HCl, pH 7.4, 0.005% Triton X-100, and 1% DMSO). Under this condition, only 0.075 nM CD73 enzyme was needed, and reaction is linear for up to ~15 min. The Km of AMP was determined to be 3.85 ± 0.22 µM ( Fig. 3A ). Adding a low concentration of detergent is necessary to prevent enzyme activity loss from, presumably, enzyme sticking to assay plates. The addition of ZnAc2 at low concentration (<5 µM) showed some enhancement to enzyme activity but at concentration >5 µM Zn2+ was found to be inhibitory (IC50 = 49.7 ± 2.1 µM). ICP-MS analysis (conducted by Elemental Analysis Inc.) showed that each purified CD73 monomer contained one Zn2+. If CD73 is truly a di-Zn enzyme, the purified CD73 dimer was ~50% loaded with Zn2+. This may explain the activity enhancement effect observed when low Zn2+ was added to assay buffer. The inhibitory effect of Zn2+ at high concentration remains to be elucidated.
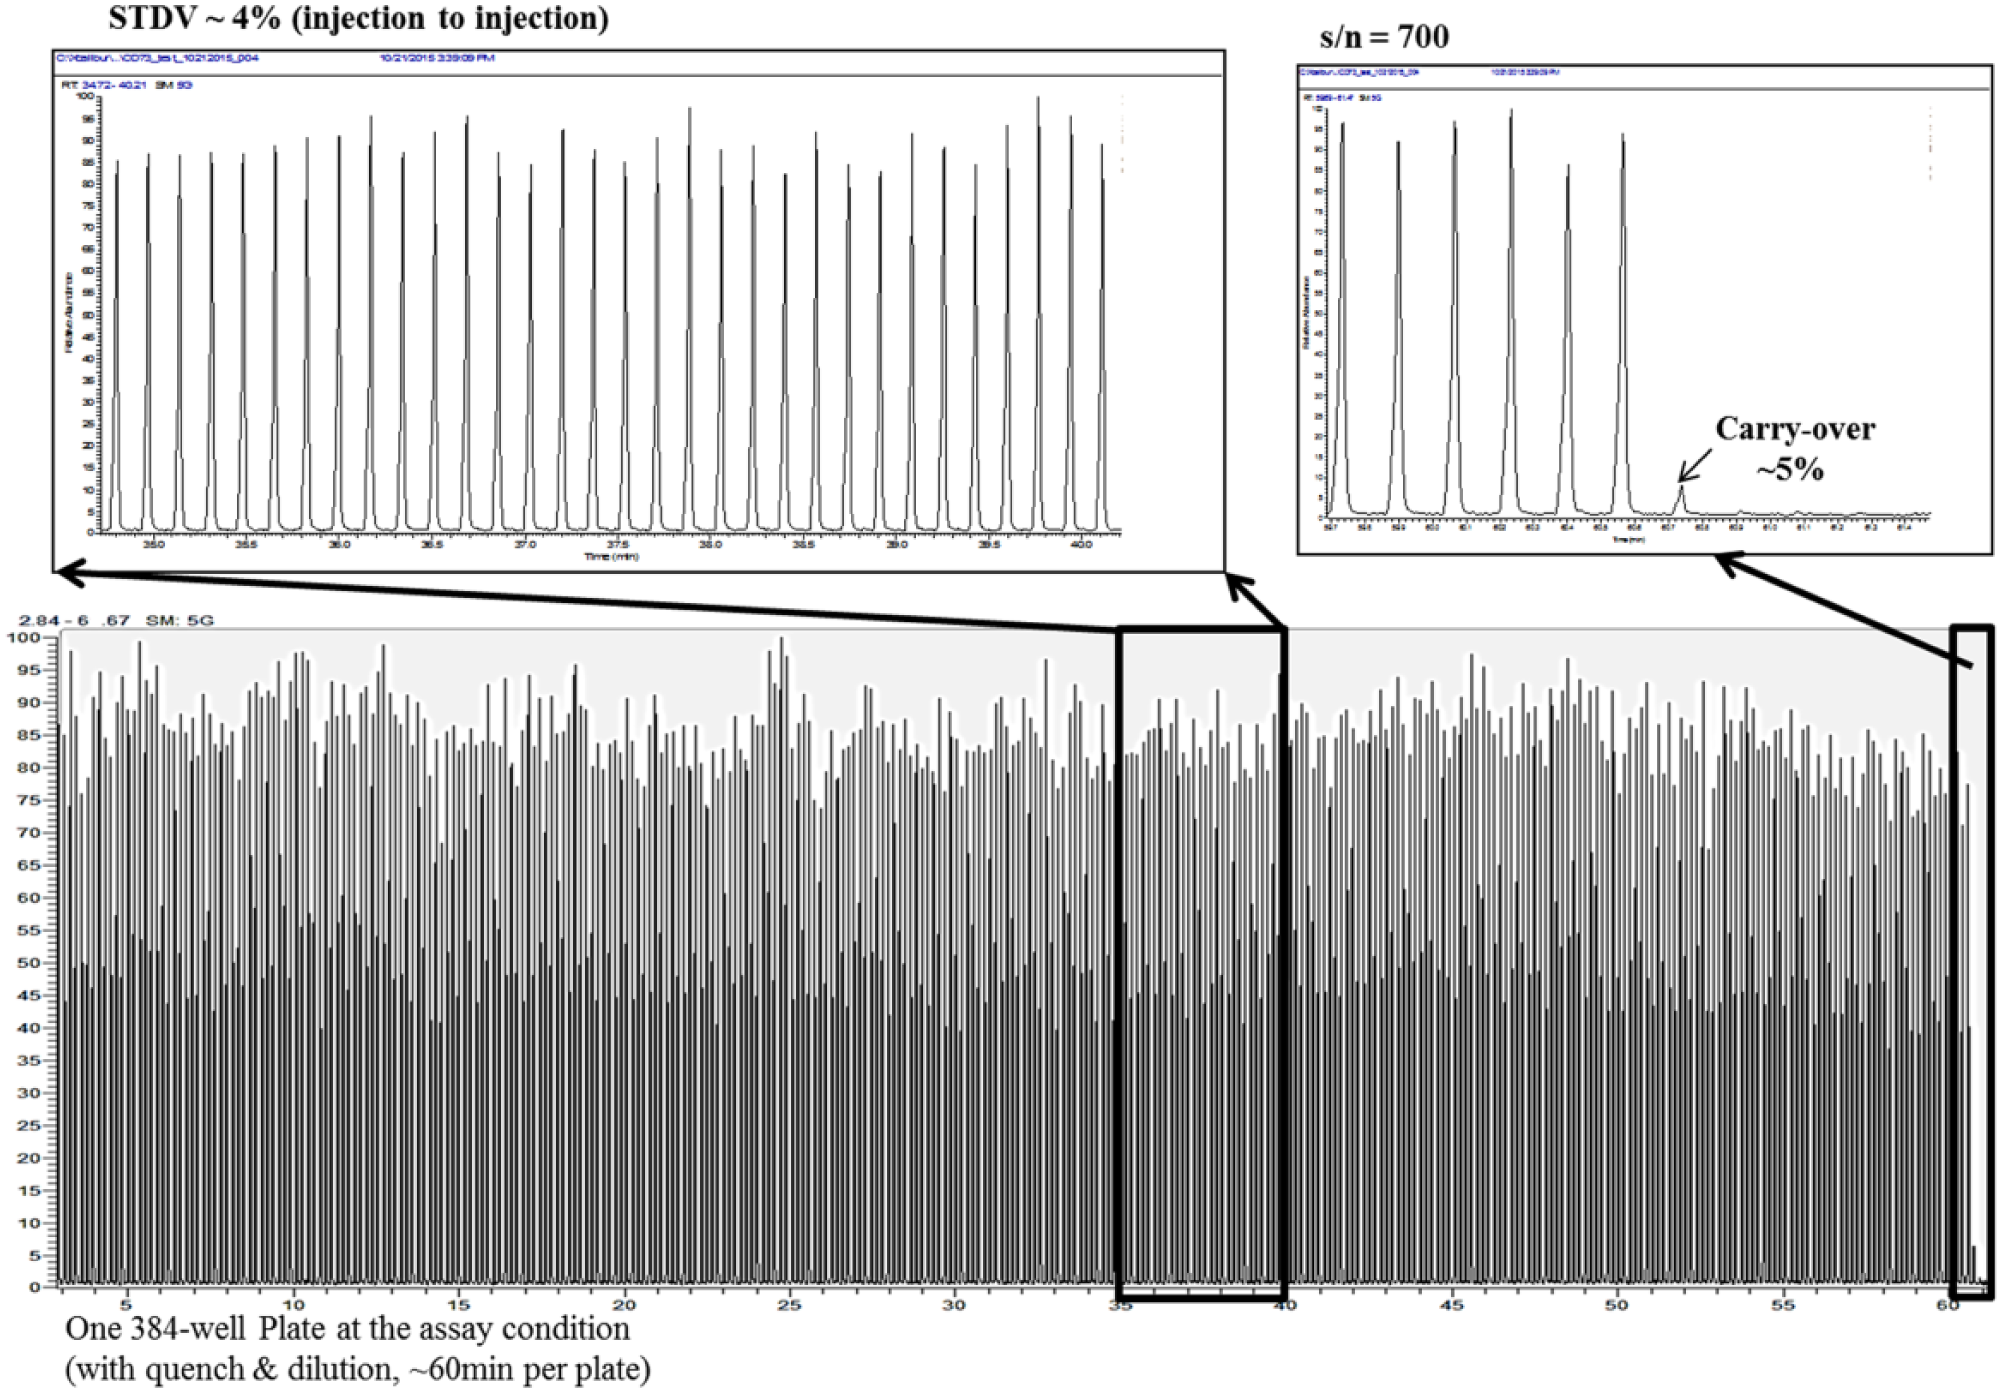
Injection-to-injection variation, signal-to-noise ratio, and carryover of RapidFire method.
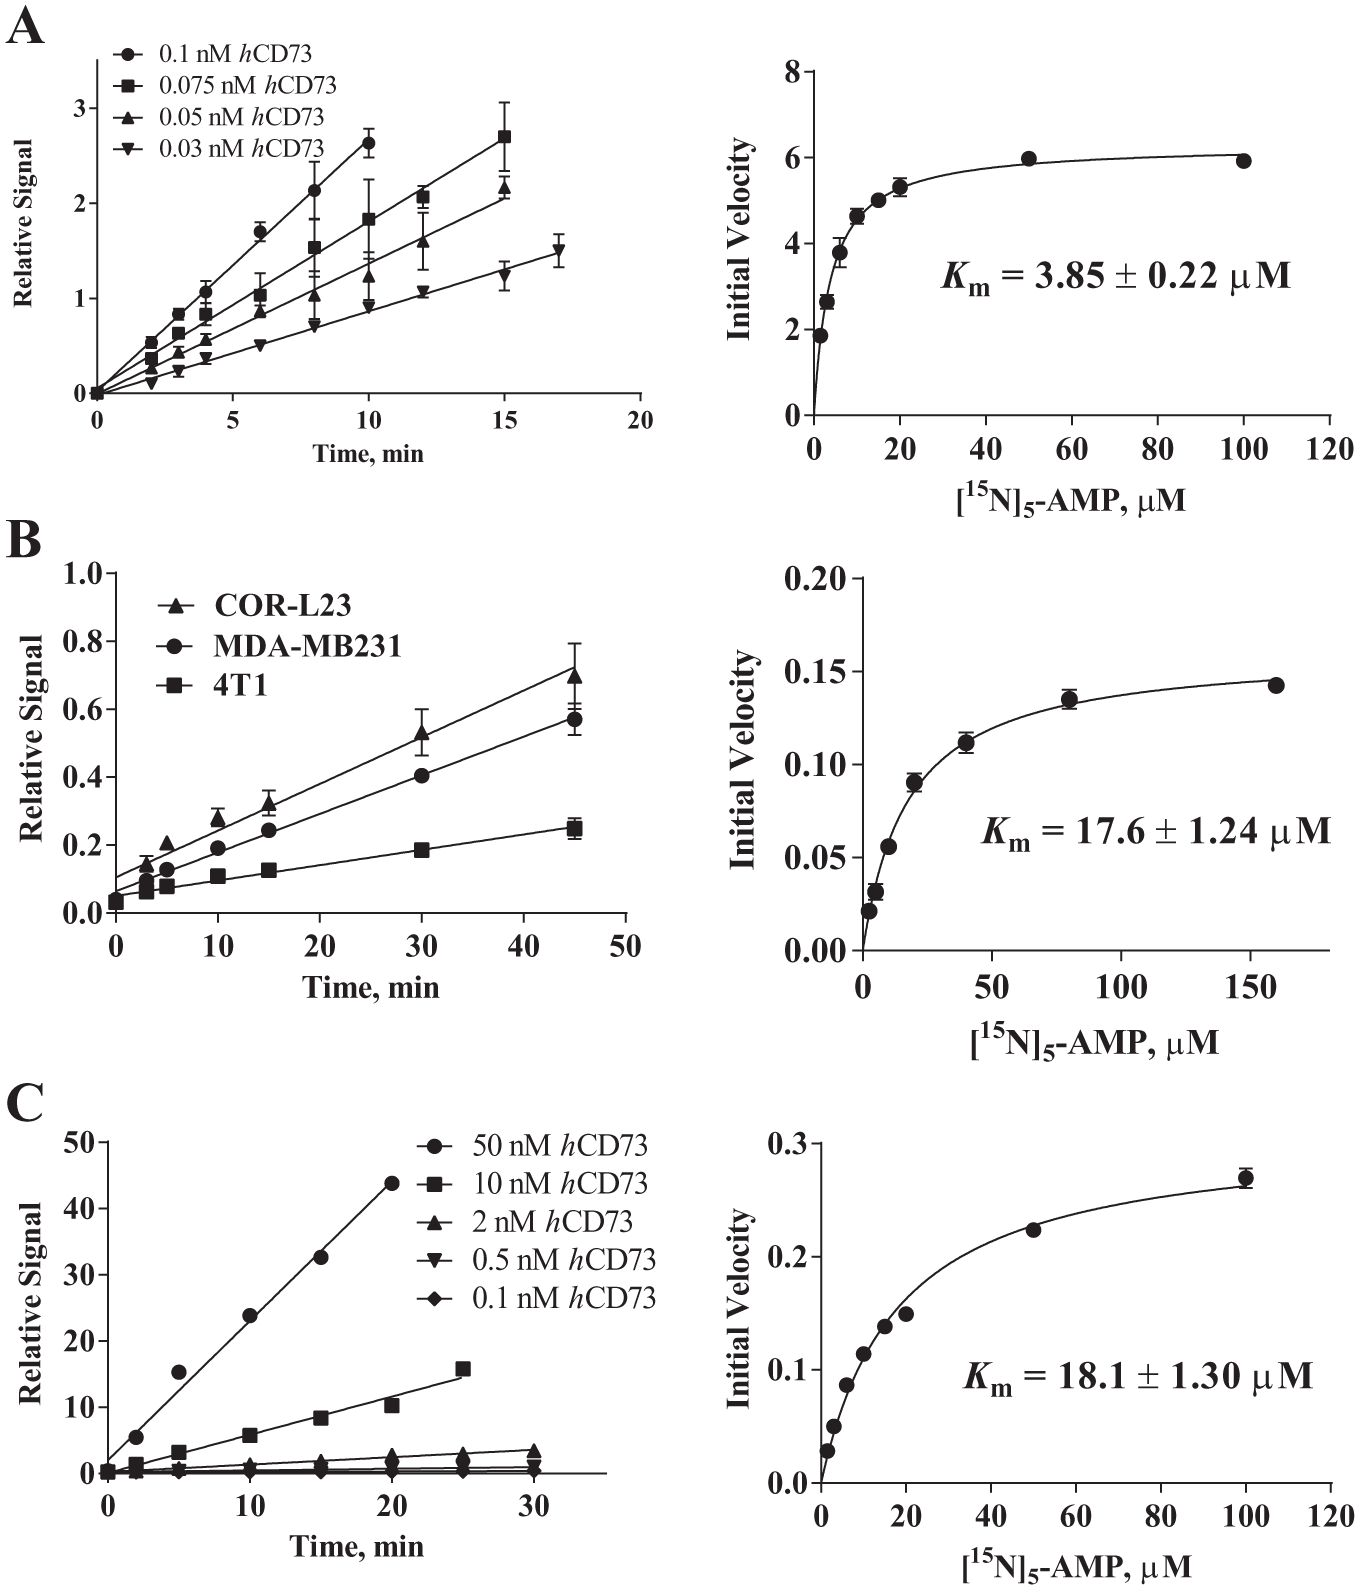
(Left) Reaction linearity and (right) Km determination. Data were collected in triplicate. Reaction linearity experiments were conducted with (A) 5 µM [15N]5-AMP (adenosine monophosphate) for soluble recombinant CD73, (B) 20 µM for cellular CD73, and (C) 5 µM for bead-immobilized CD73. The relative signal is the MS peak area ratio of [15N]5-ADO (adenosine) to the respective internal standard (ADO for soluble and bead-immobilized recombinant CD73 assays, and [13C]10[15N]10-ADO for the cellular CD73 assay). Soluble and bead-immobilized recombinant CD73 used for Km determinations were 0.075 nM and 0.4 nM, respectively. Initial velocity is the MS peak area ratio per minute.
The effectiveness of reaction quenching using 1% formic acid (final 0.05% after dilution with 20 volumes of water) was confirmed by monitoring the amount of [15N]5-ADO for up to 12 h post quenching/dilution in water. The level of [15N]5-ADO remained constant for up to 12 h, indicating CD73 reaction was completely stopped following acid quenching. The stability of the reaction product ADO in postquenching and dilution solution was evaluated by measuring [15N]5-ADO throughout time. When assay plates were kept on the RF system for 24 h at RT, no loss of ADO was observed.
The performance of the multiplex assay format using [15N]5-AMP, [13C]5[15N]5-AMP, [2H]2-AMP, and [13C]5-AMP was evaluated by determining the IC50 of AMPCP. Results showed excellent agreement with those obtained using a single-substrate assay ( Suppl. Fig. 1 ).
Assay Validation and HTS
To validate the RF-MS/MS assay for HTS, a validation collection of 8000 diverse compounds was tested at 10 µM in duplicate. The resulting Z’-factor of 0.88 and correlation coefficient (R2) of 0.66 ( Suppl. Fig. 2 ) indicated that HTS can be conducted robustly with high quality.
HTS was conducted at 10 µM against a number of internal and external compound libraries (including IMI European Lead Factory, AstraZeneca RiskSharing Collection, and numerous proprietary Sanofi collections, totaling 762,400 compounds). The majority of the compounds (566,400) were screened at the Evotec screening laboratory, and 196,000 compounds were screened in a Sanofi laboratory. The average hit rate was ~1% with a %I cutoff at mean + 3 SD. As an example, the results for screening 566,400 compounds are illustrated in Figure 4 . The confirmed hits were further analyzed in 8- or 10-point compound dilution series with a dilution factor of semilogarithmic at a top concentration of 30 μM. Among all 762,400 compounds screened, 1775 hits showed IC50 < 30 µM, and 300 hits have IC50 < 1 µM.
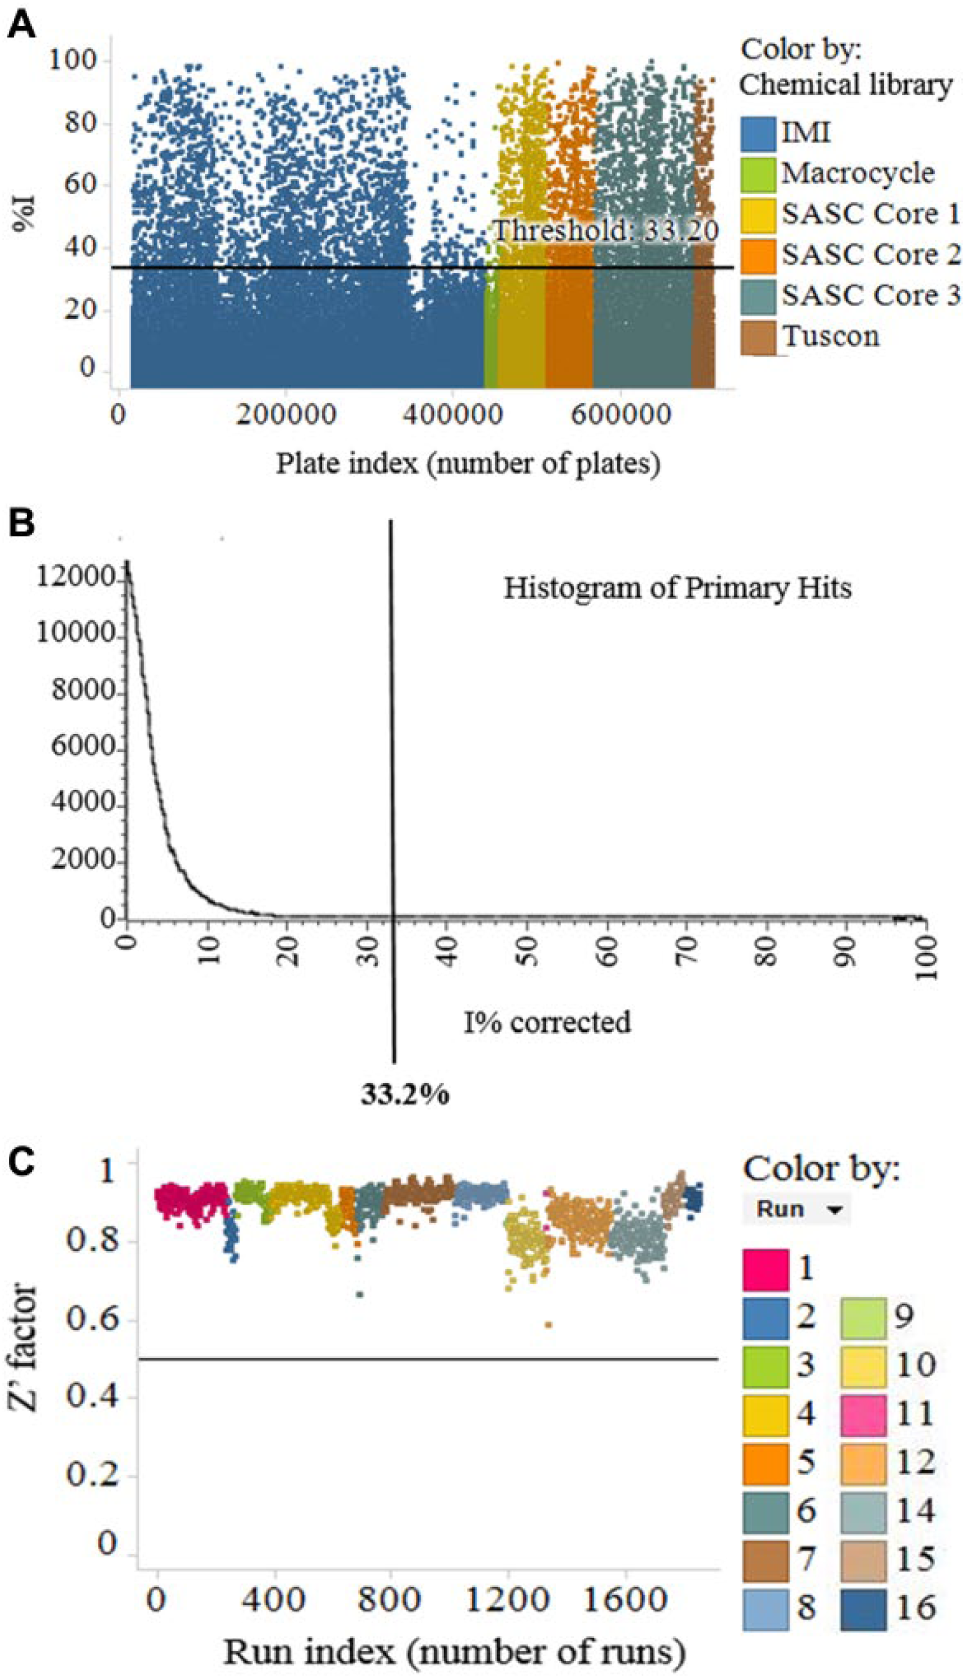
High-throughput screening (HTS) results for 566,400 compounds. (A) %I distribution colored by libraries. Hit threshold is 33.2% (mean + 3 SD), which corresponds to a hit rate of 1.02%. (B) Histogram of primary hits. (C) Z’ factors of 16 runs.
Hit Validation
The confirmed HTS hits showing potent IC50 were subjected to chemistry triaging to remove promiscuous compounds and those with problematic structures, including redox-active, thiol-reactive, or covalent modifier functionalities. The interesting hits were reordered in powder form and subjected to dose-dependent solubility evaluation using nephelometry in a threefold dilution series. Compounds with solubilities lower than IC50 were removed because they most likely inhibited CD73 via a nonspecific mechanism. Compounds with solubility higher than IC50 were analyzed at two substrate concentrations, 5 µM (1.3×Km) and 75 µM (19.5×Km), to bin compounds based on their inhibition modalities. 26 For compounds binding at substrate-binding sites, a typical competitive inhibition, substrate concentration shifting from 1×Km to 20×Km, will result in an approximately 10× shift in IC50. As expected, AMPCP, a substrate mimetic, showed a 10-fold IC50 shift ( Fig. 5A ). However, a sulfonamide (N-[4-(aminosulfonyl)phenyl]-6-chloro-2-oxo-2H-1-benzopyran-3-carboxamide) evaluated using rat CD73, which was discovered by a virtual screening and was proposed to be an AMP competitive inhibitor of CD73, 27 failed to show IC50 shift when tested using human CD73 ( Fig. 5B ).
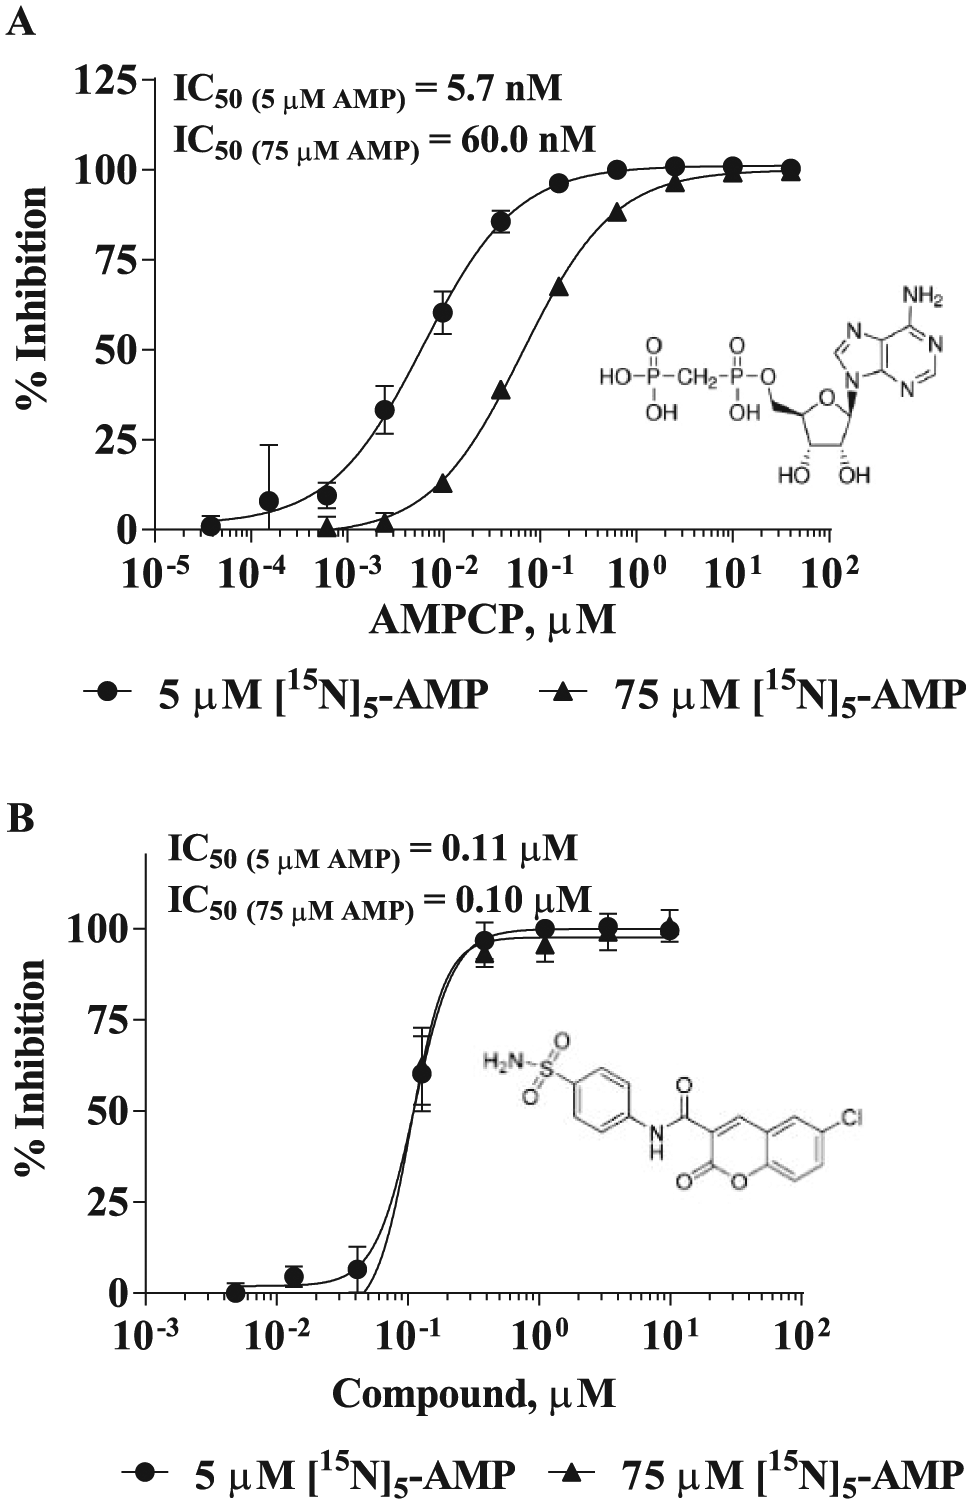
Evaluation of mode of inhibition of compounds by measuring IC50 at 1 Km and 20 Km substrate concentrations using human CD73. (A) AMPCP (adenosine 5′-[α,β-methylene]diphosphate). (B) A sulfonamide (N-[4-(aminosulfonyl)phenyl]-6-chloro-2-oxo-2H-1-benzopyran-3-carboxamide). IC50 values of AMPCP determined at 5 µM and 75 µM of adenosine monophosphate (AMP) are 5.7 nM and 60.0 nM, respectively. The increased IC50 value as increase of AMP concentration indicates that AMPCP is a competitive inhibitor with respect to AMP. The IC50 of a sulfonamide did not change when AMP concentration changed from 5 µM and 75 µM (IC50 = 0.11 µM and 0.10 µM, respectively), suggesting a noncompetitive inhibitor with respect to AMP.
The recombinant CD73 used to screen the small-molecule library lacked the N-terminal sequence in which the GPI anchor resides. To investigate if selected screening hits also inhibit cellular CD73, we conducted CD73 reaction using three CD73pos cell lines (human COR-L23, MDA-MB231, and mouse 4T1 cells). The CD73 reactions conducted using the three cell lines showed good linearity up to 45 min when 20 µM substrate [15N]5-AMP was used ( Fig. 3B , left). The Km value determined using CD73 on COR-L23 is about fourfold higher than that determined using recombinant CD73 (17.6 µM) ( Fig. 3B , right). To investigate if the higher Km was due to cell surface anchoring of CD73, we immobilized recombinant CD73 via its C-terminal 6 histidine tag to cobalt-based magnet beads. We found that the enzymatic activity of immobilized CD73 was linear for 15 min at 20 µM [15N]5-AMP, and the enzymatic activity was lower than in its soluble form. For a robust assay, 0.4 nM CD73 is required. Bead-captured CD73 had a Km similar to that determined using cells (18.1 µM; Fig. 3C ). This result suggested that bead-immobilized CD73 likely confers a spatial orientation that resembles that of GPI-anchored CD73 on cells.
Attractive inhibitors were further analyzed using cellular CD73. AMPCP was used as a control inhibitor that showed robust IC50 in low µM against CD73 on MDA-MB-231, CORL23, and 4T1 cells ( Fig. 6 ). We found that although immobilized CD73 can be robustly applied for evaluating anti-CD73 antibody inhibitors (data not shown), it did not seem to be suitable for evaluating small-molecule inhibitors because many small-molecule inhibitors showed relatively high nonspecific binding to the beads used to capture CD73.
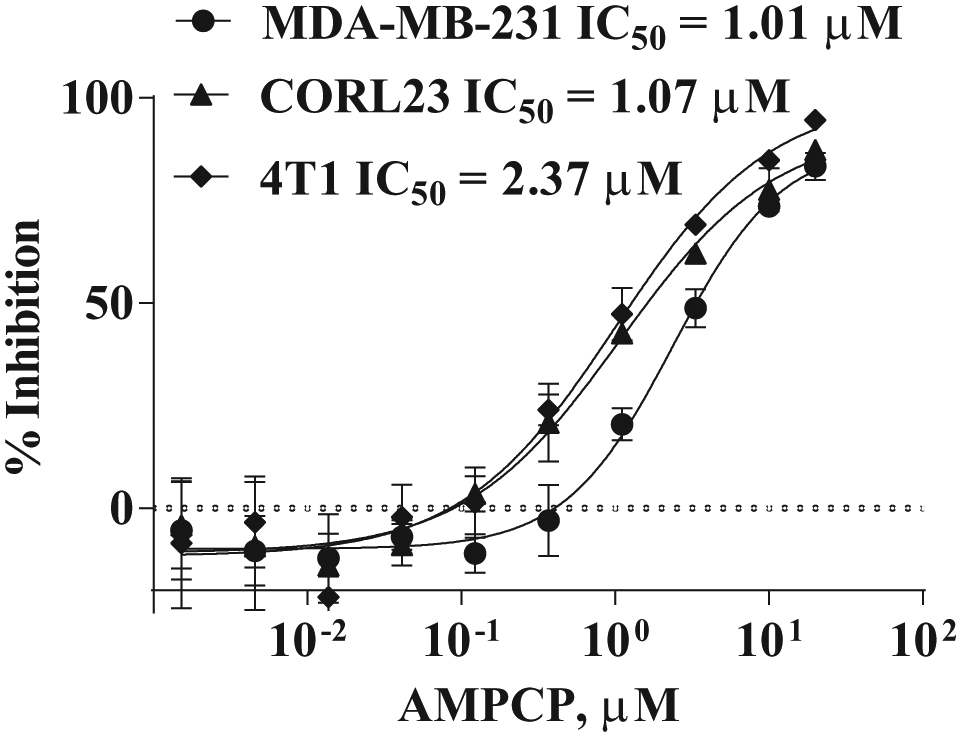
Determination of IC50 of AMPCP (adenosine 5′-[α,β-methylene]diphosphate) using MDA-MB-231 (human), CORL23 (human), and 4T1 (mouse) cells.
Discussion
To develop an assay suitable for conducting HTS under optimal conditions (i.e., at a substrate concentration near Km value to identify inhibitors of all possible modalities 21 ) and for characterizing hits (e.g., studying the mode of inhibition by determination of IC50 at 1 Km and 20 Km 26 ), we evaluated a number of assays that used the optical property of detecting molecules. The photometric-based malachite green assay, which quantifies amount of Pi released from CD73 reaction, is robust and easy to operate, but it requires 75 µM AMP (equivalent to 20 Km) to obtain a robust readout (data not shown). Similarly, the luciferase assay, which indirectly detects CD73 reaction based on the relief of AMP-mediated inhibition of ATP detection, also requires a high substrate concentration (300–370 µM). This assay does not have enough sensitivity for measuring the initial velocity necessary for accurately characterizing enzyme inhibitors. The AMP transcreener assay, which measures the depletion of reaction substrate, suffers a narrow dynamic range that prevents a robust detection of initial velocity (data not shown). In addition, expensive nonbinding plates are needed to decrease the nonspecific binding of the antibody used for detection. We also explored an ADO detection system in which the ADO released by CD73 reaction was coupled to an adenosine kinase reaction, which converts ADO and guanosine triphosphate (GTP) to GDP and AMP ( Fig. 1D ). The ADP released from the ADO kinase reaction is then quantified using a transcreener ADP detection system. This assay format was found not suitable for CD73 due to the inhibition of CD73 activity by GTP at the concentration desired for a coupling reaction (i.e., non-rate-limiting). Clearly, all the optical-based assays we evaluated did not meet our requirements of performing HTS at a near 1-Km concentration and cannot be used for studying the mode of inhibition of screening hits. We then switched our efforts to MS-based readout, which offers a much higher sensitivity than the optical-based detection methods we had explored. The general drawback of an MS readout is its lower throughput. To overcome this hurdle, we used a multiplex assay strategy in which four independent isotopically labeled AMPs were used for running a CD73 reaction, then individual reaction plates were combined, and four isotopically labeled adenosine reaction products were quantified by MS. To enable the fastest MS analysis, we applied the ultrahigh RF sample injection system, which uses a fast solid-phase extraction procedure instead of time-consuming HPLC for sample cleanup. Using this system, we screened 762,400 compounds in a rather short period of time, conducted hit confirmation, and determined IC50 of confirmed hits, all at very high quality (Z’-factor ≥ 0.87). We identified 300 compounds with IC50 < 1 µM. The compounds possessing attractive structures and solubilities were evaluated to understand the mode of inhibition and cellular activity. The detailed outcomes of the characterizations are beyond the scope of this article and will be reported elsewhere.
In summary, the RF-MS/MS-based multiplexing assay we developed allowed us to take advantage of high sensitivity, wide dynamic range, and high specificity of mass spectrometry. High throughput was achieved by using four different stable isotope-labeled substrates for CD73 reactions, followed by fast sample injection using the RapidFire system and simultaneous detection and quantitation of pooled reaction mixtures using a mass spectrometer. It not only allowed high-quality HTS to be conducted but also ensured high-quality hit validation. The throughput of this multiplex RF-MS/MS assay can be further increased if other isotopically labeled AMP substrates can be made available.
Footnotes
Acknowledgements
We thank Jacqueline Blouin, Christine Carillon, Muriel Cecconello-Marion, Claude Feuillerat, and Mickael Renaud at Evotec for their contributions in screening 566,400 compounds, and Hongtao Zeng and Karen Wong for contributing to the screening of 159,600 compounds. We are grateful to Bellbrook Labs for assistance in our attempts to develop an AMP transcreener assay and ADO detection assay using a transcreener GDP assay system.
Supplementary material is available online with this article.
Declaration of Conflicting Interests
The authors declared no potential conflicts of interest with respect to the research, authorship, and/or publication of this article.
Funding
The authors received no financial support for the research, authorship, and/or publication of this article.
References
Supplementary Material
Please find the following supplemental material available below.
For Open Access articles published under a Creative Commons License, all supplemental material carries the same license as the article it is associated with.
For non-Open Access articles published, all supplemental material carries a non-exclusive license, and permission requests for re-use of supplemental material or any part of supplemental material shall be sent directly to the copyright owner as specified in the copyright notice associated with the article.