
Abstract
Early assessment of absorption, distribution, metabolism, and excretion (ADME) properties of drug candidates has become an essential component of modern drug discovery. ADME characterization is important in identifying compounds early that are likely to fail in later clinical development because of suboptimal pharmacokinetic properties or undesirable drug-drug interactions. Proper utilization of ADME results, meanwhile, can prioritize candidates that are more likely to have good pharmacokinetic properties and also minimize potential drug-drug interactions. By integrating a RapidFire system with an API4000 mass spectrometer (RF-MS), we have established a high-throughput capability to profile compounds (>100 compounds/wk) in a panel of ADME assays in parallel with biochemical and cellular characterizations. Cytochrome P450 inhibition and time-dependent inhibition assays and microsomal stability assays were developed and fully optimized on the system. Compared with the classic liquid chromatography–mass spectrometry method, the RF-MS system generates consistent data with approximately 20-fold increase in throughput. The lack of chromatographic separation of compounds, substrates, and metabolites can complicate data interpretation, but this occurs in a small number of cases that are readily identifiable. Overall, this system has enabled a real-time and quantitative measurement of a large number of ADME samples, providing a rapid evaluation of clinically important drug-drug interaction potential and drug metabolic stability.
Absorption, distribution, metabolism, and excretion (ADME) properties of a chemical compound are critical factors in predicting its pharmacokinetic (PK) behavior and drug-drug interaction (DDI) potential. In recent years, regular ADME characterization has been widely adopted as an integral part of a modern drug discovery paradigm for compound advancement and clinical candidate selection. Extensive panels of ADME assays have been established in the pharmaceutical industry to profile compounds. Two of the major ADME assays are interactions with various human cytochrome P450 enzymes and metabolic stability of the compounds in the presence of isolated microsomes or hepatocytes.
With a rapidly aging population, the number of prescription drugs per patient has increased significantly. Approximately half of people older than 65 years take 5 or more different medications. 1 There have been many cases of DDI incidences that involved cytochrome P450 (CYP450) interactions, including voriconazole and tacrolimus, 2 cerivastatin and gemfibrozil, 3 and terfenadine and mibefradil. 4 The potential for DDI between a drug candidate and existing therapeutics has become a major safety concern for the regulatory agencies. As a result, potential interactions with P450 enzymes have been investigated at all stages of the drug discovery and development process.
Metabolic stabilities of compounds in the presence of liver microsomes and/or hepatocytes have been frequently assessed during lead optimization. The resultant ranking is a key selection criterion for compound advancement into in vivo studies because a more metabolically stable compound will more likely give rise to a longer half-life and/or lower clearance in animal PK studies. Because this prolonged half-life is often a prerequisite for a desirable once-a-day dosing regimen, more metabolically stable compounds are typically prioritized for in vivo animal testing. Compound prioritization based on in vitro stability data can also reduce the number of laboratory animals used for PK studies. In vitro metabolic stability studies have been routinely performed using pooled liver microsomes and/or hepatocytes from various species, including mouse, rat, dog, monkey, and human. This “zoo” panel generates critical information about species differences with respect to compound stability and, if confirmed with animal PK studies, can be used to predict PK behavior in humans.
There are various assays for characterizing potential drug interactions with P450 enzymes. The sources of P450 can be recombinant enzymes 5 as well as pooled human liver microsomes (HLM), 6 while different P450 substrates, including fluorogenic compounds and actual drug substrates, have been used. 7 Although high-throughput fluorescence-based P450 assays have been developed in high-density microtiter plate formats (e.g., 1536-well plates) 8 and nanoliter-scale microarrays, 9 they all required the use of recombinant P450 enzymes or artificial fluorogenic probes. There have been reports that indicated fluorescence-based assays using recombinant P450 enzymes or fluorogenic probes did not correlate well with the assays using HLM and drug substrates for compounds at early drug discovery.10,11 Largely because of its direct correlation with clinical DDI, the assay format using HLM and drug substrates has been widely adopted as the industrial standard, consistent with the recommendation from the regulatory agencies. 12 The key detection technology in P450 interaction studies is monitoring product formation using liquid chromatography–tandem mass spectrometry (LC-MS). Although LC-MS remains the gold standard, its throughput has been limited because of the long elution time in liquid chromatography. Consequently, several methods have been developed to improve compound throughput. One is to test compounds at a single concentration and report the percentage of inhibition, instead of the more informative IC50 values.13,14 However, to gain a better understanding of the potential of drug-drug interactions in the clinic, it is important to characterize any potential P450 interactions in a quantitative way (i.e., via a dose-response determination). These quantitative measurements will increase the resolution of P450 interaction determinations, aiding compound selection and prioritization. Another way to improve assay throughput is to mix various specific P450 substrates with HLM to initiate the reaction in a “cocktail” format15–18 or to pool P450 reaction products for a cassette analysis on the LC-MS. 19 However, even with the cocktail or the cassette approach, the bottleneck is still due to the long separation time in liquid chromatography. The use of short columns or simple desalting columns in place of a regular LC column prior to the MS analysis has been investigated to improve throughput.20–22 A system consisting of a solid-phase extraction (SPE) column, automated plate handler, sample injector, and software interface with MS was developed by Biocius (now a part of Agilent Technologies) and commercialized as the RapidFire system.22–24 We have established a system connecting the RapidFire compound handling and processing unit to an AB Sciex API 4000 mass spectrometer. We have used this system extensively in the past 5 years for compound characterization, including P450 interaction assays and metabolic stability assays. The RF-MS system can complete a full cycle of sample injection and data acquisition within 8 to 10 s, capable of generating thousands of data points per day.
In this report, we demonstrate that P450 enzymatic reactions, both in a single drug substrate format and in a multidrug substrate cocktail format, can be monitored quantitatively by RF-MS. The RF-MS results were found to have an excellent correlation with the LC-MS results. We outline a strategy to rapidly screen a large number of compounds against P450 enzymes in a 7-point dose-response curve, followed by focused dose-response determination in LC-MS for more advanced compounds. RF-MS data can be used to generate a quantitative structure-activity relationship (SAR) that is critical for further lead optimization. We also demonstrate that RF-MS can be used to assess time-dependent inhibition of P450 enzymes and metabolic stability of compounds. With a rapid and reliable data output by RF-MS, more quantitative SAR regarding interactions with P450 isoforms can be generated.
Although RF-MS drastically improves the throughput of ADME assays, it can have some drawbacks that are associated with the simple sample extraction. Ion suppression due to co-elution of other compounds or contaminants can potentially affect the MS signal and may yield false-positives. After analyzing RF-MS data for several thousand diverse compounds, we find the probability of significant ion suppression is minimal even at concentrations up to 50 µM. Potential interference can occur when multiple metabolites of the same mass transition are formed. This has also been rare, with only a couple of examples observed for the CYP3A4-testosterone system. In general, RF-MS is a very useful tool for rapidly evaluating a large number of medicinal chemistry compounds during lead discovery and the early stages of lead optimization. It is important to verify the interactions with CYP450 enzymes using the classic LC-MS method to establish a positive correlation initially between RF-MS and LC-MS data for any chemical series and to advance compounds into clinical development.
Materials and Methods
Reagents
Pooled whole-liver microsomes from mouse, rat, dog, monkey, or human were purchased from BD Gentest (Bedford, MA). NADPH, bufuralol, ketoconazole, S-mephenytoin, midazolam, paclitaxel, phenacetin, tacrine, testosterone, and tolbutamide were purchased from Sigma Aldrich (St. Louis, MO).
LC-MS System Setup
LC-MS analysis was performed using an API 4000 instrument (AB Sciex, Foster City, CA), coupled to a Prominence UFLC system (Shimadzu, Columbia, MD) and a CTC HTS PAL autosampler (LEAP Technologies, Carrboro, NC). A 2-µL sample loop was used. Analytical samples were separated using a Waters Atlantis T3 dC18 reverse-phase high-performance liquid chromatography column (20 mm × 2.1 mm) at a flow rate of 0.5 mL/min. The small Atlantis T3 column enabled us to analyze samples with a short LC cycle time while maintaining enough separating power. The mobile phase consisted of 0.1% formic acid in water (solvent A) and 0.1% formic acid in acetonitrile (solvent B). Elution conditions were the following: 0 to 0.3 min, 98% solvent A (i.e., 2% solvent B); 0.3 to 1.7 min, a linear gradient change from 98% A to 2% A; 1.7 to 2.4 min, 2% A; and 2.5 to 3.0 min, 98% A. The entire sampling cycle was 3.5 min per well.
RF-MS System Setup
The RapidFire RF200 system (Agilent Technologies [Biocius], Woburn, MA) was interfaced with an API 4000 mass spectrometer. The main components include a Zymark Twister robotic arm that can handle standard microtiter plates and the RapidFire in-line purification SPE system with injection valves and a barcode reader. The entire system is operated using the RapidFire software that is interfaced with Analyst software for the mass spectrometer.
Samples were aspirated directly from 384-well plates into a 10-µL sample loop and passed through a C4 cartridge (Biocius) with solvent A at a flow rate of 1.5 mL/min for 3 s. After the desalting step, analyte retained on the cartridge was eluted with solvent B to the mass spectrometer at a flow rate of 0.4 mL/min for 5 s. Adding another 0.5 s from the reequilibration step, the entire sampling cycle was 9 s per well, which reduced the sample analysis time by at least 20-fold compared with the standard LC-MS analysis.
Cytochrome P450 Inhibition Assays
CYP450 inhibition profiling was evaluated by quantification of drug substrate metabolism to specific products known to be catalyzed by CYP450 isozymes present in pooled human liver microsomal fractions. Phenacetin-O-deethylation and tacrine-1-hydroxylation are catalyzed by CYP1A2; paclitaxel 6α–hydroxylation is catalyzed by CYP2C8; tolbutamide methyl-hydroxylation is catalyzed by CYP2C9; S–mephenytoin–4′–hydroxylation is catalyzed by CYP2C19; bufuralol–1–hydroxylation is catalyzed by CYP2D6; testosterone-6β–hydroxylation and midazolam–1′–hydroxylation are catalyzed by CYP3A4. To increase the assay throughput, multiple substrates were divided and mixed into two cocktails for the HLM incubation. The first substrate cocktail contained tacrine (CYP1A2), tolbutamide (CYP2C9), bufuralol (CYP2D6), and midazolam (CYP3A4). The second substrate cocktail contained testosterone (CYP3A4), paclitaxel (CYP2C8), and mephenytoin (CYP2C19).
Compounds were delivered from Exelixis Compound Repository in 100% DMSO at 10 mM in 384-well microtiter plates. Serial dilution of test compounds in 100% DMSO was carried out on a Bravo system (Agilent Technologies, Santa Clara, CA) with a dilution factor of 2.5. Diluted compounds (100 nL) were transferred to 384-well clear microtiter plates (Greiner, Monroe, NC) by a low-volume liquid-dispensing instrument (HummingBird; Digilab, Holliston, MA). All assay components were prepared in 50 mM potassium phosphate buffer, pH 7.4. The assays were initialized by adding 10 µL of cocktail substrates and 10 µL of pooled HLM prepared in the presence of 1 mM cofactor NADPH by a Multidrop Combi liquid dispenser (Thermo, Waltham, MA). The final assay volume is 20 µL with a final DMSO concentration at 0.5% in reaction mixture. Reaction mixtures were shaken for 15 min in a 37°C incubator. At the end of the incubation period, reactions were quenched by the addition of 30 µL 100% acetonitrile with 0.1% formic acid to samples. Our internal standard, bucetin, was present in the quench solution. Quenched samples were cooled to 4°C and centrifuged at 2500 g for 15 min. To minimize signal interference from precipitated protein, autosampler needles were set at a height about 2 mm from the well bottom. The assay plates were then used directly for sample injection by either RF-MS or LC-MS analysis. The assay scheme is illustrated in Figure 1 .
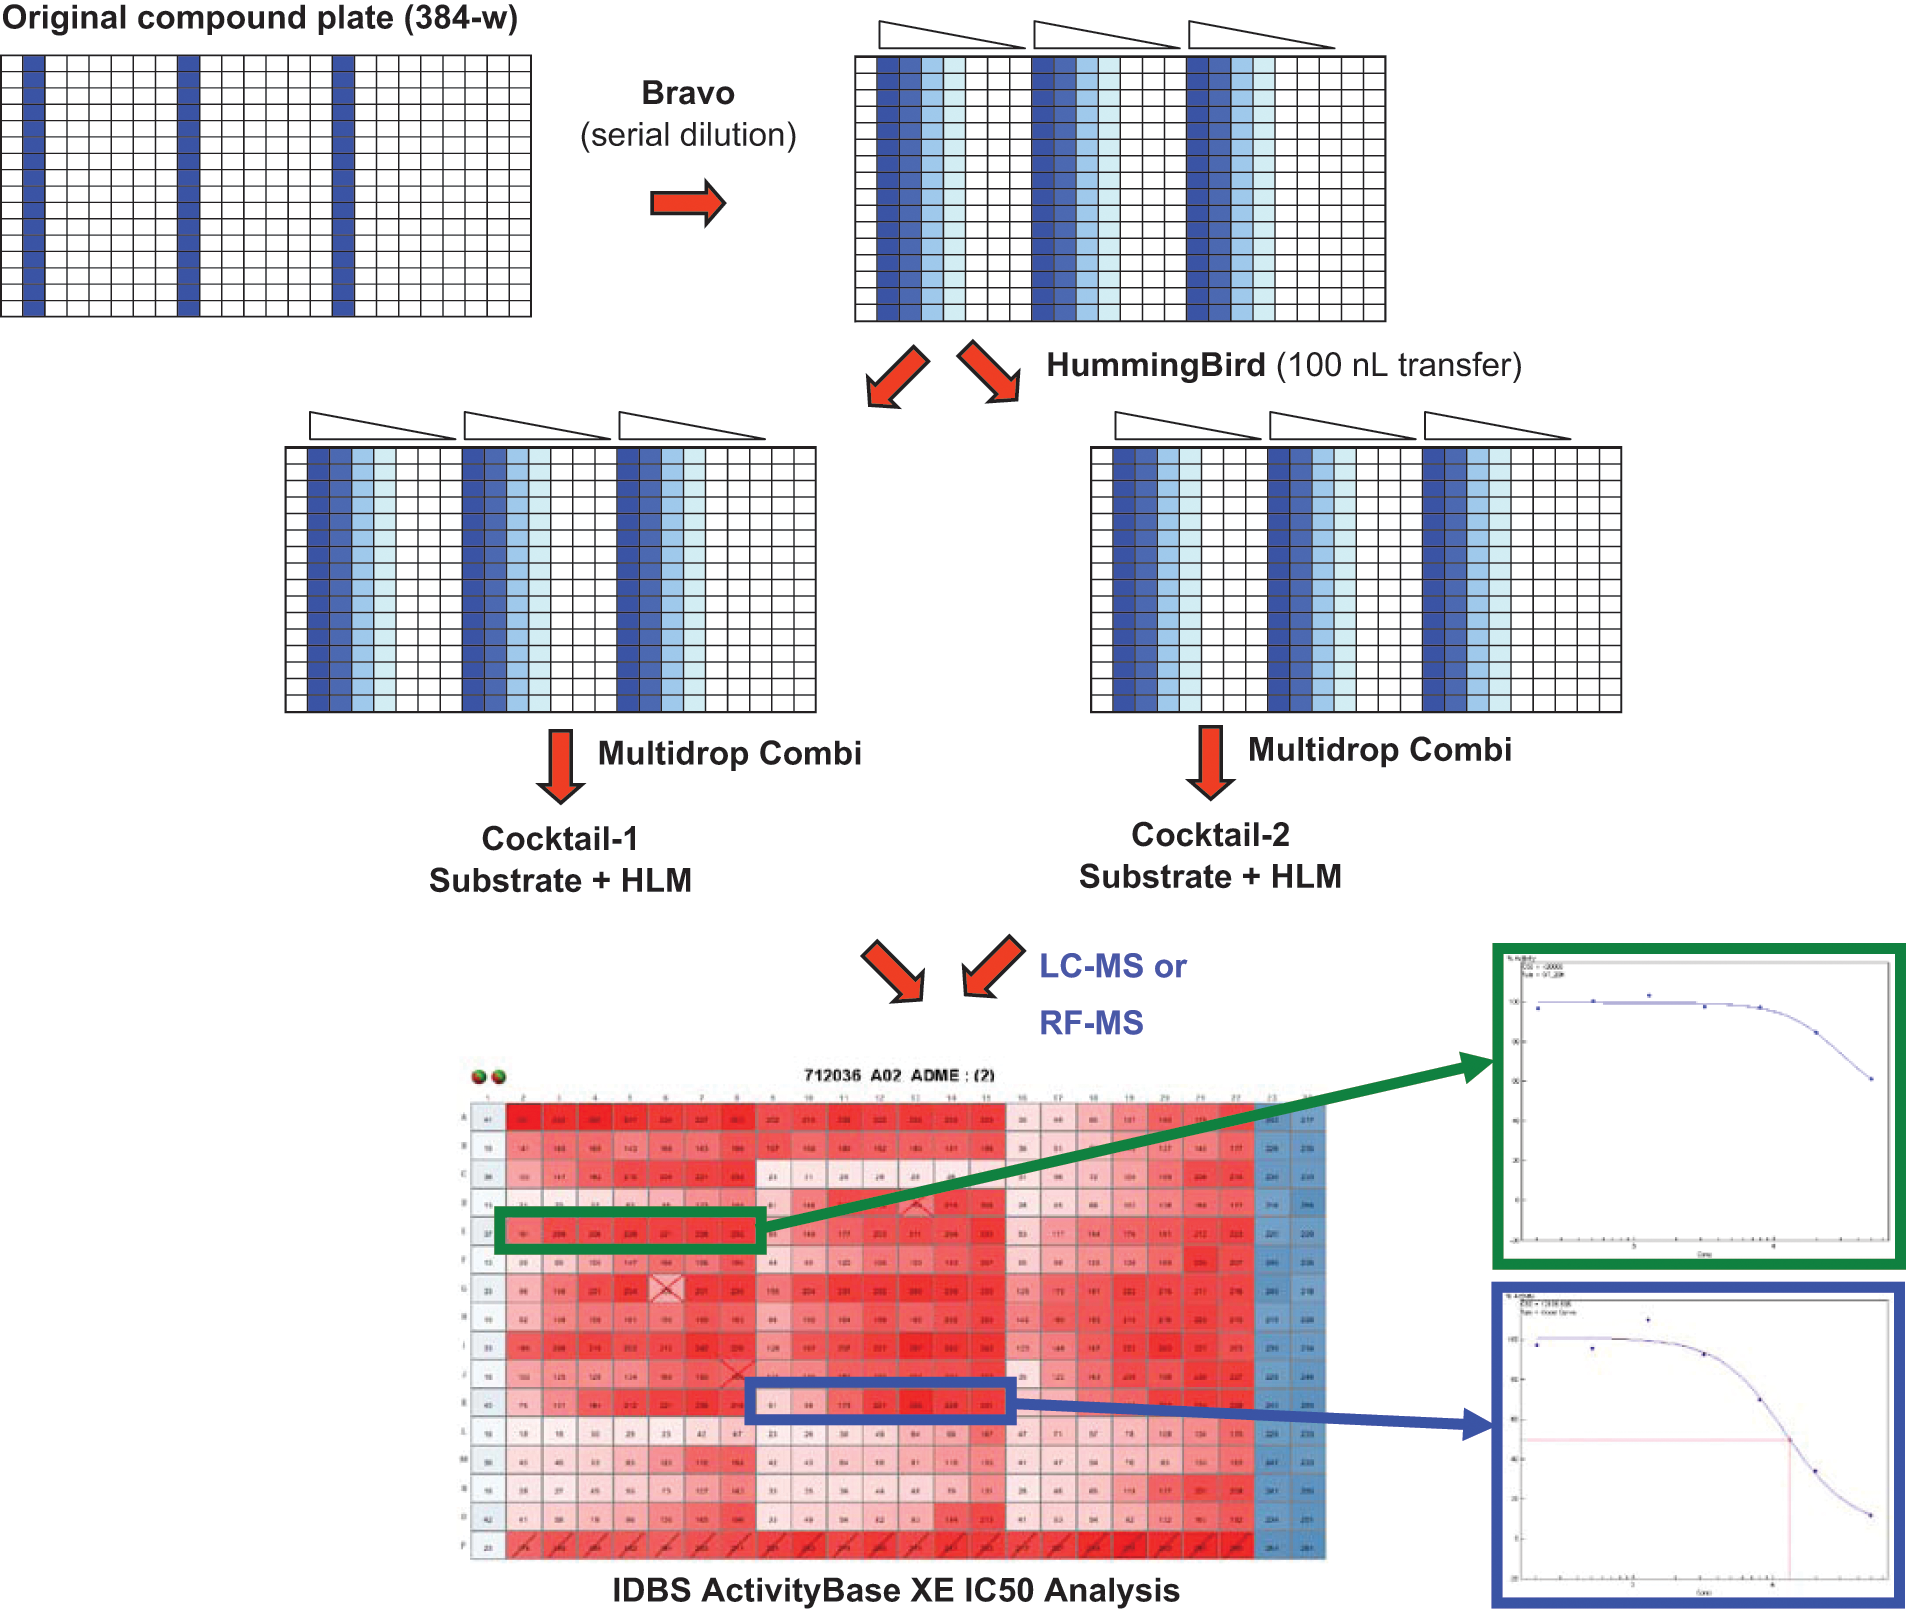
Assay scheme for the 384-well cocktail CYP450 inhibition assay. Liquid-handling systems such as Bravo, HummingBird, and Multidrop Combi are used for serial dilution, transfer, and reagent addition.
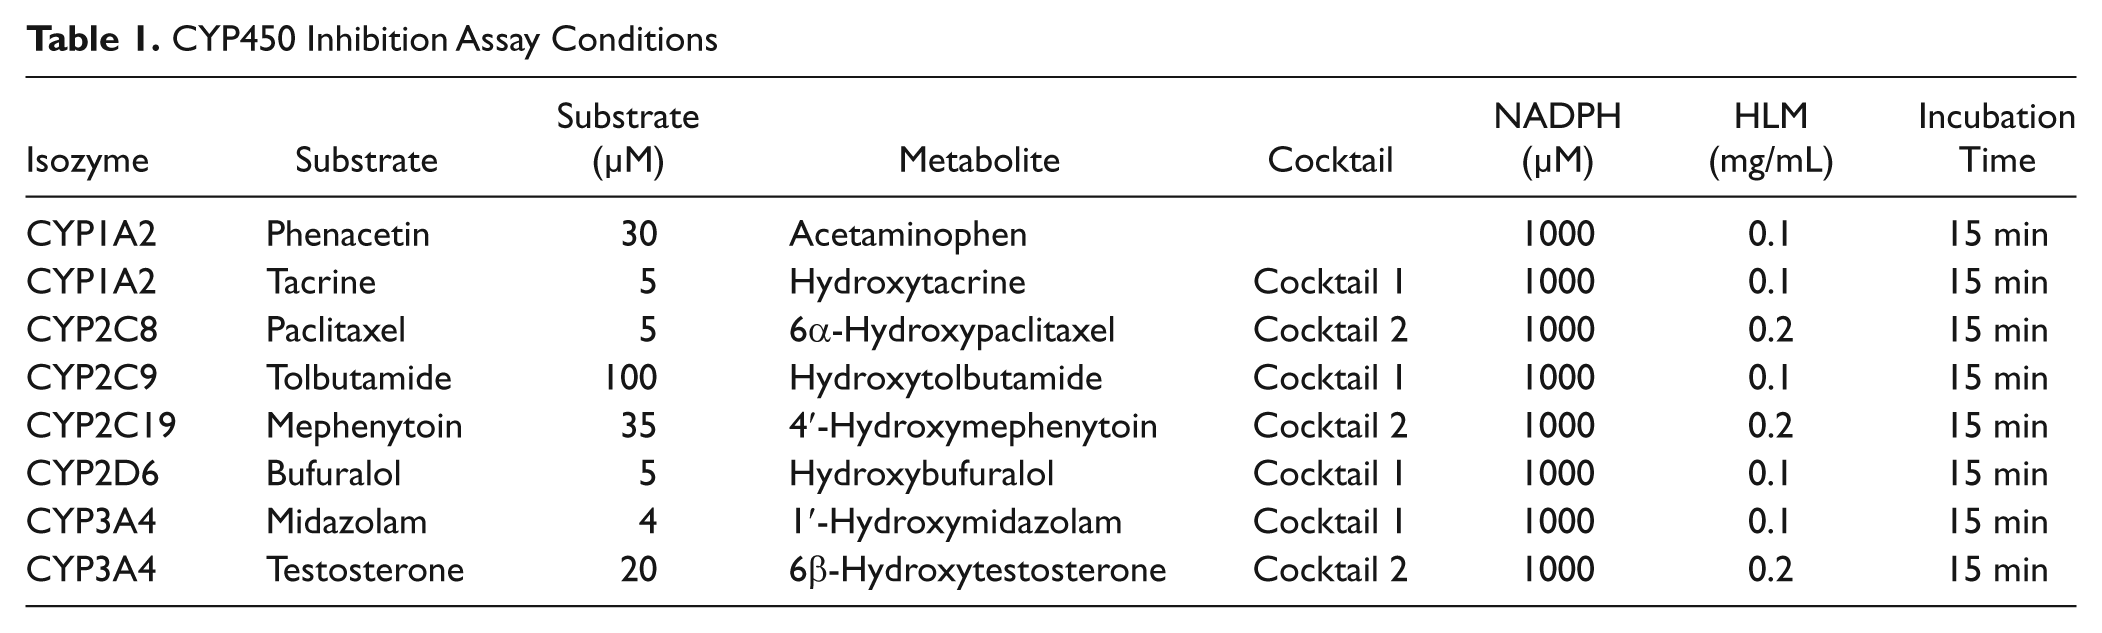
Reaction and analysis conditions were optimized for all CYP450 isozymes to ensure linearity in metabolite formation, and they are summarized in Table 1 . The KM values of all seven substrates were determined, and substrate concentrations proximal to their KM values were used for the reaction. The inhibition potential of compounds was evaluated at seven concentrations (0.2–50 µM). Enzyme activity was calculated based on the quantification of the metabolite signal. IC50 values were calculated by nonlinear regression using a four-parameter sigmoidal curve fit equation in IDBS ActivityBase XE (Guildford, UK).
CYP450 Inhibition Assay Conditions
CYP450 Compound Interference Experiments on RF-MS System
Compound interference experiments were carried out similarly to the standard CYP450 inhibition assays, except that the substrate and HLM were not directly added to the compound plate for reaction incubation. Instead, cocktail substrates were incubated with HLM in the presence or absence of 1 mM NADPH in bulk without inhibitors at 37°C. After 15 min, quenching solution was added to the reaction mixture at the same ratio (2:3) as the standard assays and mixed well to stop the reaction. Liquid-handling instrument Multidrop Combi was then used to transfer 50 µL total reaction mixture to the compound plates, which contained 100 nL compounds dispensed by a HummingBird system. The resulting plates were then centrifuged in the same way as regular assay plates and analyzed on the RF-MS instrument. The potential interference is measured by the ratios of the metabolite peak areas determined by MS in the presence and absence of the compound.
CYP450 Time-Dependent Inhibition: IC50 Shift Experiments
Pooled HLM (1.5 mg/mL) were incubated with test compounds in potassium phosphate buffer (pH 7.4; 50 mM) in the absence and presence of 1 mM NADPH. Multiple concentrations of inhibitors were used such that the range included the concentration of 10 times the IC50 measured for reversible inhibition. Two known CYP3A4 inhibitors, verapamil and ketoconazole, were used in the experiments as control time-dependent inhibition (TDI) inhibitor and non-TDI inhibitor, respectively. These preincubations (i.e., the “inactivation incubation”) with 1.5 mg/mL human liver microsomes were carried out for 30 min at 37°C. Vehicle controls were performed to account for any decrease in enzyme activity caused by incubation under these conditions. Following the inactivation incubation, a portion of the inactivation mixture (10 µL) was added to one of two CYP450 substrate mixtures containing cocktail CYP450 substrates in 90 µL of potassium phosphate buffer containing 1 mM NADPH for measurement of CYP450 activities (i.e., the “activity incubation”). The experimental parameters of the activity incubation are similar to the regular CYP450 inhibition assay, except the final HLM concentration is 0.15 mg/mL for all reactions. Incubations and sample analysis by RF-MS or LC-MS were carried out using the standard methods for CYP450 assay analysis described above.
Microsomal Stability Assays
Microsomal oxidation of test compounds in the presence of mouse, rat, dog, monkey, or human liver microsomal fractions was conducted in 96-well microtiter plates. Test compounds were incubated in duplicate at 37°C for 30 min in the presence of liver microsomes and NADPH. Reaction mixtures (75 µL) contained a final concentration of 5 µM test compound, 0.05% DMSO, 0.5 mg/mL microsomal protein, and 1 mM NADPH in 100 mM potassium phosphate, pH 7.4 buffer. Control incubations contained the full complement of enzyme and substrate but no NADPH. All test sets included reference CYP450 substrates with different metabolic stabilities to verify assay performance. Reactions were terminated by the addition of 150 µL cold acetonitrile. Compounds were detected using the multiple reaction monitoring (MRM) mode on the mass spectrometer, and the tuning process was automated using the DiscoverQuant software (AB Sciex). Concentrations of test compounds were determined by RF-MS or LC-MS analysis using the standard methods for CYP450 assay analysis described above. The extent of metabolism was calculated as the disappearance of the test compound as compared with the no-NADPH control sample.
Results and Discussion
CYP450 Inhibition Assays with RF-MS
We established an SPE-based RapidFire sampling system linked to an API mass spectrometer in October 2007. Sampling precision of the RapidFire system was tested by injecting midazolam and the internal standard. The RF-MS system gave a coefficient of variation of less than 5% as measured by the relative variation normalized to the internal standard (data not shown). RF-MS analysis is fast and easy. On average, the RapidFire system injects samples every 9 s. Aspirating directly from assay plates eliminated a supernatant transfer step from assay plates to fresh plates. The potential for sample carryover was investigated by injecting blanks between reaction samples. For all the analytes, carryover was at an acceptable level for initial evaluations: less than 3%, even with only a short elution step for 5 s. Longer washes can be readily implemented to reduce carryover to <1% (data not shown).
According to the Food and Drug Administration (FDA) guidance, the preferred reaction for monitoring CYP1A2 activity is phenacetin O-deethylation. 12 However, when reaction samples for CYP1A2 with phenacetin as the substrate were analyzed on the RapidFire system, a poor signal window was observed. It has been reported that phenacetin itself undergoes in-source fragmentation to yield a chemical structure identical to its CYP1A2 product, acetaminophen. 5 On the LC-MS system, phenacetin and acetaminophen can be chromatographically separated before mass spectrometry analysis. 5 Because of the lack of separation on the RF-MS system, phenacetin and acetaminophen co-elute and raise the background significantly. A poor correlation between RF-MS and LC-MS was therefore observed for the phenacetin O-deethylation reaction by CYP1A2 ( Fig. 2A ), indicating that the CYP1A2 reaction using phenacetin cannot be run using RF-MS. We thus developed a CYP1A2 assay using an alternative substrate, tacrine, which is an FDA-acceptable substrate of CYP1A2. 12 Figure 2B shows that the IC50 values for various compounds did not change significantly when tacrine replaced phenacetin as the CYP1A2 substrate.

Comparison of IC50 values for CYP1A2 inhibition between (
CYP450 cocktail assays with seven substrates and pooled HLM have been developed: CYP1A2 assay using tacrine, CYP2C8 assay using paclitaxel, CYP2C9 assay using tolbutamide, CYP2C19 assay using mephenytoin, CYP2D6 assay using bufuralol, and two CYP3A4 assays using midazolam and testosterone, respectively. It has been reported that CYP3A4 contains a large substrate-binding pocket,25,26 which can accommodate different substrates at distinct sites. Therefore, the FDA recommends testing at least two structurally unrelated substrates for CYP3A4. 12 To prevent the interference from the two CYP3A4 substrates, the seven CYP450 reactions were divided into two cocktail assays: cocktail 1 (CT1) with tacrine (CYP1A2), tolbutamide (CYP2C9), bufuralol (CYP2D6), and midazolam (CYP3A4) and cocktail 2 (CT2) with paclitaxel (CYP2C8), mephenytoin (CYP2C19), and testosterone (CYP3A4).
Samples from CYP450 inhibition experiments were analyzed on both RF-MS and LC-MS. Good correlation was observed between the IC50 values generated by the two analytical methods ( Fig. 3 ) for tacrine (CYP1A2), paclitaxel (CYP2C8), tolbutamide (CYP2C9), mephenyltoin (CYP2C19), bufuralol (CYP2D6), and midazolam and testosterone (CYP3A4), with <5% of compounds exhibiting greater than threefold differences in the IC50 values.
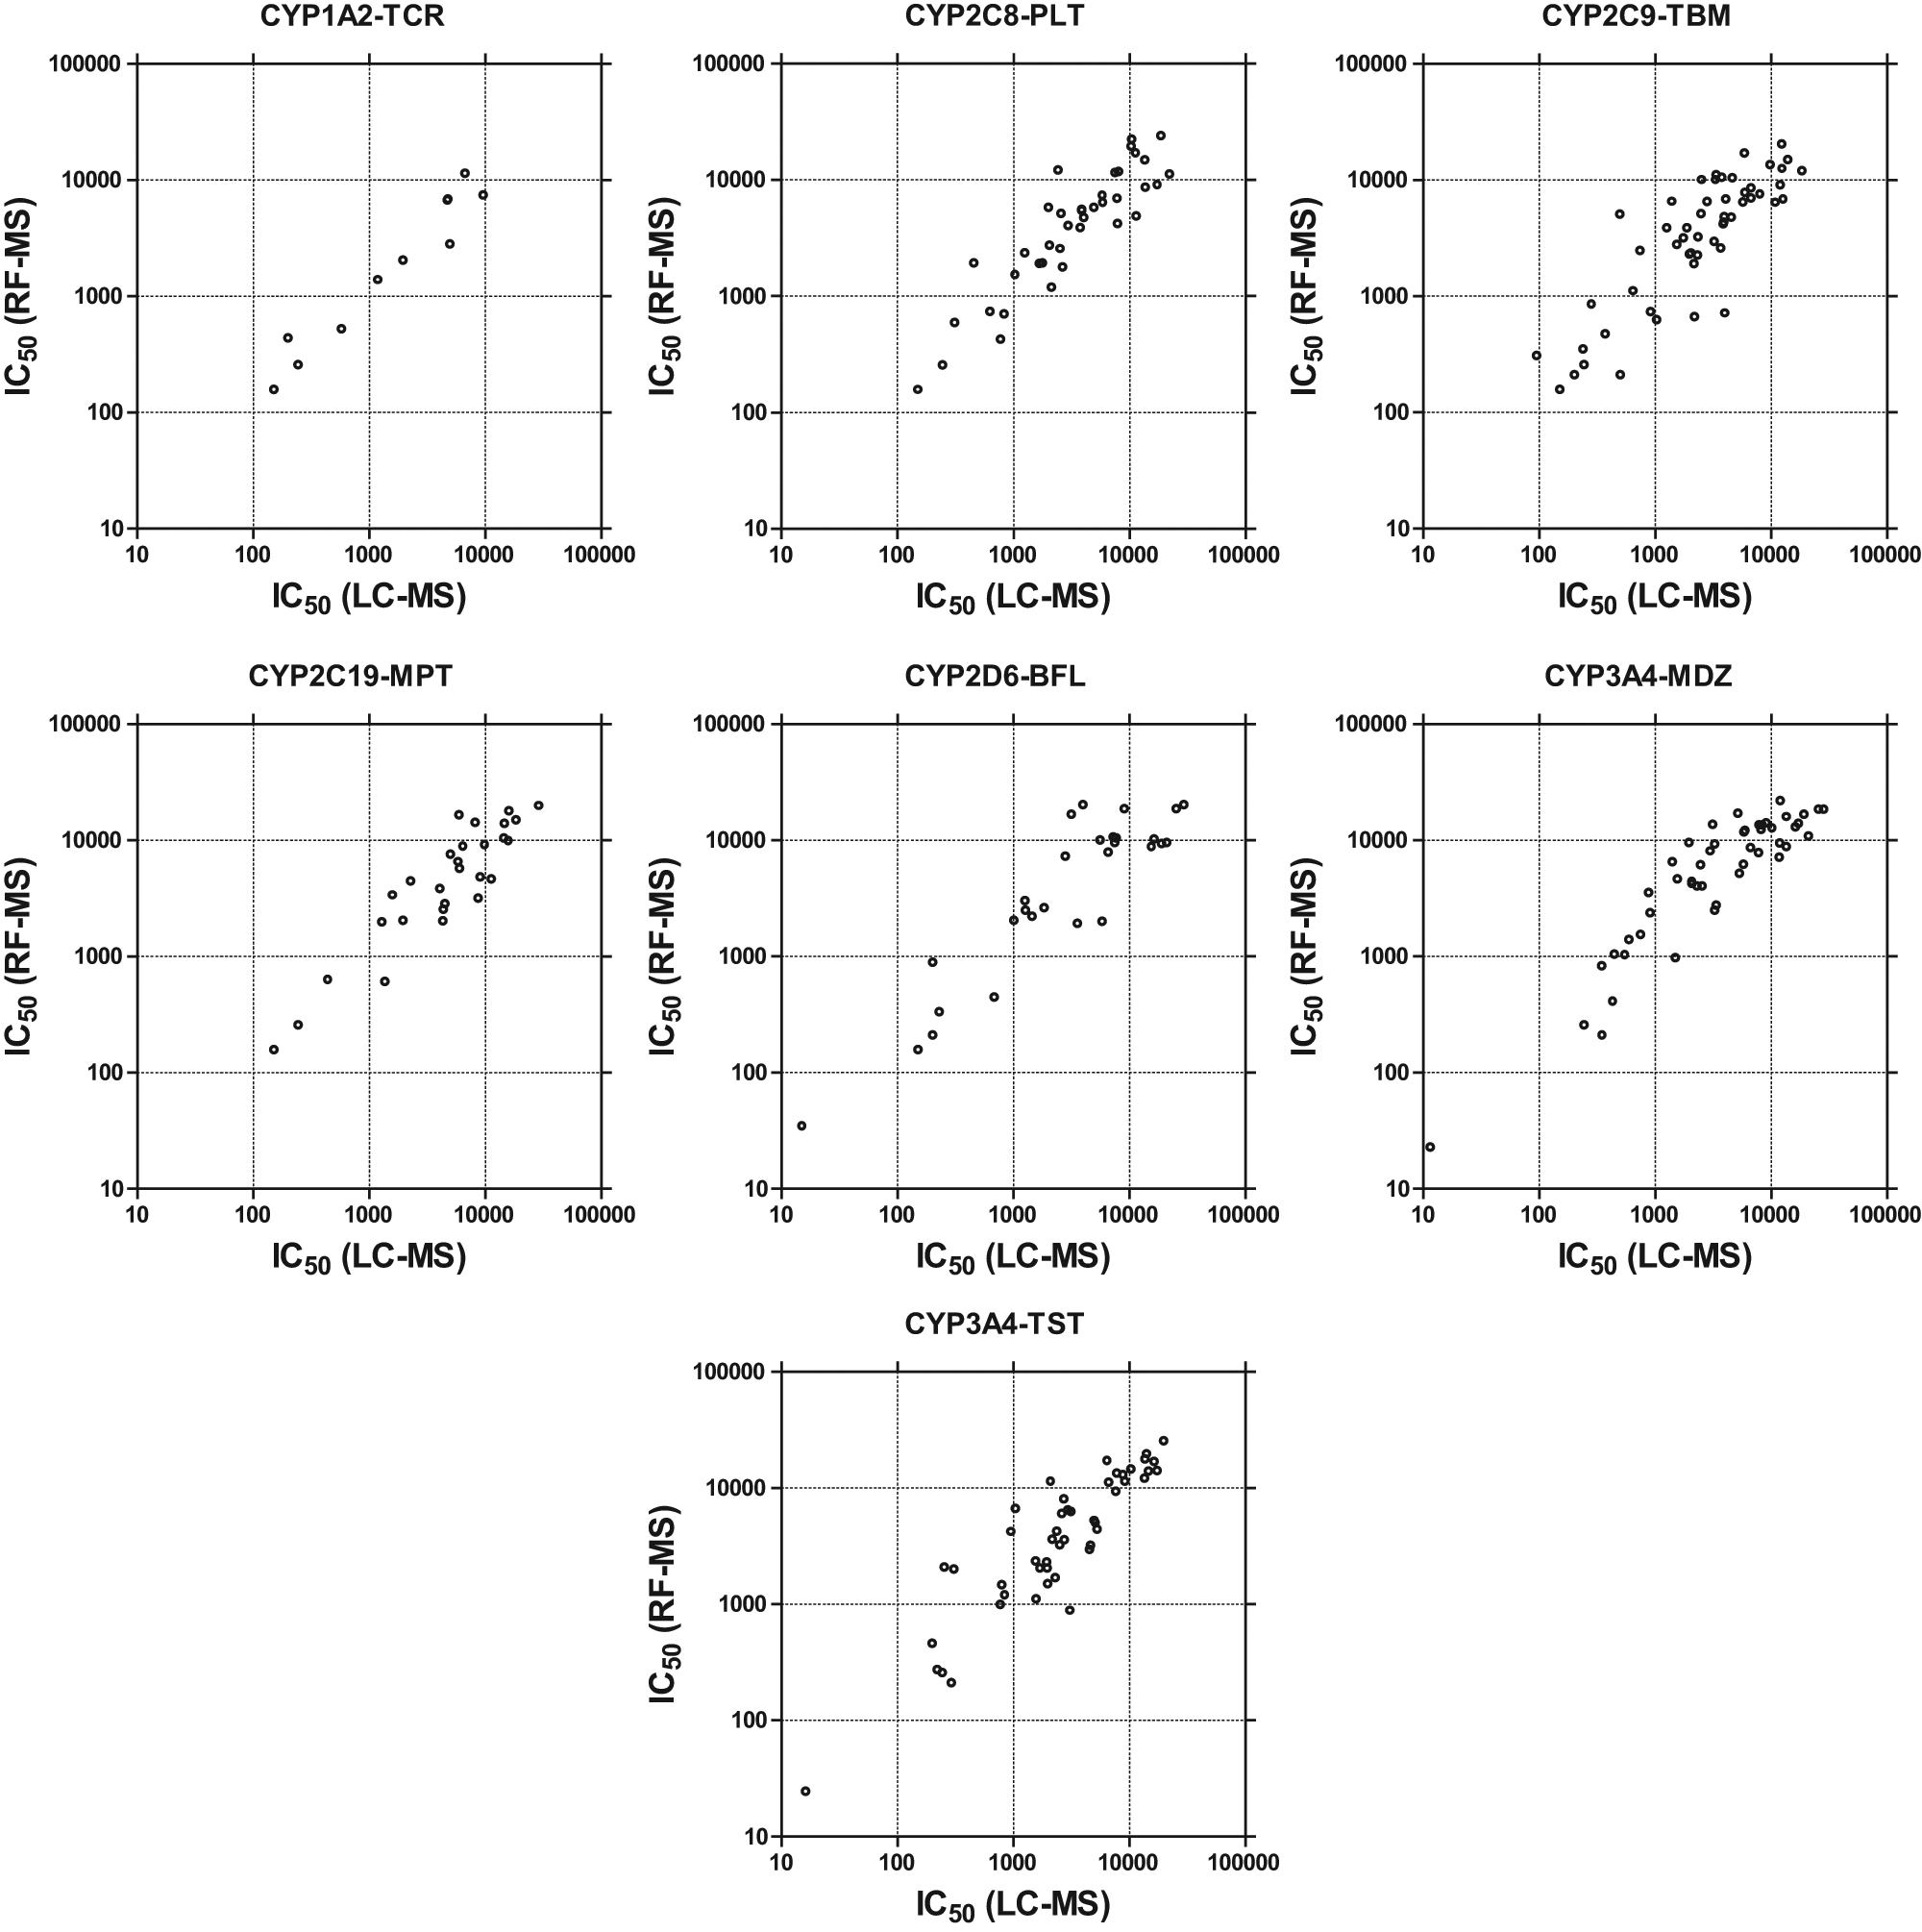
IC50 correlation plots comparing LC-MS and RF-MS results for various Exelixis compounds in multiple CYP450 inhibition assays: CYP1A2-tacrine (TCR), CYP2C8-paclitaxel (PLT), CYP2C9-tolbutamide (TBM), CYP2C19-mephenytoin (MPT), CYP2D6-bufuralol (BFL), CYP3A4-midazolam (MDZ), and CYP3A4-testosterone (TST).
CYP450 TDI Assays Using RF-MS
Because of its much higher throughput as compared with the regular LC-MS analysis, the RapidFire system is also useful for the analysis of a large number of samples in other ADME assays in support of the lead validation and optimization processes. We implemented RF-MS as a first-line tool for screening compounds for CYP450 TDI. Examples of three known CYP3A4 inhibitors are shown in Figure 4 . Verapamil and mibefradil are time-dependent inhibitors of CYP3A4, whereas ketoconazole is a non–time dependent inhibitor of CYP3A4. They were tested in a CYP450 TDI assay using an IC50 shift method. Samples were analyzed on either RF-MS or LC-MS formats. Similar IC50 shifts were observed for both systems. For example, verapamil, a known time-dependent inhibitor of CYP3A4, exhibited a shift in IC50 values from 13 µM (without preincubation) to 1 µM (with preincubation) as determined by RF-MS, consistent with the observed shift by LC-MS ( Fig. 4 ). These results demonstrate that RF-MS can replace LC-MS for analysis of CYP450 TDI. Similarly, if a higher throughput is needed, samples from other CYP450 assays, such as induction assays, can also be analyzed by RF-MS.
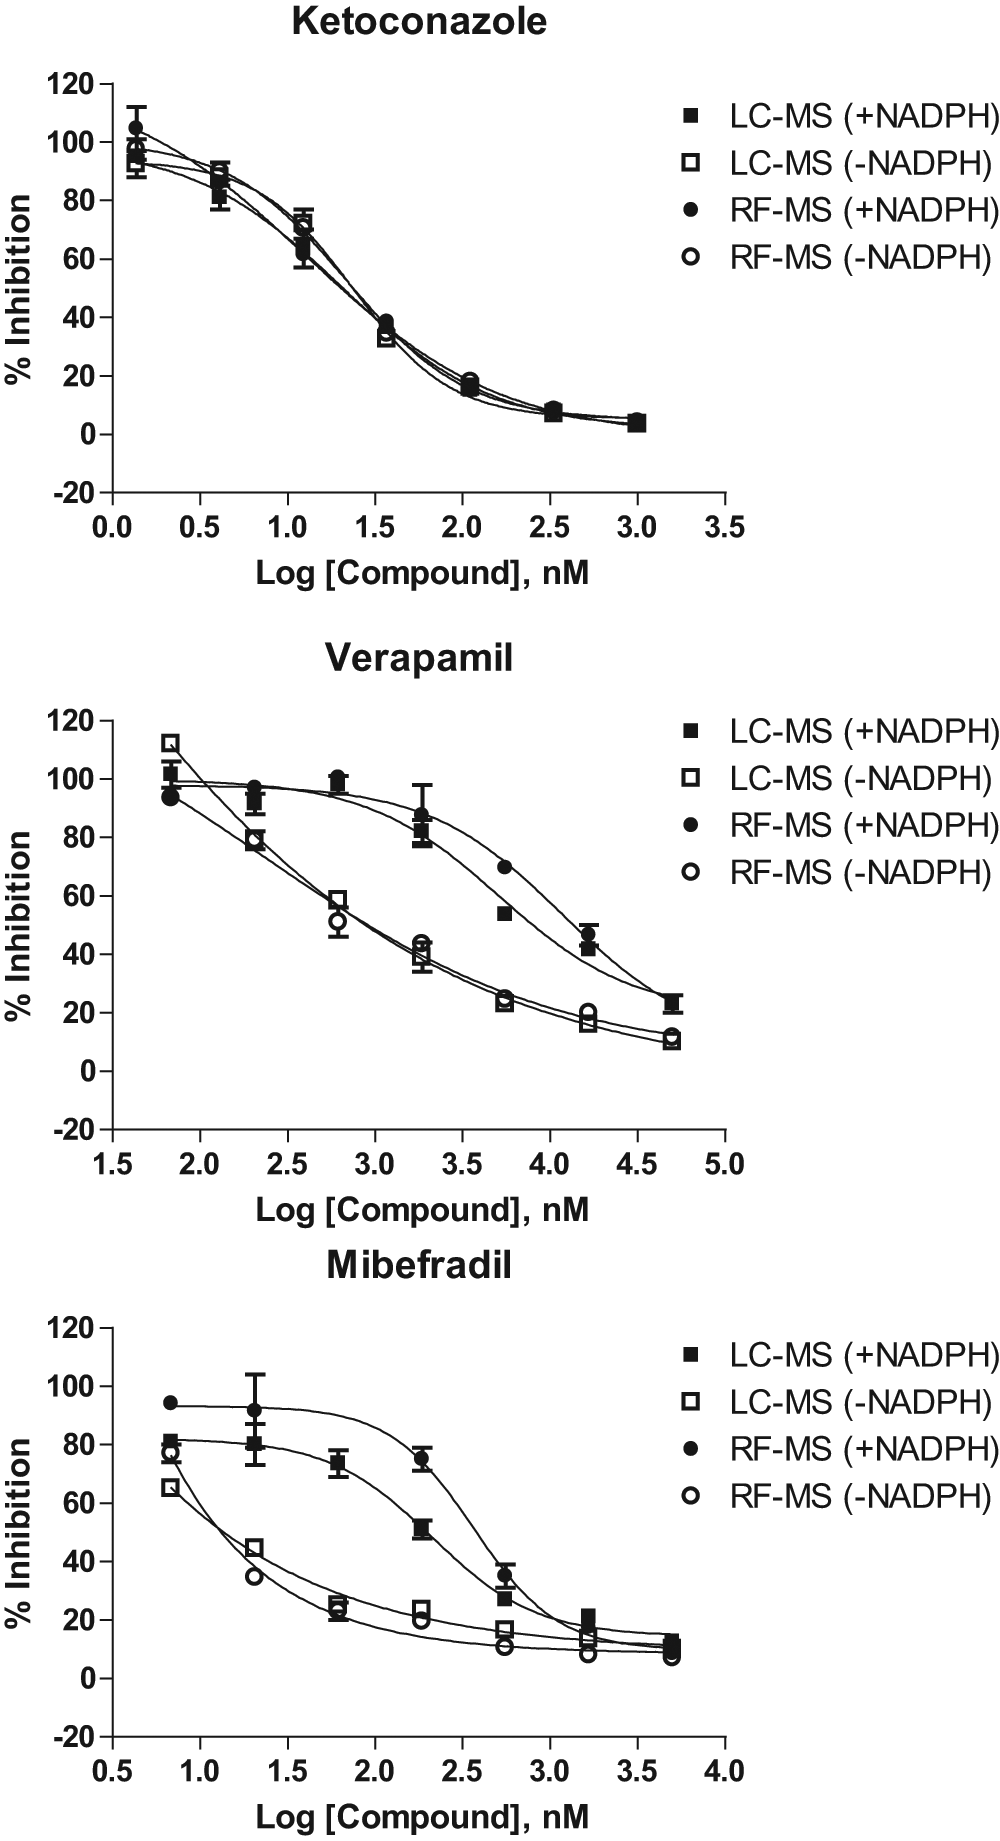
Dose-response plots comparing LC-MS and RF-MS analysis of CYP3A4-midazolam time-dependent inhibition (TDI) assays. Verapamil and mibefradil, two known CYP3A4 TDI inhibitors, show significant IC50 shifts in both LC-MS and RF-MS assays, whereas ketoconazole, a non-TDI CYP3A4 inhibitor, does not exhibit any IC50 shift.
Microsomal Stability Assays Using RF-MS
The RF-MS system can also be used to monitor test compounds in other ADME assays such as metabolic stability and permeability assays. Eighty-two randomly selected compounds were evaluated in the whole-liver microsomal stability assay using the RF-MS system. The same samples were analyzed using both RF-MS and LC-MS formats, and good correlation was observed for the percentage of conversion ( Fig. 5 ). For CYP450 inhibition assays, as soon as an MRM method on the mass spectrometer is established, the same method can be used to analyze samples tested with different compounds. However, for the metabolic stability assay, various compounds with diverse chemical structures need to be monitored by mass spectrometry. Therefore, each of the test compounds needs to be tuned to generate a specific MS method, which becomes the rate-limiting step for the whole process. The benefit of the higher speed of the RF-MS system over LC-MS becomes insignificant if it takes hours or even days to complete compound tuning. We therefore implemented the DiscoverQuant program for automatic compound tuning. It takes approximately 6 min to tune each compound and requires only 10 ng of material. We have had 100% success rate so far with >4000 various diverse chemical compounds since the program was installed in 2009.
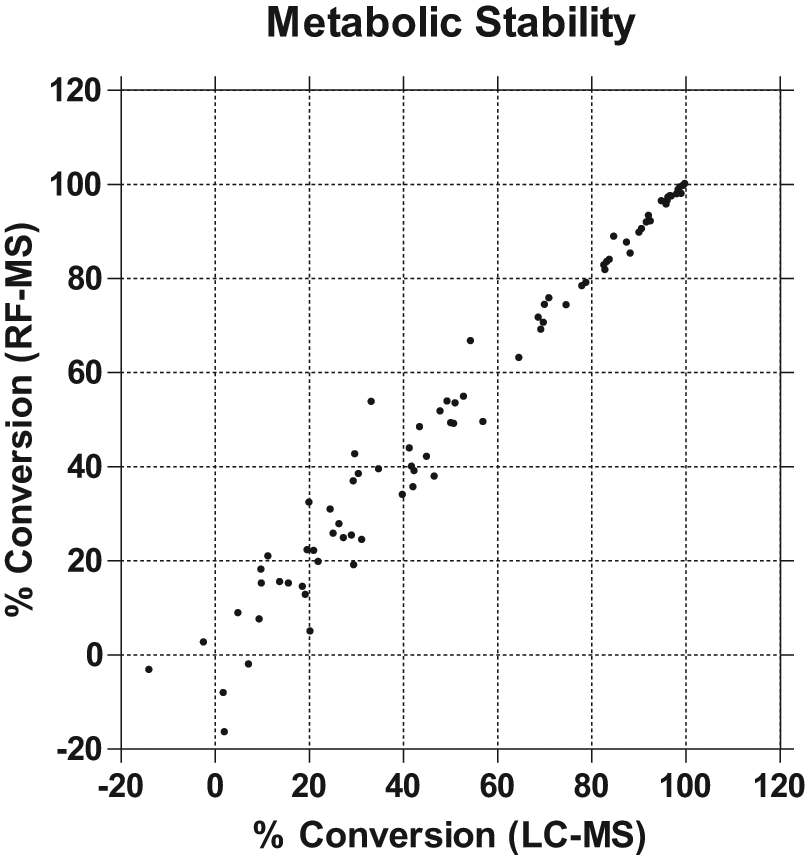
Correlation plot comparing the percentage of conversion of 82 randomly selected Exelixis compounds with LC-MS and RF-MS analysis in a liver microsomal metabolic stability assay.
Potential Assay Interferences Associated with RF-MS
There are several potential sources of assay interference as compared with the standard LC-MS method. The main difference is that RF-MS lacks rigorous chromatographic separation of the final metabolites from the parent, other metabolites, and the test compounds. As a result, any chemical compounds that can produce an identical MS/MS transition would potentially interfere with the assay, mostly as a potential false-negative. On the other hand, the high testing compound concentration may suppress the ionization process of the metabolites, and thus the compound may appear as a false-positive.
For testosterone (CYP3A4), a few outliers were observed with elevated IC50 values in the RF-MS format as compared with LC-MS. A chemical structure search demonstrated that they belonged to the same chemical scaffold. When the assay samples were analyzed on LC-MS, multiple chromatographic peaks were observed ( Fig. 6A ) with an MRM method tuned for 6β-hydroxytestosterone. It has been reported that testosterone can be oxidized to different hydroxytestosterone metabolites, with mono-hydroxylation occurring at various positions.27–29 A commercial 6β-hydroxytestosterone standard was tested and confirmed to elute at 1.78 min (marked in Fig. 6A ). The size of this peak decreased in a dose-dependent fashion, indicating significant CYP3A4 inhibition ( Fig. 6B ). However, the sizes of two additional peaks, corresponding to at least two additional mono-hydroxytestosterone products, increased in a dose-dependent fashion, potentially as a result of CYP450 activation. Because of the lack of separation on the RapidFire system and the lack of a selective MRM method, RF-MS cannot specifically monitor any individual mono-hydroxytestosterone product. Rather, it detects the sum of all mono-hydroxytestosterone metabolites that produce the same MS/MS transition. The sum of all detectable mono-hydroxytestosterone species therefore appeared to be stable over a range of inhibitor concentrations ( Fig. 6B ), explaining why those compounds appeared inactive in the RF-MS format.
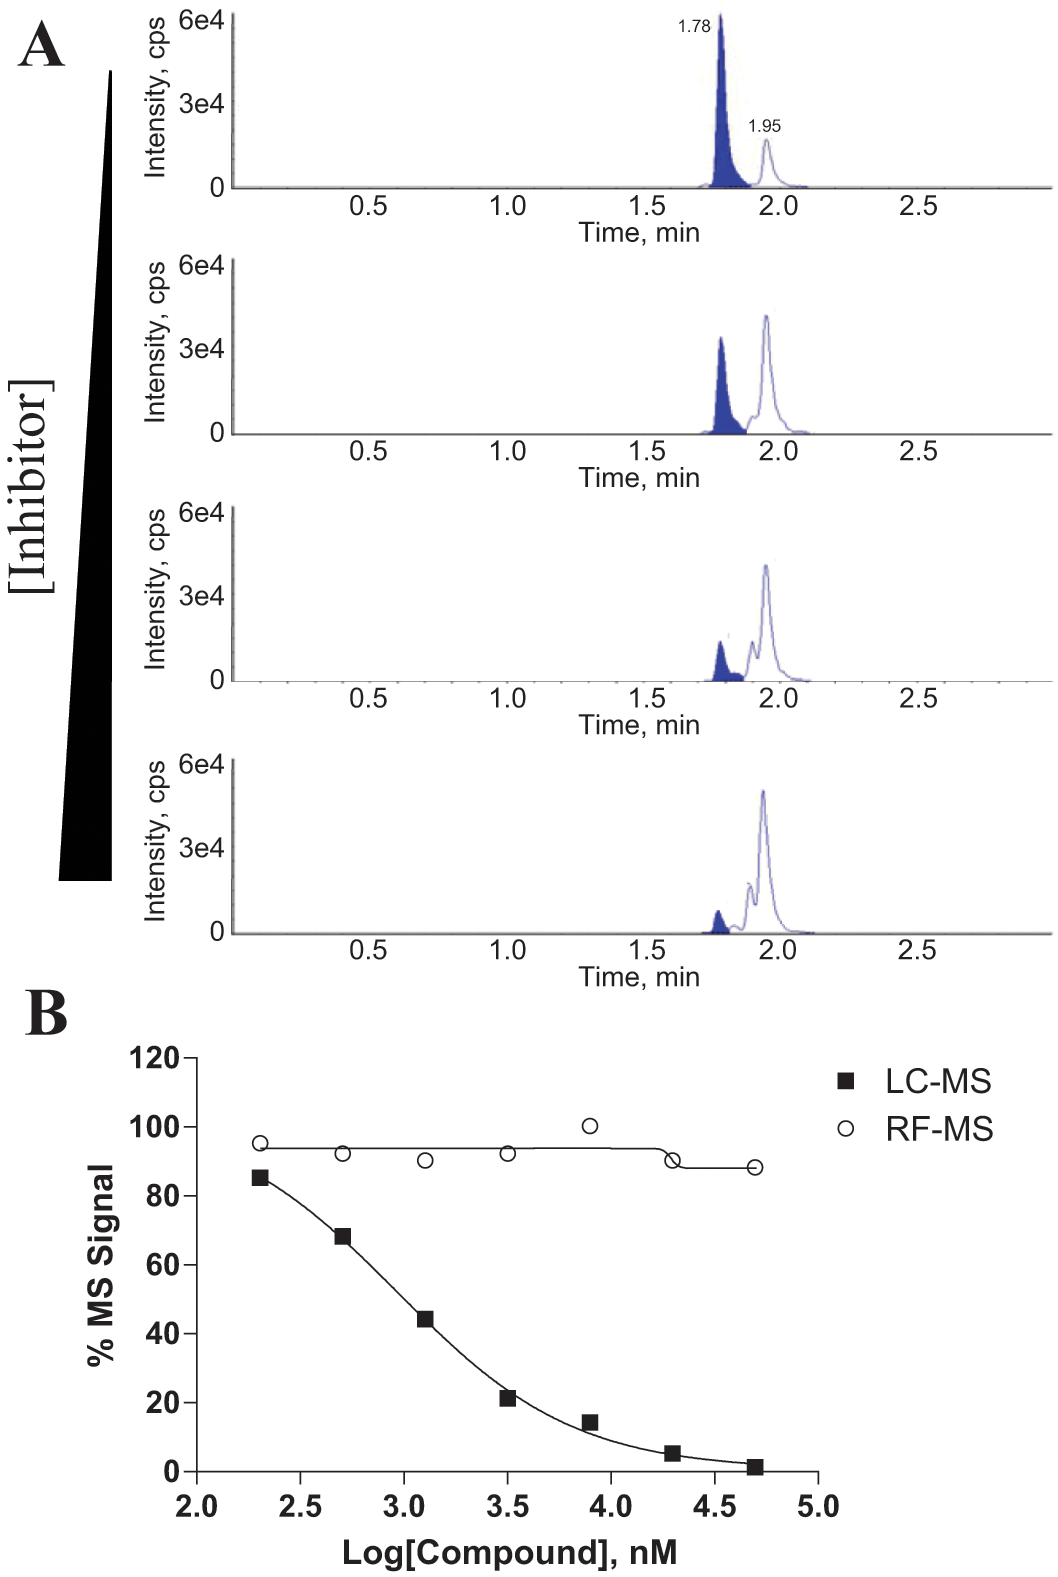
Formation of multiple mono-hydroxyl testosterone products by CYP3A4 can skew the IC50 values obtained by RF-MS. (
Because of the lack of chromatographic separation, RF-MS relies on the selectivity of MRM methods on the mass spectrometer for specific analyte identification. Our MRM method uses a parent and daughter ion transition of m/z 305.2 → 269.2 to monitor 6β-hydroxytestosterone. The same transition was used in other publications.30–33 If a more specific MRM method could be found for 6β-hydroxytestosterone, it would provide the RapidFire system with the needed selectivity. An attempt was made to identify a more specific and sensitive MRM method for 6β-hydroxytestosterone but was unsuccessful.
A follow-up study was carried out by incubating one of the problematic compounds used above with either HLM in the presence of CYP3A4 inhibitor ketoconazole or recombinant CYP3A4 enzyme. Dose-dependent activation of two other mono-hydroxytestosterone products was observed with the recombinant CYP3A4 enzyme, whereas no activation was observed with HLM in the presence of ketoconazole (data not shown). These results suggest that CYP3A4 is the enzyme that is activated by this compound.
Further analysis of the compounds used above has revealed that they tend to have low molecular weights (<300 Da). Given the large substrate-binding pocket of CYP3A4, it is possible that these test compounds may bind to the CYP3A4 binding pocket in a way that changes the position or orientation of testosterone binding to CYP3A4, which leads to reduction of 6β-hydroxylation and activation of hydroxylation at other sites.
Because of the lack of chromatographic separation, the RF-MS method may be more susceptible to interference from test compounds. For CYP450 assays, incubation conditions were optimized so that only a small amount of substrate was converted into products for detection by mass spectrometry to prevent substrate depletion or product inhibition. Another potential source of interference relates to the potential for ion suppression of low amounts of product by the presence of test compounds at high concentration (up to 50 µM). A control experiment was carried out to investigate how much, if any, ion suppression was present on the RF-MS system. After surveying 336 test compounds randomly selected from the Exelixis compound library, we did not find any compounds showing significant ion suppression (>50% inhibition of enzymatic activities) for any of the seven CYP450 products and our internal standard at the highest testing concentration ( Fig. 7A ). A separate analysis of the RF-MS data of several thousand diverse compounds showed minimal cases of ion suppression, with less than 0.5% of the compounds exhibiting >50% reduction of the MS signals of the reference standards (data not shown). Interestingly, a few compounds in Figure 7A demonstrated dose-dependent elevation of signal in both compound interference experiments and standard inhibition reaction tests on RF-MS. Analysis of those pure compounds revealed that they exhibited cross-talk in MRM transitions of hydroxymephenytoin or hydrotacrine. Use of the standard LC-MS method was able to eliminate compound interference from the cross-talk at the mass spectrometry detection level ( Fig. 7B ). However, the elevated signal on the RF-MS format will mask any potential CYP450 inhibition, as discussed above.
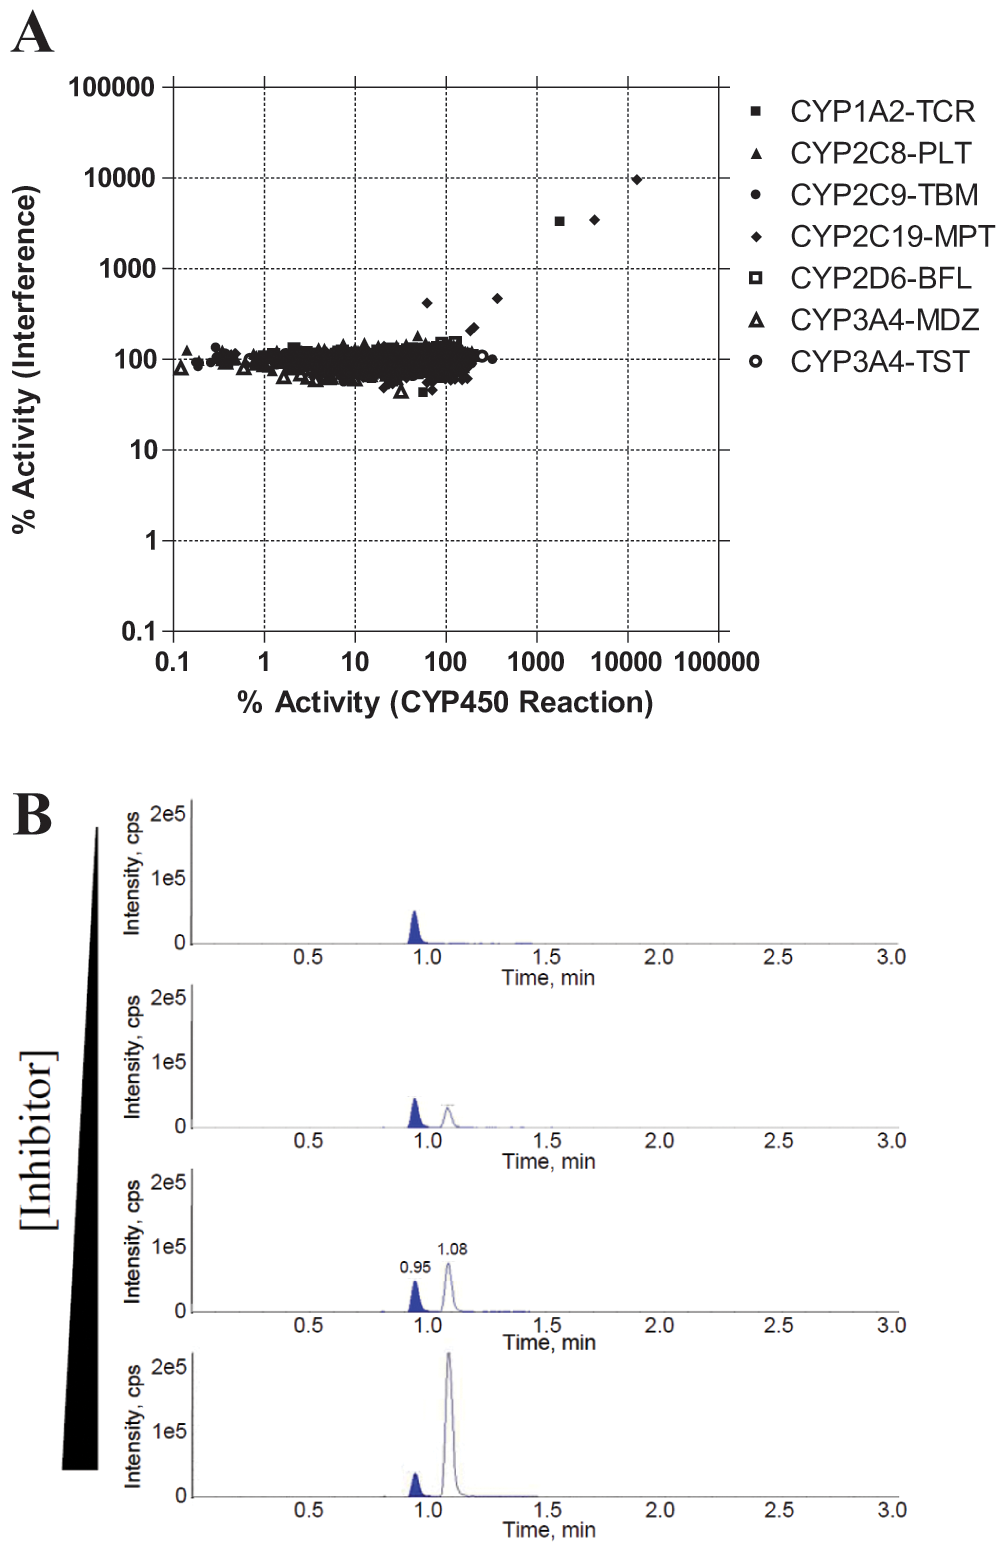
(
Both hydroxymephenytoin and hydrotacrine are relatively small molecules. We compared their molecular weights with those of the test compounds that showed cross-talk. All of the compounds have much higher molecular weights. It is possible that interfering compounds might undergo in-source fragmentation, like the CYP1A2 substrate phenacetin. Because activation in a CYP450 inhibition assay is theoretically rare, protocols can be implemented to ensure that any observation of activation will be flagged so that subsequent LC-MS verification can be performed.
In summary, a high-throughput ADME profiling system has been implemented using the RapidFire instrument. When coupled with mass spectrometry, the RapidFire system provides the throughput required to analyze a large number of early ADME samples while maintaining high data quality. The increased capacity enables quantitative data analysis (i.e., IC50) in the CYP450 inhibition assays, providing a more accurate way to rank compounds. With RF-MS, we were able to switch from a single concentration determination (2 µM) to a seven-concentration dose response in the routine CYP450 inhibition assays. We found the resolution (i.e., the ability to rank compounds correctly) improved dramatically, especially for compounds with low (<30%) and high (>75%) inhibition at the single concentration. The results from RF-MS need to be assessed for unusual signals, with special attention being paid to the potential interference of the MS signals by the test compounds and other reaction products. At Exelixis, we use RF-MS as the primary screening tool to evaluate rapidly a large number of compounds in multiple ADME assays. Confirmation with LC-MS for key compounds is carried out routinely in lead validation and optimization processes to avoid potential surprises. We recommend that the RF-MS method be used to screen compounds during the bulk of the hit-to-lead process. When the lead series are to be selected, key compounds from each series should be confirmed with the LC-MS method. The same dual approach with RF-MS providing the ongoing routine assay support and LC-MS for confirmation can also be adopted during full lead optimization. We believe that with this combined approach, more quantitative ADME data will be available to establish a rigorous SAR, and a more informed compound selection process can be implemented.
Footnotes
Acknowledgements
The authors thank Dr. Stefan Engst for his early efforts to obtain the RapidFire system, members of New Lead Discovery and Compound Repository at Exelixis for valuable discussions, and Dr. Peter Lamb for comments on the article.
Declaration of Conflicting Interests
The authors declared no potential conflicts of interest with respect to the research, authorship, and/or publication of this article.
Funding
The authors received no financial support for the research, authorship, and/or publication of this article.