
Abstract
Three-dimensional (3D) in vitro microphysiological cultures, such as spheroids and organoids, promise increased patient relevance and therapeutic predictivity compared with reductionist cell monolayers. However, high-throughput characterization techniques for 3D models are currently limited to simplistic live/dead assays. By sectioning and staining in vitro microtissues, researchers can examine their structure; detect DNA, RNA, and protein targets; and visualize them at the level of single cells. The morphological examination and immunochemistry staining for in vitro cultures has historically been done in a laborious manner involving testing one set of cultures at a time. We have developed a technology to rapidly screen spheroid phenotype and protein expression by arranging 66 spheroids in a gel array for paraffin embedding, sectioning, and immunohistochemsitry. The process is quick, mostly automatable, and uses 11 times less reagents than conventional techniques. Here we showcase the capabilities of the technique in an array made up of 11 different cell lines stained in conventional hematoxylin and eosin (H&E) staining, as well as immunohistochemistry staining for estrogen (ER), progesterone (PR), and human epidermal growth factor (Her-2) receptors, and TP53. This new methodology can be used in optimizing stem cell–based models of disease and development, for tissue engineering, safety screening, and efficacy screens in cancer research.
Keywords
Introduction
Laboratory cell culture models are constantly evolving to better mimic the structure and function of tissues and organs in vivo. The reductionist monolayer models of the past century are now being replaced with three-dimensional (3D) models, such as spheroids, organoids, and organ-on-a-chip models. In order for these new microphysiological models to be useful, researchers need to be able to analyze the high-level organization, single-cell morphology, and biomarker expression of the cultures. Furthermore, the analysis methods need to enable the testing of multiple conditions, such as testing many compounds at a time and testing multiple doses of the compound. For precious or scarce samples, researchers would also require multiple readouts from the same sample. Finally, the variability between biological model replicates determines the sensitivity of the models. For example, the high variability of organoid models of the brain has confined them to testing diseases and treatments that elicit profound changes in an all-or-nothing approach. 1 Therefore, a higher-throughput technique which allows for sufficient replicates to be performed, is also required.
The introduction of plate-based spheroid culture techniques, such as hanging-drop plates and ultra-low-attachment plates, has enabled reproducible culture of many uniform spheroid cultures for compound testing. This has resulted in increased adoption of spheroid screens2,3 for safety and efficacy assessments in the commercial and regulatory setting.4,5 Most spheroid assays rely on end points such as volume, enzymatic activity, metabolism, 2 or viability stains,3,4 essentially always measuring live versus dead. The next step is to move away from live/dead assays and extract more information about the biological circuitry of 3D cell models.
Spheroid biology can be probed in intact, dissociated, or lysed spheroids, as well as spheroid slices. 6 Lysing and dissociating has the advantage of sharing the same experimental workflow with standard methods developed for monolayers. However, there are a number of limitations to these approaches. For example, by lysing the spheroids, 7 all cells are treated as a single population and the information about different cell types and cell states within the spheroid is masked. When 3D cultures are dissociated into single-cell suspensions, the relative ratios of different populations can be quantified, 3 but the spatial organization information is lost. In that respect, optically slicing through intact spheroids preserves spheroid integrity and can be accomplished with confocal, 4 multiphoton, 3 or light-sheet8–10 approaches. While single-cell segmentation is possible for the spheroid periphery in optical slices, confocal microscopy images become dimmer when sectioning beyond 50 µm into the spheroid, and light-sheet-derived images become blurry after 200 µm. These limitations hinder quantification and preclude single-cell segmentation for spheroids larger than 200 µm in diameter. Although clearing techniques have enabled imaging deeper than 200 µm into tissues, 4 issues such as antibody penetration and fluorophore spectrum overlap present major hurdles for in situ imaging studies. That is why slicing and staining thin sections of spheroids remains the gold standard for characterizing spheroid structure, cell morphology, and phenotype at the single-cell level.
Slicing spheroid sections for histology and immunohistochemistry assays has historically been a slow process, incompatible with automation, plagued by random spheroid distribution. To overcome these challenges, we have recently developed a technique to produce in vitro tissue microarrays by arranging up to 66 spheroids in an agarose gel at precisely set x, y, and z positions. 11 The 3D cultures can be grown in any format, treated with different drugs or growth factors, fixed, and then analyzed in our system. All spheroids lie at the same plain and are sectioned simultaneously, greatly reducing the time for sectioning and the number of sections required and enabling automated image acquisition and analysis. In this article, we share the blueprints for the mold maker device necessary to produce the gel arrays ( Fig. 1A , B ), the experimental procedures for creating final microarray samples ( Fig. 1C ), and hints and tips for making consistent arrays ( Suppl. Protocol 1 ). We also present the proof-of-concept application of the technology for an 11-cell-line array stained with hematoxylin and eosin (H&E), for estrogen (ER), progesterone (PR), and human epidermal growth factor (Her-2) receptors. These multi-cell-line arrays can serve as controls for antibody staining; they can be used to authenticate cell lines or to compare different cell lines from the same organ.
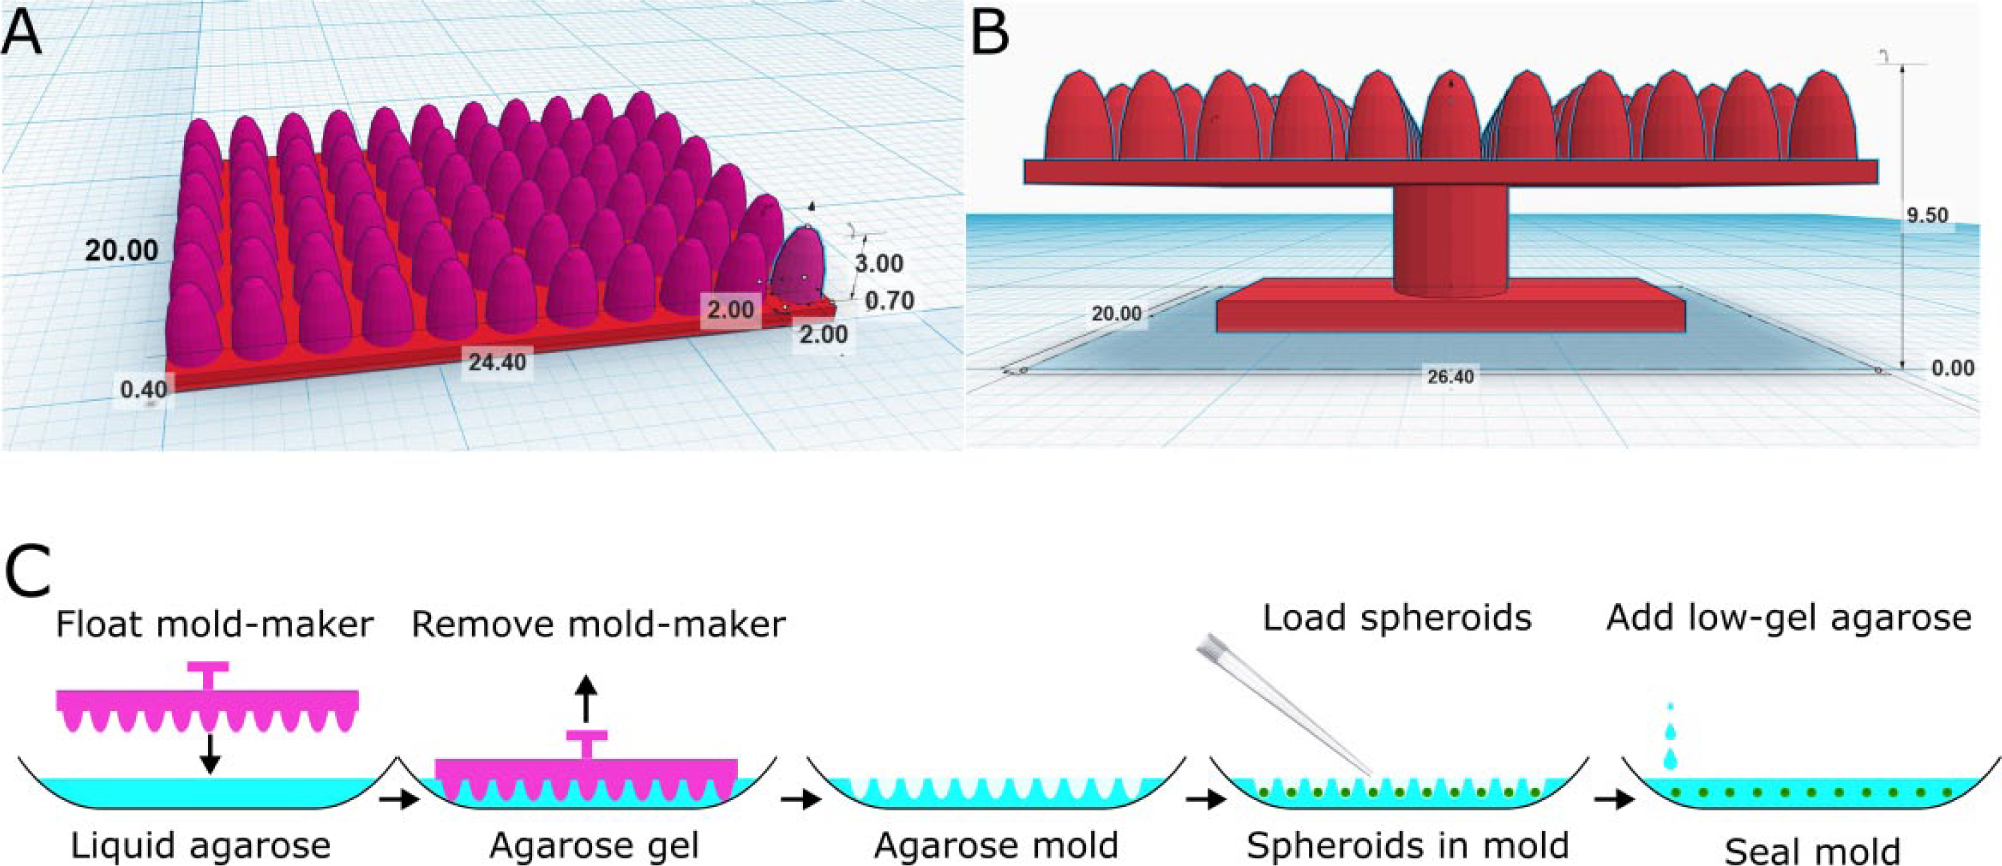
Mold maker design and the process of making spheroid microarrays. (
Materials and Methods
Mold Maker Blueprints
The mold maker was designed in TinkerCAD and the blueprints ( Fig. 1A , B ) are available at https://tinkercad.com/things/9iwxu1fb2Iq. The mold maker was printed with a selective laser sintering printer (EOS Formiga P100) out of PA2200 (polyamide-12 powder) by the University of Nottingham Additive Manufacturing and 3D Printing Research Group. The maximum spheroid size was limited to less than 2 mm by the diameter of the parabolic pegs in the current design. However, the design can be freely changed on the shared link to accommodate larger cultures, if needed.
Making the Agarose Arrays
For a video version of the protocol, follow this link: https://figshare.com/s/0d3706f760854a44f603.
An expanded version of the protocol, along with hints and tips, is available in the supplementary information ( Suppl. Protocol 1 ) and on the Figshare database: https://figshare.com/s/1795d13ce724ebfa0ee9.
Silicone release spray (Bond It) was sprayed on the mold maker and left to dry (30 s) to facilitate separation from the agarose gel. Type IA agarose (A0169, Sigma-Aldrich, St. Louis, MO) was dissolved by microwaving in deionized water to make a 2% solution. The hot agarose solution was kept at 50–70 °C in a water bath, and 2 mL was dispensed in a prewarmed (37–50 °C) stainless steel histology base mold (Simport M474-4, 30 × 24 × 5 mm). The mold maker was placed on top of the warm agarose solution, and the base mold gently pressed and tapped to remove any potential air bubbles trapped underneath the mold maker. The agarose solution was left to gel at room temperature (2 min, 21 °C), and subsequently the mold was transferred to a laboratory freezer and placed on a level surface (1 min, −18 °C). The mold maker was removed, leaving an agarose mold of 66 wells.
Loading the Arrays with Fixed Spheroids
The spheroids were dispensed after fixation (4% wt/vol paraformaldehyde solution in phosphate-buffered saline (PBS), 16–24 h at 2–8 °C) in the ultra-low-attachment plate used for their culture. The fixed spheroids were taken up with fixation media (7–8 μL) from each well using a 20 μL pipette tip with the top section cut off to facilitate spheroid collection. After spheroid transfer, each well was filled with aqueous media from the spheroid plate (4% wt/vol paraformaldehyde solution in PBS). Then the whole mold was centrifuged (1 min, 100g) to position all spheroids at the bottom of the agarose mold. The agarose molds were centrifuged by taping the stainless steel molds to the top of a 50 mL swing rotor centrifuge adaptor. After centrifugation, the mold was quickly warmed (5 s on a hot plate) to reach 37–40 °C and low-gelling 2-hydroxyethyl agarose (Type VII, Sigma-Aldrich, 0.5 mL, 2% wt/vol in deionized water) was slowly dispensed on the side of the mold to seal the spheroids. The slow gelation of the low-gelling agarose allows the spheroids to settle back to the bottom if they have been disturbed by adding the solution. The agarose array was left to gel for 5 min at room temperature, followed by 1 min at −18 °C.
Dehydration, Paraffin Impregnation, and Embedding
The sealed arrays were placed in a histological cassette and processed in a tissue processor (Leica TP1020) overnight. The samples were dehydrated in a series of fresh alcohol solutions with increasing concentrations (one bath of 50%, 70%, and 90%, and four baths of 100% methanol, 1 h each), cleared in xylene (three baths, 1 h each), and infiltrated with molten paraffin (two baths, 2 h each, vacuum ON). The molds were then embedded in paraffin on the next day.
Multi-Cell-Line Spheroid Arrays
Cancer cell lines from breast (MCF7, MDA-MB-231, MDA-MB-361, and HCC1806), colon (HCT116 and RKO), gastric (N87), brain (U251), pancreatic (BXPC3), and ovarian (OVCAR-3) cancer and osteosarcoma (791T) were seeded at different cell densities (4, 8, and 16 × 103 cells/well) in 100 μL of media as described in Ivanov and Grabowska. 11 The plates were centrifuged lightly (100g, 3 min) when no basement membrane extract (BME, Cultrex) was added, and more intensely (1000g, 10 min) if 250 μg/mL of BME was added to encourage rapid spheroid formation. They were fed fresh media (100 μL) on day 2 and fixed on day 4 (4% paraformaldehyde, 16–24 h) before embedding in spheroid microarrays.
Immunohistochemistry staining was performed by the Translational Research Group, Cellular Pathology Depart-ment, Queen’s Medical Centre, Nottingham. The arrays were sectioned in 4 µm thick sections, and placed on polylysine-coated slides to dry. Slides were stained for ER, PR, and Her-2 (cerbB-2) using Roche Ventana Ultra automated staining machines and reagents from Roche Ventan (Tucson, AZ). Sections were dewaxed (three baths of xylene, 4 min each at 72 °C). Antigen retrieval was performed for 64 min with basic tris(hydroxymethyl)aminomethane buffer: Cell Conditioning Solution 1 (CC1) (0542469001). Diaminobenzidine (DAB)-based detection was done with the Ventana Ultraview kits (05269806001), and hematoxylin counterstaining with Ventana Hematoxylin II (05277965001). The list of antibodies used is given in Supplementary Table S1 .
Stained Slide Scanning
Samples were scanned with the Hamamatsu Nanozoomer (Bridgewater, NJ) slide scanner at 20× magnification as described by Ivanov and Grabowska. 11
Image Analysis
Images were exported to jpeg files with 80% compression, and the DAB staining quantified using the FiJi distribution of ImageJ 12 with specially written macros for nuclear and membrane staining, available at the following links:
https://figshare.com/s/3a942c6eede8ba50e999
https://figshare.com/s/651a63161093f86cd496
The percentage positive cells for nuclear markers was calculated as the area of DAB-positive nuclei divided by the sum of the area for all nuclei in the section. The percentage positive staining for membrane markers was calculated by dividing the cell area with membrane staining positive for DAB by the area of the whole spheroid.
Results and Discussion
To show the utility of the spheroid microarray, we cultured 11 cell lines as spheroids and embedded the resulting cultures in a mixed cell line microarray ( Fig. 2 ). The array was sectioned and then stained with a variety of markers to reveal morphology and protein expression patterns. H&E staining was used to reveal spheroid morphology, a product of the interaction of thousands of genes. Some cell lines (OVCAR-3) did not form spheroids, but organized in loose aggregates instead. Although the success rate for spheroid transfer of loose aggregates was lower, the BME (Cultrex) held the cells in the loose OVCAR-3 aggregates together during culture and processing. While some cell lines, such as the pancreatic cancer–derived BxPC3, formed compact round spheres, others grew as loose irregular spheroids (RKO). Necrotic cores were present in the HCC1806, MDA-MB-361, and MCF-7 spheroids and absent in the HCT116 spheres of similar size. Spheroid cores were classified as necrotic based on morphological features in the H&E staining, such as reduced cell density, cell rounding, apoptotic nuclei, and lighter eosin staining. ER staining was negative for all cell lines with the exception of MCF-7 and MDA-MB-361, with around 90% and 30% of nuclei staining positive ( Figs. 2 and 3A ). Cells in the necrotic core region for the above cell lines did not express the receptor. MCF-7 was the only cell line from the panel to stain positive for PR, with the hypoxic and necrotic cells in the core of the MCF-7 spheroids showing no PR expression ( Fig. 3B ). More than 50% of the nuclei stained positive for P53 for all TP53-mutant cell lines, such as OVCAR-3, MDA-MB-231, N87, BxPC3, and U251. In contrast, wild-type TP53 cell lines had less than 20% nuclei positive for P53, with the exception of HCT116 (21%) and RKO (43%) ( Fig. 3C ). Membrane staining with the cerbB-2 antibody against Her-2 was highly positive in MDA-MB-361 and N87 spheroids. Cell lines such as OVCAR-3, HCT116, MCF-7, and BxPC3 showed very faint membrane staining in less than 5% of their cells, while MDA-MB-231 and U251 were completely negative ( Fig. 3D ).
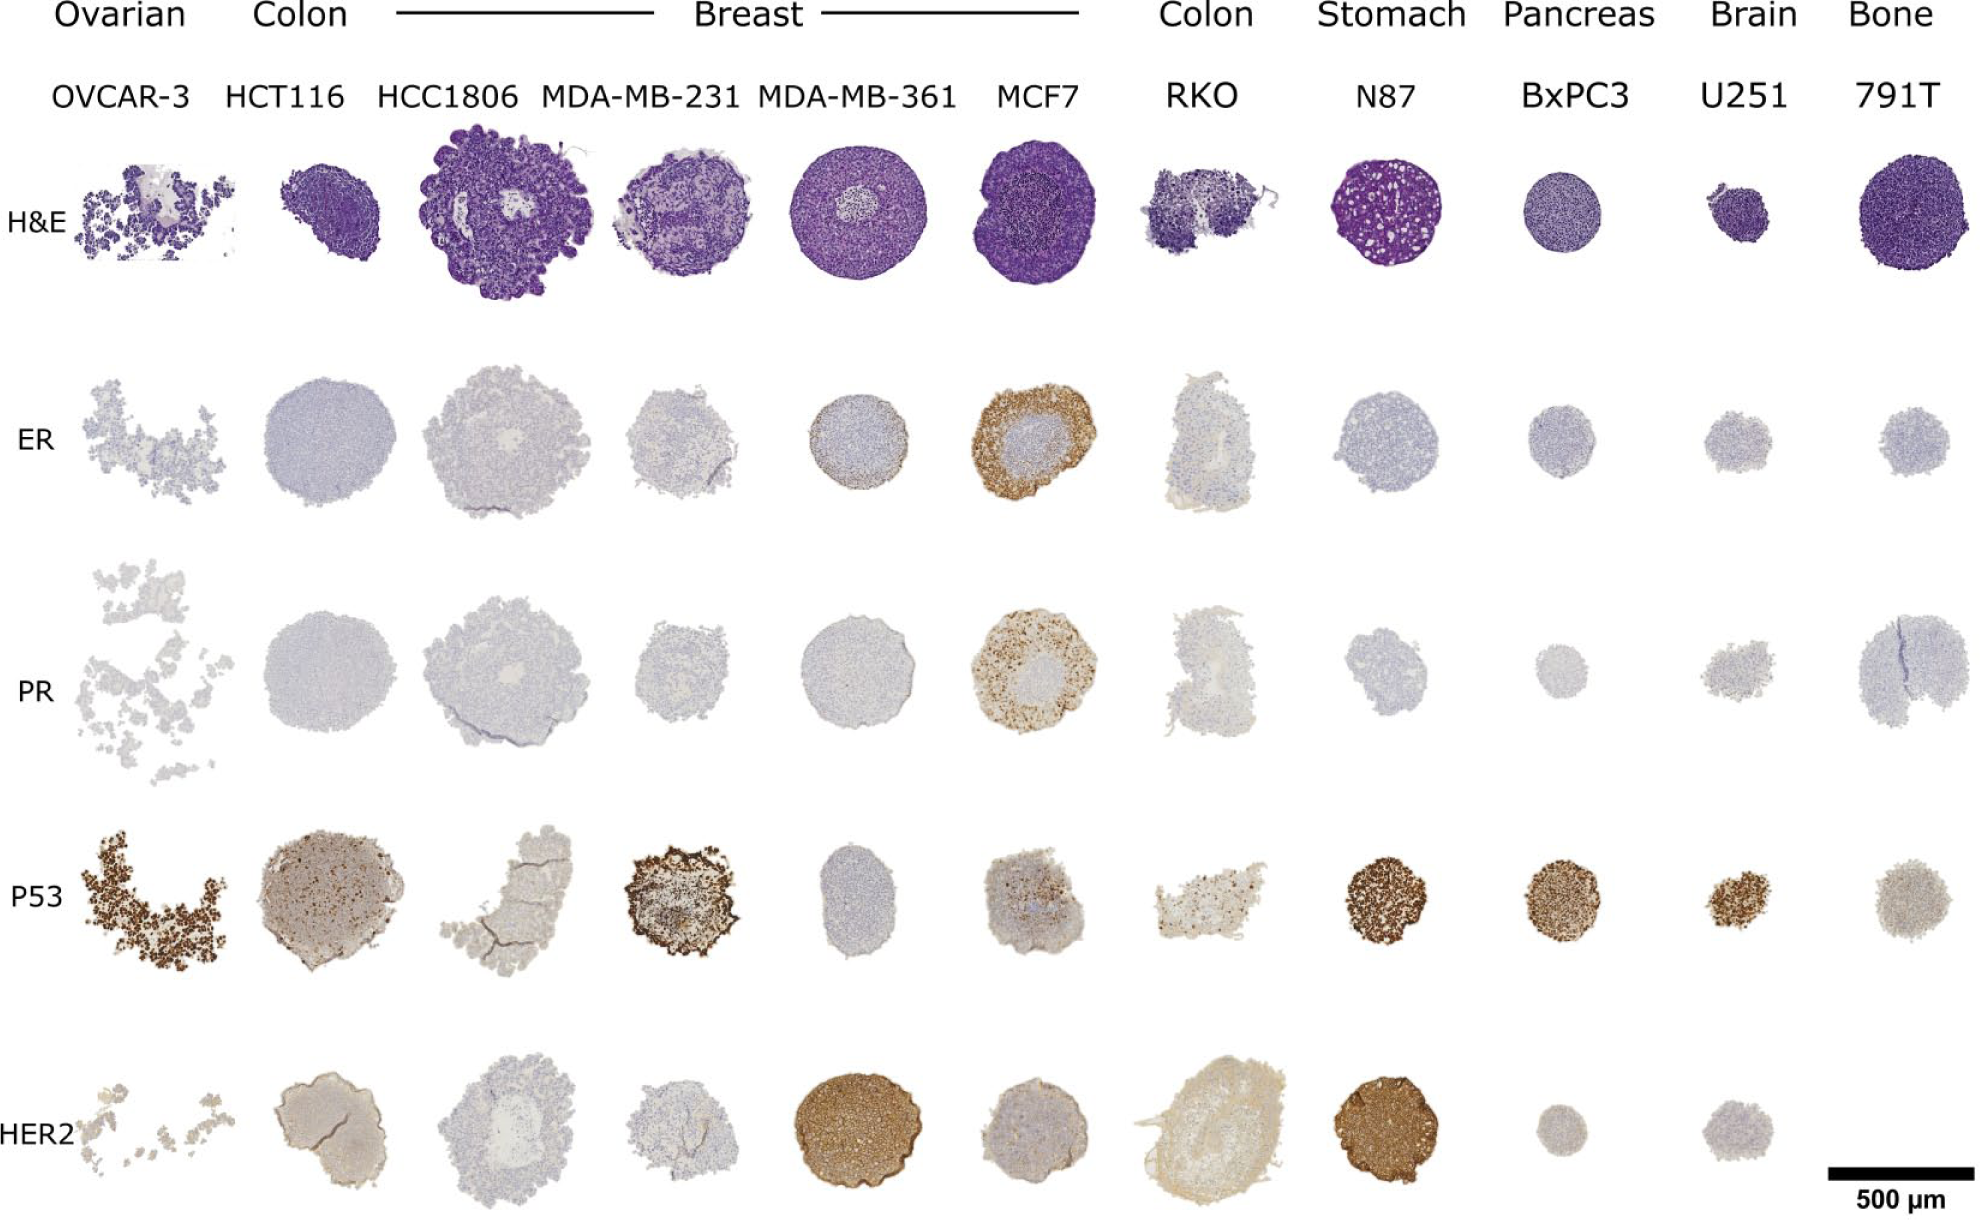
Spheroid arrays from 11 different cell lines stained with different markers. The cell lines are positioned in different columns, while the stains are arranged in rows. Top row: H&E staining, followed by staining for ER, PR, TP53 (P53), and Her-2 (cerbB-2). Scale bar is 500 µm.
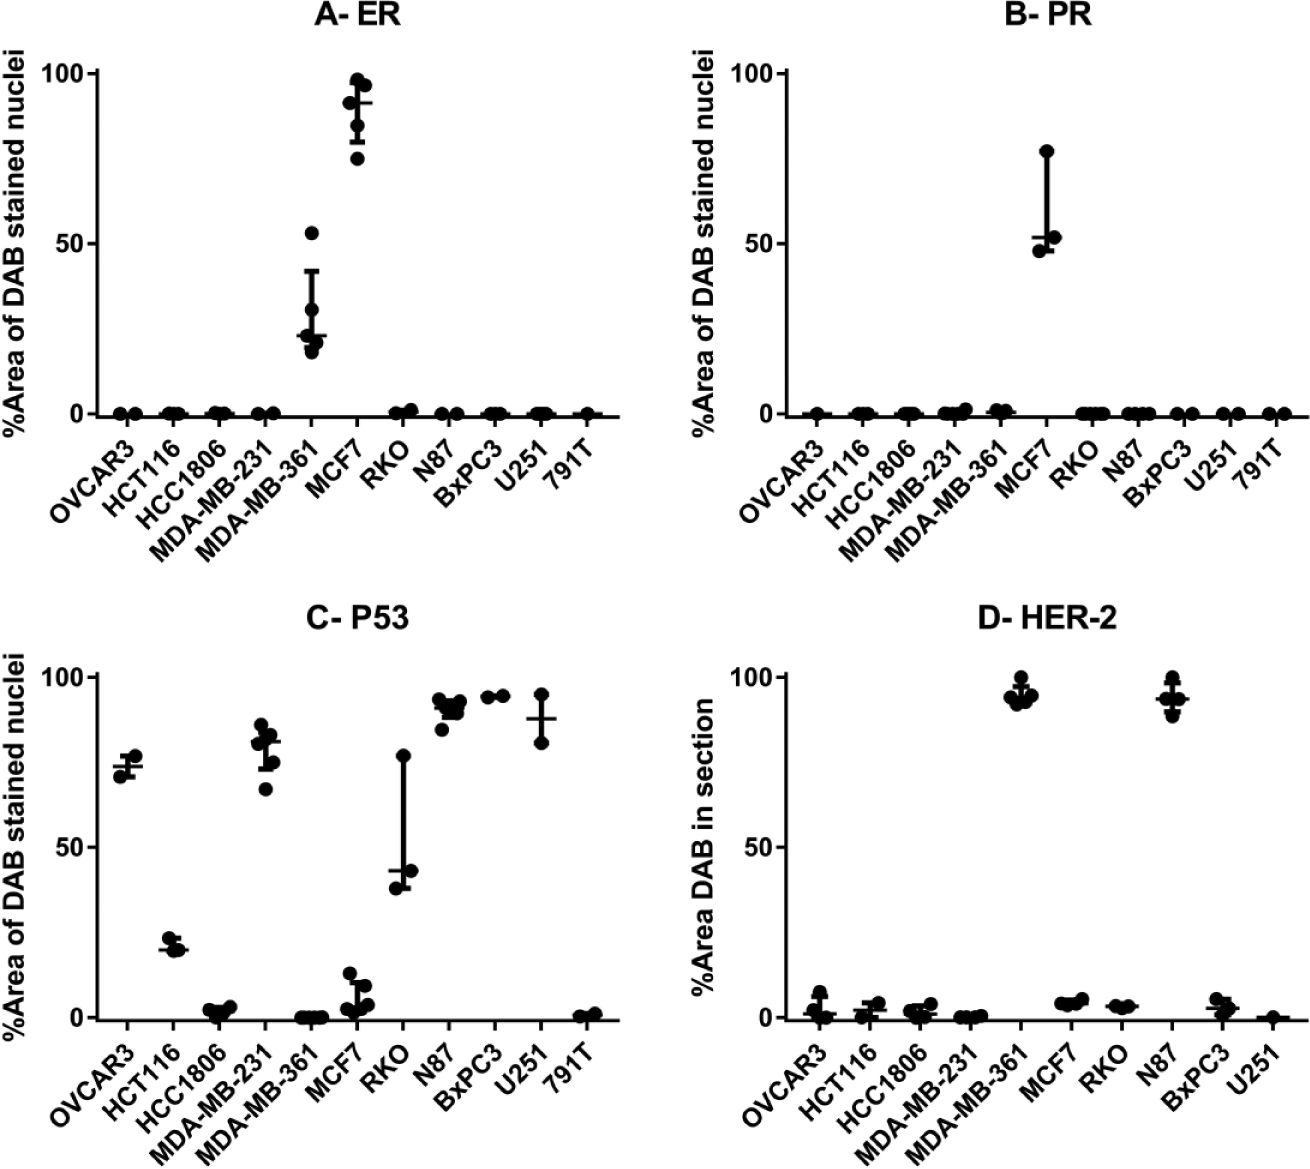
Quantification of the immunohistochemistry staining in the multi-cell-line array. (
Immunohistochemistry staining for ER, PR, Her-2, and TP53 in the spheroid cultures was consistent with the reported expression patterns for the cell lines in the literature ( Table 1 ). The luminal A subtype representative cell line, MCF-7, stained strongly for ER and PR and had less than 5% of cells positive for Her-2. Both triple-negative cell lines (HCC1806 and MDA-MB-231) did not show any staining in ER, PR, or Her-2. While the OVCAR-3 cell line has been reported to express ER and PR, it did not stain positive in our experiments. The cell line also did not form spheroids in the conditions tested, and it is possible that the different culture conditions used in our experiments compared with studies in monolayer 13 have influenced ER expression.
Correlation between Reported Expression Patterns for the Panel of Cell Lines and Percentage of Cells Staining Positive in the Multi-Cell-Line Arrays of Spheroids.
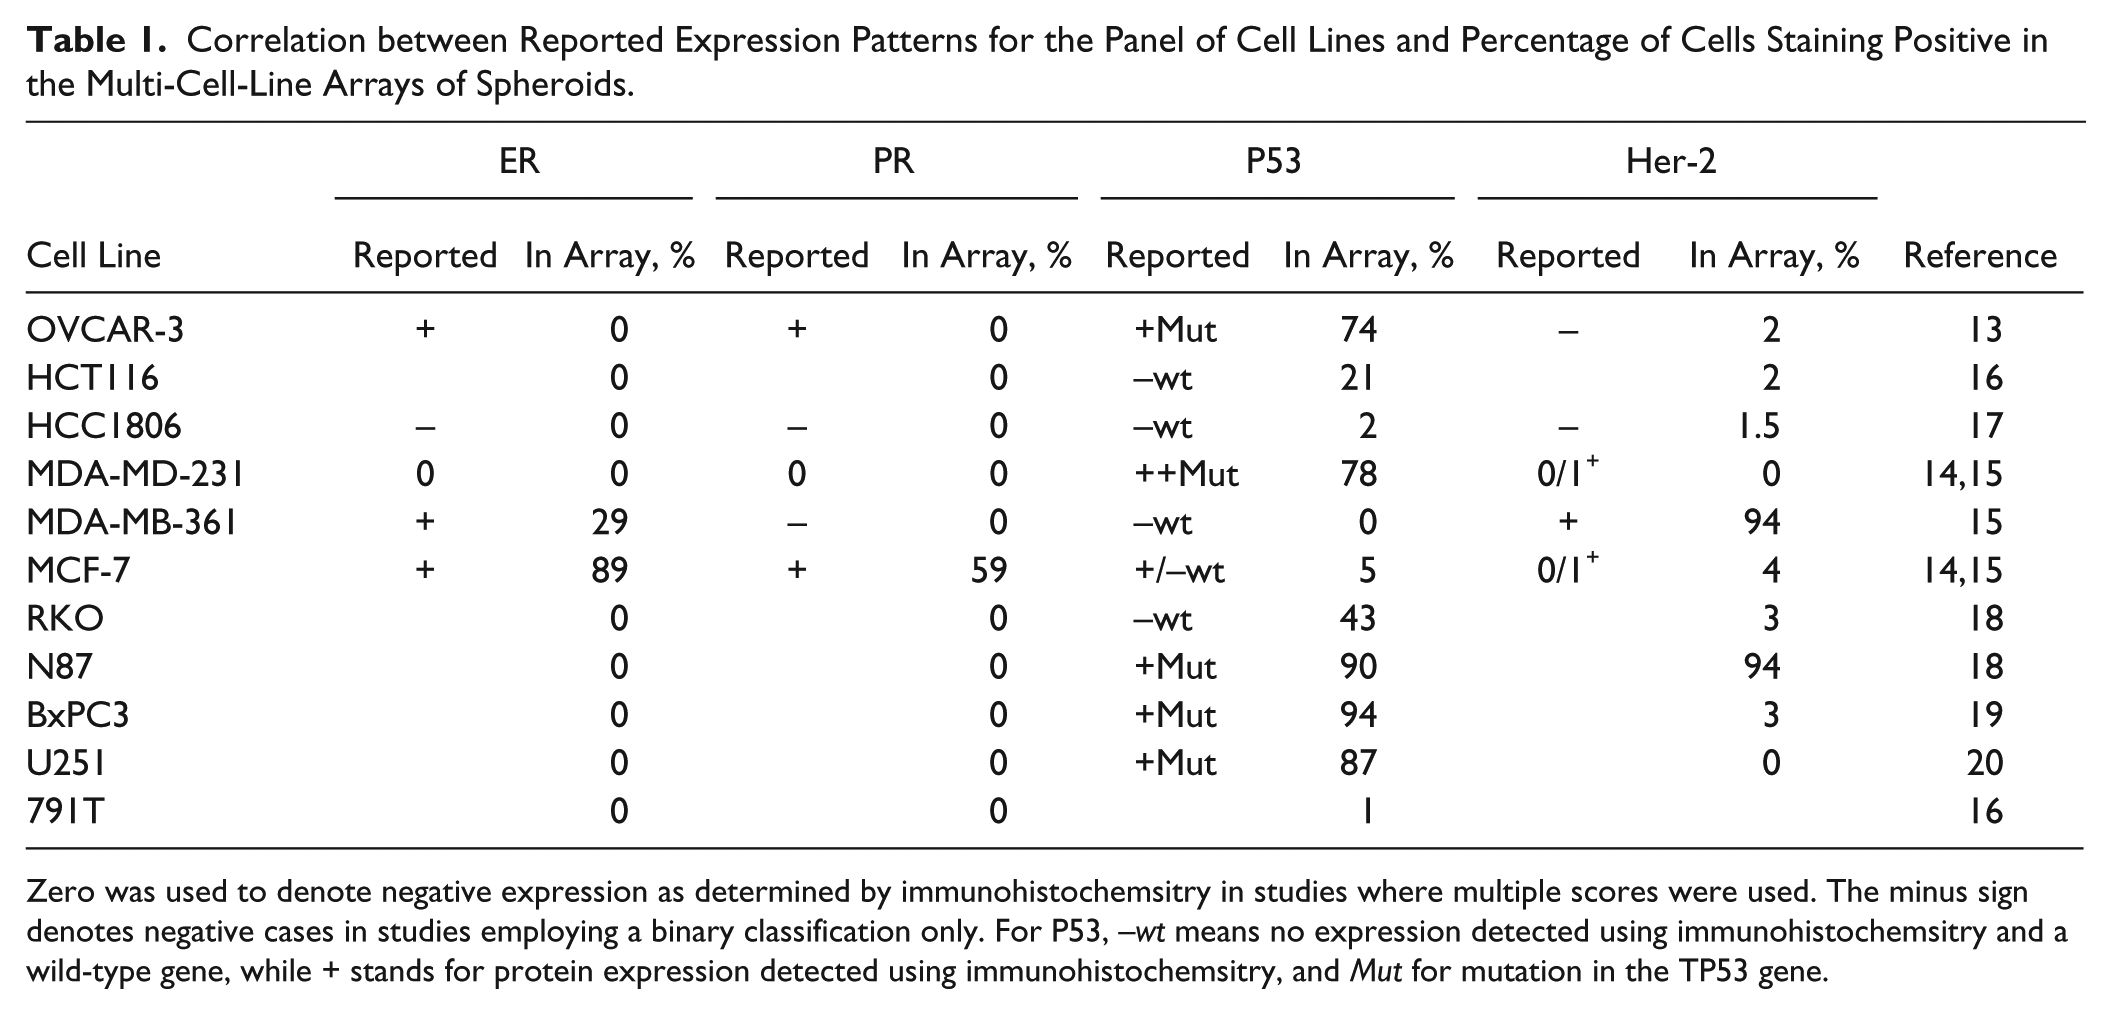
Zero was used to denote negative expression as determined by immunohistochemsitry in studies where multiple scores were used. The minus sign denotes negative cases in studies employing a binary classification only. For P53, –wt means no expression detected using immunohistochemsitry and a wild-type gene, while + stands for protein expression detected using immunohistochemsitry, and Mut for mutation in the TP53 gene.
The reported TP53 mutation status also showed good correlation with the P53 staining observed in the arrays. Two notable exceptions are the HCT116 and RKO cell lines. Both showed some degree of P53 staining despite being TP53 wild-type cells ( Table 1 ). A possible explanation may be that the staining in TP53 wild-type cells can reflect an increase in P53 activity due to hypoxia-induced cellular stress and genetic instability.
Her-2 staining in MDA-MB-361 and N87 cells was very strong for all cells of the spheroids ( Fig. 2 ). In contrast, there was weak patchy membranous staining in spheroids formed by the OVCAR-3, HCT116, MCF-7, and BxPC3 cell lines and complete absence of staining in U251 and MDA-MB-231 spheroids. These results reflect the wide range of reported expression patterns for the Her-2.14–16
We have demonstrated the convenience of in vitro spheroid microarrays for rapid and efficient characterization of spheroid biology. Similar arrays can be used to characterize antibody staining, to classify cell lines and tissues. Because cell lines are easy to propagate and their marker expression is relatively stable, such controls can be valuable in clinical assessment of patient tissue.
The paraffin-embedding procedure employed here enables long-term room temperature storage and can facilitate the collection of large in vitro spheroid libraries. Thus, researchers can separate microarray production from sample staining and analysis. This segregation can be especially useful when a large set of different experimental conditions requires analysis on the same slide or in the same experimental run.
Spheroid microarray technology enables staining of the same set of tissues for a large number of different markers. For example, spheroids with a diameter of 500 µm can yield up to 50 sections within 20% of the spheroid core. Therefore, up to 50 different markers can be used on the same set of spheroids. If many immunohistochemistry stains are multiplexed per section, the number of biological questions one can ask using the same set of spheroids can expand to 100–300.
Further work should focus on automating spheroid transfer to the agarose arrays, reducing the variability in embedding on the z axis, and enabling the analysis of slide scanner files in open-source software, such as ImageJ. The transfer of spheroids from the plates used for their culture is currently done manually. Automating the process would save time and would enable working with spheroids smaller than 200 µm in diameter. The variability in the embedding depth for spheroids in the agarose gels currently necessitates the use of spheroids larger than 300 µm; improvements to this process should enable the analysis of smaller spheroids. Furthermore, when spheroids of very different sizes have been embedded in the same array, there will be a disconnect between the z sections. For example, the middle of the small spheroids will appear much sooner than the midsection of larger ones. Last but not least, the large proprietary files produced by commercial slide scanners are not currently compatible with open-source image analysis software such as ImageJ. Therefore, images need to be annotated and exported to tiff or jpeg files before analysis. If researchers could import and analyze large slide scanner images in ImageJ, this would not only close the final break in the chain of workflow automation, but also tremendously simplify and speed up the image analysis process.
Footnotes
Acknowledgements
The authors would like to thank Georgina Marsh from the CDT in Targeted Therapeutics and Joseph White from the University of Nottingham Centre for Additive Manufacturing for their assistance in 3D printing the mold maker, and Pamela Collier, Theresa Pereira Raposo, Giovanna Sicilia, Alan McIntyre, Wei-Hsin Hsu, and Aleksandra Tchoryk for providing cell lines for the mixed cell line arrays. We are grateful to Janhavi Apte for her contribution in exporting and annotating the scanned images to individual files.
Supplementary material is available online with this article.
Declaration of Conflicting Interests
The authors declared no potential conflicts of interest with respect to the research, authorship, and/or publication of this article.
Funding
The authors disclosed receipt of the following financial support for the research, authorship, and/or publication of this article: This work was supported by the Engineering and Physical Sciences Research Council (grant number EP/M506588/1). Delyan Ivanov was supported by an Engineering and Physical Sciences Research Council Doctoral Prize award hosted by the University of Nottingham (DP2014/DI).
References
Supplementary Material
Please find the following supplemental material available below.
For Open Access articles published under a Creative Commons License, all supplemental material carries the same license as the article it is associated with.
For non-Open Access articles published, all supplemental material carries a non-exclusive license, and permission requests for re-use of supplemental material or any part of supplemental material shall be sent directly to the copyright owner as specified in the copyright notice associated with the article.