
Abstract
Three-dimensional (3D) cell culture techniques using a bioreactor have been used to co-culture various breast cancer cell lines. Comparisons between 3D co-cultures containing different proportions of breast cancer cell lines have been made with respect to cluster size, cell surface marker distribution, and Ki67 expression. Furthermore, an observed difference in invasion through collagen between co-cultures has been briefly reported. However, these assays have not yet been developed into a quantifiable methodology to assess the effects of drugs and/or microenvironments on cellular invasion. From a cancer perspective, two important aspects of cellular invasion that are often left out of in vitro assays are considerations about the 3D structural heterogeneity of the primary tumor and the ability of cells to migrate in all directions. Accordingly, we have taken advantage of the methodology previously described for 3D cell culture techniques and have developed a 3D invasion assay using cell clusters that can be used to assess the effects of different drugs and treatment conditions on cancer cell invasion. We also describe a novel whole-mount technique that permits fluorescence-based immunolocalization of proteins through the entire tumorsphere, without the need for sectioning. Our assay provides a simple, inexpensive, and physiologically relevant context to study cellular invasion in vitro, in a way that recapitulates an in vivo milieu.
Introduction
Cellular invasion is a critical function during many important physiological processes, including, but not limited to, embryonic development, placentation, and mammary gland development.1–3 Invasion is also an important event during cancer progression, whereby cellular invasion through the extracellular matrix, blood vessels, and secondary tissue is requisite for metastasis. Given the importance of cellular invasion across diverse biological processes, it is of interest to develop an assay that mimics physiological context as closely as possible to improve our understanding of both normal and disease states.
In cancer research, the most classical cellular invasion assay is the Transwell (or Boyden) chamber assay ( Fig. 1a ). Generally, this assay involves placement of small plastic Matrigel-coated chambers into the wells of a 12- or 24-well plate, seeding cells into the upper compartment of the chamber, and monitoring their invasion to the underside of the chamber over 12 to 48 h. The benefits of this assay are that (1) the chambers can be coated with different types of barriers (usually Matrigel), (2) chemotaxis analysis can be included by adding a chemoattractant to the lower compartment surrounding the chamber, and (3) it is simple, quick, and can be easily adjusted. However, for cancer research, this assay is often criticized as being oversimplified in its ability to recapitulate in vivo cellular invasion, as tumors often display vast structural heterogeneity and invade in three dimensions, often as multicellular clusters.
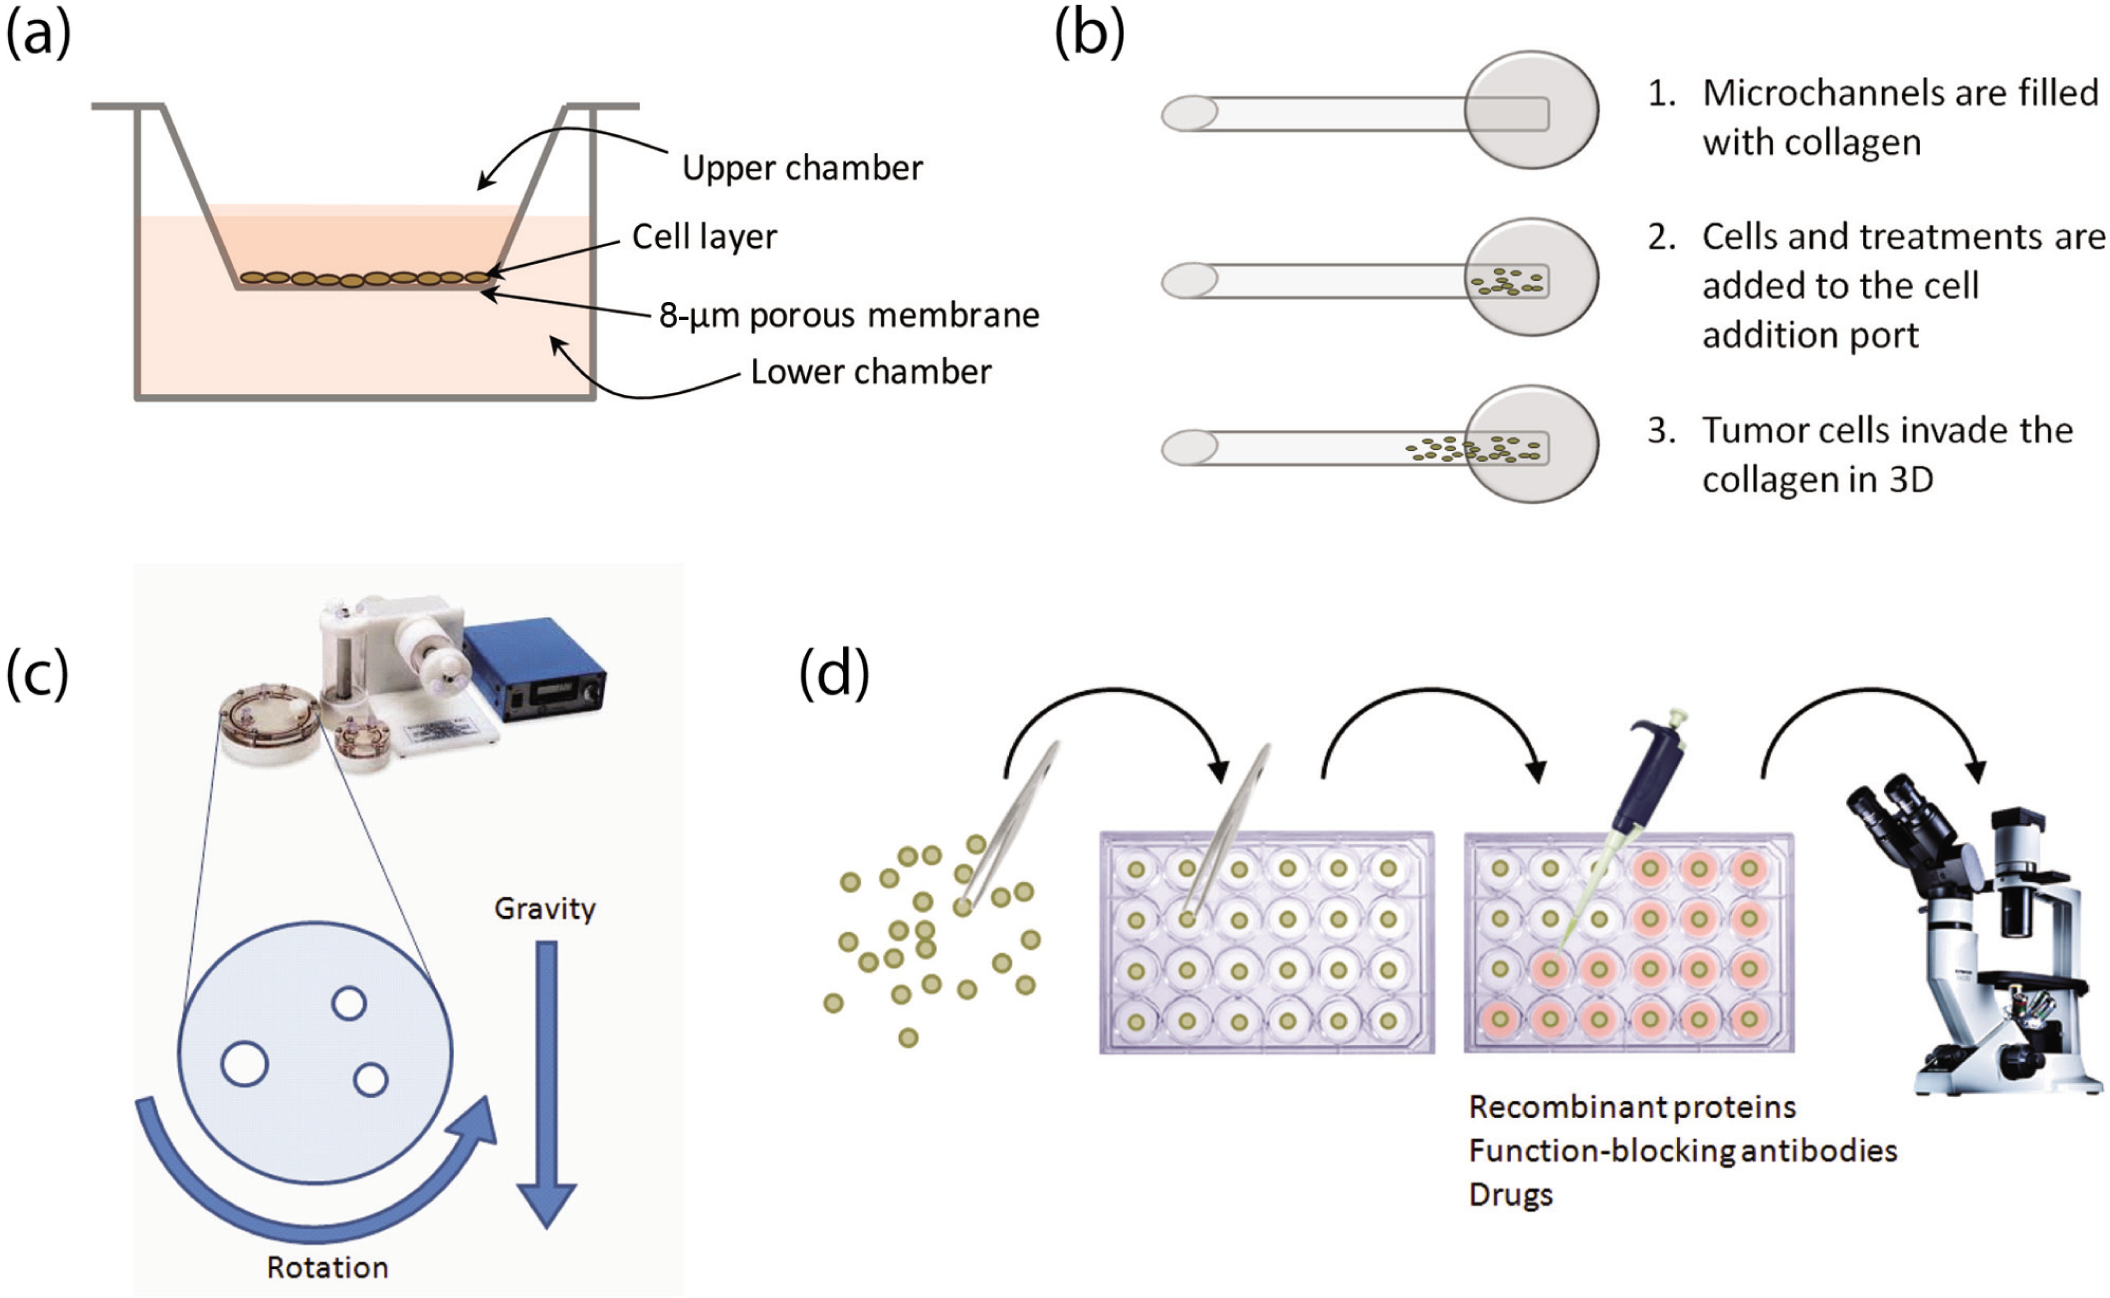
Schematic representation of competing methods of measuring cellular invasion in vitro. (
There have been attempts to devise 3D in vitro invasion assays to address the limitations of the Transwell assay. One assay that lends great improvement is the iuvo 3D ECM Invasion Assay by BellBrook Labs (Madison, WI) ( Fig. 1b ). This assay includes seeding cells into a microconduit array platform and monitoring cellular invasion and migration in 3D through collagen-filled microchambers. The benefits of this assay over the Transwell assay are that (1) the distance of invasion and migration can be monitored, rather than simply the number of invaded cells; (2) proliferation can be monitored; and (3) immunofluorescence can be performed following assay termination for mechanism analysis. However, although this assay incorporates 3D movement, it is still limited in that the original source of cells is a suspension, and therefore it does not recapitulate the structural heterogeneity of a tumor in vivo.
Another attempt at developing 3D cell culture was made by Vamvakidou et al. 4 In this article, 3D co-cultures of various fluorescently labeled breast cancer cell lines (including MDA-MB-231, MCF-7, and ZR751 cells) were generated using a bioreactor and analyzed for structural differences in size and marker expression. This group found that changing the proportions of each cell line in co-culture determined how large the cluster could grow. Furthermore, clusters that contained higher proportions of the aggressive MDA-MB-231 cell line exhibited invasive extensions into collagen, compared with clusters that contained higher proportions of the poorly aggressive MCF-7 cell line. These observations were interesting; however, a quantifiable invasion assay method was not described, and homogeneous 3D cell cultures were only briefly investigated.
Accordingly, we wanted to create a 3D invasion assay that addressed the limitations of both the Transwell and the iuvo assays but included the benefits of the method described by Vamvakidou et al. 4 Briefly, we designed a model to assess 3D cellular invasion through collagen type I, whereby a Synthecon Rotary Cell Culture System (RCCS; Synthecon, Inc., Houston, TX) bioreactor was used to generate 3D cell clusters that mimic the structure of a tumor ( Fig. 1c , d ). Like the iuvo assay, this assay allows for quantification of the number of invaded cells, distance of invasion, and immunofluorescence analysis. However, the benefits of this assay over the Transwell and iuvo assays are (1) cells are cultured in 3D, which recapitulates the dimensions of tumor growth in vivo, and (2) cellular invasion through collagen type I is dictated in part by the 3D heterogeneity of the cell cluster, rather than by an individual cell in suspension. The current article outlines the protocol to set up our 3D cell cluster invasion (CCI) assay and suggests methods of analyses for different parameters of interest, including distance of invasion, number of invaded cells, and whole-mount immunofluorescence localization.
Materials and Methods
See
Cell lines and treatments
T47D, MCF-7, MDA-MB-231, and H4578t cells were obtained from the American Type Culture Collections (ATCC; Manassas, VA) and maintained as per instructions. All cell types were maintained in culture with RPMI + 10% fetal bovine serum (FBS). MDA-MB-231 and T47D cells were used for assay development. ATCC has characterized MDA-MB-231 cells as estrogen receptor (ER)–/progesterone receptor (PR)–, highly tumorigenic, and poorly differentiated. T47D cells, in contrast, are ER+/PR+, poorly tumorigenic (they depend on estrogen supplementation for growth in vivo), and well differentiated. Recombinant human Nodal (rhNodal) was obtained from R&D Systems (Minneapolis, MN). The Nodal function-blocking antibody (Nodal Ab) was obtained from Santa Cruz Biotechnology (Santa Cruz, CA). For immunofluorescence, parental T47D cells were transfected with a pcDNA3.3-GFP vector using Lipofectamine (Invitrogen, Carlsbad, CA) prior to generating cell clusters.
Generation of cell clusters
One million cells (T47D or MDA-MB-231) suspended in 1 mL complete media (RPMI + 10% FBS) were loaded into a bioreactor (Synthecon Rotary Cell Culture System). Air bubbles were removed by filling the chamber with ~10 mL of additional complete media. The bioreactor was placed in an incubator and set to a rotation of approximately 7 rpm. After 3 days, cell clusters could be seen macroscopically. Clusters were gently removed from the bioreactor using a 10-mL pipette and placed into a 2-mL microcentrifuge tube (to be used for immunofluorescence) or a Petri dish (to be used for invasion assays).
Whole-mount immunofluorescence
Cell clusters generated from the bioreactor could be used for immunofluorescence or cellular invasion. Clusters that were to be used for immunofluorescence were collected from the bioreactor and transferred gently into a 2-mL microcentrifuge tube. Clusters were allowed to settle to the bottom of the tube prior to all aspiration steps. Clusters were first treated with Hypoxyprobe-1 (100 ng/µL; HPI, Inc., Burlington, MA) for 2 h. Clusters were fixed with 4% paraformaldehyde overnight and permeabilized with 0.5% Triton-X solution. Clusters were then blocked (protein block; Dako, Carpinteria, CA) for 1 h at room temperature and treated with primary anti-hypoxyprobe-1 antibody (1:50) overnight, followed by secondary anti-mouse Alexa Fluor 568 (Invitrogen) antibody (1:100) overnight. Clusters were counterstained with DAPI (300 nM in phosphate-buffered saline [PBS]) nuclear stain, resuspended in glycerol, and mounted with methyl cellulose using a modified whole-mount technique to preserve 3D integrity. IgG isotype controls were performed on cells in a monolayer to ensure antibody specificity. Confocal images of the cluster were collected at 5-µm steps throughout the thickness of the cluster using a Zeiss LSM 410 confocal microscope (Zeiss, Stuttgart, Germany).Fluorochromes were imaged sequentially for each image slice to maximize separation of the individual signals. Figure 2a is a maximum projection image of all 27 slices of the stack. Figure 2b represents a slice located 50 µm from the surface of the cluster.
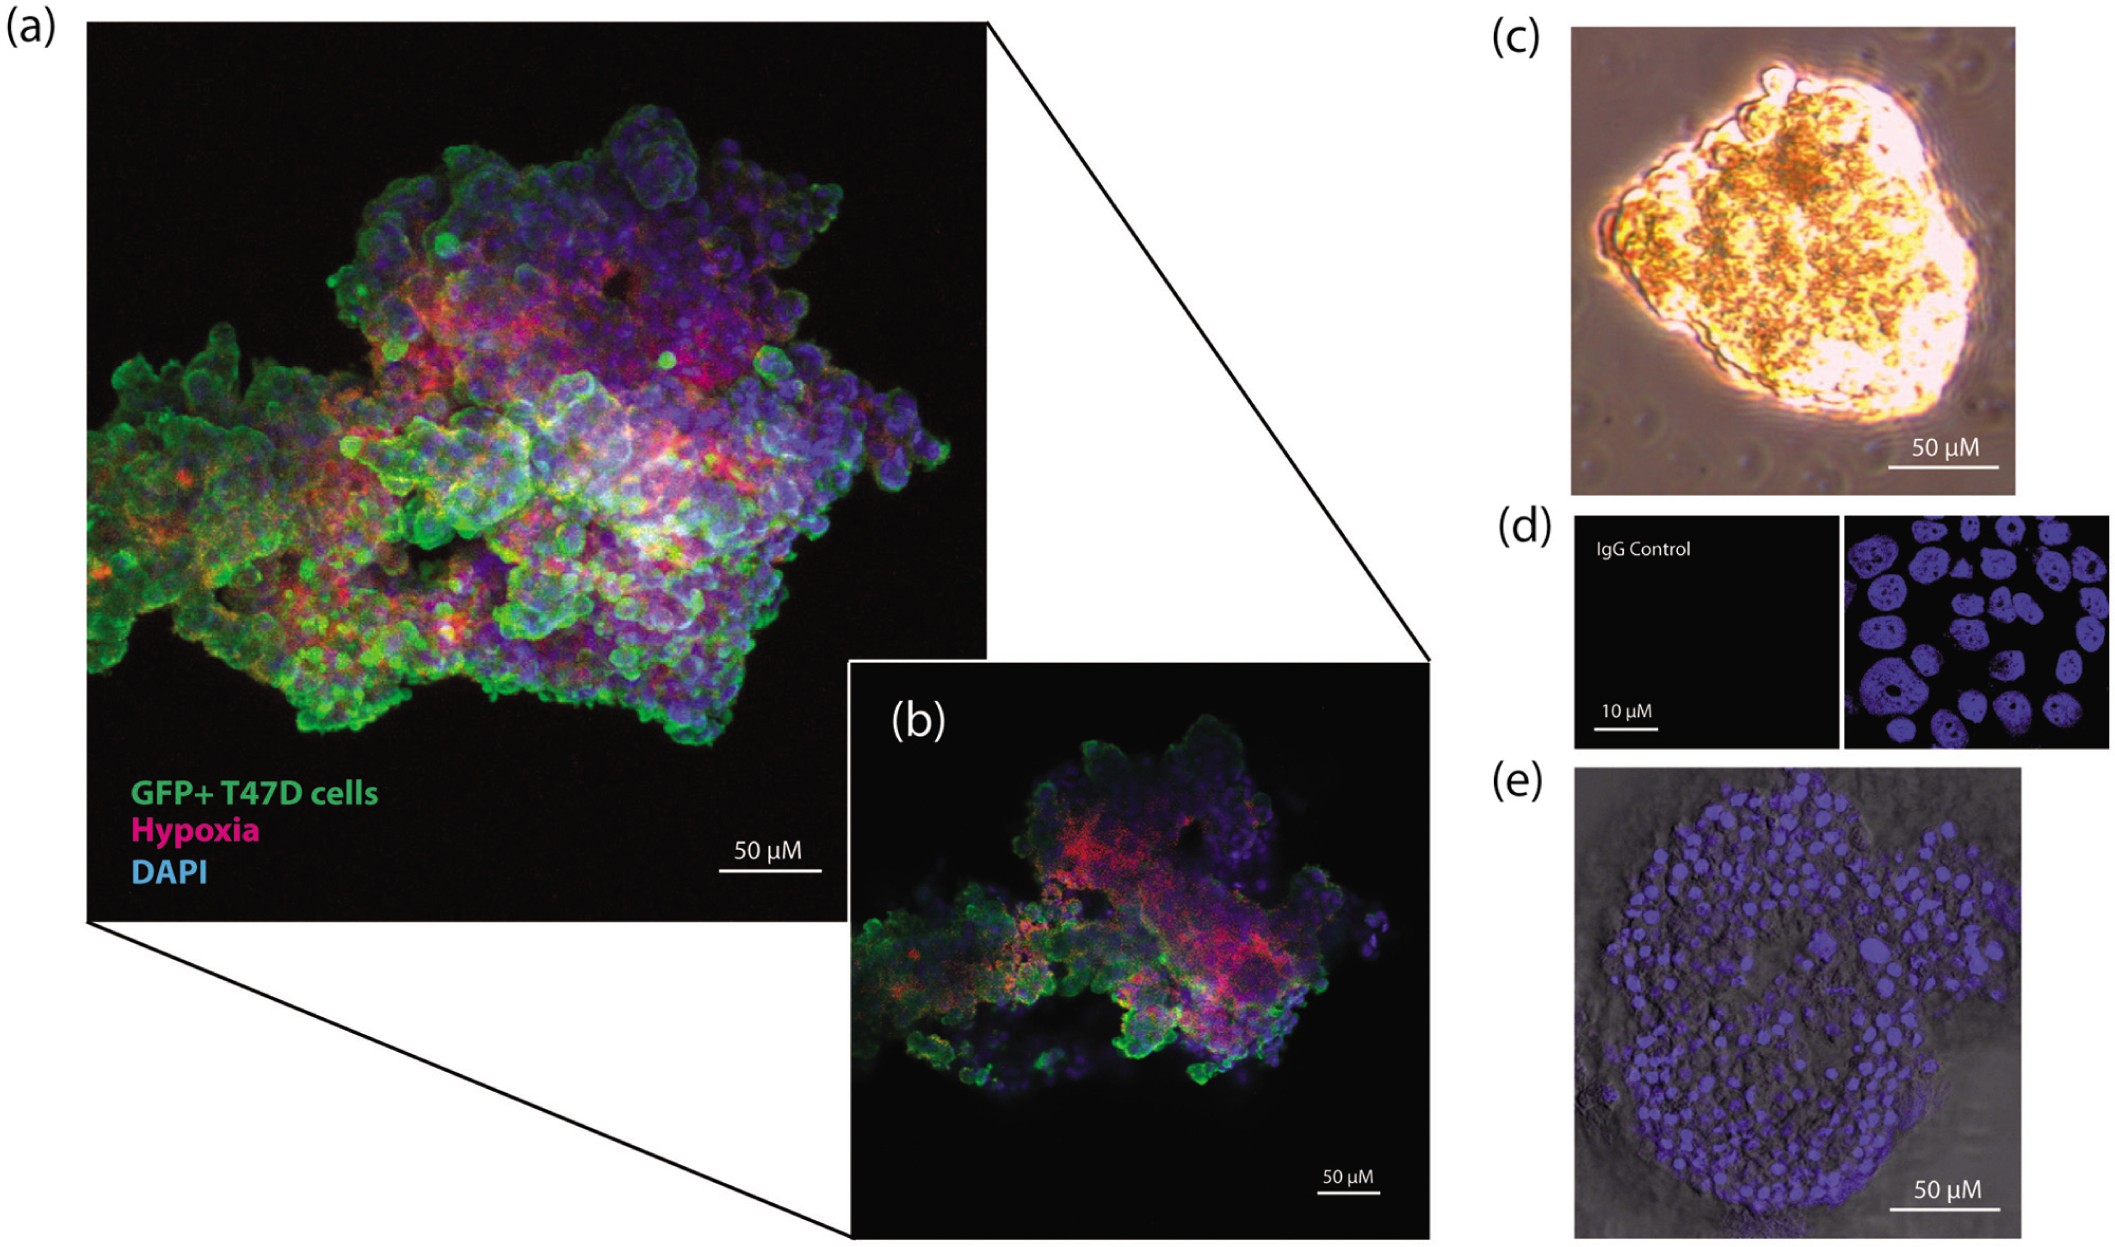
Cell clusters generated from the bioreactor exhibit regions of hypoxia. (
3D invasion assay
Clusters that were to be used for cellular invasion were collected from the bioreactor and transferred into a Petri dish. Clusters were individually selected and embedded in bovine collagen type I (Invitrogen). Collagen was allowed to solidify at 37 °C for 30 min and was then overlaid with RPMI + 10% FBS. Treatments were added to this media overlay as indicated. Clusters were incubated for 36 h to compare differences between cell types ( Fig. 3 ). Experiments ( Fig. 4 ) with MDA-MB-231 cells were incubated for 36 h, whereas experiments with T47D cells were incubated for 1 week (due to slow invasive properties of this cell type). Following termination of the invasion assays, pictures were taken with an inverted microscope and camera to measure distance and number of invaded cells. Adobe Photoshop (Adobe, San Jose, CA) was used to measure distance (Analysis tool), whereas ImageJ (National Institutes of Health, Bethesda, MD) was used to count the number of invaded cells (Cell Counter tool).
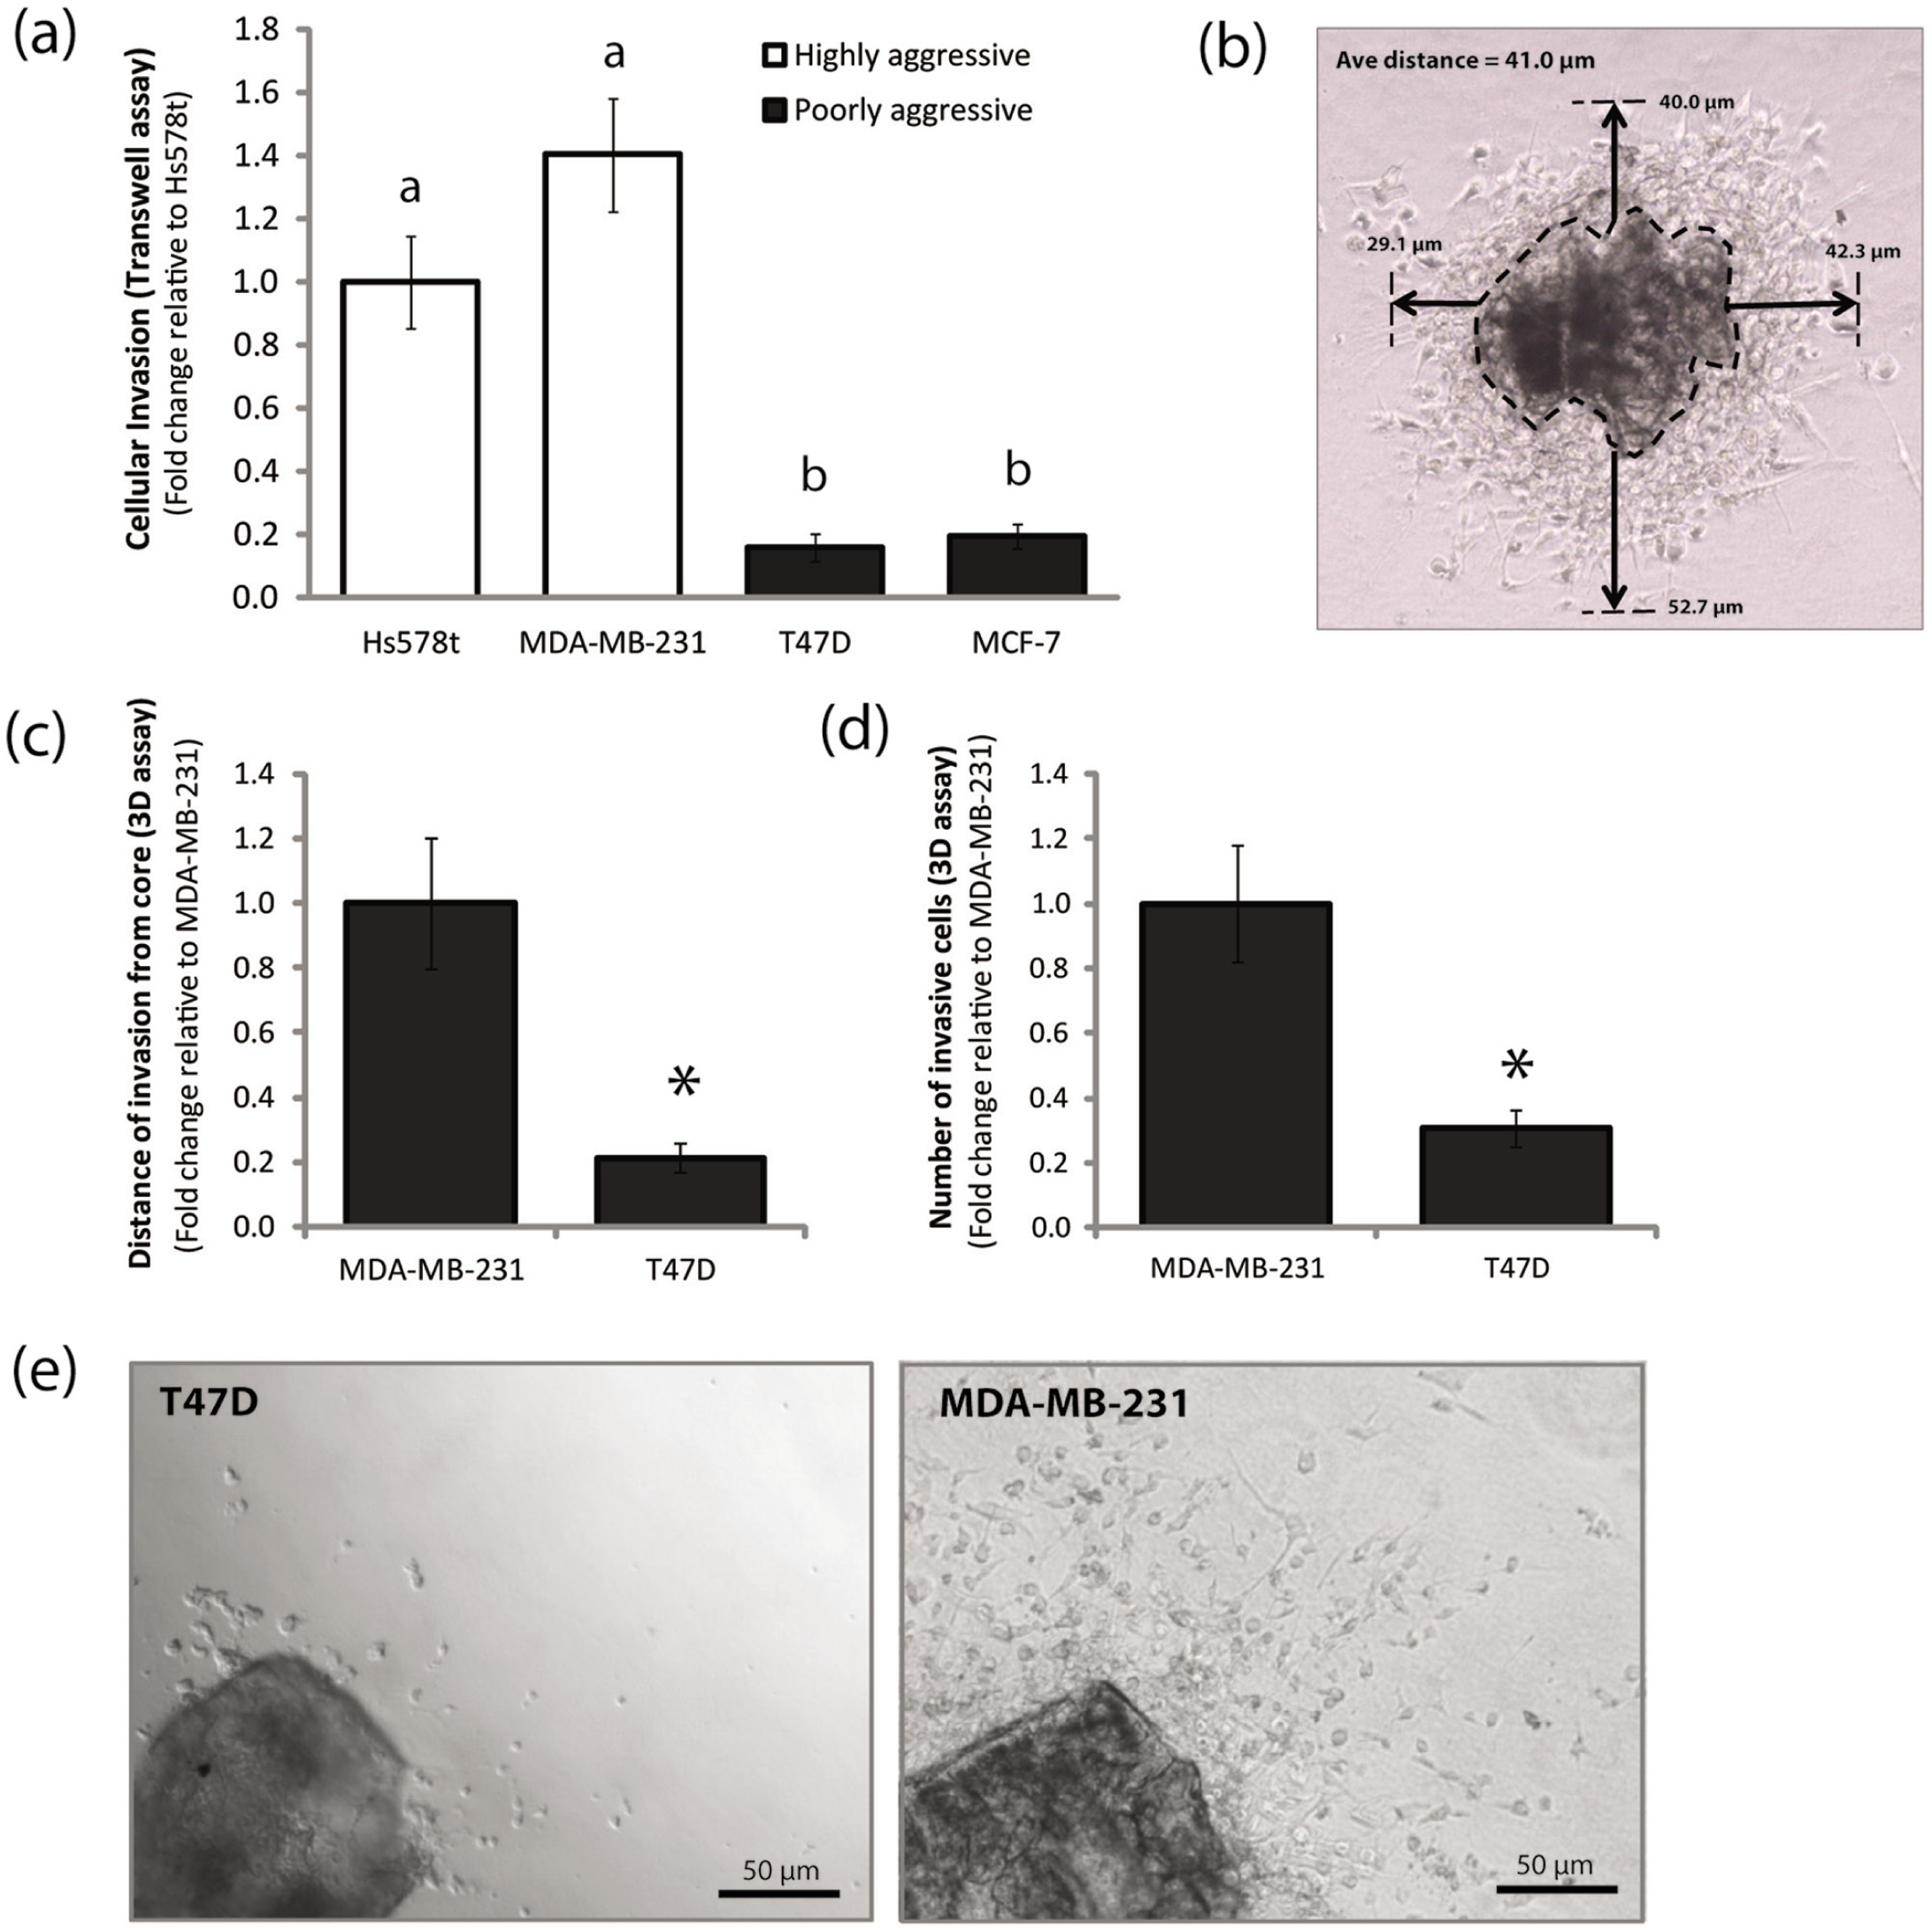
The 3D cell cluster invasion assay captures robust differences in invasion between highly aggressive and poorly aggressive breast cancer cell lines. (
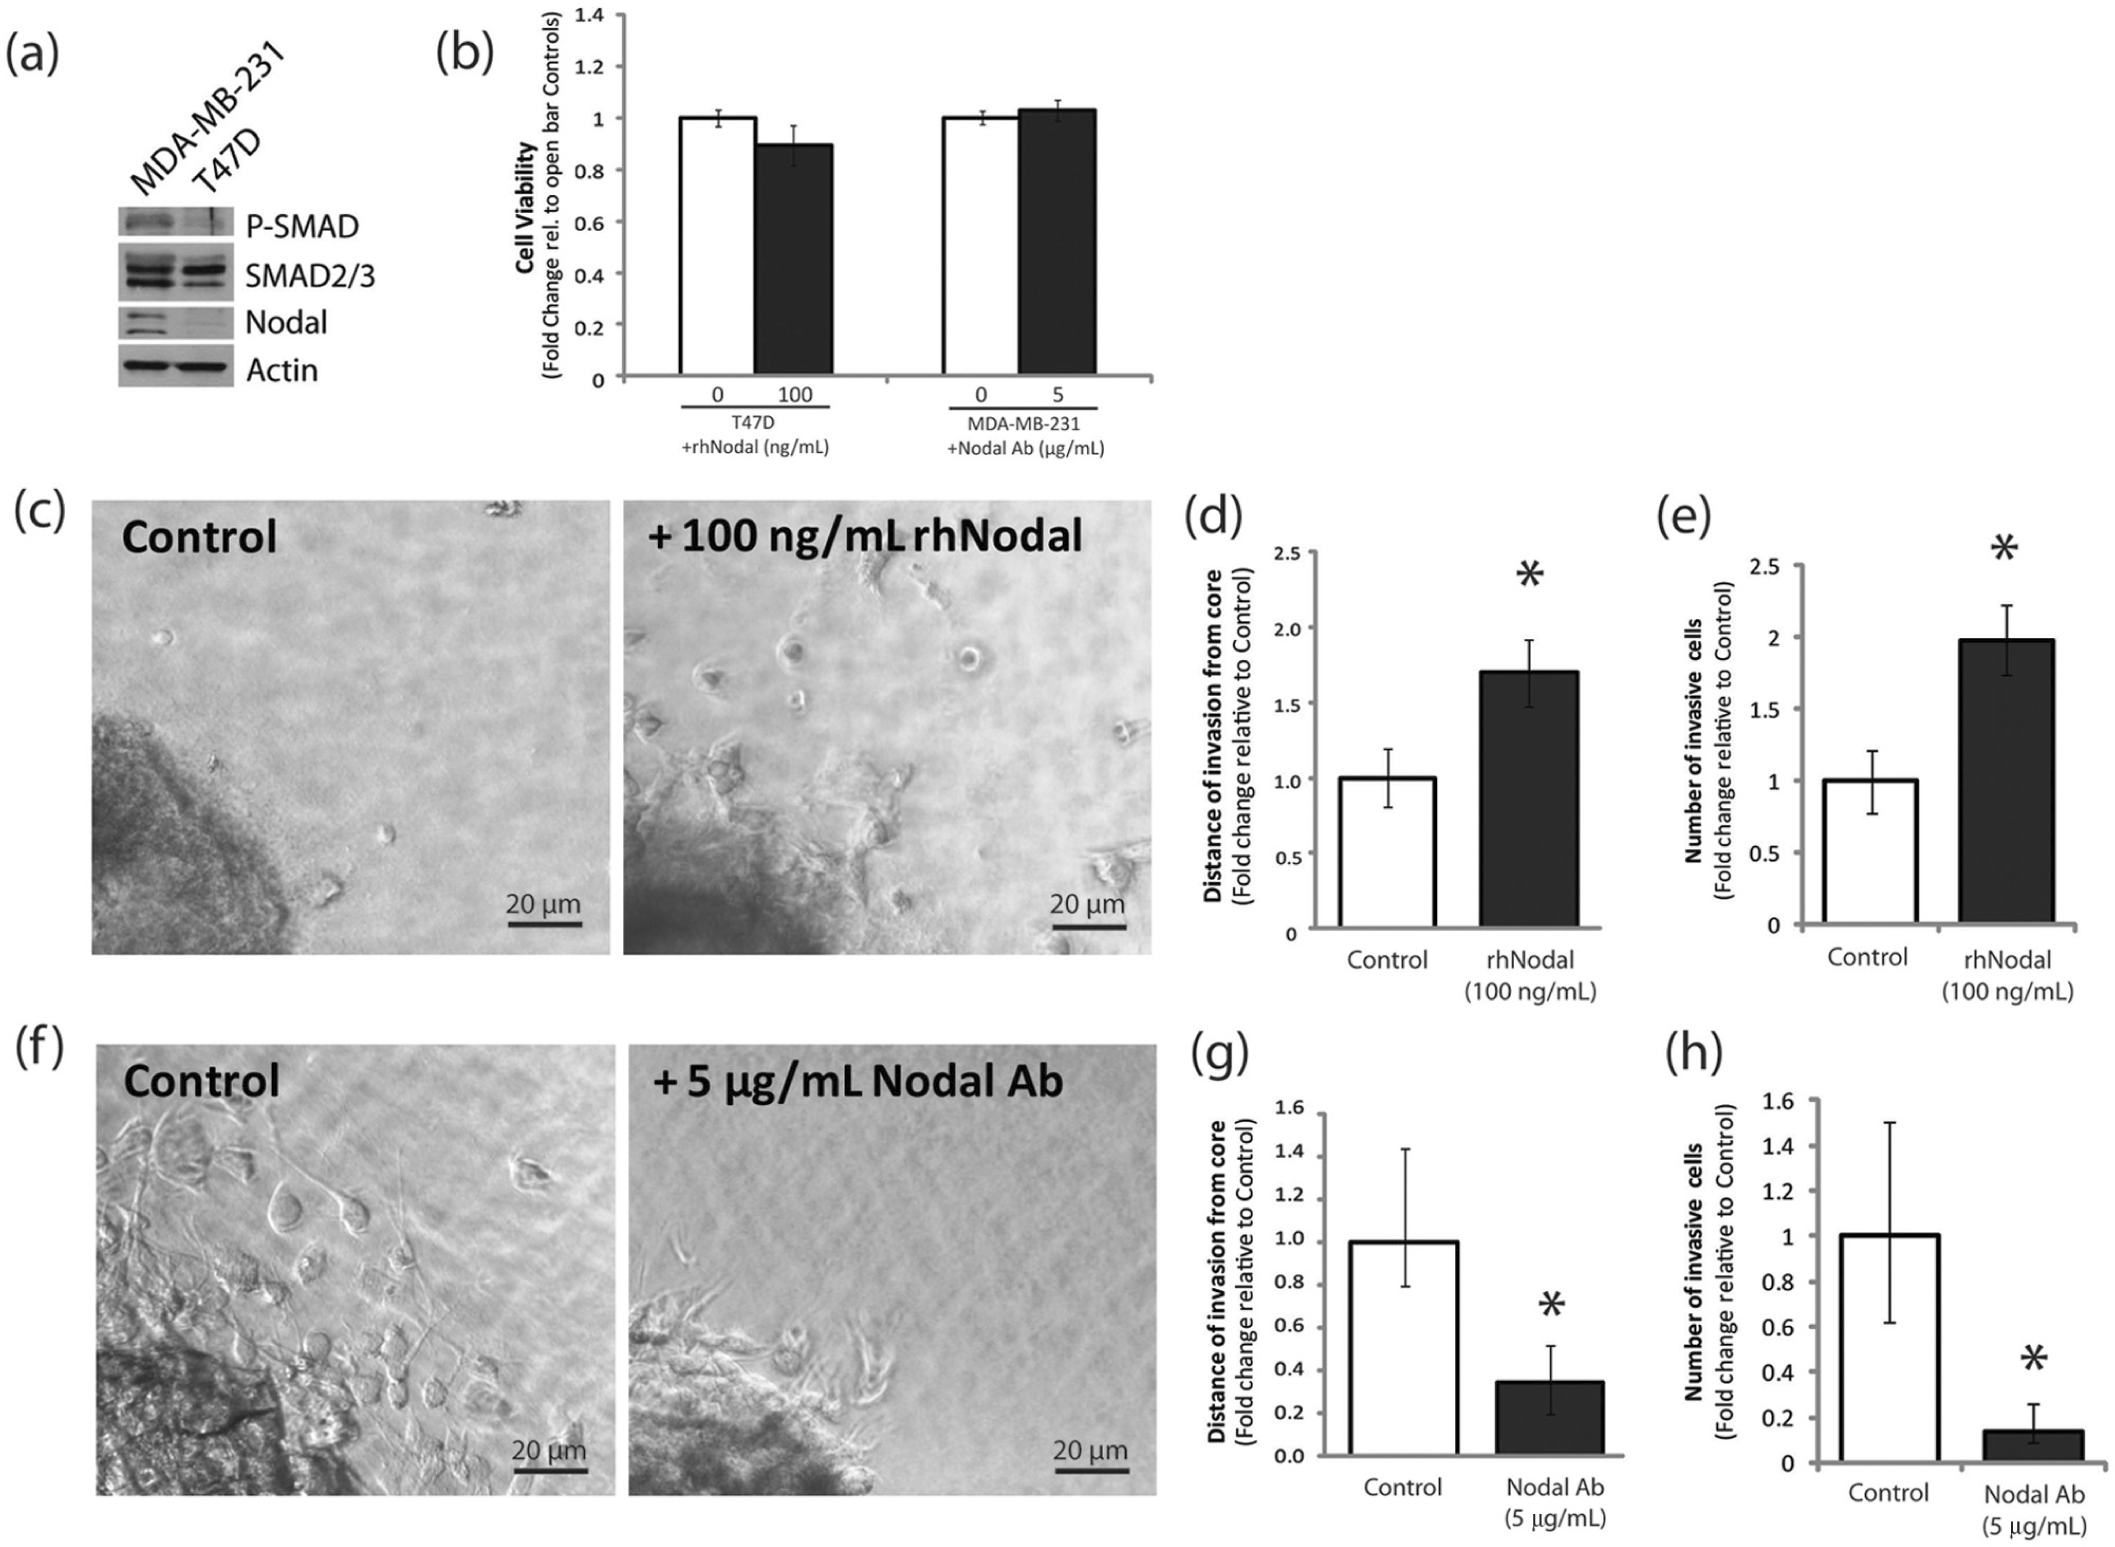
The 3D cell cluster invasion assay appropriately responds to both loss-of-function and gain-of-function treatment conditions. (
Cellular viability
Viability of breast cancer cell lines in response to either rhNodal or a Nodal function-blocking antibody was assessed using the LIVE/DEAD Viability/Cytotoxicity Kit as per the manufacturer’s instructions (Invitrogen).
Statistical analyses
Statistical analyses for nonparametric data were performed using an analysis of variance (ANOVA) on ranks followed by the Mann-Whitney rank-sum test. Nonparametric data were expressed as median ± interquartile range. Statistical analyses for parametric data were performed using a one-way ANOVA followed by a Tukey-Kramer comparisons post hoc test. Parametric data were expressed as mean ± SEM for replicate values. When only two items were compared, a Student t test was used. All statistical tests were two-sided, and data comparisons for all experiments were considered statistically significant at p < 0.05. Between MDA-MB-231 and T47D parental cells, the Z′ factor for our assay is approximately 0.505 (for cell number) and 0.393 (for distance). In comparison, the Z′ factor for a standard Transwell assay in our hands for MDA-MB-231 cells versus T47D cells is 0.463. For distance comparisons, the average of four measurements from one cluster was taken as the distance for that cluster, and p values were derived by comparing these averages across treatment groups, with each group containing at least four clusters. For cell number comparisons, the number of cells that invaded from one cluster was counted, and p values were derived by comparing cell numbers across treatment groups, with each group containing at least four clusters. All statistics were performed using SigmaStat (Dundas Software, Toronto, Ontario, Canada) in consultation with the biostatistical support unit at the University of Western Ontario.
Results and Discussion
Cell culture by the Synthecon RCCS bioreactor generates 3D cancer cell clusters that exhibit regions of hypoxia
As tumors grow and expand in vivo, their centers become hypoxic.5,6 Hypoxia is thought to be an event that triggers a switch to a more aggressive tumor phenotype by selecting for invasive cells and inducing the expression of factors that promote metastasis.5,7 Of note, studying cellular invasion in this context is critical since metastasis is the aspect of cancer progression that requires improved treatment modalities.
Accordingly, we grew cells in the bioreactor for 3 days and then used immunofluorescence to stain for hypoxia, to determine whether the cell clusters displayed heterogeneity that recapitulated a tumor in vivo. Cells were transfected with a green fluorescent protein (GFP)–expression construct so that the structure of each cluster could be seen. First, we noticed that the cell clusters could easily be seen and selected macroscopically, suggesting these structures can get much larger than typical spheroid cultures grown in suspension ( Fig. 2a – c ). Indeed, in accordance with previous studies, 4 these spheroids often exceeded 250 µm in diameter, in comparison to suspension spheroids, which did not grow beyond 100 µm. Furthermore, similar to a tumor in vivo, we found that clusters exhibited hypoxia in their centers compared with their peripheries ( Fig. 2a , b ). This finding validated that our cell clusters were an appropriate starting point for our invasion model, as they exhibit a critical component of tumor heterogeneity.
Analysis of distance and number of invaded cells through collagen type 1
We first wanted to choose an appropriate cell model using both highly invasive and poorly invasive cell lines. We performed a classical Matrigel-coated Transwell invasion assay comparing two highly aggressive breast cancer cell lines (Hs578t and MDA-MB-231) versus two poorly aggressive breast cancer cell lines (T47D and MCD-7) ( Fig. 3a ). We found that the largest difference in invasion was observed between T47D and MDA-MB-231 cells (n = 4, p < 0.001), and therefore, we chose to use these two cell lines for assay development.
To generate cell clusters, we grew T47D or MDA-MB-231 cells in the bioreactor for 3 days. For each cell type, 1 million cells suspended in 1 mL complete media (RPMI + 10% FBS) were seeded into a bioreactor chamber, and air bubbles were removed by filling the chamber with ~10 mL of additional complete media. The bioreactor was placed in an incubator (5% CO2, 37 °C) and set to a rotation of approximately 7 rpm. After 3 days, clusters were removed from the bioreactor and seeded in collagen overlaid with complete media for 36 h. Following termination of the invasion assay, pictures were taken with a phase contrast inverted microscope and camera to measure distance and number of invaded cells.
Distance of invasion was measured by taking an average of measurements at four places evenly spaced around the circumference of each cell cluster ( Fig. 3b ). At each location, the furthest cell was measured from the boundary of the cell cluster. We found that there was an ~80% reduction in the distance of invasion by T47D cells compared with MDA-MB-231 cells (n = 7, p < 0.001) ( Fig. 3c ). This is consistent with the finding that T47D cells are poorly invasive compared with MDA-MB-231 cells ( Fig. 3a ), thus lending support for the applicability of our assay.
In addition to distance of invasion, another clear difference between T47D and MDA-MB-213 clusters was the number of invaded cells. To quantify the number of invaded cells, we opened each cluster image in ImageJ and selected Plugins → Analyze → Count Cells. We used the cell counter to tag and count the invading cells manually. In agreement with our results for distance of invasion, we found that there were significantly fewer invading T47D cells compared with MDA-MB-231 cells (n = 7, p < 0.01) ( Fig. 3d , e ). Again, these results are consistent with the literature and with our experiment that showed T47D cells are poorly invasive compared with MDA-MB-231 cells ( Fig. 3a ).
It should be noted that we also attempted to generate cell clusters in the bioreactor with melanoma cells, including C81-61 and C8161 lines. However, the melanoma clusters were very small and were not as adhesive. When the clusters were seeded in collagen, the cells invaded so rapidly that a cluster boundary could no longer be seen (and therefore the assay was not quantifiable) or the cells did not move at all. Therefore, not all cell lines are appropriate for this assay: An ability to form a bioreactor cluster is necessary prior to seeding in collagen.
3D CCI assay can be used to screen for biomolecules that regulate cellular invasion
To test our protocol, we decided to design both gain-of-function and loss-of-function experiments. We chose to examine the effects of an embryonic factor called Nodal on breast cancer invasion. Nodal is a member of the transforming growth factor (TGF)–β superfamily that promotes a robust invasive phenotype during cancer progression.8–11 In normal physiological contexts, Nodal plays an essential role mediating invasion events during embryonic development and placentation.12,13 Furthermore, recent studies from our laboratory have shown that Nodal promotes breast cancer invasion, making Nodal an ideal candidate to test our experimental system. 11
Nodal signals through phosphorylation of SMAD2/3, which forms a complex with SMAD4 and translocates to the nucleus to regulate transcription of target genes. We found that poorly invasive T47D cells express low levels of Nodal and P-SMAD2, compared with highly invasive MDA-MB-231 cells, which express high levels of Nodal and P-SMAD2 ( Fig. 4a ). Accordingly, we decided to add recombinant human Nodal (rhNodal) to T47D cells as a gain-of-function model or inhibit Nodal in MDA-MB-231 cells using a function-blocking antibody (Nodal Ab). Concentrations were chosen based on previous studies in our laboratory demonstrating that 100 ng/mL rhNodal and 5 mg/mL Nodal antibody most effectively activate and block Nodal signaling, respectively. Note that in both cases, the treatment concentrations that were chosen did not affect cell viability ( Fig. 4b ).
First, we used rhNodal treatment on T47D cells to evaluate whether we could stimulate invasion in our 3D assay. We grew T47D cell clusters in the bioreactor for 3 days and incubated clusters in collagen with either 0 ng/mL rhNodal (control) or 100 ng/mL rhNodal for 1 week. We found that rhNodal significantly increased distance of T47D cell invasion from the cluster boundary by more than 1.5-fold (n = 10, p < 0.05) (
Fig. 4c
,
d
). Furthermore, the number of invaded cells was approximately 2-fold higher in rhNodal-treated T47D cells compared with controls (n = 10, p < 0.01) (
Next, we used a Nodal-blocking antibody (vs isotype control) to block Nodal in MDA-MB-231 cells. We grew MDA-MB-231 cell clusters in the bioreactor for 3 days and incubated clusters in collagen with either an isotype control antibody (control) or 5 µg/mL Nodal Ab for 36 h. We found that Nodal Ab significantly decreased distance of MDA-MB-231 cell invasion from the cluster boundary by more than 60% compared with controls (n = 5, p < 0.01) ( Fig. 4f , g ). Furthermore, the number of invaded cells was approximately 90% lower in Nodal Ab–treated MDA-MB-231 cells compared to isotype controls (n = 5, p < 0.01) ( Fig. 4h ). These results indicate that Nodal inhibition in aggressive breast cancer cells results in a decrease of 3D invasion, consistent with previously published reports.8,11
In summary, we have developed a unique in vitro invasion assay that mimics key aspects of in vivo tumor invasion. By growing cancer cells in a bioreactor, 4 we are able to generate 3D cell clusters that can be used to assess 3D cellular invasion, in contrast to classical 2D invasion assays that evaluate the behavior of cell monolayers or suspensions. Furthermore, like tumors in vivo, these cell clusters display heterogeneity in that they exhibit regions of both hypoxia and normoxia. The modified whole-mount immunofluorescence technique developed in this study allows the 3D analysis of parameters such as oxygen availability without the need for sectioning, thereby enabling one to investigate how tumor heterogeneity may correlate with functional parameters such as invasion. The methodology presented herein may also be miniaturized for high-throughput screening. Indeed, larger capacity bioreactor vessels are available from Synthecon, which could be used to generate hundreds of cluster. Furthermore, many plates could be seeded at one time, and the assays could be conducted in a 96-well format with automated imaging programs designed to acquire microscopic data over time using a mechanical stage. Taken together, the 3D CCI assay provides a simple, inexpensive, and physiologically relevant context to study cellular invasion in vitro, in a way that better recapitulates in vivo disease, and that could be modified for use in high-throughput screening of potential anticancer biomolecules.
Footnotes
Acknowledgements
We would like to give credit to Chris Hughes, who originally put cancer cells in the bioreactor.
Declaration of Conflicting Interests
The authors declared no potential conflicts of interest with respect to the research, authorship, and/or publication of this article.
Funding
The authors disclosed receipt of the following financial support for the research, authorship, and/or publication of this article: This work was supported by the Canadian Institutes for Health Research (CIHR; MOP 89714 and PLS 95381) and the Cancer Research Society to LMP. DQ is a recipient of fellowships from the Canadian Breast Cancer Foundation and from the CIHR Strategic Training Program in Cancer Research and Technology Transfer. LMP is the recipient of the premier new investigator award from the CIHR.
References
Supplementary Material
Please find the following supplemental material available below.
For Open Access articles published under a Creative Commons License, all supplemental material carries the same license as the article it is associated with.
For non-Open Access articles published, all supplemental material carries a non-exclusive license, and permission requests for re-use of supplemental material or any part of supplemental material shall be sent directly to the copyright owner as specified in the copyright notice associated with the article.