
Abstract
Aminoacylation has been implicated in a wide variety of cancers. Aminoacyl-tRNA synthetases (ARSs) exist in large excess in tumor cells due to their increased demand for translation, whereas most other protein-synthesis apparatuses are quantitatively limited. Among other components that constitute the translation machinery—namely, tRNA, amino acid, ATP, and ARS—ARS is the only target that can be blocked by small molecules. No constitutively active ARSs have been reported, and mutations of ARS can cause inaccurate substrate recognition and malformation of the multi-ARS complex (MSC). Hence, interference of the activity is expected to be independent of genotype without developing resistance. Here, we report a high-throughput screening (HTS) system to find mammalian ARS inhibitors. The rabbit–reticulocyte lysate we used closely resembles both the individual and complexed structures of human ARSs, and it may predispose active compounds that are readily applicable for humankind. This assay was further validated because it identified familiar translational inhibitors from a pilot screen, such as emetine, proving its suitability for our purpose. The assay demonstrated excellent quality control (QC) parameters and reproducibility, and is proven ready for further HTS campaigns with large chemical libraries.
Keywords
Introduction
Dysregulation of translation is one of the most prominent characteristics of oncogenic transformation and tumor maintenance. As many signal transduction pathways known to be altered in cancer are integrated into protein synthesis, 1 therapeutic interventions that target translational machinery have been expected to overcome resistance from genomic heterogeneity. 2
A group of translation components can be overabundant in cells, and the excess is often hijacked by cancer cells. For example, a surplus of eIF4E, one of the cap-binding factors, is found to be coupled with the translation of stress-response transcripts that are critical for tumor cell survival; and only a half level of eIF4E expression is sufficient in normal cells to accomplish its physiological role. 3 Another elongation factor, eIF5A, has an isotype highly expressed in many types of cancer that drives tumorigenesis, cancer cell growth, and the epithelial-mesenchymal transition. 4
Aminoacylation is another nonlimiting element of translation. tRNA, the substrate of ARSs, outnumbers the binding capacity of ribosomes. 5 Aminoacylation of tRNAs occurs faster than depletion of aminoacylated tRNAs. 6 Transportation and deacylation of tRNAs are under tight control. To efficiently shuttle tRNAs between ARSs and ribosomes, at least nine different ARSs are known to assemble into a MSC. 7 Moreover, EF-1 complexes with ARSs (in this case, both aminoacylated and deacylated forms of tRNAs), which ultimately holds back diffusion of tRNAs and harnesses them into an organized conveying system.8,9 Most ARSs are known to be upregulated in cancer, 10 and many are proven to be dependent on aminoacylation activity for tumor promotion, such as alanyl-tRNA synthetase (AARS), phenylalanyl-tRNA synthetase (FRS), glycyl-tRNA synthetase (GRS), aspartyl-tRNA synthetase (DRS), threonyl-tRNA synthetase (TRS), histidyl-tRNA synthetase (HRS), tryptophanyl-tRNA synthetase (WRS), and lysyl-tRNA synthetase (KRS) in prostate cancer, 11 and methionyl-tRNA synthetase (MRS) in colon cancer. 12
Cancer cells also can take advantage of mis-aminoacylation. For example, MRS acylates noncognate tRNAs to scavenge reactive oxygen species (ROS). 13 Under prolonged oxidative-stress conditions, however, preferentially incorporated methionines promote multiple random mutations that can lead to tumorigenesis.
ARS inhibitors have been used mainly as antibacterial, antifungal, and antimalarial drugs.14 –18 First-generation natural ARS inhibitors had little selectivity for different species, so most previous development was based on chemical derivation to remove side effect activities in humans.19,20 Only recently, several studies have revisited borrelidin21,22 and halofuginone23,24 as anticancer drugs. Therefore, using large-scale screening campaigns testing ARSs against a wide variety of chemical entities makes sense and should broaden the availability of anticancer drug developments with novel candidates of eukaryotic ARS inhibitors.
Previously, we developed an in vitro translation system to monitor selective inhibition of TRS. 25 In this study, we optimized this assay for high-throughput screening (HTS) and demonstrated its potential applications to all ARSs. A collection of pharmaceutically active compounds (LOPAC; n = 1280 compounds) was successfully screened with suitable Z and Z’ values (0.79 ± 0.06 and 0.93 ± 0.02, respectively), thus proving the suitability of the assay for screening for new active general ARS inhibitors. We also implemented a counterscreen that discriminates between specific and nonspecific chemicals for protein synthesis; it helped to select a set of inhibitors for follow-up target-identification studies.
Materials and Methods
Materials
Yeast total tRNA (cat. no. 10109509001) was purchased from Roche. Potassium chloride (KCl; cat. no. P9541) and magnesium chloride hexahydrate (MgCl2•6H2O; cat. no. M2670) were purchased from Sigma-Aldrich. Spermidine (cat. no. AC132740010) was a product from Acros, and firefly luciferase mRNA (cat. no. L-6107) was synthesized at TriLink BioTechnologies. Optiplate-384 (cat. no. 6005310) was from PerkinElmer. Rabbit Reticulocyte Lysate System (cat. no. L4960) and Bright-Glo Luciferase Assay System (cat. no. E2620) were from Promega. The multimode microplate reader (EnVision, PerkinElmer) was used for reading luciferase signals, and all parameters were calculated with the GraphPad Prism 6.02 suite of programs or Scripps internal database software (Symyx).
Methods
Primary In Vitro Translation Assay
Rabbit reticulocyte lysate was diluted in buffer A (10 mg L−1 yeast total tRNA, 80 mM KCl, 0.25 mM MgCl2, 0.1 mM spermidine, and 50 µM amino-acid mixture) or buffer T (80 mM KCl, 0.25 mM MgCl2, and 0.1 mM spermidine) by 10-fold. Firefly luciferase mRNA was added at 20 mg L−1 as a template. The incubation time was 20 h. All other procedures followed the manufacturer’s manual (Promega).
HTS-Optimized In Vitro Translation Assay
The in vitro translation assay described above was modified to be compatible with HTS. We chose to use buffer A as the diluent, and the final concentrations of yeast total tRNA and KCl were reduced to 3.53 mg L−1 and 25.20 mM, respectively. The amount of spermidine was adjusted to 63 µM, and the amino-acid mixture was excluded. 1.25 mg L−1 firefly luciferase mRNA was used as the template. The mixture of all the components, including rabbit reticulocyte and compounds, was incubated at 26.5 °C for 25 h, instead of 30 °C for 20 h. The luciferase signal was read by the Enhanced2 Luminescence option (US Luminescence) of EnVision.
Counterscreen
For counterscreening, the mixture of yeast total tRNA, KCl, MgCl2, spermidine, firefly luciferase mRNA, and rabbit reticulocyte lysate was incubated at 26.5 °C for 25 h. At that time (i.e., when the reaction was already completed), the compounds were added right before the step of luciferase substrate addition and subsequently read. All other procedures were kept the same as in the HTS-optimized in vitro translation assay.
Results and Discussion
Assay Principle
To maximize the system’s efficiency, each step in the primary in vitro translation assay was optimized individually. When titrating firefly luciferase mRNA from 0.04 to 20 mg L−1, the luciferase activity increased fourfold when the concentration was diluted 16-fold ( Fig. 1a ). The data points adjacent to the final concentration, 1.25 mg L−1, yielded steep slopes, suggesting that the efficiency of in vitro translation was highly dependent on the optimal number of target molecules (~1010 molecules of firefly luciferase mRNA).
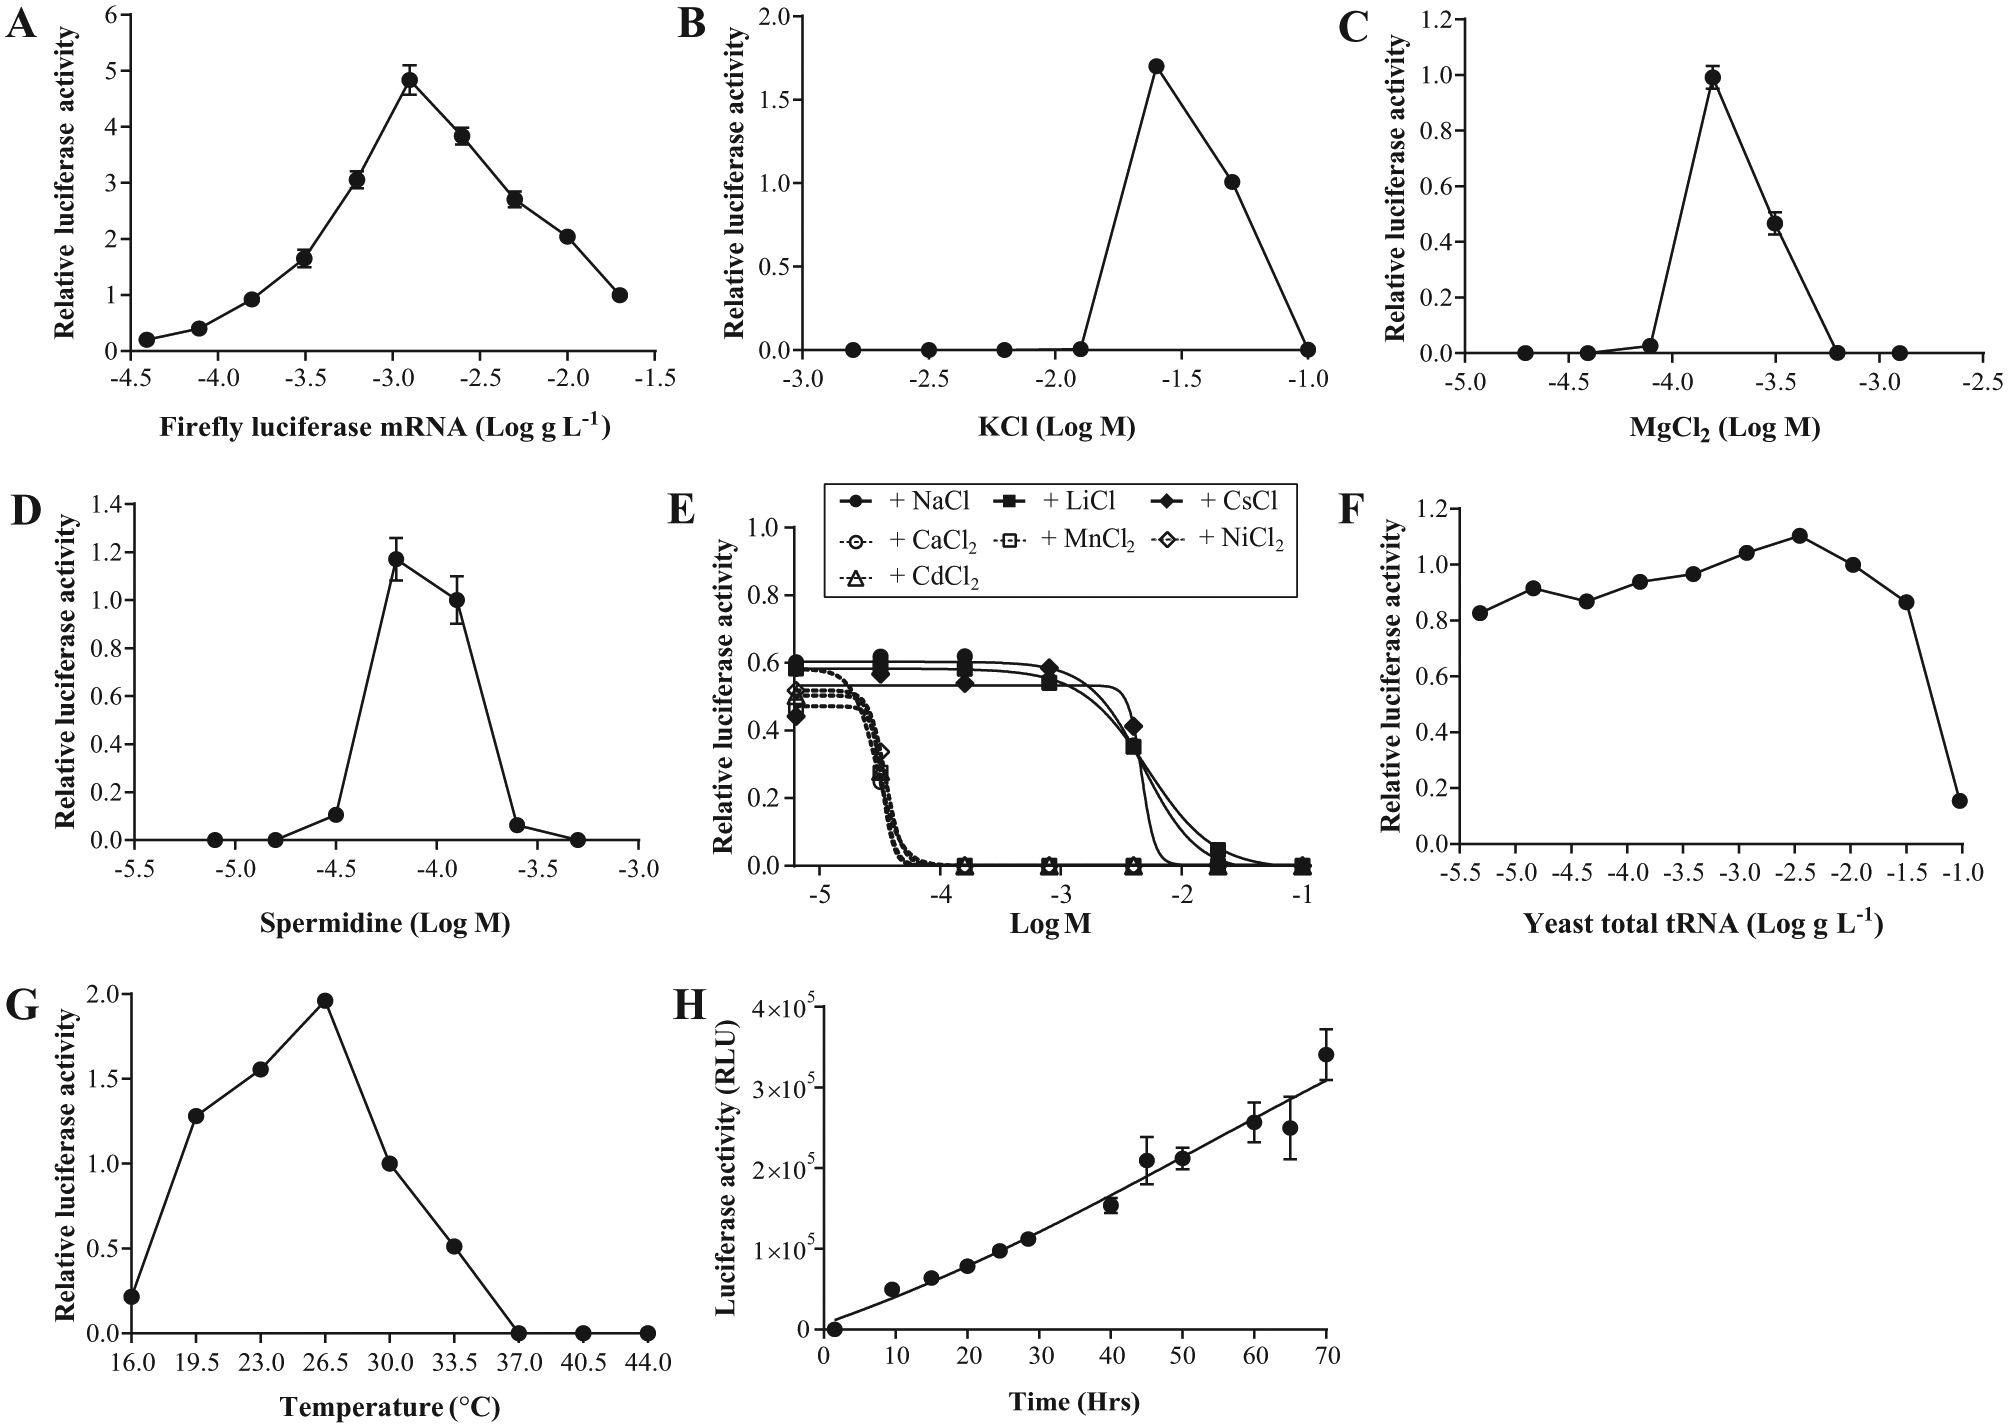
Optimization of an in vitro translation system for an automated HTS format. The optimal concentrations of (a) firefly luciferase mRNA, (b) KCl, (c) MgCl2, (d) spermidine, and (f) yeast total tRNA were determined. All the original concentrations of each component fell into the range of serial dilution. When the exact concentration was not included in the experiment, the approximate point (50 mM KCl and 0.2 mM MgCl2) was considered as the standard value for the relative-difference calculation. (e) NaCl, LiCl, CsCl, CaCl2, MnCl2, NiCl2, and CdCl2 were added for various concentrations in the presence of 32 mM KCl and 0.25 mM MgCl2. The assay conditions were tested for (g) temperature and (h) length of time. All points were measured in triplicate (a–h).
KCl, MgCl2, and spermidine are charged components in dilution buffer A. They were tested in wide ranges of concentration (at 1.6–100 mM, 0.02–1.3 mM, and 8–500 µM, respectively), and all three factors were affirmed as indispensable for the assay system ( Fig. 1b–d ). The initial concentrations were (or were near) optimal condition; slight changes were made for KCl (from 80 mM to 32 mM) and spermidine (from 0.1 mM to 33 µM), but not for MgCl2. To examine whether other cation concentrations had potential for signal improvement, several monovalent (Na+, Li+, and Cs+) and divalent (Ca2+, Mn2+, Ni2+, and Cd2+) cations were supplemented in forms of chloride salt in addition to KCl and MgCl2. These factors showed signal disruption instead of enhancement, and the patterns were dependent on their charges ( Fig. 1e ). The ionic pool of KCl and MgCl2 already may be sufficient to support the translation activity and hinder benefits from additional ions. Surprisingly, none of the combinations of monovalent and divalent cations produced a signal except the K+–Mg2+ pair (data not shown). Hence, we concluded that the diluted system needed to be buffered with both K+ and Mg2+.
The previous concentration of yeast total tRNA tested was found to generate a downhill slope of a concentration-signal curve and was adjusted by threefold to fall into a plateau ( Fig. 1f ). Temperature was another determinant for efficient protein synthesis, and a range between 20 and 30 °C produced the highest signal–background (S/B) ratios ( Fig. 1g ). When the incubation time was lengthened, luciferase activity kept increasing linearly throughout 3 days of measurement ( Fig. 1h ), followed by a sharp drop in signal to the level of null at day 4. This may be due to the longtime exposure of bare cellular components in vitro. Therefore, we considered the Z’ factor, coefficient of variation (%CV), and S/B value to determine an appropriate time length for incubation. In principle, the incubation time can be scaled to preference because all Z’ values calculated were greater than the threshold of a robust HTS, >0.5. The %CV value was, however, the lowest at 9.5 h and stayed stable between 24.5 and 40 h. We chose 25 h for the convenience of operation ( Table 1 ).
Statistics from Various Incubation Times.
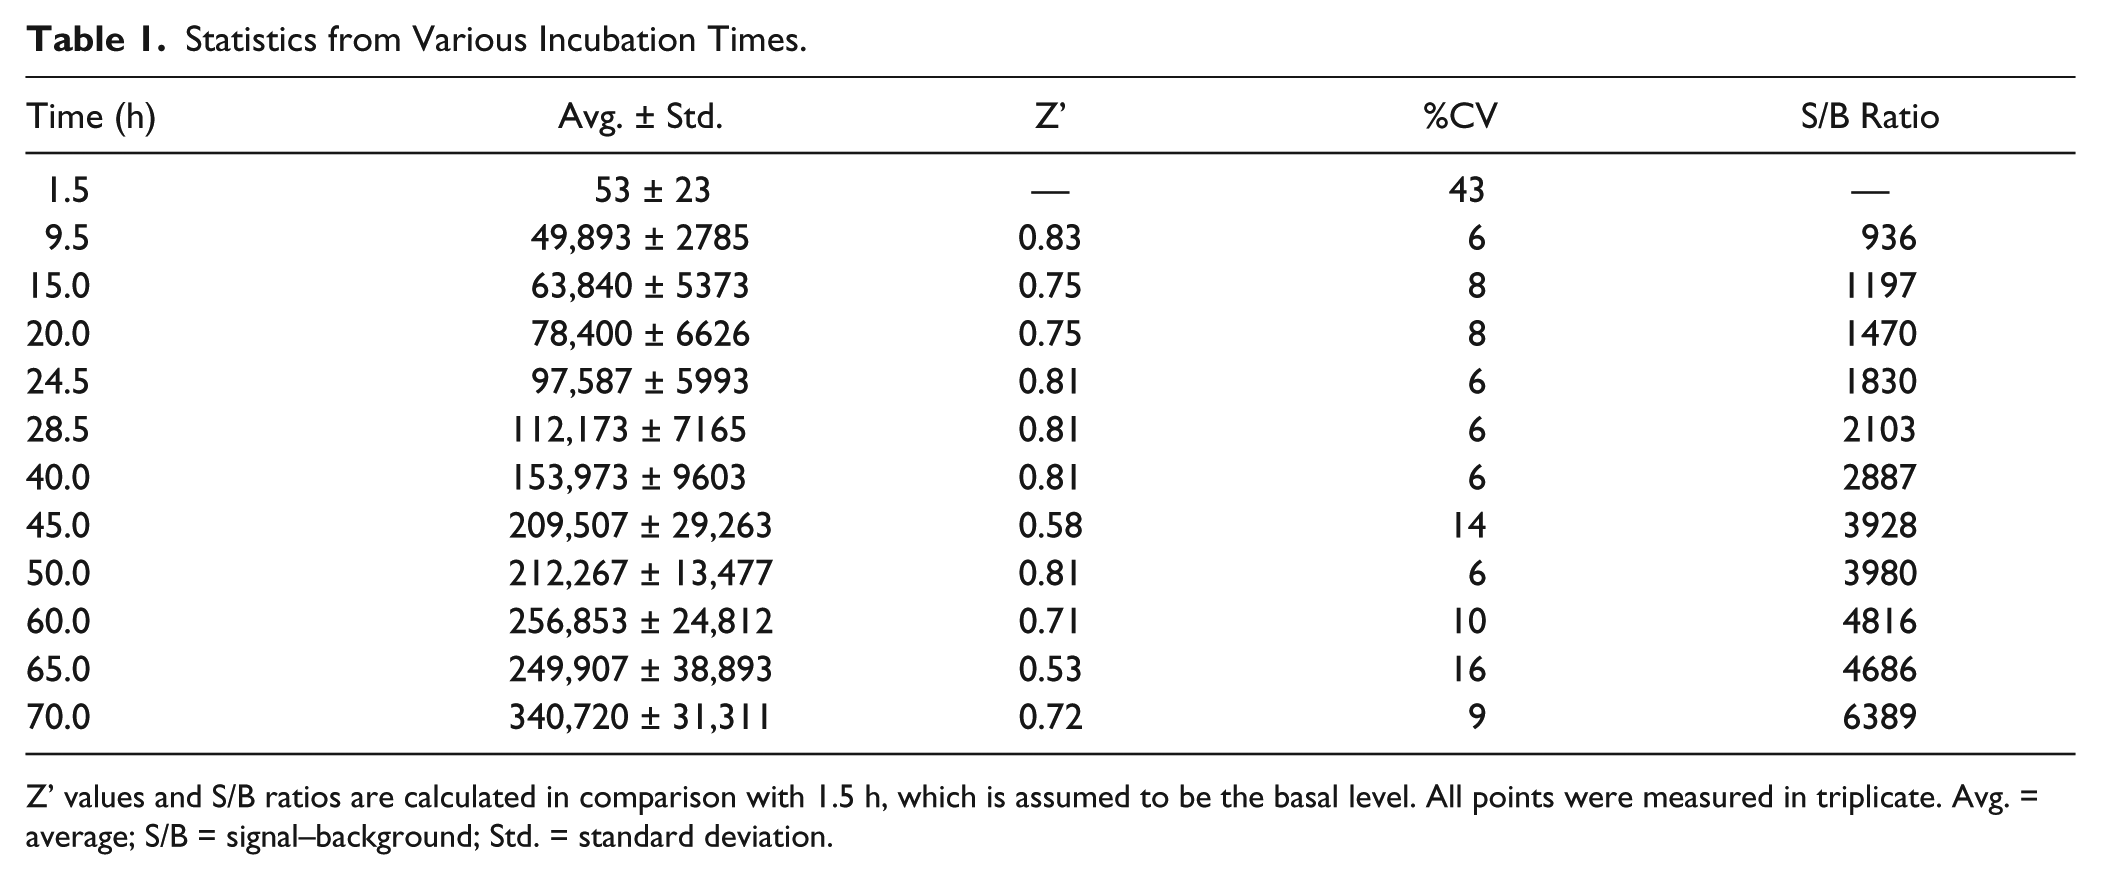
Z’ values and S/B ratios are calculated in comparison with 1.5 h, which is assumed to be the basal level. All points were measured in triplicate. Avg. = average; S/B = signal–background; Std. = standard deviation.
The additional supplement of amino-acid mixture from buffer A was withheld to allow for high sensitivity toward amino-acid analogs.
Selection of Compound for Positive Control
Prior to compound addition, DMSO tolerance was examined; DMSO is the most common solvent of drug libraries ( Fig. 2a ). There was a small affect seen in the range between 1 and 3% based on the highest signal intensity, so 2% was chosen to allow room for minor mechanical errors that may arise from dispensing or pinning.
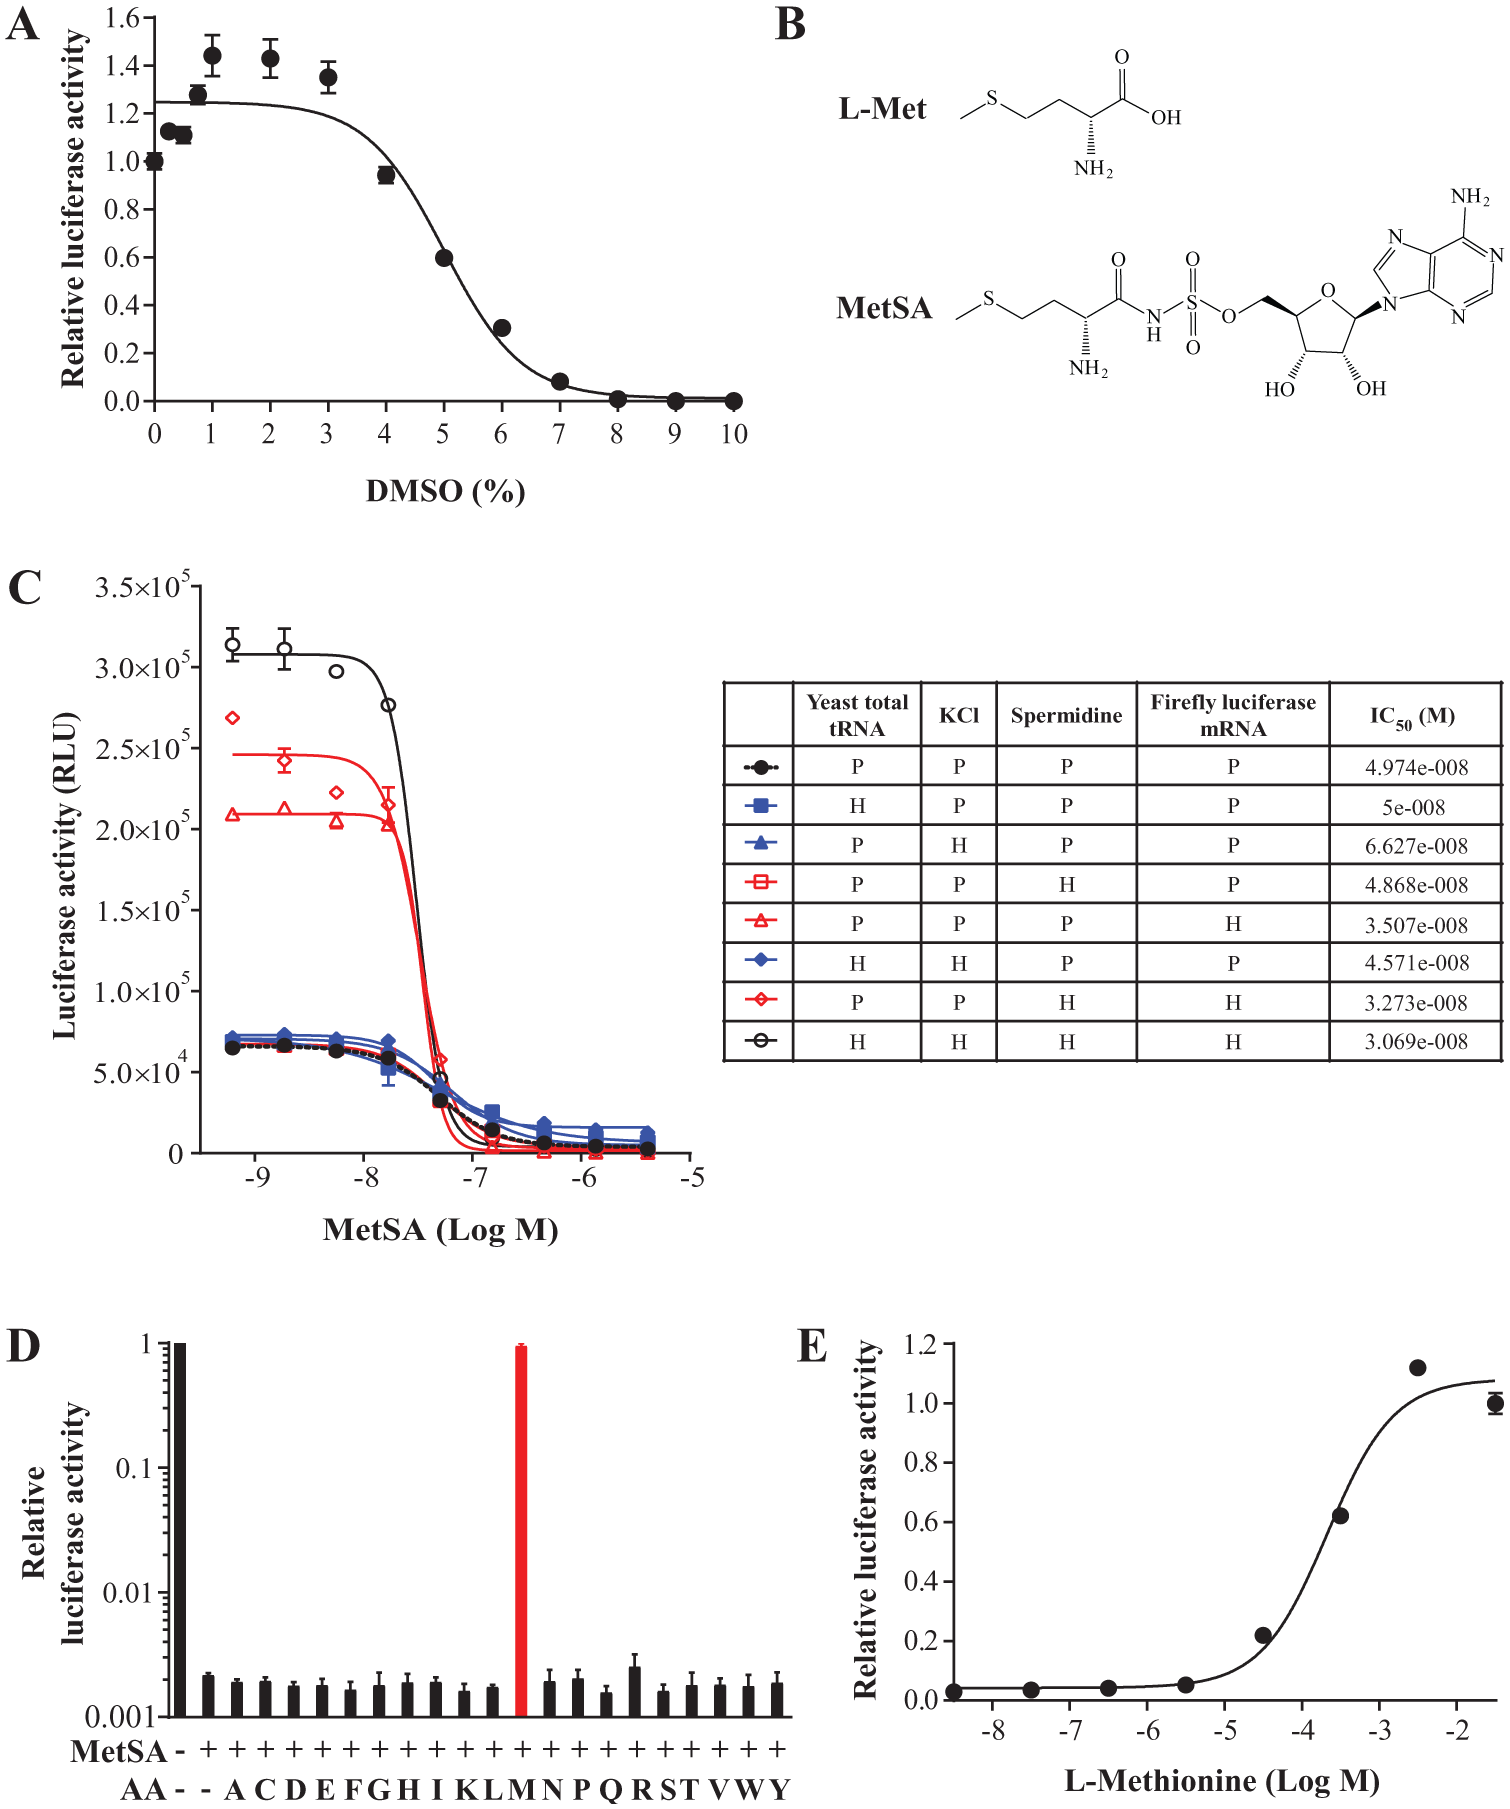
Sensitivity and specificity of the HTS-compatible system. (a) DMSO tolerance of the setup was measured. (b) Comparison of the structures between L-methionine and 5’-O-[(L-methionyl)-sulfamoyl]adenosine (MetSA). (c) Quantification of sensitization by individual-component optimization. MetSA was serially diluted from 4 µM by threefold. P = primary condition; H = HTS-optimized condition. (d) L-amino acids were added to rescue translational activity inhibited by MetSA. 10 mM L-amino acids and 200 nM MetSA were used. (e) L-methionine restored translational activity dose-dependently. EC50 = 224.0 ± 66.2 µM. All data points were performed in triplicate for (a) from (c) through (e).
5’-O-[(L-methionyl)-sulfamoyl]adenosine (MetSA) has an unmodified amino terminus that can compete with L-methionine for the catalytic pocket of MRS in vitro ( Fig. 2b ). From this structure-based hypothesis, we expected MetSA to perturb the translational activity of MRS in vitro and found that the final assay system was inhibited dose-dependently by MetSA at the nanomolar scale. Furthermore, to verify system sensitization through individual-component optimization, we compared IC50 values of MetSA from different compositions of the four factors. Separate adjustments of yeast total tRNA ( Fig. 1f and 2c ) and KCl ( Fig. 1b and 2c ) to their most favored concentrations for the signal intensity made the assay less sensitive to MetSA than the primary setup. Those of spermidine ( Fig. 1d and 2c ) and firefly luciferase mRNA ( Fig. 1a and 2c ), however, improved the responsiveness of the assay. When both yeast total tRNA and KCl were altered at the same time, the basal level of signal increased even with the high doses of MetSA. In contrast, the combination of spermidine and firefly luciferase mRNA refinements gave better responsiveness than the two components individually did. In this case, however, the luciferase activity at the low concentrations of MetSA became unstable; this may be due to the lack of balance between the buffered ions. We found that simultaneous optimization of all four factors enhanced not only the signal window but also the sensitivity of the system ( Fig. 2c ). Importantly, the blockage was restored by exogenous addition of L-methionine, but not by 19 other amino acids, supporting that the inhibition of translation is due to specific inhibition of MRS ( Fig. 2d ). And L-methionine recovered MRS activity in a dose-dependent manner ( Fig. 2e ). We also hypothesized direct deprivation of MRS protein by anti-MRS antibody. We found, however, that currently available mouse and rabbit immunoglobulins (IgGs) themselves had nonspecific inhibitory effects on the assay (data not shown). Thus, we proceeded using the amino-acid analog as the direct positive control for the system.
Pilot Screen of the LOPAC Collection
The HTS readiness of the assay was confirmed by pilot screening the LOPAC library in 384-well format. Before the pilot screen, we made sure that concentration-response curves and IC50 values generated from benchtop and automated formats were overlapping ( Fig. 3a ). The concentration of MetSA for the high-inhibition control was set as 3.16 µM to achieve complete (> 97 %) inhibition. The low-inhibition control wells received DMSO only. The LOPAC compounds were dispensed nominally as 2.5 µM final, done with 10 nL pinned from the 2.5 mM compound stock. To match up the final concentration of DMSO at 2%, additional DMSO was supplemented in the dilution buffer.
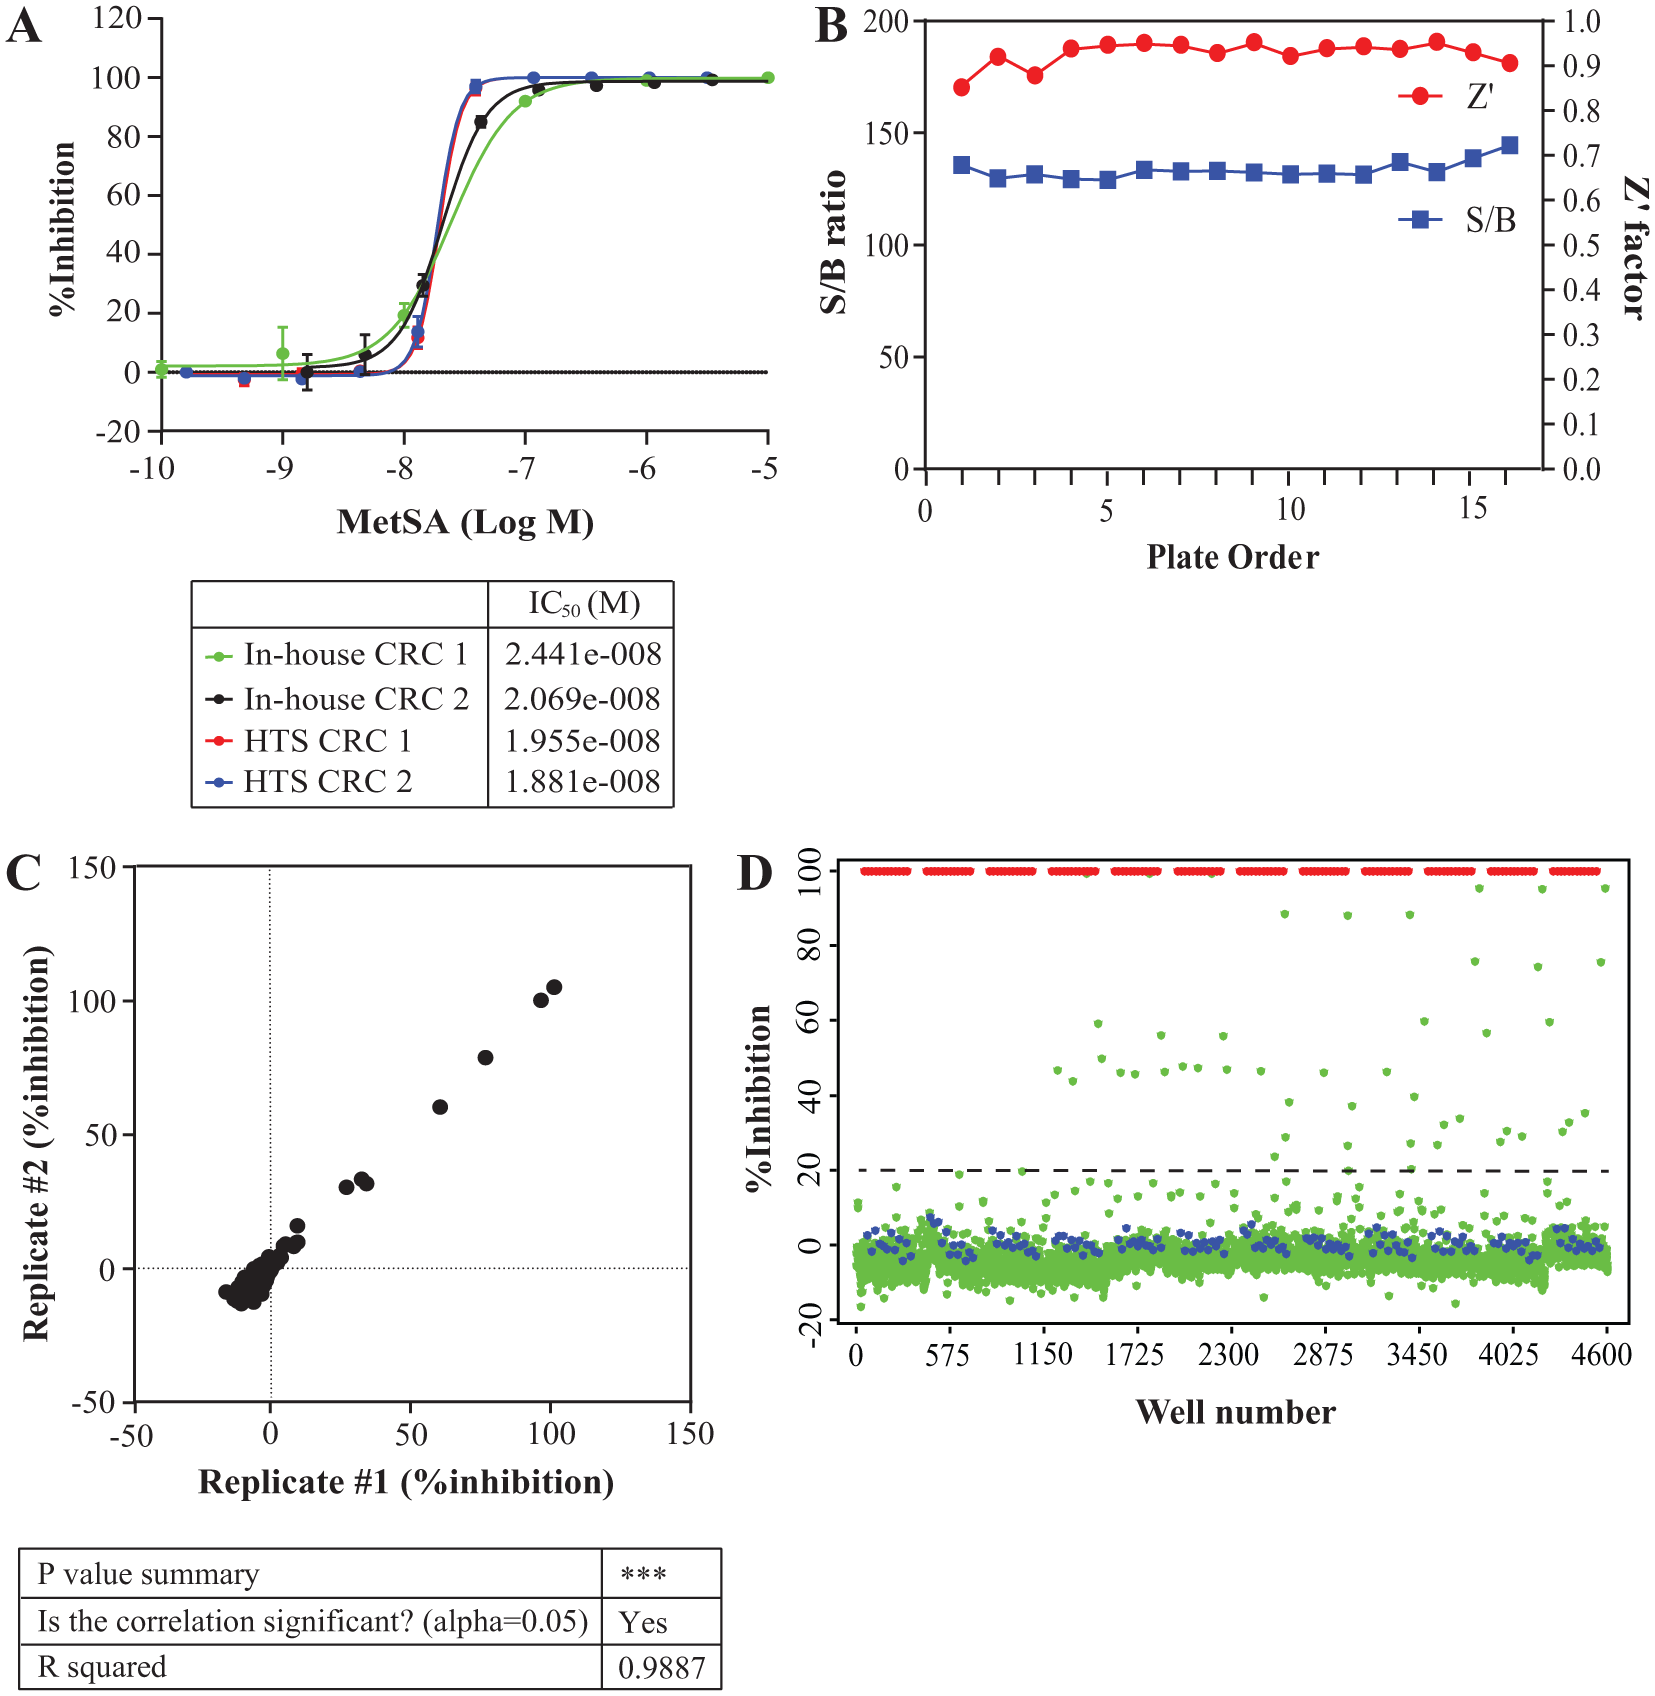
LOPAC pilot screen results. (a) The overlap of concentration-response curves (CRCs) of MetSA from benchtop and automated procedures. Each independent experiment was performed in triplicate. (b) The Z’ values and S/B ratios performed on whole plates were stable. (c) The reproducibility of inhibition profiles from the LOPAC compounds. (d) The scatterplot from the LOPAC library (green dot), high-control (red dot), and low-control (blue dot). A black-dotted line indicates the hit cutoff.
Statistics from the LOPAC pilot screen remained steady, indicating an excellent assay with Z values averaging 0.79 ± 0.06, Z’ values = 0.93 ± 0.02, and S/B ratios = 132.0 ± 2.2 among all plates ( Fig. 3b ). Reproducibility of individual compounds was also high enough, as the R 2 from the scatterplots of replicated measurements was >0.9 (R 2 = 0.9887; Fig. 3c ). We set the preliminary hit-identification cutoff as the sum of the mean and three times the standard of all samples tested (cutoff = 20.06% inhibition), which identified 1.17% of compounds from the LOPAC collection (n = 15) that showed greater response than the cutoff ( Fig. 3d ).
Counterscreen and Hit Classification
The preliminary hits were subjected to serial dilution and retesting in the primary assay and counterscreen in parallel. The primary assay again showed consistent Z’ values and S/B ratios (Z’ = 0.84 ± 0.01 and S/B = 23.8 ± 0.9, and Z’ = 0.91 ± 0.02 and S/B = 26.8 ± 0.4, respectively) in the same HTS format. Representative graphs are shown in Figure 4a . When testing at the highest serial dilution starting concentration of 8.5 µM, 13% of the compounds failed to show dose-dependent inhibition and were excluded from further analysis (n = 2) ( Fig. 4a , group A). The counterscreen effectively eliminated false-positives from the rest, which, as tested, identified compounds that interrupted the activity of luciferase itself or quenched luminescence. As a result, 47% of the preliminary hits were identified as false-positives (n = 7) ( Fig. 4a , group B). The remaining 40% (n = 6) showed great selectivity over the counterscreen ( Fig. 4b ).
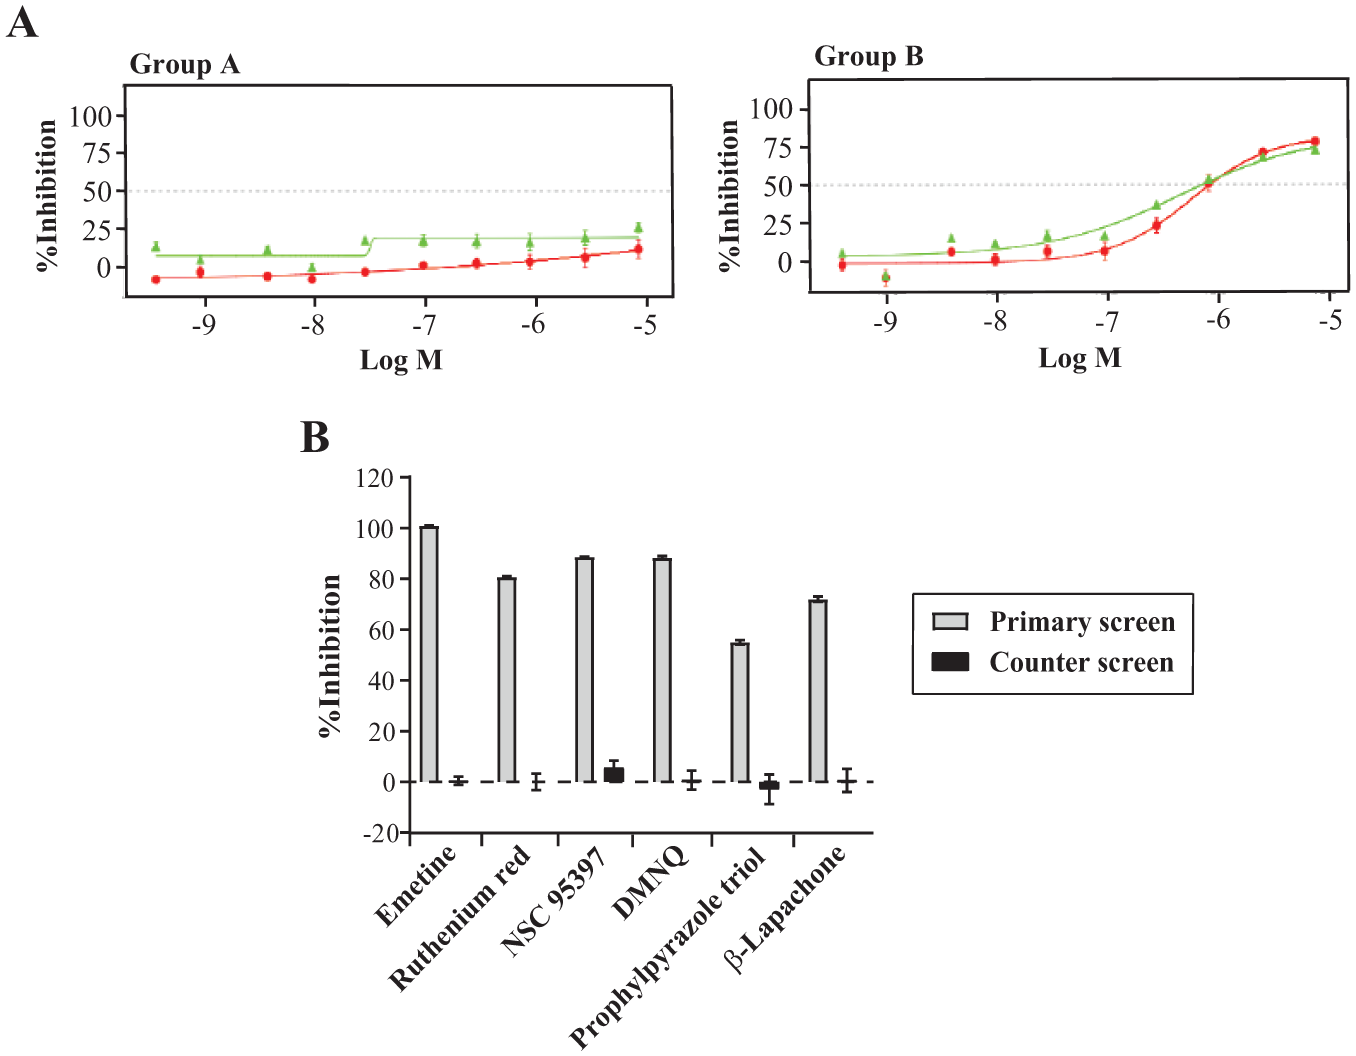
Dose-dependent titration and counterscreen of preliminary hits. (a) Representative dose–response curves of the false-positive and -negative compounds. Green line is the dose–response curve from the HTS-optimized in vitro translation assay setup. Red line is from the counterscreen. (b) Percentage inhibition of six true positives at 8.5 µM. All points were performed in triplicate from (a) through (b).
All six true positives are known to be directly or remotely related to part of protein translation. Emetine dihydrochloride hydrate ((2S,3R,11bS)-2-[[(1R)-6,7-dimethoxy-1,2,3,4-tetrahydroisoquinolin-1-yl]methyl]-3-ethyl-9,10-dimethoxy-2,3,4,6,7,11b-hexahydro-1H-benzo[a]quinolizine;hy- drate;hydrochloride), the most potent compound, is a well-known protein-synthesis inhibitor targeting the ribosomal 40S subunit.26,27 Its IC50 from our screen is at nanomolar concentration, proving that the assay is a promising platform for further translation-inhibitor-screening campaigns. Ruthenium red (azane;ruthenium(2+);hexachloride;dihydr-ate), a Ca2+-signaling inhibitor, regulates cytoplasmic polyadenylation element binding protein (CPEB)-dependent mRNA translation.28,29 NSC 95397 (2,3-bis(2-hydroxyethylsulfanyl)naphthalene-1,4-dione) and DMNQ (2,3-dimethoxynaphthalene-1,4-dione) share a 1,4-naphthoquinone moiety, which causes oxidative stress and leads to global suppression of protein-synthesis initiation.30 –33 β-Lapachone (2,2-dimethyl-3,4-dihydrobenzo[h]chromene-5,6-dione) resembles part of the structure of 1,4-naphthoquinone. Interestingly, these three compounds in the 1,4-naphthoquinone scaffold showed similar IC50 values in our system. Propylpyrazole triol (4-[2,3-bis(4-hydroxyphenyl)-4-propyl-1H-pyrazol-5-ylidene]cyclohexa-2,5-dien-1-one), an agonist of estrogen receptor alpha, controls protein translation through microRNAs (miRNAs).34,35 The structure, IC50, hill slope values, and general activity information of the true positives are listed in Table 2 .
List of True-Positive Hit Compounds.
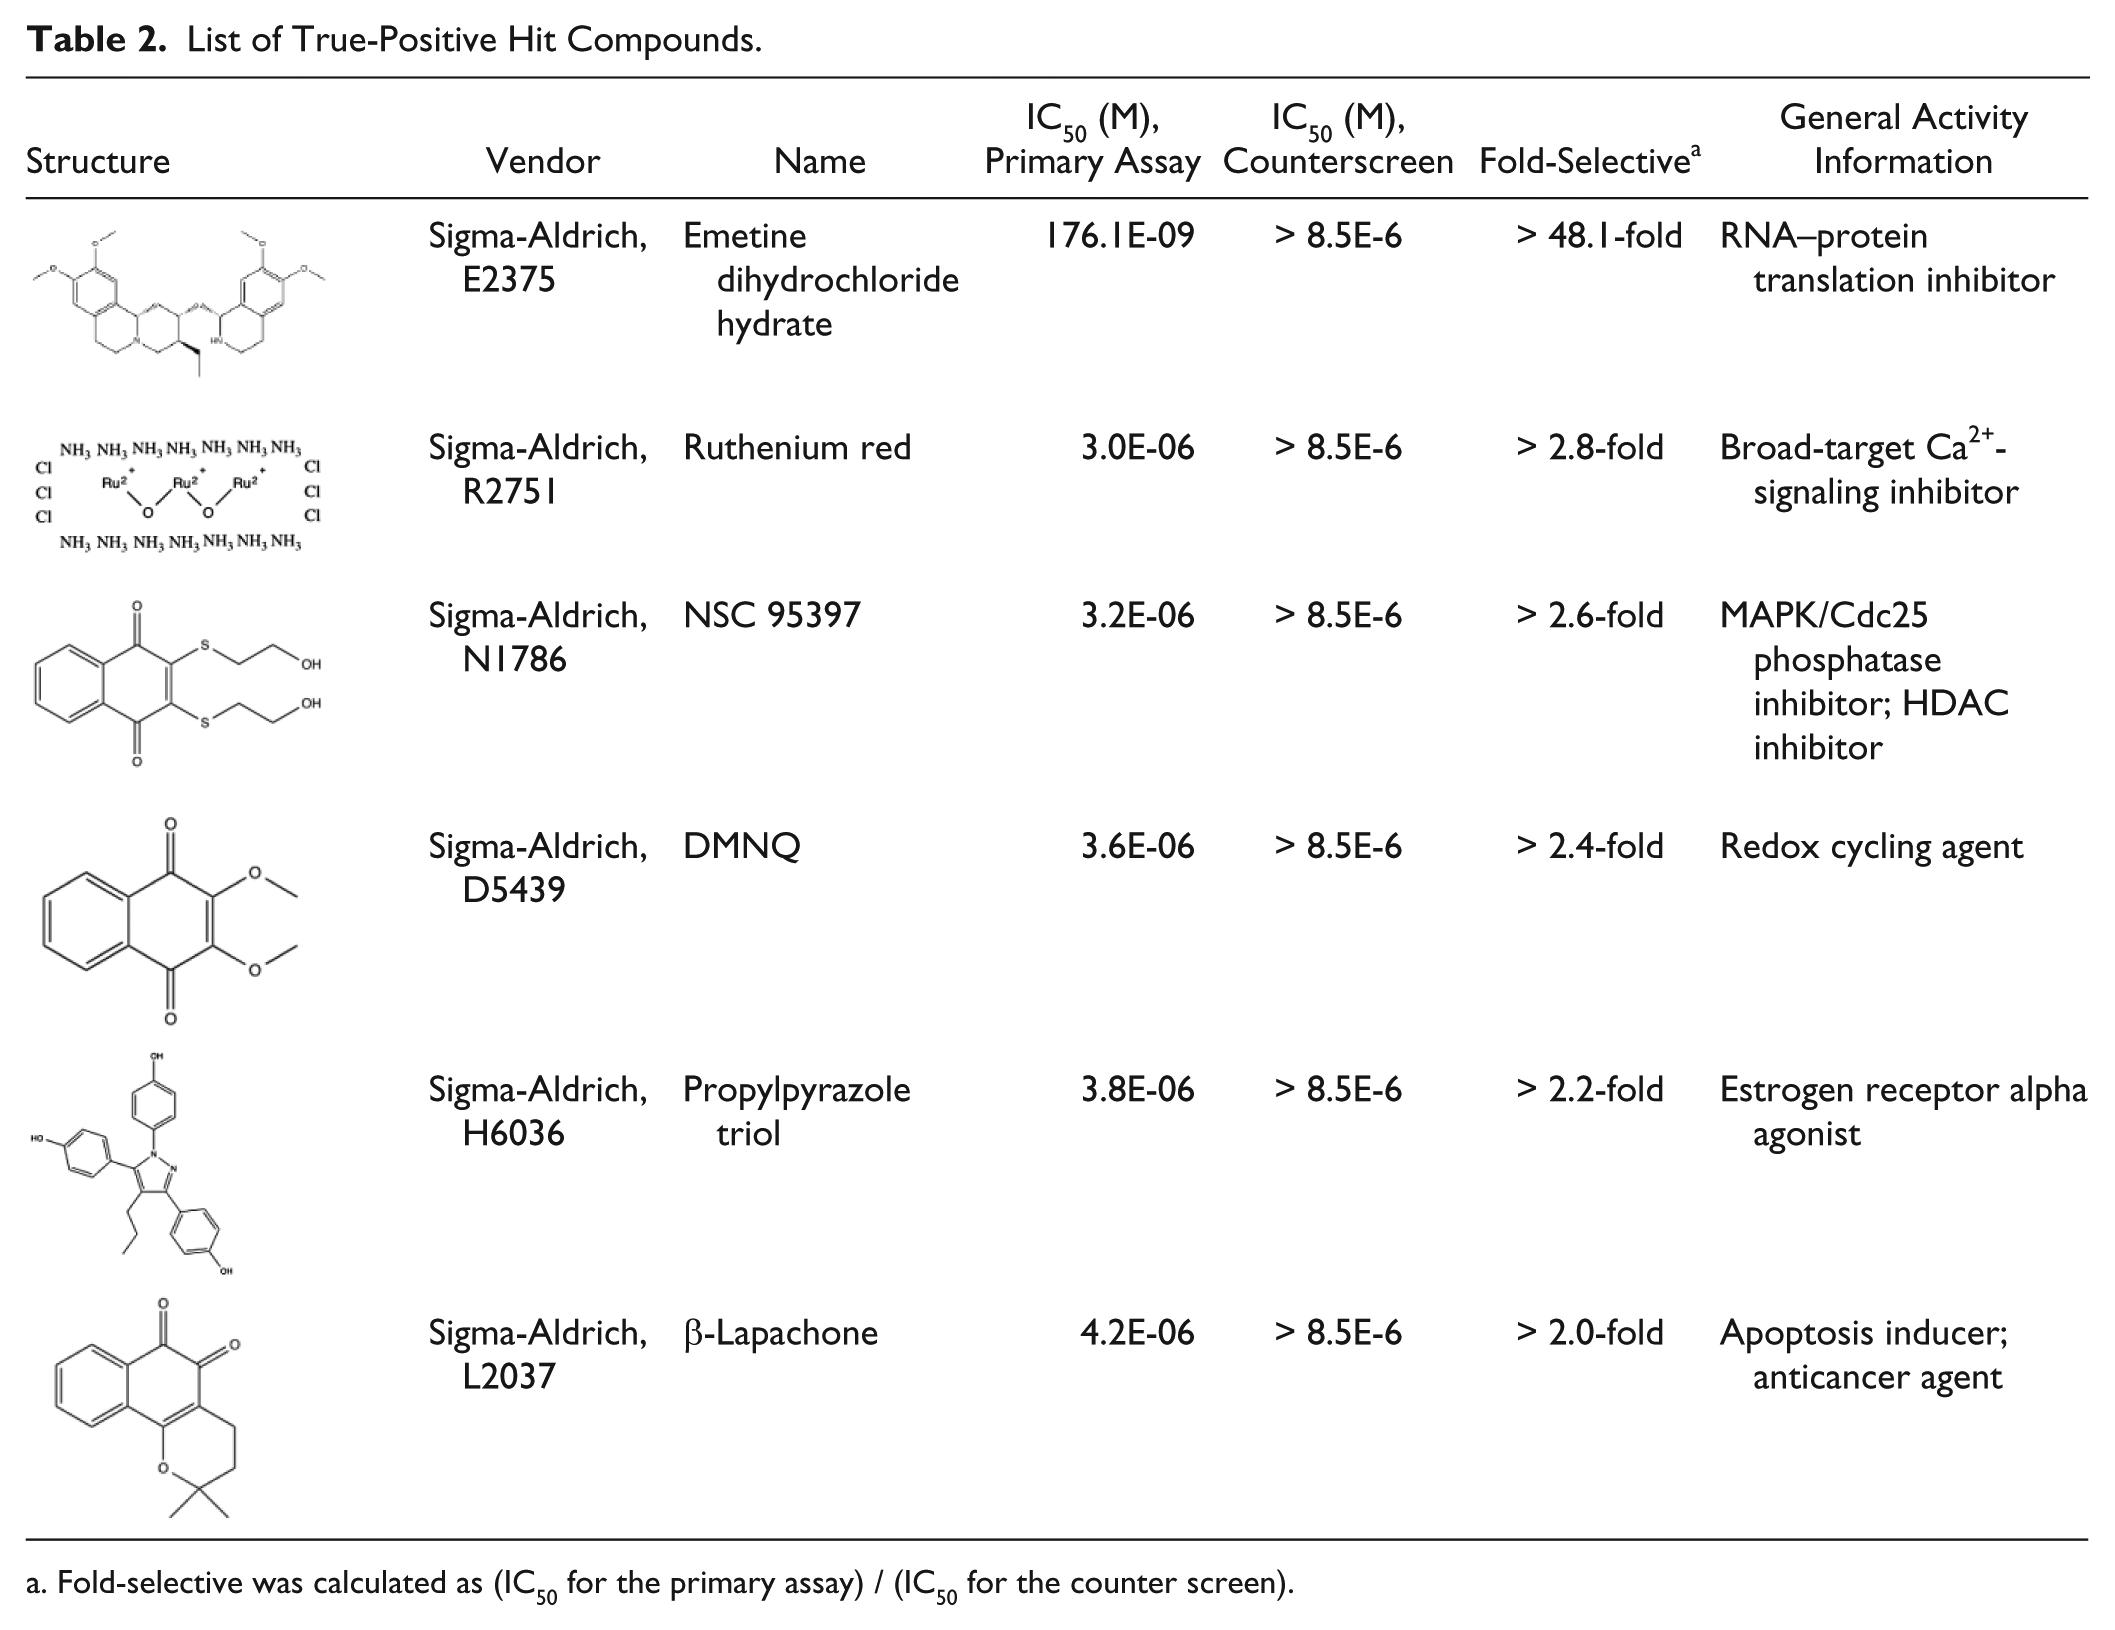
Fold-selective was calculated as (IC50 for the primary assay) / (IC50 for the counter screen).
Our HTS-optimized in vitro translation system successfully identified familiar protein-synthesis inhibitors as the true positives. Among them, several compounds shared similar structural properties, suggesting that the structure–activity relationship (SAR) can be found using this assay and applied to future screening efforts. We expect the system will readily transfer to larger screening campaigns based on the stable QC parameters found throughout the pilot screen, serial dilutions, and counterscreen, all performed in the same format. With a proper target-validation approach, this assay provides a powerful screening platform for finding novel ARS inhibitors.
Footnotes
Author Contributions
J.K., P.F., F.M., T.P.S., S.K., and M.G. designed all experiments. J.K. and P.F. performed the initial experiments, and F.M. and T.P.S. handled the optimization and pilot screening. L.S. supplied all compounds, including LOPAC. All authors analyzed the data and contributed to manuscript preparation. J.K., P.F., T.P.S., F.M., and M.G. wrote the manuscript.
Declaration of Conflicting Interests
The authors declared no potential conflicts of interest with respect to the research, authorship, and/or publication of this article.
Funding
The authors disclosed receipt of the following financial support for the research, authorship, and/or publication of this article: This work was supported by National Institutes of Health grants GM100136 and GM106134 to M.G., the PGA National Women’s Cancer Awareness foundation to P.F., and the Korean Global Frontier Project grant NRF-M1AXA002-2010-0029785 to S.K.