
Abstract
The intramembrane protease signal peptide peptidase-like 2a (SPPL2a) is a potential drug target for the treatment of autoimmune diseases due to an essential role in B cells and dendritic cells. To screen a library of 1.4 million compounds for inhibitors of SPPL2a, we developed an imaging assay detecting nuclear translocation of the proteolytically released cytosolic substrate fragment. The state-of-the-art hit calling approach based on nuclear translocation resulted in numerous false-positive hits, mainly interrupting intracellular protein trafficking. To filter the false positives, we extracted 340 image-based readouts and developed a novel multiparametric analysis method that successfully triaged the primary hit list. The identified scaffolds were validated by demonstrating activity on endogenous SPPL2a and substrate CD74/p8 in B cells. The multiparametric analysis discovered diverse cellular phenotypes and provided profiles for the whole library. The principle of the presented imaging assay, the screening strategy, and multiparametric analysis are potentially applicable in future screening campaigns.
Introduction
Intramembrane proteolysis is a recently identified mechanism underlying various important cellular processes, such as cholesterol homeostasis, endoplasmic reticulum (ER) stress, cell fate decisions, signal peptide cleavage, and removal of transmembrane domain (TMD) stubs. 1 Signal peptide peptidase-like 2a (SPPL2a) belongs to the signal peptide peptidase/signal peptide peptidase-like (SPP/SPPL) family of aspartic intramembrane proteases, which are related to presenilins, the active components of the γ-secretase complex. SPP and SPPLs cleave type II transmembrane proteins, whereas the topology of the γ-secretase complex enables cleavage of type I TMDs. Several SPPL2a substrates, such as the N-terminal transmembrane fragments of tumor necrosis factor alpha (TNFα), 2 Bri2, 3 and FasL, 4 have been described previously. More recently, a nonredundant, in vivo relevant function of SPPL2a in the intramembrane processing of the N-terminal fragment (NTF) of the invariant chain (Ii, CD74) p8 has been described,5–8 demonstrating an essential role of SPPL2a in the survival of B cells and myeloid dendritic cells in mice. Studies in SPPL2a-deficient mice have shown that accumulation of nonphysiological amounts of the SPPL2a substrate CD74/p8 leads to an arrest of splenic B-cell maturation, resulting in the depletion of mature B cells. In addition, accumulation of p8 leads to a strong reduction in myeloid dendritic cell numbers in SPPL2a-deficient mice.5–7 Based on the newly discovered role of SPPL2a in vivo, we hypothesize low-molecular-weight inhibitors of SPPL2a as a concept for the treatment of autoimmune disorders. As anticipated based on the homology across the aspartic intramembrane proteases, some, but not all, γ-secretase inhibitors are also inhibiting members of the SPP/SPPL protease family, for example, LY411,575 (Lilly, Indianapolis, IN, USA), whereas (Z-LL)2-ketone is the only γ-secretase activity-sparing SPP/SPPL inhibitor described today.5,9 However, to our knowledge no selective SPPL2a inhibitors have been reported.
High-throughput screening is a productive approach to discover low-molecular-weight modulators of diverse biological targets and phenotypes. 10 In particular, advances in the development of image-based high-content screening (HCS) technologies have opened new avenues for screening campaigns on intracellular targets.11–13 HCS assays provide a wealth of information to investigate cellular phenotypic perturbations, and hold the promise to identify more disease-relevant screening hits. However, two major challenges, namely, low throughput and complex data analysis, have so far limited HCS from being widely adopted as the primary screening approach in drug discovery. Most HCS campaigns are of modest scale and utilize only one or two readouts. 14
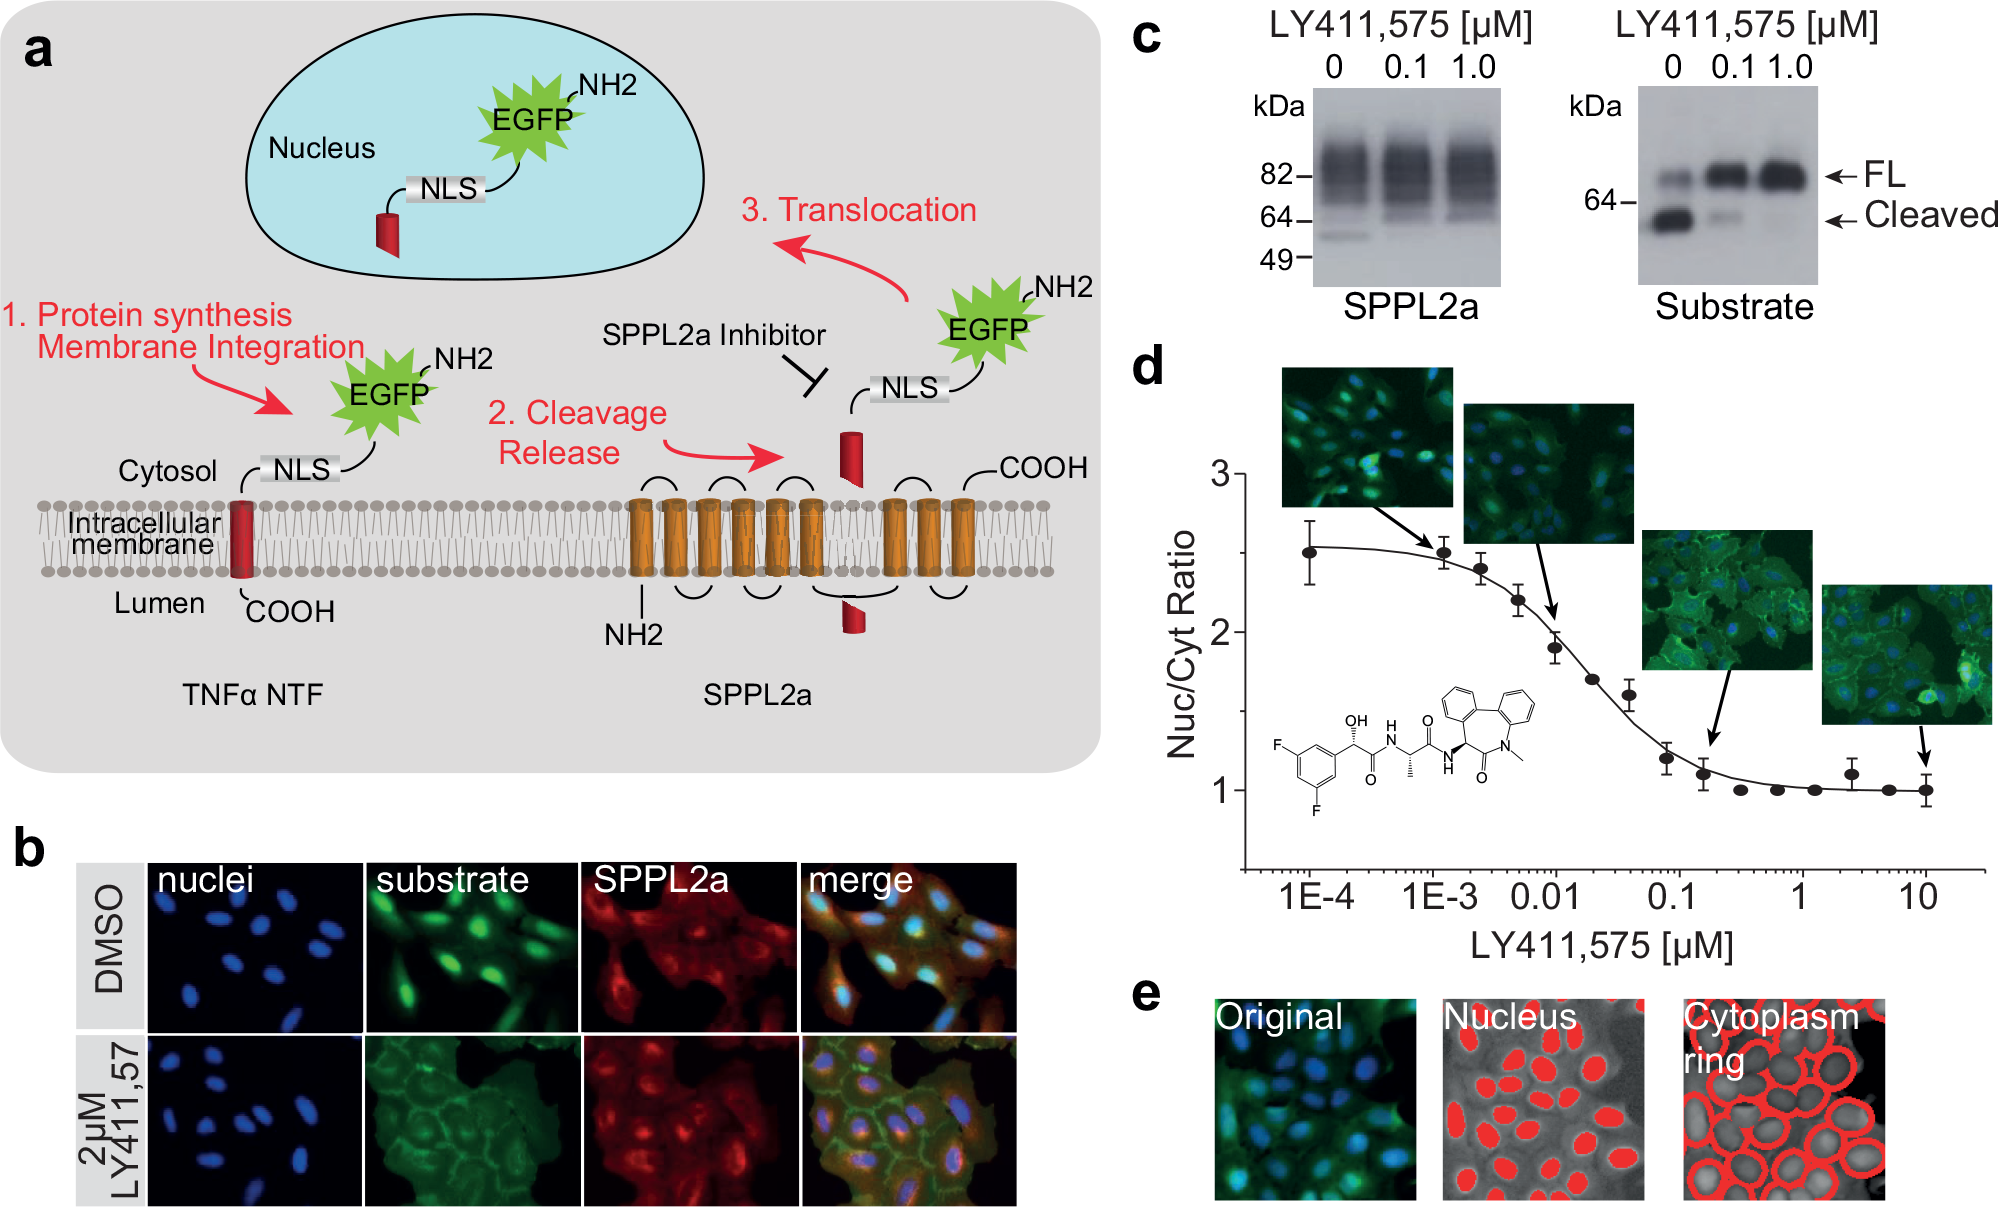
Here we describe the development of a high-content imaging assay to identify SPPL2a inhibitors, which utilizes the enhanced green fluorescent protein (EGFP)–labeled transmembrane NTF of TNFα2,15 as a substrate. Upon cleavage within the TMD, the N-terminal EGFP-labeled domain is released from the membrane and migrates to the nucleus. SPPL2a inhibitors prevent substrate cleavage, and therefore nuclear translocation of the N-terminal domain, resulting in a distinct imaging phenotype. We adapted this primary imaging assay to an ultra-high-throughput format to enable screening of the Novartis (Basel, Switzerland) low-molecular-weight library of about 1.4 million compounds. Image analysis and hit calling were first carried out based on the standard nuclear translocation readout. This on-the-fly univariate data analysis approach maximized throughput but also generated false-positive hits, mainly caused by compounds interrupting intracellular protein trafficking. We followed up with an offline multiparametric data analysis approach using 340 image-based readouts to reduce the false-positive rate. To validate the identified compounds, we applied a secondary assay to monitor cleavage of the in vivo relevant endogenous substrate, CD74/p8,5–7 in a mouse B-cell line expressing endogenous SPPL2a. Many compounds were inactive in the secondary assay, while several scaffolds could be validated by inhibiting SPPL2a in this endogenous setting. In addition to discovering SPPL2a inhibitors, we also performed a clustering analysis of the HCS fingerprints obtained from the extracted imaging readouts, characterizing diverse cellular phenotypes for the whole compound library.
The validated low-molecular-weight SPPL2a inhibitors described here are potential starting points for developing therapeutic treatment of B-cell- and dendritic cell–dependent autoimmune disorders. In addition, the principle of the cellular imaging assay is applicable for other protease targets within and outside the aspartic intramembrane protease family, for example, by adding adequate nuclear export and nuclear localization signals (NLSs) to the substrate. 16 The ultra-high-throughput screening platform and the multiparametric analysis methods can be generally applied in future screening campaigns.
Materials and Methods
High-Content Screen
U-2 OS cells, expressing SPPL2a constitutively and the EGFP substrate under doxycycline-regulated promoter, were cultivated in SelecT (TAP, Wilmington, DE) in the absence of doxycycline in DMEM / GlutaMaxTM-I (Invitrogen) supplemented with 10% tetracycline-free fetal bovine serum (FBS, Amimed, London, UK). Before initiation of the high-throughput screen, the stable cell line was tested to be mycoplasma-free. We performed a series of assay optimization to determine the experimental conditions ( Suppl. Figs. S1–S3 ). The cells were automatically seeded by SelecT in Greiner 1536-well clear-bottom plates, 300 cells/well in 4 µL medium. The cells were incubated at 37 °C, 5% CO2 for 24 h. Then 2 µL of doxycycline (Sigma, St. Louis, MO) was added to a final concentration of 10 ng/mL, to induce expression of the EGFP substrate. Immediately thereafter, compounds, 60 nL/well, were added to reach the final concentration of 20 µM and final DMSO concentration of 1%. Compound transfer was performed using an Echo 550 acoustic dispenser (Velocity). In columns 45 and 46, 1% DMSO was used as the negative control, and in columns 47 and 48, 500 nM LY411,575 was used as the positive control. The cells were incubated with the compounds for 24 h, then fixed with Mirsky’s fixative (National Diagnostics, Charlotte, NC), and the nuclei were stained with 2 µM DRAQ5 (Biostatus, Leicestershire, UK). The cells were washed three times with PBS leaving 10 µL PBS on the cells. The plates were sealed with aluminum foil and kept at 4 °C until imaging. Fixing, staining, and washing steps were performed with an automated platform containing Multidrop Combi (Thermo Scientific, Waltham, MA) dispensers, BNX 1536 (BioNex, San Jose, CA) plate washers/dispensers, Cytomat 5C450 incubators (Thermo), and a plate sealer (PlateLoc, Agilent, Santa Clara, CA). The platform was controlled by Thermo software and a CatEx robotic arm (Thermo).
Primary Image Analysis with the Nuclear/Cytoplasmic EGFP Intensity Readout
Image analysis in primary screening was performed with Acapella (PerkinElmer, Waltham, MA) simultaneously as images were acquired. The Acapella script detected nuclei based on the DRAQ5 staining. The nuclear mask was transferred to the EGFP channel, and a 4-pixel-wide cytoplasm ring region was defined around the nucleus. The intensity of the EGFP signal was measured both in the nuclear and in the cytoplasm ring region, and the nuclear/cytoplasmic intensity ratio of the EGFP signal was calculated ( Fig. 1e ). Percent inhibition was calculated relative to the positive (0.5 µM LY411,575 = 100% inhibition) and negative (DMSO = 0% inhibition) controls. During assay development and postscreening, the nonconfocal images (ArrayScan VTI, Cellomics, Halethorpe, MD) were analyzed with the same principle, but the difference between nuclear and cytoplasmic intensity was generally used as a readout instead of the ratio.
High-content imaging assay to monitor SPPL2a activity. (
Multiparametric Image and Data Analysis
A customized image analysis script was developed on the Acapella platform (PerkinElmer). The script detects nuclei based on the DRAQ5 staining and detects cytoplasm based on the EGFP signal. The outer edge of the nucleus was defined as the nuclear envelope, and the outer edge of the cell as the plasma membrane. The script then extracted cellular morphology information (such as area and perimeter), as well as fluorescent staining information (intensity, correlation, and textures) in both GFP and DRAQ5 channels for the different cellular compartments defined (nucleus, nuclear envelope, cytoplasm, and plasma membrane). The detailed list of the 340 features can be found in Supplemental Table S1 . The script is freely available at http://code.google.com/p/operahci/.
For multiparametric hit calling, we first performed principal component analysis where 30 principal components were kept to represent 90% accumulative standard deviation. Then for each readout vector, we computed its Mahalanobis distance with about 50,000 positive control wells as the reference population.
To elucidate diverse cellular phenotypes caused by compound treatment in the screen, the whole image collection of the 1.4 million compounds was reanalyzed to extract 340 phenotypic readouts. Mahalanobis distance to the negative control was calculated as a filter to identify compounds with any pronounced phenotype. A total of 466,998 compounds had a Mahalanobis distance larger than 7.7, which was 2 median absolute deviations (MADs) away from the median of the DMSO control. These compounds were further studied by clustering via a self-organizing map with a 20 × 20 node grid. All analyses were performed with the R statistical platform, v3.2.2. 17 The principal component analysis and Mahalanobis distance calculation were performed with the stats package. 17 The self-organizing map was calculated with the kohonen package. 18
CD74/p8 Accumulation in A20 Cells
To detect p8 accumulation in A20 cells, 1 × 10⁵ cells/well were seeded into 24-well plates in 1 mL or 5 × 10⁴ cells/well into 48-well plates in 0.5 mL, inhibitors were added immediately, followed by incubation overnight at 37 °C, 5% CO2 in a humidified incubator. For Western blot analysis (Suppl. Methods), cells were lysed in 100 µL of sodium dodecyl sulfate (SDS) loading buffer (4× XT Sample Buffer + 20× XT Reducing Agent, BIO-RAD, Hercules, CA) and boiled for 5 min at 95 °C.
Chemical Property Prioritization and Clustering
The 22,000 compound hits, active in the confirmation screen, were prioritized by applying filters on molecular weight (<600), lipophilicity (clogP between −1 and 6), polar surface area (<150, topological polar surface area according to Ertl et al. 19 ), number of rotatable bonds (<12), and number of acyclic amide bonds (≤3). Structural classes not well suited for medicinal chemistry were removed by applying a naïve Bayesian classifier trained in Pipeline Pilot (Accelrys, San Diego, CA) using extended connectivity fingerprints (ECFP).20,21
The chemical clustering was done by assigning each molecule to the largest, most specific scaffold it had in the scaffold tree 22 under the condition that the scaffold must be represented at least five times in the data set. Molecules that could not be assigned to a scaffold were submitted to clustering by chemical fingerprints using Pipeline Pilot’s molecular clustering component with ECFP_6 fingerprints, and enforcing a maximum dissimilarity of 0.7 within each cluster. The 11,000 compounds included in the analysis were clustered into 826 classes and 1109 singletons.
Data Availability
The data sets generated during the current study are available from the corresponding author on reasonable request, except data linked to Novartis proprietary compounds.
Results
Development of a High-Content Imaging Assay to Monitor SPPL2a Activity
Several SPPL2a substrates have been previously described, among them the TNFα/NTF, which was chosen for the development of the high-content imaging assay described here. Shedding of soluble TNFα by ADAM10/ADAM17 generates the membrane-attached SPPL2a substrate TNFα/NTF.2,15 To monitor SPPL2a activity based on nuclear translocation of the cleaved substrate, we fused EGFP, followed by the SV40 NLS, to the N-terminus of the TNFα/NTF (
Fig. 1a
and Suppl. Methods). Next, we generated a stable U-2 OS cell line expressing SPPL2a constitutively and the EGFP-labeled TNFα NTF substrate under the control of a doxycycline-inducible promoter (Suppl. Methods). Due to the long half-life of EGFP,
23
an inducible promoter was chosen for substrate expression since constitutive expression of the substrate would lead to strong background fluorescence in the nucleus, lowering the assay window. Upon induction, the substrate is expressed and cleaved by SPPL2a, which leads to the release of the N-terminal EGFP-labeled fragment from the intracellular membrane and translocation to the nucleus due to the SV40 NLS (
Fig. 1a
,
b
). Substrate cleavage was confirmed by Western blot analysis (
Fig. 1c
). The previously described low-molecular-weight γ-secretase inhibitor LY411,575 with cross-activity on members of the SPP/SPPL family, including SPPL2a5,24 (
Table 1
), was used to validate the concept of the SPPL2a imaging assay. LY411,575 showed a concentration-dependent inhibition of substrate cleavage (
Fig. 1c
) with an IC50 of 13 nM (
Fig. 1d
,
Table 1
), resulting in localization of the substrate in the membranes of the endosomes, secretory pathway, and plasma membrane (
Figs. 1b
,
d
Cellular Activity of Known γ-Secretase Inhibitors and the High-Content High-Throughput Screening Hits in SPPL2a, CD74/p8 Accumulation, SPPL2b, SPP, and γ-Secretase Assays.
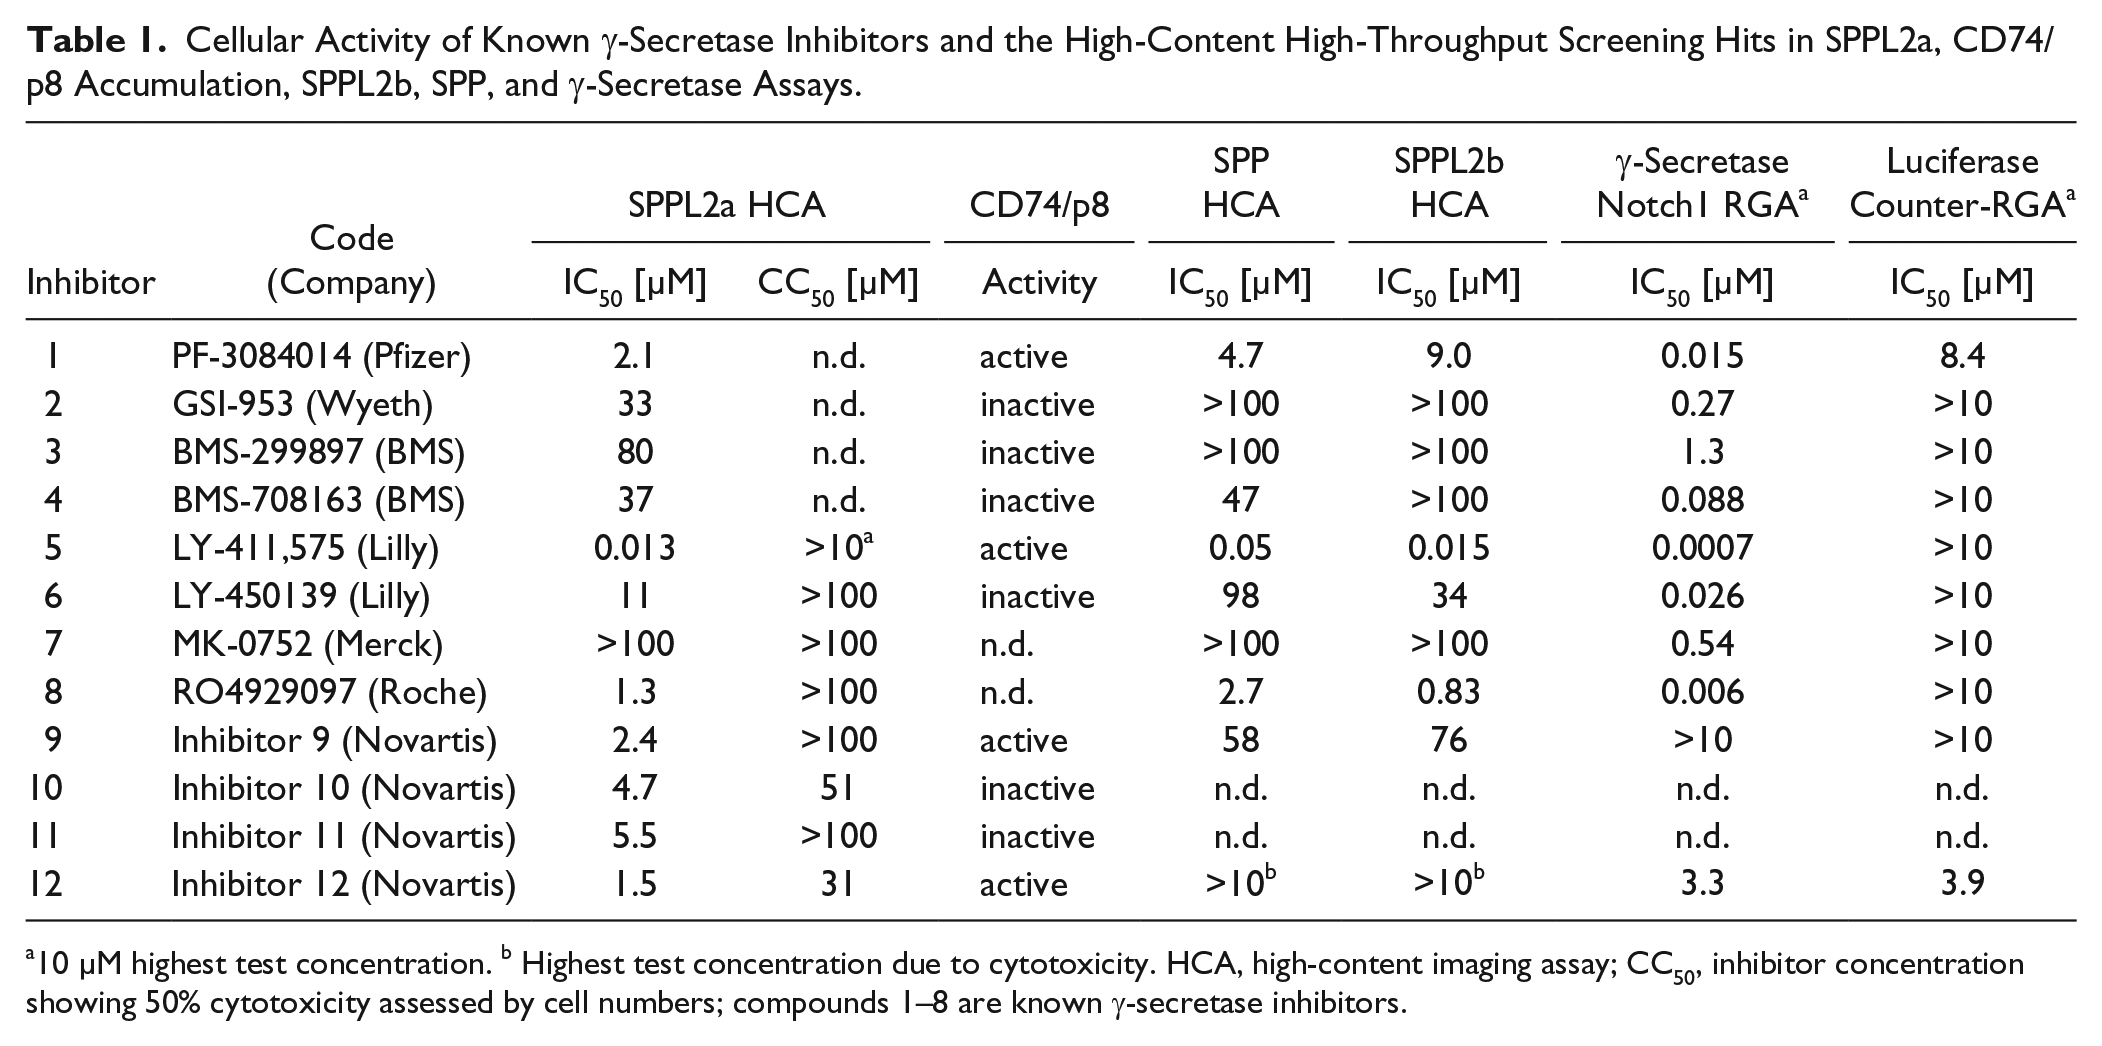
10 µM highest test concentration. b Highest test concentration due to cytotoxicity. HCA, high-content imaging assay; CC50, inhibitor concentration showing 50% cytotoxicity assessed by cell numbers; compounds 1–8 are known γ-secretase inhibitors.
To quantify SPPL2a inhibition in the imaging assay, the nuclei of the cells were detected based on nuclear staining, the nuclear mask was then transferred to the EGFP channel, and a ring region (representing the cytoplasm) was defined around the nucleus. The intensity of the EGFP signal was measured in both the nuclear and cytoplasmic regions, and the average nuclear/cytoplasmic intensity ratio of the EGFP signal was calculated per well ( Fig. 1e ), allowing determination of full concentration–response curves for SPPL2a inhibitors ( Fig. 1d ).
To further improve the quality of the assay and to miniaturize it to the 1536-well format, we performed a series of optimization experiments ( Suppl. Figs. S1–S3 ). The cell seeding density was optimized to allow proper cell segmentation and yet have enough cells captured in the image for good statistics, even when only one field was acquired per well with a 10× objective that covered approximately 30% of the well area. In 1536-well plates, a seeding density of 300 cells/well was found optimal for the assay ( Suppl. Fig. S2 ), which resulted in detection of about 200 cells in the single image acquired at the end of the experiment. The Novartis compound collection is stored in DMSO; therefore, cell count and the statistical quality (Z′ factor value 25 ) of the assay were determined at different DMSO concentrations with 128 replicates for each condition. Cell count was not affected by DMSO up to 2%. The IC50 value for LY411,575 was not affected by DMSO up to 3%, and the Z′ factor value was above 0.5 up to 3% DMSO ( Suppl. Fig. S3 ). In order to reduce cellular stress by antibiotics, the doxycycline concentration to induce expression of the EGFP substrate was reduced to 10 ng/mL ( Suppl. Fig. S1 ). In addition, during the screening phase puromycin and blasticidin were omitted from the medium. Moreover, image acquisition speed was substantially improved by acquiring the images from EGFP and nuclei channels simultaneously. Images were analyzed and the nuclear/cytoplasmic ratio of the EGFP signal was generated in parallel to image acquisition.
High-Content Ultra-High-Throughput Primary Screen
A total of 1031 1536-well plates, corresponding to 1.4 million compounds, were screened at a final concentration of 20 µM with the imaging assay using the conditions described above. The nuclear/cytoplasmic EGFP intensity ratio was normalized and scaled on each plate by setting the average of the DMSO control as 0% inhibition, and the average of the LY411,575 control as 100% inhibition (64 DMSO and 64 LY411,575 control wells on each plate). Excellent Z′ factor values were achieved in the screen, ranging from 0.51 to 0.86, with a median of 0.71 over all plates (
Fig. 2a
). The good separation between the controls and the wide distribution of all samples enabled us to select compounds with inhibition effects, that is, lower nuclear/cytoplasmic EGFP intensity ratio, and thus inhibition of substrate translocation (
Fig. 3a
). A threshold of 40% inhibition resulted in a high hit rate of 6.6% and 93,000 primary hits in total (
Figs. 2b
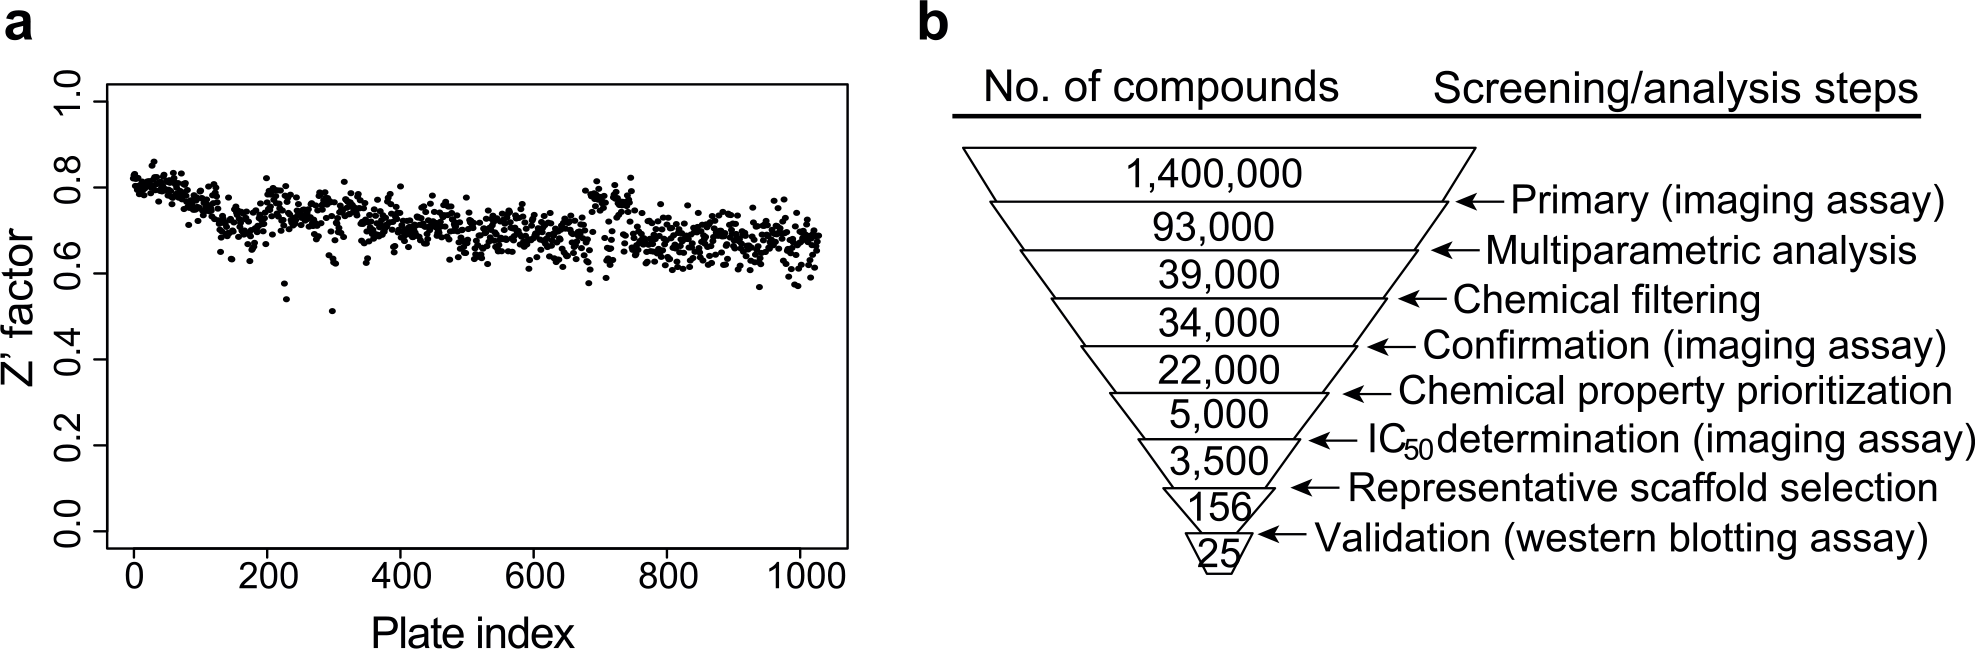
Primary screen quality and screening campaign workflow. (
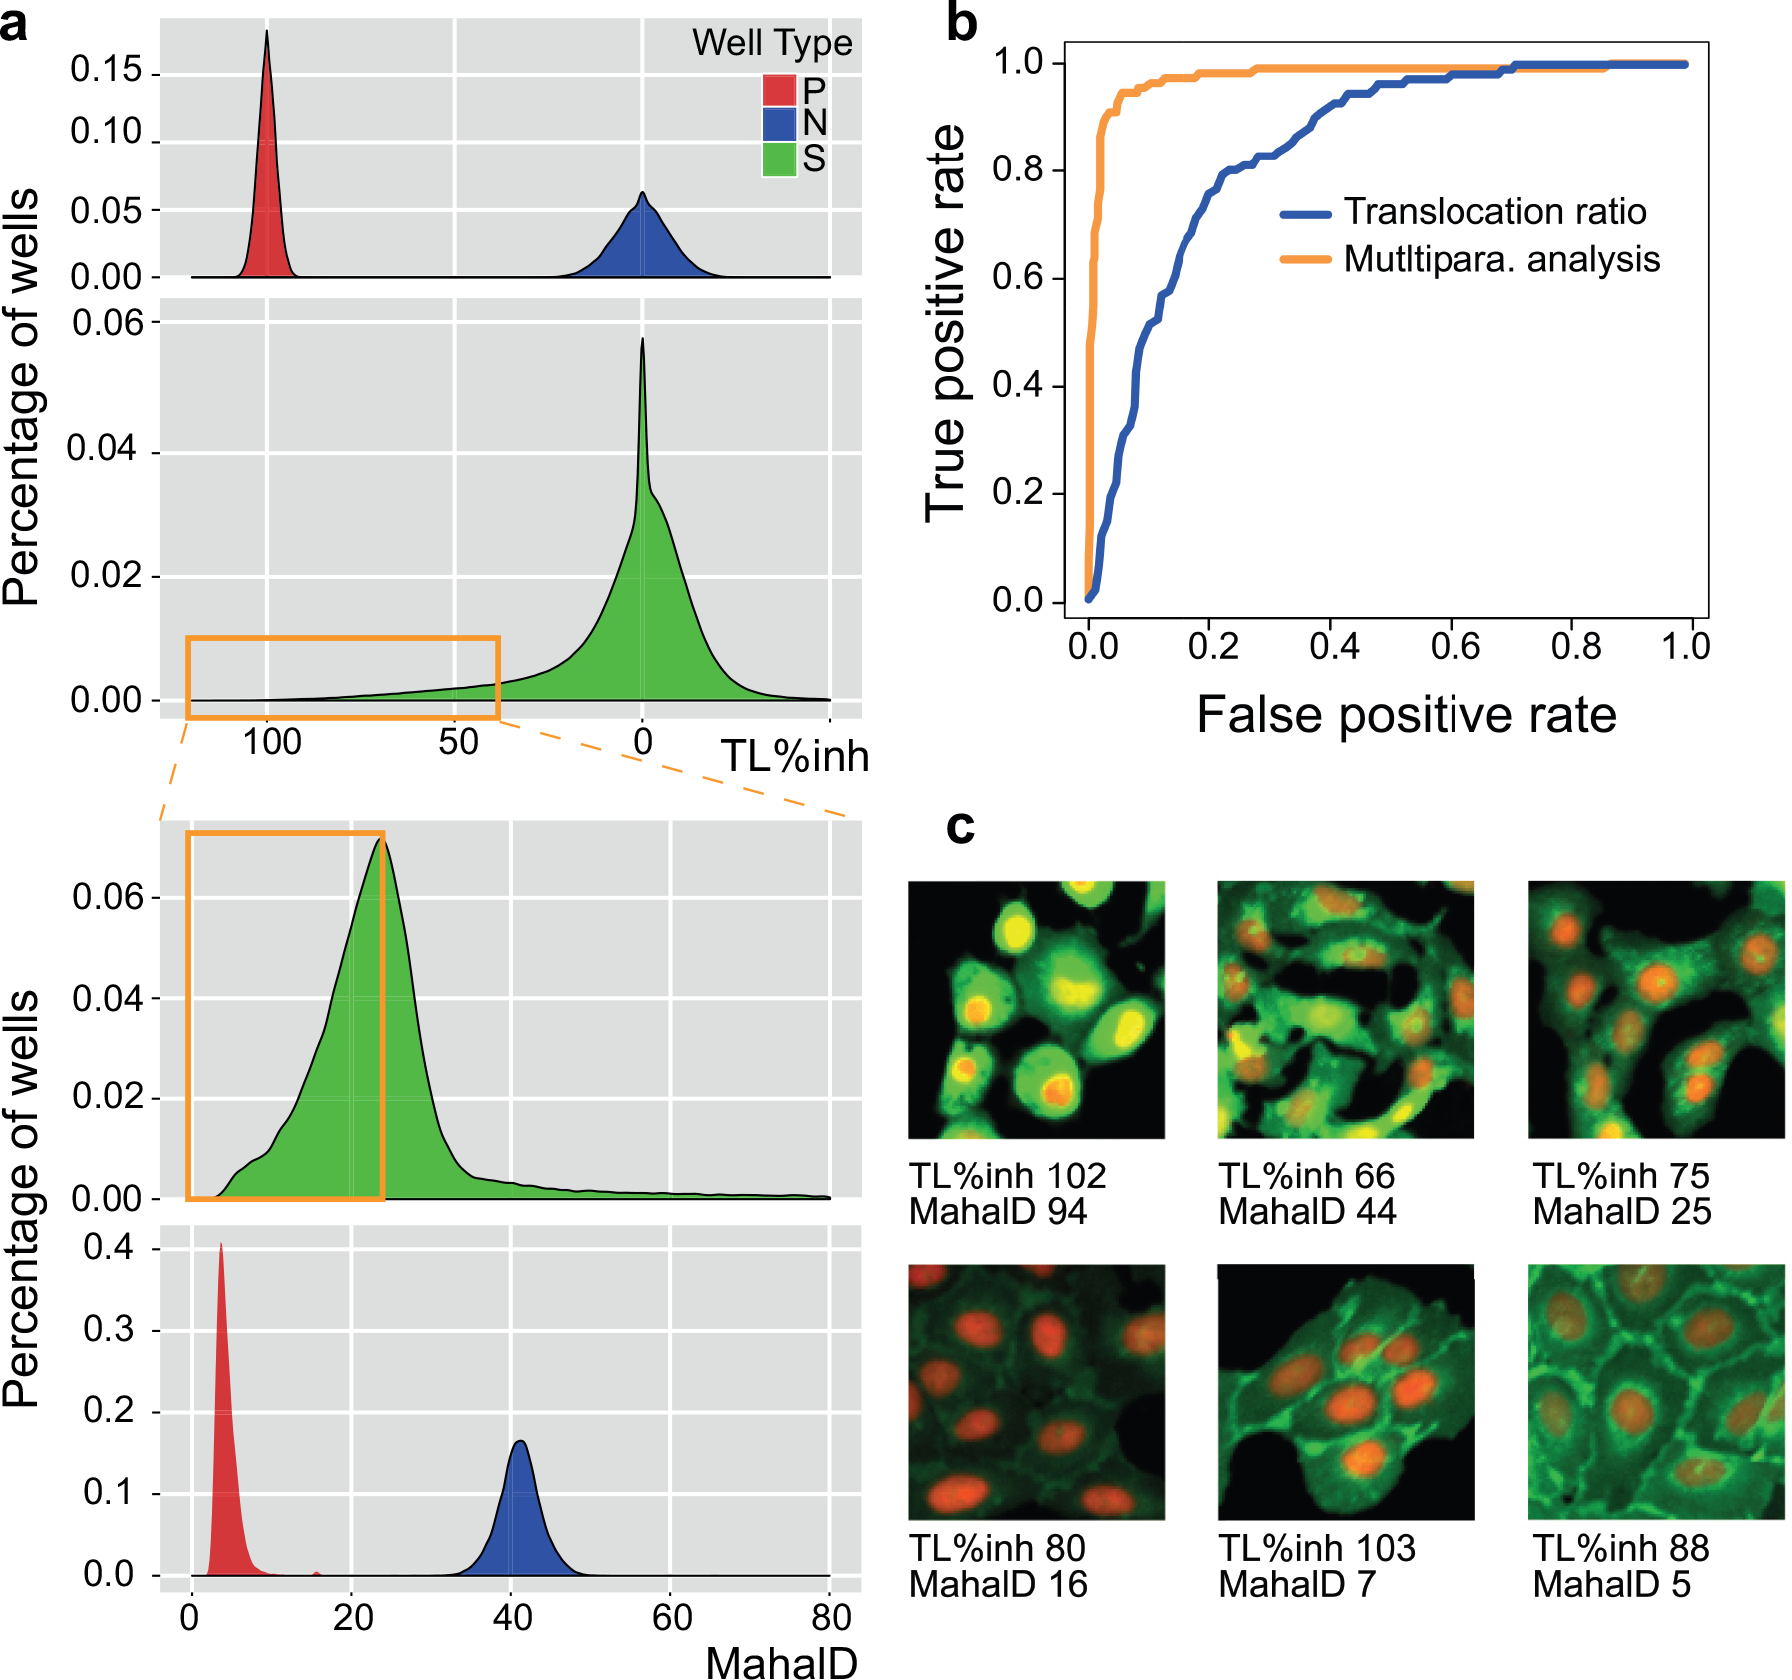
Multiparametric analysis to reduce false-positive hits. (
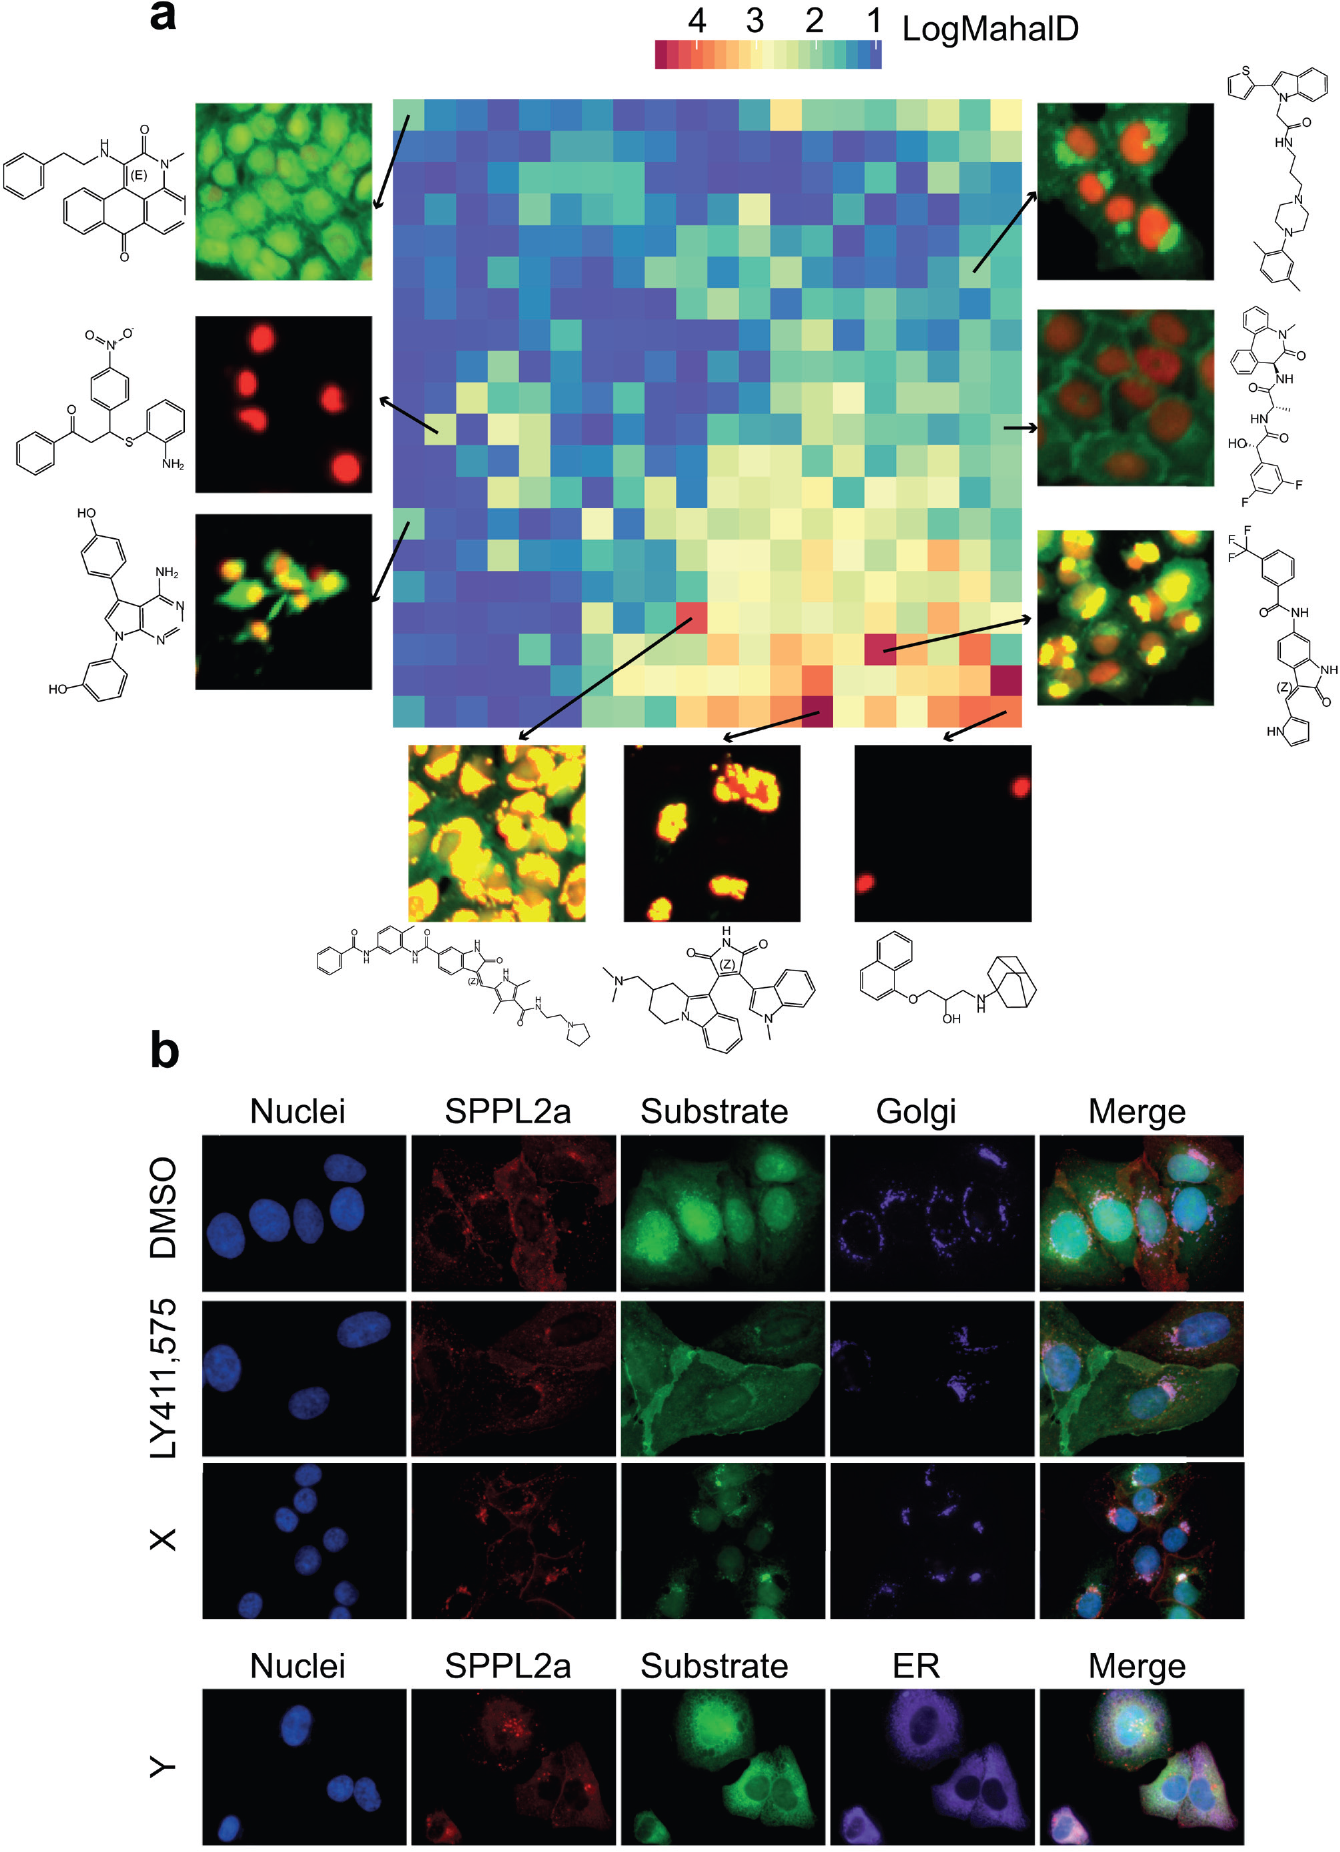
Diverse phenotypes identified from HCS fingerprint analysis. (
Multiparametric Analysis to Reduce False-Positive Hits
We reanalyzed the images of the 93,000 primary hits by segmenting four masks: nucleus, nuclear membrane, cytoplasm, and plasma membrane. A total of 340 readouts were measured, including geometric, intensity, and texture features across all four masks in both nuclear and GFP channels (see Materials and Methods and Suppl. Table S1 for details). We first performed a principal component analysis to reduce the dimensions to 30 while keeping 90% of the variance, and then calculated the Mahalanobis distance 26 for each well using the LY411,575 controls as the reference (see Materials and Methods for details). A low Mahalanobis distance represented a close phenotypic similarity to the positive control population. This multiparametric analysis approach was validated by applying it to a 1536-well test plate of manually annotated true- and false-positive examples. The receiver operating characteristic (ROC) curves obtained show that the area under the curve for the multiparametric analysis is much higher than for the analysis based on the nuclear/cytoplasmic EGFP intensity ratio ( Fig. 3b ), thus demonstrating the benefits of hit calling based on the multiparametric analysis.
When Mahalanobis distance was calculated for the 93,000 hits from the primary screen, together with all the negative and positive controls ( Fig. 3a ), positive control wells had lower values (median 3.7, MAD 1.1) than negative control wells (median 41.1, MAD 2.4), as expected. The separation between the controls was comparable with the nuclear/cytoplasmic EGFP intensity ratio readout. However, the 93,000 primary hits had a much wider distribution of Mahalanobis distance compared with the translocation intensity ratio readout. Phenotypes that were not distinguishable based on the intensity ratio had divergent Mahalanobis distance values ( Fig. 3c ). Samples with low-intensity ratio but high Mahalanobis distance showed undesired phenotypes, such as impaired intracellular protein trafficking, and thus were considered false positives. Samples with low-intensity ratio and low Mahalanobis distance showed phenotypes similar to positive controls and were selected as true positives. After manual inspection of many examples, we decided to apply the Mahalanobis distance value 23 as the threshold for hit calling in order to include weakly active compounds. Thus, we were able to remove a large number of false positives, and reduce the number of hits from 93,000 to 39,000, corresponding to an actual hit rate of 2.8% ( Fig. 2b ). Additionally, we analyzed the performance of each hit in previous internal cellular screens to identify unspecific frequent hitters (see Suppl. Methods for details). Before the multiparametric analysis, the primary hit list contained 748 frequent hitters in cellular assays. Following the reanalysis of the data, the frequent hitters were reduced to 69 ( Suppl. Fig. S5 ). Our methodology had removed 91% of the frequent hitters, demonstrating the power of this approach and corroborating our cross-validation analysis.
HCS Fingerprint Analysis
In addition to SPPL2a inhibition, we observed diverse cellular phenotypes in the primary screen of 1.4 million compounds. This provided an opportunity to characterize the compounds with respect to their phenotypic cellular effects for future drug discovery activities. To this end, we expanded the multiparametric analysis to the whole screening library. The extracted 340 image-based features were defined as an HCS fingerprint 27 for each compound to represent the corresponding phenotype. Instead of calculating Mahalanobis distance to the positive control as above, here we calculated the distance to the negative control, which represents how strongly the phenotype differs from the DMSO control (see Materials and Methods for details). About 30% of the compounds showed pronounced phenotypes, which were clustered in a self-organizing map 28 ( Fig. 4a ). Each node contains multiple compounds with similar phenotypes, while the color of the node is code for the median of the Mahalanobis distance values to the DMSO control. A diverse range of phenotypes were found in the screening collection; examples are shown with the corresponding images and compound structures in Figure 4a ( Suppl. Table S2 ). The underlying mechanisms of these phenotypes are still to be further investigated. An unspecific increase in fluorescence intensity indicates that the compound might be autofluorescent, and a reduced cell count suggests cellular toxicity. When the cell count remained constant but the EGFP signal was abolished, the mechanism of action could be suppression of transcription or translation.
We followed up on one category of phenotypes where the EGFP signal was trapped in specific cellular regions. We selected two compounds from this category, denoted as X and Y, where, based on the signal patterns, compound X was predicted to trap EGFP in Golgi, while compound Y was predicted to trap EGFP in the ER. To validate these predictions, we performed a separate experiment where after treatment with these two compounds, respectively, cells were fixed and costained with either antibodies against Giantin to visualize Golgi, or protein disulfide isomerase (PDI) to visualize the ER.
As shown in Figure 4b ( Suppl. Fig. S4c,d ), under either DMSO or LY411,575 treatment, SPPL2a was mainly localized to the endosomal compartment, consistent with previous observations. 2 Under DMSO treatment, the substrate was cleaved and localized to the nucleus, while in the presence of LY411,575 the substrate remained mainly membrane-bound. Compound X caused accumulation of the substrate and, to a lesser extent, SPPL2a in the Golgi, as shown by colocalization with anti-Giantin staining. Similarly, after treatment with compound Y, SPPL2a and substrate accumulation was colocalized with the ER staining. These results confirmed our hypothesis that the substrate was trapped in the Golgi or ER compartments, but also explained why these phenotypes were falsely identified by the nuclear/cytoplasmic EGFP intensity ratio analysis as hits, as the substrate did not reach the endosomal compartment and thus could not be cleaved.
Hit Triaging and Scaffold Prioritization
Compounds hitting the primary imaging assay needed to be validated in the secondary Western blot assay monitoring cleavage of the in vivo relevant endogenous substrate. Due to the low throughput of the secondary assay, we performed a series of triaging steps on the hit list of 39,000 compounds ( Fig. 2b ). First, all compounds known to be unstable or impure, or having undesired structural features based on internal knowledge (e.g., highly reactive compounds) were removed ( Suppl. Fig. S6 ). The remaining 34,000 compounds were tested again in the same imaging assay with a 20× objective and two fields per well (more details in Suppl. Methods), in a four-point concentration response (12, 3.8, 1.2, and 0.38 µM). Based on the nuclear/cytoplasmic ratio readout, 22,000 compounds passed the threshold of 40% inhibition at the highest concentration ( Fig. 2b ), which corresponds to a high confirmation rate of 65%, consistent with the reproducibility of the imaging assay. We also applied the multiparametric analysis approach with Mahalanobis distance as in the primary screen, but the outcome was the same as hit calling based on the nuclear/cytoplasmic ratio (data not shown). This suggests that false-positive hits distinguishable by multiparametric analysis were already filtered after the primary screen and there was no additional value to applying this method again. Thus, from this point of the flowchart, we relied on the nuclear/cytoplasmic intensity ratio readout.
The chemical properties of the 22,000 compounds were analyzed and filters were exploited for several different features (see Materials and Methods). In addition, a naïve Bayesian classifier was trained and applied to remove structural classes undesired for medicinal chemistry (see Materials and Methods). The remaining 11,000 compounds were chemically clustered based on the scaffold tree. 22 Depending on the cluster size, three or four maximally diverse compounds were selected, always including the compound with maximal activity. This resulted in 5000 compounds that were selected for IC50 determination using the imaging assay ( Fig. 2b ). The compounds were analyzed with eight concentrations ranging from 30 to 10 nM in quadruplicates. For the majority of the compounds, activity could be confirmed; 4168 hits had an IC50 value below 30 µM, among which 3532 had an IC50 value below 20 µM, and 1375 below 10 µM. Representative concentration–response curves are shown in Supplemental Figure S7 , with activity ranging from low nanomolar to double-digit micromolar.
The γ-secretase inhibitor LY411,575 was used as the positive control in the screen due to its cross-activity on SPPL2a. In addition, other known γ-secretase inhibitors were found among the SPPL2a screening hits ( Suppl. Fig. S7 ). To investigate the activity of γ-secretase inhibitors on SPPL2a more broadly, we further characterized additional publicly available γ-secretase inhibitors29–35 in the imaging assay, together with our screening hits (examples in Table 1 and Suppl. Fig. S7 ). We calculated IC50 values from one replicate per concentration, since minimum variation was observed among replicates (less than twofold). Some additional γ-secretase inhibitors showed cross-activity on SPPL2a. For example, PF-3084014 (Pfizer, New York, NY, USA) and RO4929097 (Roche, Basel, Switzerland) were found to be potent SPPL2a inhibitors with IC50 values of 2.1 and 1.3 µM, respectively ( Table 1 ); however, this is more than 100-fold weaker than their reported activity on γ-secretase.30,35 Other γ-secretase inhibitors showed no or little cross-activity on SPPL2a, for example, BMS-299897 (Bristol-Myers Squibb, BMS, New York, NY, USA) and MK-0752 (Merck, Kenilworth, NJ, USA). Out of the four example screening hits, inhibitors 9 and 12, which were further validated by the CD74/p8 assay (see next section), were profiled in the γ-secretase reporter gene assay (RGA). Inhibitor 9 did not show any activity, while inhibitor 12 was active in the γ-secretase RGA, as well as in the luciferase counterassay, in which luciferase expression is independent of γ-secretase substrate cleavage. Therefore, activity in the luciferase counterassay reflects either direct inhibition of luciferase or cell toxicity of the inhibitor, and yet we consider both compounds as selective against γ-secretase. In addition, to assess selectivity against other members of the SPP(L) protease family, we profiled the inhibitors in cellular SPP and SPPL2b assays (Suppl. Methods). LY411,575 confirmed broad activity against proteases from this family with nanomolar activity against SPP and SPPL2b, whereas other γ-secretase inhibitors with little activity on SPPL2a, such as BMS-299897 and BMS-708163, and the newly identified hits (inhibitors 9 and 12) were also essentially inactive on SPP and SPPL2b ( Table 1 ).
Validation in the CD74 Cleavage Assay
Hits were validated by Western blotting to assess accumulation of the endogenous substrate CD74/p8 in the mouse B-cell line A20 expressing endogenous SPPL2a ( Fig. 5a ). This assay is relevant to the in vivo biology of SPPL2a,5–7 compared with the primary screening assay, which used an engineered cell line. Due to the low throughput of Western blotting, 156 chemically attractive hits were selected for analysis from different clusters attempting to cover the chemical space. We also included six of the γ-secretase inhibitors that were active in the imaging assay ( Table 1 ). The positive control LY411,575 resulted in concentration-dependent accumulation of the substrate CD74/p8 upon overnight incubation of A20 cells, with an IC50 of approximately 2.3 µM ( Fig. 5b ), compared with an IC50 of 13 nM in the imaging assay. A shift in potency between the two assays has also been observed for other compounds and most likely is due to a difference in the ability to inhibit the cleavage of different substrates, similar to γ-secretase inhibitors (see Discussion, Suppl. Fig. S8 ).

Hit validation in B cells using endogenous SPPL2a and substrate. (, protease. (
Although the 156 hits had been validated in the imaging assay (examples shown in Suppl. Fig. S7 ), overnight treatment of A20 cells with the compounds only resulted in strong accumulation of p8 for 25 of the 156 hits (two examples, inhibitors 9 and 12, shown in Fig. 5c ). Others were either inactive or could not be confirmed due to cell toxicity at high concentrations ( Fig. 5c , inhibitors 10 and 11). Similarly, out of the γ-secretase inhibitors, only PF-3084014 could be validated ( Fig. 5c , inhibitor 1). Thus, the 25 novel hits (such as inhibitors 9 and 12 in Fig. 5d ) and PF-3084014 (Pfizer) were considered as validated SPPL2a inhibitors and potential starting points for further optimization.
Discussion
The recently discovered role of SPPL2a in the development, survival, and function of B cells and myeloid dendritic cells suggests a potential benefit of inhibiting SPPL2a activity for the treatment of autoimmune disorders, such as rheumatoid arthritis and systemic lupus erythematosus. In this study, we have carried out a high-content ultra-high-throughput screening campaign and discovered low-molecular-weight SPPL2a inhibitors as starting points for further optimization toward potential drug candidates.
Due to the rich phenotypic information provided by the microscopic images, we aimed to develop a high-content assay to conduct the ultra-high-throughput screen. To our knowledge, this is the first report of a high-content imaging assay for SPPL2a or other members of the aspartyl intramembrane protease family. So far, only one quantitative, potentially high-throughput-compatible cellular assay using a reporter gene system has been described for SPPL2a. 9 Mentrup et al. showed that development of a classical Gal4/VP16 luciferase RGA to measure SPPL2a activity, as successfully applied for γ-secretase in the past, failed in their hands. The Gal4/VP16 RGA system requires fusion of a relatively large ~28 kDa tag to the N-terminus of the SPPL2a substrate, which in the case of full-length TNFα led to accumulation of the presumably misfolded protein in perinuclear structures, and generation of only marginal amounts of the actual SPPL2a substrate TNFα NTF, which is generated by ectodomain shedding. However, a small N-terminal tag was tolerated by full-length TNFα, and they described a cellular SPPL2a assay, based on the β-Gal enzyme complementation system. In contrast, N-terminal fusion of the large ~27 kDa EGFP tag to the actual SPPL2a substrate TNFα NTF, as we applied for the development of the imaging assay described here, was well tolerated, did not interfere with endosomal/lysosomal targeting of the substrate, and did not result in protein aggregation. Likely, this difference is due to the fact that ectodomain shedding is not required when using the TNFα NTF, which might facilitate correct intracellular localization. Alternatively, differences in the cell lines HeLa/HEK293 9 versus U-2 OS cells (our study) that were used might play a role. In addition, for our purpose the high-content format was better suited since it helps to overcome several limitations of reporter gene systems, such as (1) interference of compound toxicity with the reporter gene signal, (2) detection of compound interference with intracellular trafficking preventing correct intracellular substrate localization (see below), and (3) interference due to compound autofluorescence. However, one challenge of HCS has been throughput, with the main limitations being washing steps and image acquisition speed. Here we enabled the ultra-high-throughput HCS in the 1536-well format by exploiting automated platforms that automatically cultivated the cells, dispensed them to the multiwell plates, added compounds, and stained the cells using high-fidelity dispensers and plate washers. Combining the automated image acquisition with on-the-fly image analysis boosted throughput, allowing imaging of one 1536-well plate in about 25 min, but also allowed timely quality control and intervention if needed. With the described setup, we were able to perform the primary screen of 1.4 million compounds in about 10 weeks.
The nuclear/cytoplasmic intensity ratio is a standard readout to monitor protein translocation in high-content imaging assays. 36 However, in this assay, due to the induction of substrate synthesis at the time of compound addition, compounds that generally impair intracellular organelles or protein trafficking prevent the newly synthesized substrate from reaching the endosomal compartment where SPPL2a resides, 2 and therefore the substrate cannot be cleaved and translocated to the nucleus. Thus, these compounds also cause low ratios of nuclear to cytoplasmic intensity and are identified as false positives. They could have been filtered out with counterassays, such as monitoring trafficking of an unrelated protein, which would have required additional assay development and screening efforts. Instead, we took advantage of the rich information in the images by extracting 340 image-based features. A number of multiparametric analysis methods have been successfully applied in HCS previously (see review in Chessel 37 ). We decided to calculate Mahalanobis distance, as it does not require any prior biological knowledge or manual annotation of training data sets. A reference population is needed for Mahalanobis distance calculation. For hit calling, we used the positive control wells as the reference and calculated the Mahalanobis distance of each sample to the positive control population. This method is particularly suited for HCS campaigns where a desired phenotype is predefined and a positive control treatment is available. For HCS fingerprint analysis, however, we used the negative control wells as the reference, as the goal was to filter compounds that did not cause a phenotype different from the DMSO control.
The design of the screening assay enabled us to observe diverse cellular phenotypes in addition to SPPL2a inhibition due to two facts. First, the substrate was induced simultaneously to compound addition, and second, the substrate was bound to intracellular membranes. We captured these phenotypes with HCS fingerprints to understand how compound treatments modulate the cellular system. Preliminary studies have suggested that many phenotypes are not limited to the original screening assay, but rather capture the biological effects of the corresponding compounds that are generalizable across a wide range of assays and cell lines (data not shown). The links between compounds and the cellular phenotypes are of interest for future drug discovery programs in aspects such as finding tool compounds, removing false-positive hits, or elucidating the mechanism of action.
Thorough selection and validation of the hits from a high-throughput screening campaign is essential before starting further optimization of a given scaffold. To this end, several hits from the primary SPPL2a imaging assay were validated in the biologically more relevant Western blotting assay; however, in general there was a shift in potency between the two assays. For example, LY411,575 was active in both assays, but 100-fold more potent in the imaging assay ( Fig. 5b , Table 1 ). This could be explained by a difference in the ability of a given compound to inhibit cleavage of different substrates, dependent on the substrate recognition by the enzyme—a phenomenon described for γ-secretase (inhibition of amyloid precursor protein vs. Notch cleavage38,39). Second, the activity of an inhibitor for an intracellular target is always affected by permeation, intracellular distribution, unspecific protein binding, and affinity to the target, and these aspects might be different between the two cell lines. In addition, B cells are known to express certain efflux pumps, such as P-glycoprotein; 40 hence, the intracellular concentration of certain compounds in the B-cell line A20 could be much lower than expected according to the concentration added to the cell culture medium. As we have confirmed the activity for selected high-throughput screening hits on mouse SPPL2a (data not shown) using the same substrate and assay concept as in the primary screening, we can exclude the species difference as the cause. To better understand the underlying cause of the potency differences between the two assays, we transfected the EGFP-TNFα imaging substrate transiently into the A20 cells, which we used in the p8 Western blotting assay. The transfected cells were treated with inhibitors, and p8 accumulation and EGFP-TNFα substrate cleavage were analyzed in parallel. Whereas LY411,575 inhibited cleavage of the EGFP-TNFα substrate at the lowest test concentration of 16 nM, accumulation of p8 was only clearly detected at 2 µM, which is in agreement with the activity observed in the two assay systems previously. Similarly, inhibitor 12 only showed accumulation of p8 of >4µM but reduced cleavage of EGFP-TNFα substrate of >0.8 µM, and inhibitors 10 and 11 prevented EGFP-TNFα substrate cleavage at the highest concentrations without p8 accumulation ( Suppl. Fig. S8 ). In conclusion, those results point toward a difference in the ability of the inhibitors to prevent CD74/p8 versus a TNFα-based substrate cleavage, even if we cannot formally exclude a different cellular location at which cleavage of CD74/p8 versus the EGFP-TNFα substrate occurs (exclusively intracellular vs. potentially partial cleavage of the EGFP-TNFα NTF substrate at the plasma membrane), and hence an influence of cell permeability of the different inhibitors contributes to the observed differences. To further characterize and optimize the validated hits toward potential drug candidates, future work is needed; for example, activity of compounds in the CD74/p8 accumulation assay needs to be improved. At the same time, the large collection of hits from the imaging assay represents a source to identify additional scaffolds for optimization since only a fraction of them have been tested in the secondary assay.
In conclusion, the presented work demonstrates the successful combination of ultra-high-throughput screening with high-content imaging and multiparametric analysis. As exemplified by the SPPL2a screen, this approach facilitated identification of true low-molecular-weight inhibitors and, importantly, can be applied for other potential drug targets not restricted to proteases.
Footnotes
Acknowledgements
We would like to thank V. Heidinger-Millot and her lab for providing cells for screening; C. Engeloch and her lab for delivery of compounds; F. Grandjean for automation; and B. Martoglio, P. Selzer, H. Gubler, I. Hossain, J. Lin, and J. Snyder for support and scientific discussions.
The authors received no financial support for the research and publication of this research article.
Author Contributions
U.B., M.G., X.Z., and D.Ga. initiated and carried out the study. U.B. designed the imaging assay, and U.B. and M.K. generated the stable cell line. U.B., M.K., D.Ga., and D.S. developed the primary image analysis. D.S. and D.Ga. participated in assay miniaturization and optimization. M.G. and Y.I.-R. miniaturized the imaging assay and conducted screening. G.M.C.B. developed the multiparameter image analysis and participated in hit calling analysis. X.Z. performed image and data analysis. A.S. performed the cheminformatics analysis. D.B. and D.Gu. developed the Western blot assay. D.B., D.Gu., U.B., and M.K. ran the Western blot assay for hit validation. X.Z., M.G., and U.B. wrote the manuscript with input from all authors.
Supplementary material is available online with this article.
Declaration of Conflicting Interests
The authors declared no potential conflicts of interest with respect to the research, authorship, and/or publication of this article.
Funding
The authors received no financial support for the research, authorship, and/or publication of this article.
References
Supplementary Material
Please find the following supplemental material available below.
For Open Access articles published under a Creative Commons License, all supplemental material carries the same license as the article it is associated with.
For non-Open Access articles published, all supplemental material carries a non-exclusive license, and permission requests for re-use of supplemental material or any part of supplemental material shall be sent directly to the copyright owner as specified in the copyright notice associated with the article.