
Abstract
Advances in instrumentation now allow the development of screening assays that are capable of monitoring multiple readouts such as transcript or protein levels, or even multiple parameters derived from images. Such advances in assay technologies highlight the complex nature of biology and disease. Harnessing this complexity requires integration of all the different parameters that can be measured rather than just monitoring a single dimension as is commonly used. Although some of the methods used to combine multiple measurements, such as principal component analysis, are commonly used for microarray analysis, biologists are not yet using many of the tools that have been developed in other fields to address such issues. Visualization of multiparametric data sets is one of the major challenges in this field, and a depiction of the results in a manner that can be readily interpreted is essential. This article describes a number of assay systems being used to generate such data sets en masse, and the methods being applied to their visualization and analysis. We also discuss some of the challenges of applying methods developed in other fields to biology.
Keywords
Introduction
Phenotype is defined as the observable physical or biochemical characteristics of an organism resulting from its genetic background and the environment it has experienced. Such a definition of phenotype can be applied to whole organisms, organs, and tissues, all the way down to individual cells, including those grown in vitro. The precision with which a phenotype can be defined is often limited by the number of parameters being measured. For example, cell death is a simple phenotype that can be measured using cell number; it can be further refined into apoptosis, necrosis, or senescence using parameters such as induction of caspases, DNA fragmentation, and cell morphology. Another example of how describing a phenotype with more parameters can lead to a more exacting description of the biological process being studied was presented by Tsiper and coworkers, who were able to show that increasing the numbers of morphological features used to describe the effect of statins on cells allowed the different clinical effects of the compounds to be identified. 1
The complexity with which a phenotype can be defined is further increased once tissues and organs are considered when multiple cells and cell types are interacting. Biological systems often depend on a balance of multiple factors, and no single measurement will correctly describe a particular biological state. The characterization of biological states using multiple biological readouts is especially important for describing developmental and physiological states. Stem cells are often characterized by the presence or absence of multiple gene transcripts or protein markers, and the status of immune cells by the presence or absence of multiple cell-surface markers.2,3 There are now a number of assay systems that allow multiple parameters to be measured on a large number of samples (see Table 1 ). Such studies are now starting to show that cells may not display discrete phenotypes (in a simple binary manner) but rather display a continuum of states. 4
Commonly Used Multiparametric Assay Methods.
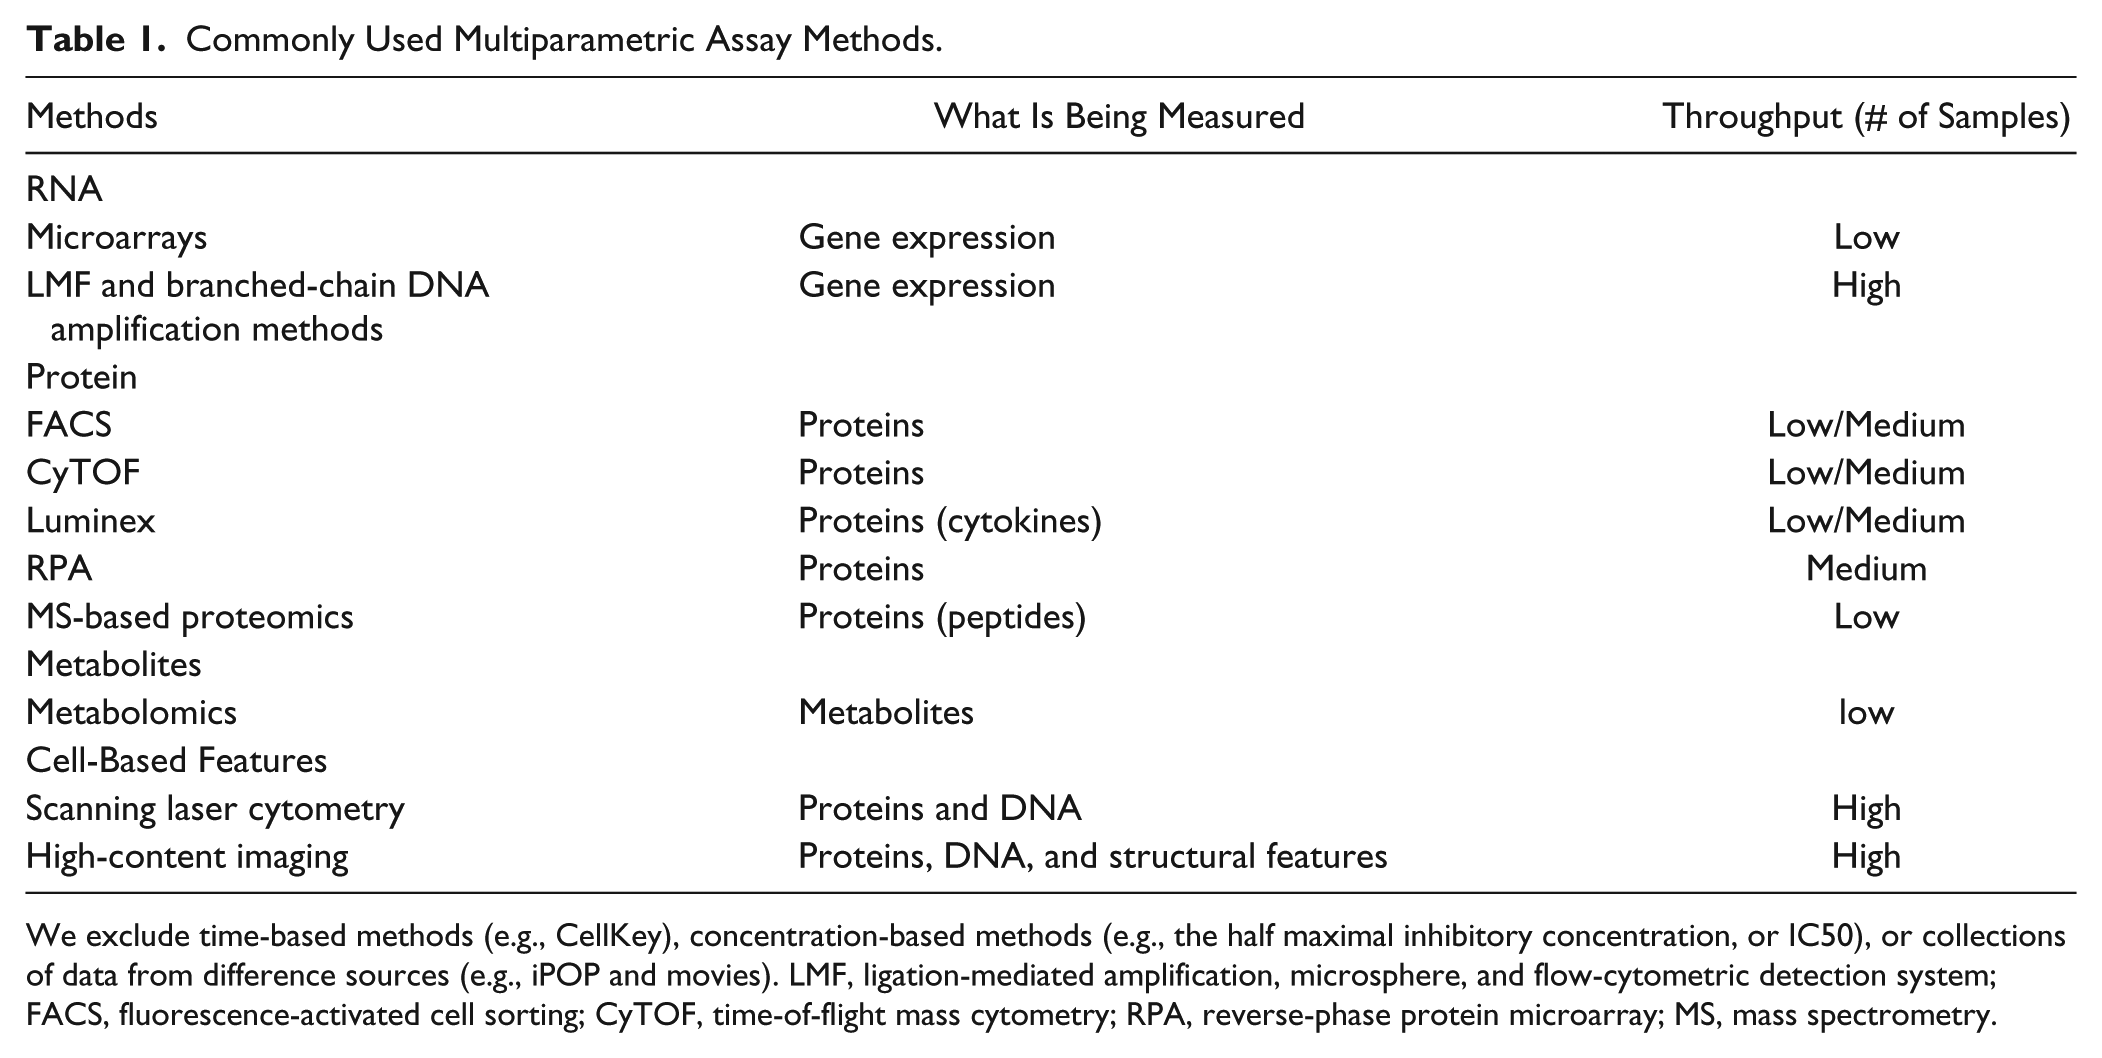
We exclude time-based methods (e.g., CellKey), concentration-based methods (e.g., the half maximal inhibitory concentration, or IC50), or collections of data from difference sources (e.g., iPOP and movies). LMF, ligation-mediated amplification, microsphere, and flow-cytometric detection system; FACS, fluorescence-activated cell sorting; CyTOF, time-of-flight mass cytometry; RPA, reverse-phase protein microarray; MS, mass spectrometry.
As technologies have been developed to handle larger numbers of samples, there is an increasing need to use machine-learning tools to evaluate the results from such experiments. In this article, we describe any technology that generates data requiring computational support for data analysis as being high throughput, so that methods that monitor only a few samples but generate hundreds of parameters (e.g., microarray experiments) are included, and methods that can screen millions of samples while still generating multiple readouts (e.g., image-based assays) are also considered. Fortunately, although these assay platforms use very different technologies, they produce data sets with a similar structure to those generated by cheminformatics and other data-intensive fields. Many of the analysis methods developed in these other scientific fields can be reapplied to these studies. Visualization methods are essential not only to assess consistency of the data (which may have been collected during a number of different experiments) but also to allow the data to be explored in novel ways that may lead to further insights into the underlying biology of the process being studied.
In pharmaceutical research, the goal is to correct, or at least modulate, the phenotype of the treated individual. Such a goal requires multiple parameters of the body’s physiology and phenotype to be monitored and optimized, sometimes with opposite objectives [e.g., the optimization of selective glucocorticoid-receptor (GR) agonists requires the optimization of transrepression functions without activation of the transactivation functions of the GR receptor]. 5
The objective of this article is to describe the various ways that are being used to analyze and compare, in a quantitative manner, results from such multiparametric experiments. This article will not review the many commercial or open-source software packages that are available to perform these analysis methods but, rather, will focus on the underlying methods and techniques being applied. The article will make comparisons to methods from engineering, computational chemistry, and other fields for analysis of multiple readouts and also try to highlight some of the visualization tools available to present such results.
Methods Generating Multiple Assay Readouts
Table 1 lists the commonly used assay methods that result in multiple readouts from any assay sample.
RNA
The availability of microarrays in the 1990s made it possible to monitor the biological responses of cells to changing environments, drug treatments, or toxins. 6 Recent advances in next-generation-sequencing methods now make it possible to monitor transcriptional changes in an increasingly unbiased manner, such that rare splicing variants or unexpected transcripts can be detected and quantified, even in species where microarrays are not available. 7 Such methods have the ability to report on not only the 20,000 or so genes expressed from the human genome but also any noncoding RNAs that may be expressed in the cell. Methods to collect such data sets have improved throughout time with greater effort being applied to the design of such experiments to obtain sufficient statistical significance when monitoring changes or differences among different states or treatments. 8
The development of ligation-mediated and branched-chain DNA amplification methods has now made it possible to monitor numerous gene transcripts in multiple samples, allowing compound profiling and screening to be conducted.9,10,11 The result is that it is now possible to screen large numbers of samples, monitoring the effects of up to 90 genes simultaneously.9,12 This, combined with the fact that genes can be chosen to represent the combined effects of multiple pathways, means that with careful selection of the transcripts to be tracked, many aspects of cellular physiology can be monitored simultaneously. 13 In our experience, however, there are significant challenges in generating results that are consistent in a day-to-day and batch-to-batch manner using these technologies. Methods to normalize among different experiments and improvements to assay consistency are still needed to fully exploit these methods.
Protein
Although transcript analysis monitors the cellular effects on gene expression at the level of transcription or RNA stability, it has been reported on a number of occasions that changes in messenger RNA (mRNA) levels do not directly reflect changes in protein levels. 14 Therefore, a number of different methods have been developed to monitor changes in protein levels in response to changing treatments. In general, the mass spectrometry (MS)-based proteomics methods such as two-dimensional (2D) gel electrophoresis or liquid chromatography (LC)-MS-based proteomic methods, recently reviewed, 15 will not be discussed further in this article because the number of samples they can analyze is fairly limited. Methods that focus on monitoring the presence of a number of preselected proteins using affinity reagents such as antibodies or aptamers have a higher throughput and so can be used for screening applications. Such methods include technologies such as protein arrays16,17 or Luminex bead–based multiplexed assays. 18 Recent developments have enabled the use of fluorescence-activated cell sorting (FACS) for multiparametric screening. Conventional FACS machines are able to monitor up to six different parameters (four colors with forward and side scatter) on an individual cell basis, thus allowing simple profiling of the cell population. With the development of sampling and data-analysis tools, 19 such FACS-based methods are being used for high-throughput screening (HTS) applications. 20 Further developments of the detector arrays of FACS machines have allowed the development of machines capable to monitoring up to 44 variables simultaneously on each particle detected in the flow cytometer. 21 Antibodies labeled with rare earth elements have allowed the development of mass cytometry [or time-of-flight mass cytometry (CyTOF)], in which up to 100 parameters can be detected on a cell-by-cell basis. In addition, by using specific reagents to label the protein content of the cell, this method allows multiplexing of samples for greater throughput. 22 The main disadvantage of this method lies in the use of inductively coupled plasma (ICP)-MS for the detection of the labeled antibody, which requires the vaporization of cells in argon plasma, precluding any recovery of the sample.
Compared to transcriptome-based methods, the phenotype of individual cells can be monitored, allowing for the detection of rare cell types or events within a population, such as differentiation or changes in samples containing multiple cell types.
Metabolites
Although changes in mRNA or protein levels are important for monitoring phenotypes, the abundance of metabolites can also be used to track changes in cellular physiology. Metabolomics, just like proteomics, can be focused on a set of preselected analytes or can monitor changes in the overall pattern and abundance of metabolites present in a sample. 23 Such methods allow one to monitor changes in cellular metabolism that may not be apparent on the time scale required to detect changes in transcription or protein abundance, or to analyze samples from species for which genomic-sequence data are not available 24 or samples that contain mixtures of organisms. 25 The throughput of these methods has not, however, reached the point at which they can be used for routine screening efforts.
Cell Features
Screening approaches that are capable of monitoring cell-by-cell effects have even been extended to laser-scanning cytometry and to microscopy-based efforts, and they are often referred to as high-content assays. Such assays try to capture the effect of treatments on multiple cellular readouts, at multiple concentrations, and now even against multiple cell lines.26,27 As for metabolites or proteomics, such assays may be used to monitor only specific events of interest to the researchers (e.g., nuclear translocation of a specific translation factor) or as many morphological features of the cell in response to treatment as possible. 28 Because imaging-based assay methods have the ability to report on the state of individual cells (much as FACS and CyTOF methods can do), it becomes possible to record not only individual cell parameters but also population statistics, which has proven to be very important for normalizing and correcting for differences in the cell cycle or the cell local environment in small interfering RNA (siRNA) screens. 28
Methods for Analyzing Multiparametric Data
One simple, yet effective, approach to analyze multiparametric data is to focus on a small subset of parameters, analyze them independently, and then combine the results. The gating approach commonly used in flow-cytometry data analysis sets up thresholds on different fluorescent markers to separate cells into unique subpopulations. Such gating strategies have, however, the disadvantage that if conducted manually, they can result in significant variability among users. 29 An additional source of variability can be normalization within and among different experiments, although tools to address these issues have been developed.30,31 In high-content image-based screening, studies typically focus on one primary readout, such as a target protein signal, while using other readouts as filters to identify treatments that have resulted in overt toxicity. 32 This approach, however, is limited to a small number of readouts and does not take into account the correlation among readouts. To fully leverage the phenotypic knowledge in multiparametric data, one needs to apply multiparametric statistical learning methods. 33
Multiparametric statistical methods are designed to understand the structure and patterns from current data sets, and thus to define predictive functions that can be applied to new data. These methods are widely applied in multiparametric screening data analysis.26,34,35 A list of different types of analysis and example methods is shown in Table 2 , grouped by their objectives. Feature-selection and dimension-reduction methods aim to find out the informative subset or combination of original readouts. 36 Distance or similarity methods aim to convert multiple readouts into one distance or similarity score to represent how close the phenotypes of two treatments are. Machine-learning methods aim to identify distinct phenotype groups in the data set, either based on predefined phenotypes (supervised) or without predefined phenotypes (unsupervised). 37
List of Multiparametric Analysis Methods.
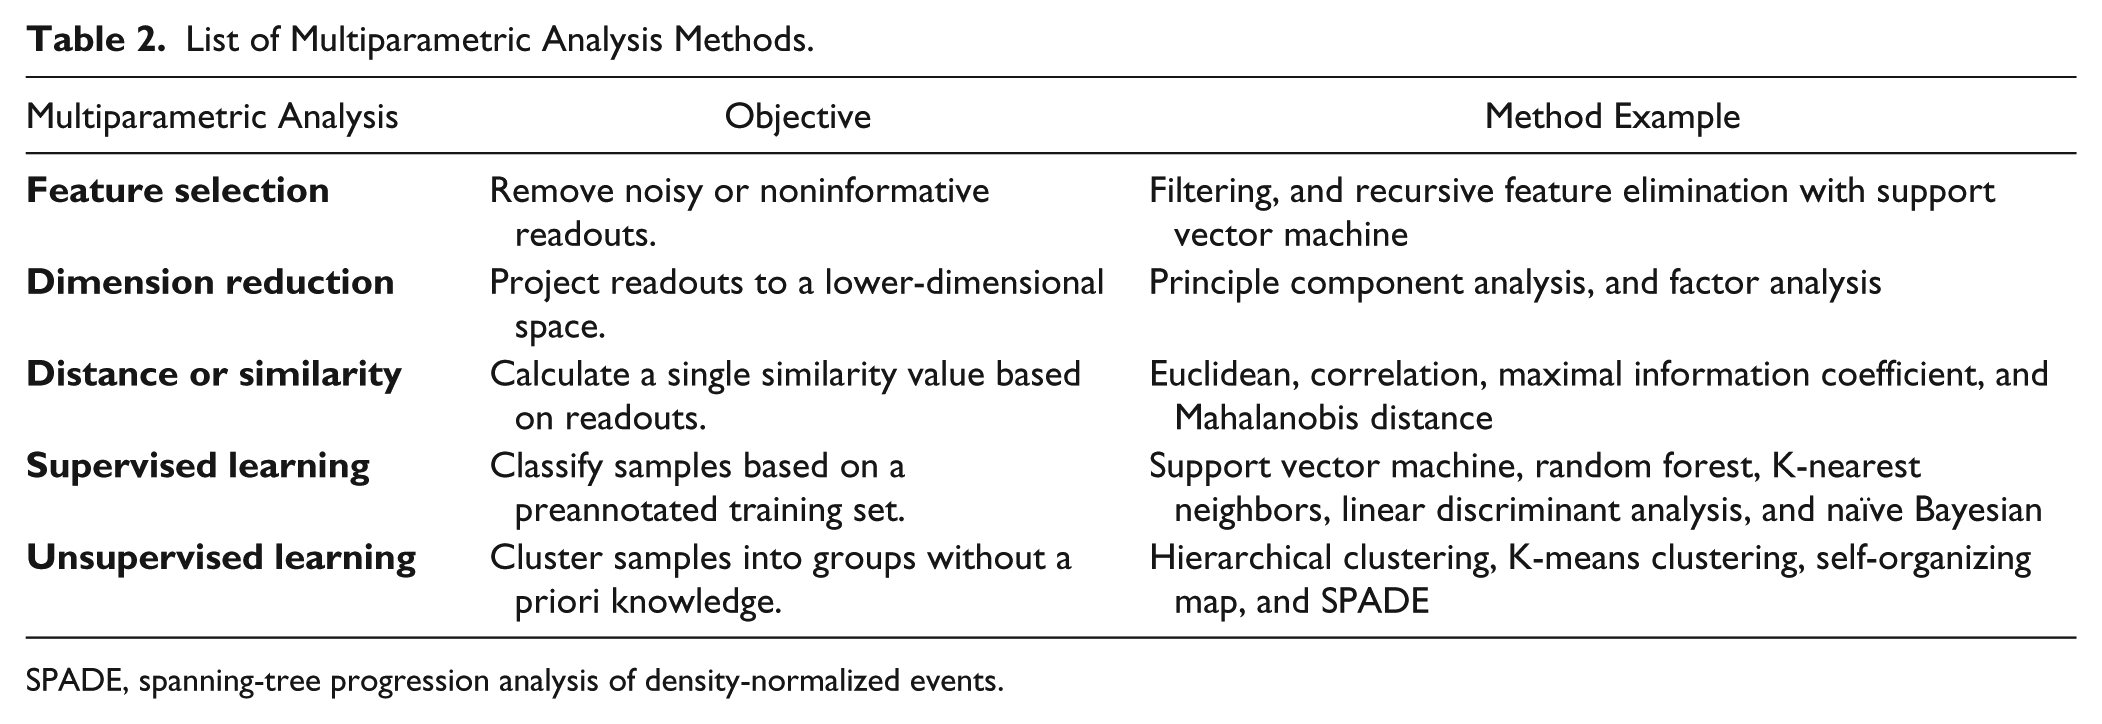
SPADE, spanning-tree progression analysis of density-normalized events.
Feature Selection and Dimension Reduction
Raw readouts from screening assays may contain noisy or redundant information. Multiple readouts are often highly correlated, due to either related biology (e.g., antibody readouts in FACS) or correlated measurement [e.g., cell perimeter versus cell area in high-content screening (HCS)]. By focusing on the relevant and informative readouts, dimension reduction and feature selection will help analysis efficiency and accuracy as well as understanding of the underlying biological processes. Many dimension-reduction methods have been applied in bioinformatics; 36 here, we focus on methods that have been applied to screening data. One simple way to select the readouts is to apply certain filtering criteria, such as variance throughout a whole data set, reproducibility among replicates, or separation between negative and positive controls. This method is straightforward and fast to compute, but it does not take into account the potential correlation among readouts, and readouts not separating the controls may be important for identifying novel phenotypes in the screen. Alternatively, such analysis can calculate the correlation among readouts and remove the redundant readouts, or transform the readouts to orthogonal components or factors via either principle component analysis 38 or factor analysis. 39 Each component or factor is a combination of readouts that might provide better biological interpretation. For example, Young et al. have identified six factors by analyzing 36 cytological readouts, in which factor 1 is a combination of multiple nuclear size-related readouts. 39 A third type of approach is to embed feature selection in classification analysis. One example is recursive feature elimination embedded with a support vector machine (SVM), in which readouts are removed one by one until the SVM overall classification accuracy is impaired. Loo et al. have applied this method and shown that only 20–40 readouts are needed out of about 300 image-based readouts. 40
Distance and Similarity Metric
To identify samples with novel phenotypes, we often need to calculate a single distance or similarity score based on all the readouts. This score can be based on the distance or similarity between a sample and a negative control; to identify samples with significant phenotypes; or, among samples, to cluster samples based on their phenotype. Various multiparametric distance or similarity measures can be used, such as Euclidean distance,41,42 Mahalanobis distance,43,44 and correlation distance.45,46
Euclidean distance calculates the square root of the sum of the squared differences between two treatments for each individual readout, in which each readout is equally weighted. Mahalanobis distance is similar to Euclidean distance, except it takes into account the correlation among readouts. Thus, when correlation among readouts is expected, as is often the case in original multiparametric readouts, Mahalanobis distance is preferred. Alternatively, one can apply the feature-selection methods mentioned in this article to reduce correlation before applying Euclidean distance. The third distance method is correlation distance, which calculates the angle between two readout vectors instead of absolute distance.
Recently developed correlation methods, such as maximal information coefficient 47 and Brownian covariance, 48 which captures linear and nonlinear correlation, are also being explored in HCS data analysis. 49
It is important to select the right distance metric, because the efficiency of classification and clustering will heavily depend on it. For example, while Euclidean and Mahalanobis distances capture the magnitude of the phenotypes, correlation captures the difference among the phenotypes. Great care should be taken to select the distance that best reflects the phenomenon of interest.
Supervised Learning (Classification)
Supervised learning (classification) is suitable when there is a known set of phenotype classes (e.g., cell-cycle phases) 50 or positive and negative phenotypes. A set of rules based on the readouts (i.e., a classification model) is first learned with a training data set in which class labels are known (e.g., by manual annotation). Models can then be applied to the whole data set and predict phenotype classes. This approach can be applied not only on the cell level for cell phenotypes but also at the well level for sample phenotypes. Popular supervised methods include K nearest neighbors, 51 SVMs,34,50 linear discriminant analysis (LDA), 52 naïve Bayesian classifier,53,54 artificial neural networks (ANNs), 54 random forests, 55 and Markov models. 56 For definitions and detailed descriptions of these methods, readers are referred to machine-learning reviews and books.33,37 All these methods have been used extensively in bioinformatics, and some methods are more popular than others. 57 To evaluate different supervised methods, one typical exercise is to randomly divide the annotated data set into two groups, one for training the model and the other for evaluating the model. By this cross-validation exercise, users can estimate the classification accuracy of different methods. Supervised learning has the advantage that one can predefine the relevant phenotypes, and the results are relatively more straightforward to interpret. For example, Neumann et al. predefined 16 morphological classes to assess cell-division phenotypes in an RNA interference (RNAi) screen. 50 This approach, however, is only able to detect previously known phenotypes, and its performance is unpredictable when used on novel phenotypes that were not present in the training data set, in which case one should consider unsupervised learning methods.
Unsupervised Learning (Clustering)
Unsupervised learning methods try to cluster the data into groups based on their pairwise similarity, so that the samples present in the same group have a higher similarity to each other than to members of other clusters. These groups are then further characterized as phenotypic classes. Typical methods include hierarchical clustering,39,45 K-means, 58 neural network, 59 and SPADE (spanning-tree progression analysis of density-normalized events). 4 For definitions and detailed descriptions of these methods, readers are referred to machine-learning reviews and books.33,37,60 To evaluate the performance of clustering methods, one can assess the structure of the clustering via different indexes, 61 or by benchmarking against external labels such as compound structure 39 or gene targets.45,62 Such a clustering approach is impartial because there are no predefined classes. For example, Bendall et al. applied SPADE to cluster cells based on their immune responses, and then projected these results onto a 2D plot to represent their relationships. 4 Parameters such as the number of clusters, however, which are often arbitrarily defined, can substantially affect the clustering results. One caveat of such an approach is that it also requires additional efforts to understand the clusters and their biological implications.
It should be noted that the methods mentioned here are neither independent nor exclusive. Feature selection can be embedded with SVMs, 40 and dimension reduction is often needed before calculation of Mahalanobis distance. 44 Young et al. first applied factor analysis to reduce dimensions before applying hierarchical clustering, 39 and Fuchs et al. applied a supervised method to classify cellular phenotypes before clustering siRNA phenotypes with an unsupervised method. 34 Thus, different methods need to be considered and evaluated in conjunction.
Methods for Visualizing Multiparametric Data
There are multiple ways to display multiparametric data, and there is extensive literature that focuses on the mathematical and computational aspects of the problem (see Fig. 1 for examples; for reviews, see Refs. 63,64). One of the major challenges in multiparametric visualization is how to best simplify the data while at the same time retaining the important relationships among the different samples and parameters. Namely, the challenges are to find the best possible combination of dimensions that avoids losing important details, and to assess the effectiveness of the resulting visualization. In biology, the key challenge remains in the interpretability of the display, a visual metaphor that needs to be consistent with the biological concepts it is trying to describe.
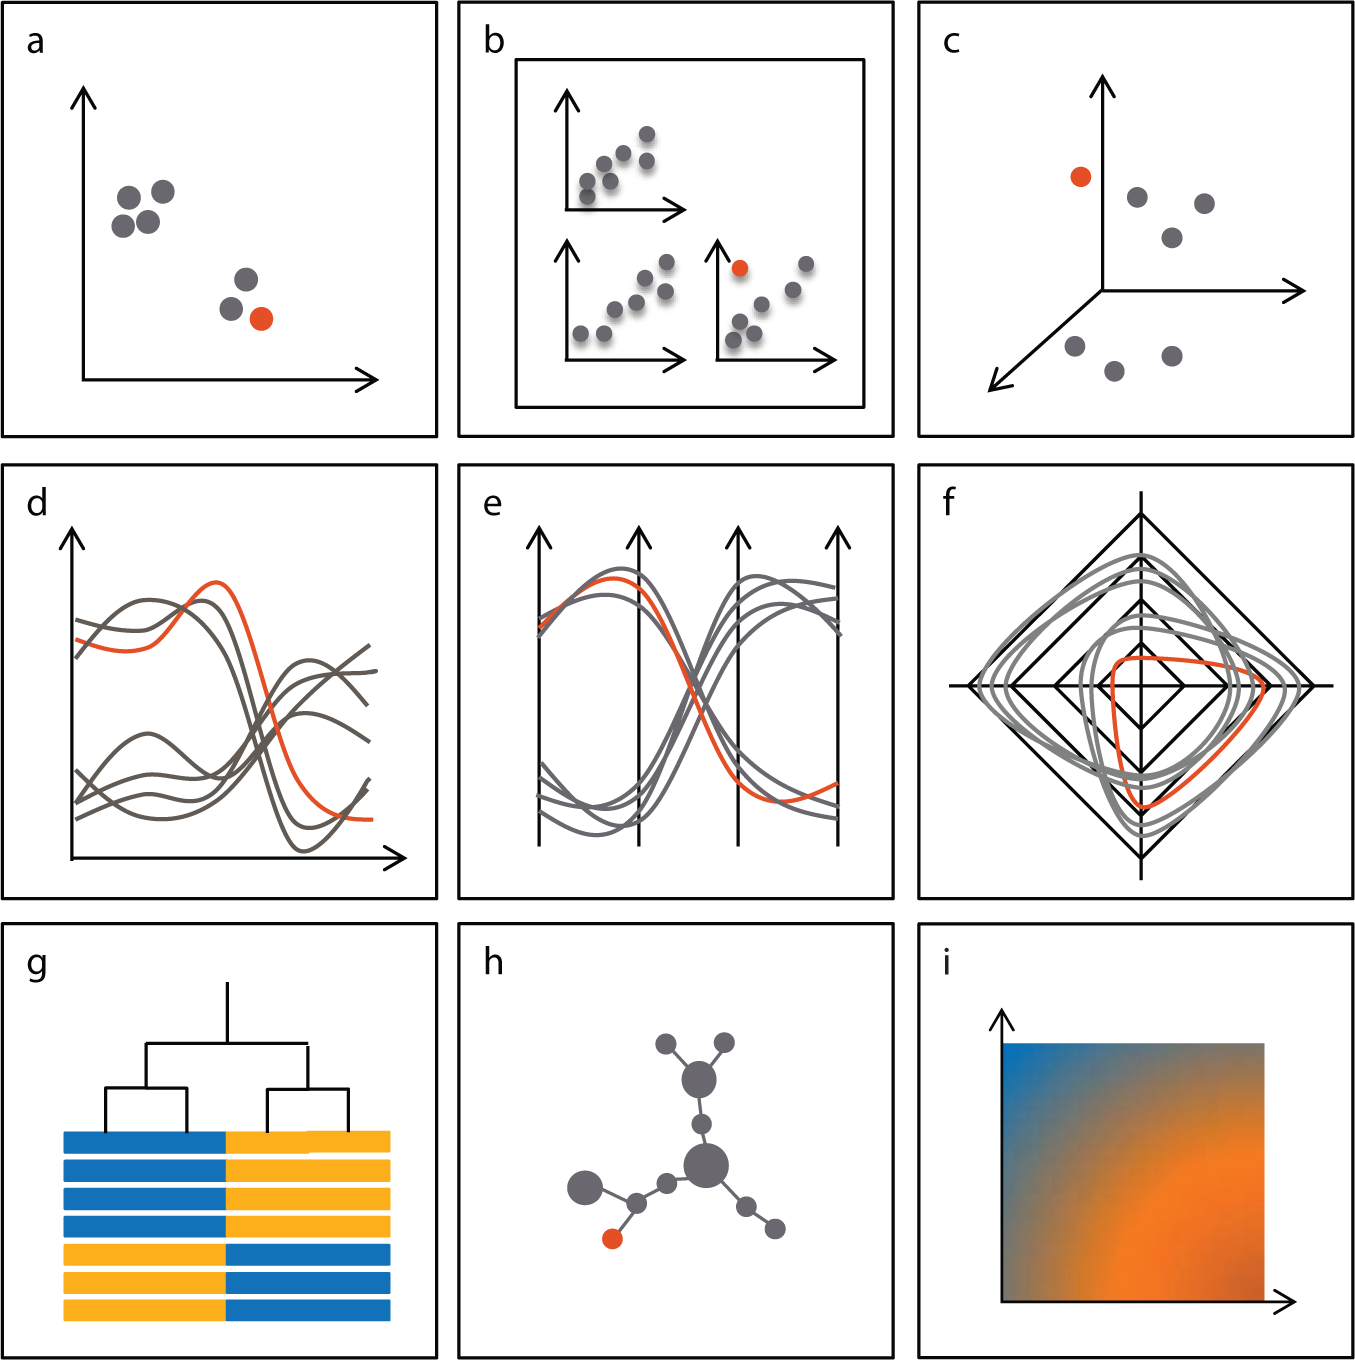
Examples of multivariate visualizations. (
The repertoire of visual metaphors that are routinely used to present data in biology is limited and includes scatterplots, heat maps, and histograms. Most biologists are not familiar with concepts underlying other types of graphs, such as boxplots, thereby limiting their usefulness. The increasing need for multiparametric visualization, as described in this article, driven by high-content technologies, must be matched with the expectations and experience of users by enhancing familiar concepts rather than introducing new ones.
Familiar Metaphors: Scatterplots and Multiparametric Data
Scatterplots are the workhorse of scientific visualization; every scientist is familiar with them and knows how to interpret them, which makes them a powerful metaphor (
Fig. 1a
). When the number of dimensions is low, one can use a scatterplot matrix to display the data (
Figs. 1b
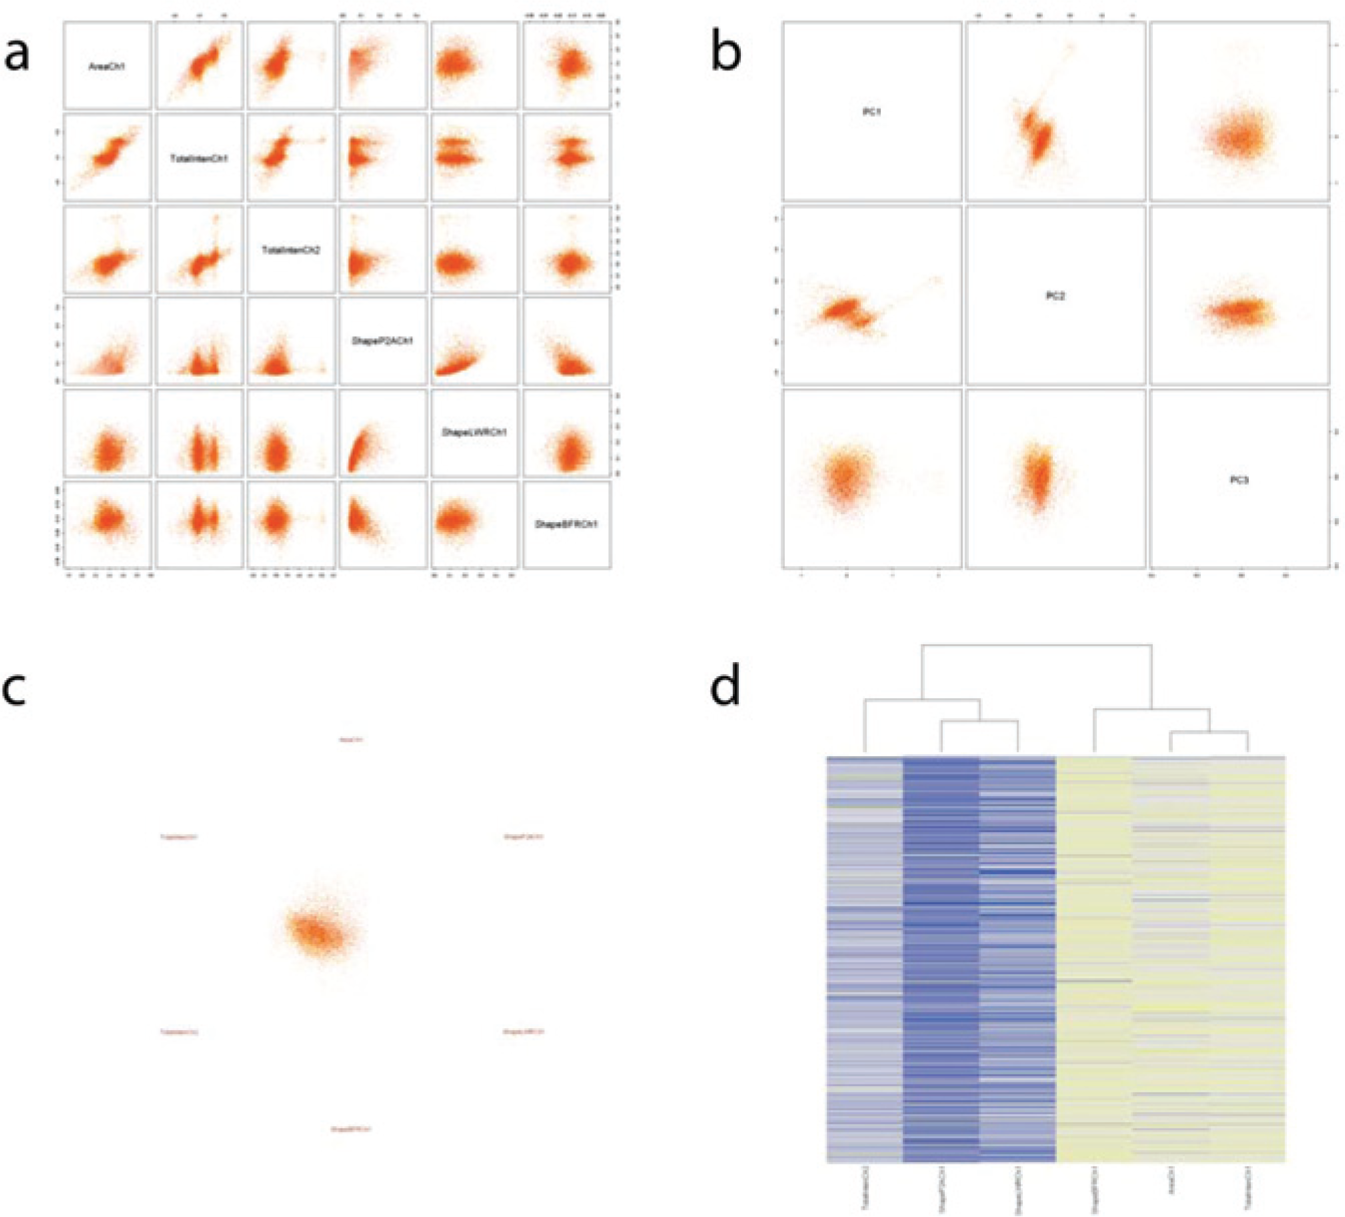
Examples of visualizations applied to high-content screening data. (
In PCA, each data point is projected on a linear combination of dimensions so that the new dimensions (the principal components) capture as much of the variance in the data in as few dimensions as possible. Using principal components instead of original dimensions, data can be displayed as a scatterplot while retaining most of the information present in the data. In addition, the loadings of each principal component can be interpreted in terms of relations among the measures used in the experiment, confirming known interactions or leading to new biological insights.
Other projection methods include multidimensional scaling (MDS) and self-organizing maps (SOMs). These methods project the data onto a 2D grid so that distance among points in 2D is comparable to distance in the multivariate space ( Fig. 1i ). They allow for visualization of a large number of samples, enabling identification of patterns in the data. This is especially relevant for the analysis of HCS data, in which the relationship between the dimensions being measured (usually, physical parameters) and the biology is weak, whereas the relationship among the phenotypes of the cells (positive controls, negative controls, and samples) is key to calling hits.
Recently, application of topological data analysis to multiparametric data led to the development of t-SNE (t-distributed stochastic neighbor embedding),16,66 a method in which multiparametric data are projected in a 2D space in a way that preserves the relations among the data points. An implementation of this technique, called viSNE, has recently been used to analyze results of single-cell analysis, highlighting similarities among healthy donors and their differences from patient-derived samples. 67 Although information about the contribution of each dimension is lost, such a map could be used to analyze results of HSC data at the single-cell level, directly visualizing cells from sample wells in the context of cell populations from control wells.
Compared to PCA, these procedures require optimization and may give different results with every repeated attempt. Moreover, the relationships among dimensions are lost and cannot be used to derive new insights about the biology.
Extending the Scatterplot
Several ways to extend the scatterplot have been described that build on the familiarity that most people have with this way of presenting data. Examples in which such an approach has been taken to extend the scatterplot include Chernoff faces, 68 stick figures (and, more generally, any icon method that can be combined with geometric methods.64,69
Another approach combines Hilbert space-filling curves (a pixel method) with scatterplots to display large fingerprints such as those generated in cheminformatics, in HCS, or during meta-analysis of high-throughput data, in the context of two dimensions.70,71 Although these solutions allow one to display a large amount of information at once, their interpretability is limited by our perception of color, shapes, and angles.72,73
An interesting yet seldom explored possibility is radial coordinate visualization, or radviz. 74 In radviz, each dimension is treated as an anchor, to which each data point is linked by a spring. The spring tension then corresponds to the measured intensity for that data point in a given channel. The position of each point corresponds to the point of equilibrium among all springs. Depending on the position of anchors in 2D space (typically, on a circle and evenly spaced) and on the order of the anchors (either derived from knowledge of the system or optimized using an algorithm 75 ), different patterns will emerge from the data that can be interpreted in terms of similarity among the data points ( Fig. 2c ).
Examples of radviz being used to analyze biological results exist but have been limited so far to data mining and evaluation of clustering efficiency.76,77 Yet the potential for HCS data exists, in which one can quickly assess similarity among data points and controls, or the efficiency of hit-calling mechanisms.
Heat Maps and Line Charts
Heat maps are widely used to display the results of multivariate experiments, and are probably the most familiar method for biologists (
Figs. 1g
Another powerful visual metaphor is the line chart, in which each item being measured is represented by a line in an XY plot, in which dimensions are represented as categories on the x-axis and intensities are captured on the y-axis ( Fig. 1d ). Line charts use a single y-axis when the dimensions can be normalized to a common scale, whereas parallel-coordinate plots use a distinct y-axis when dimensions of different scale or type exist in the data ( Fig. 1e ). Radar plots represent a variation of the parallel coordinate plot, in which dimensions are organized radially rather than linearly ( Fig. 1f ). Such visualizations are very good at presenting how closely a given treatment creates, or correlates to, a desired pattern of responses and which aspects need to be modulated.
Heat maps can display almost any amount of data provided a meaningful order exists for rows and columns. Line charts, however, are rapidly limited in terms of number of events and number of dimensions; one can limit the number of events displayed at once by filtering based on similarity to a reference profile.
Clustering of dimensions in a heat map, or reference profiles for line charts, carry information about the biology being measured if they are derived from unsupervised learning. Alternatively, they can represent hypothesis being tested, such as signatures or known populations.
Visualizing Populations
Recent evidence from single cell analysis suggests there are many more transition states among cell populations in the immune system than were previously thought. 4 This is likely to be true in other systems as well, suggesting a continuum of cellular phenotypes rather than a collection of discrete states. Yet, clustering remains an attractive way to simplify complex data sets by grouping similar objects together so that higher-order relationships can be explored.
Standard, density-based clustering approaches will tend to group these transition events with the closest population. To address this challenge, the SPADE algorithm first samples a subset of the data so that the density is the same throughout the space being explored. After the clustering step, a minimum-spanning tree algorithm is used to group clusters by proximity in multivariate space while allowing for a simple 2D visualization. Although this method allowed for the identification of several transition steps that had not been observed before, its main limitations remain the estimation of the number of clusters, which depends on the analyst’s definition of a biologically relevant population, and the fact that the minimum-spanning tree might not an optimal solution to capture and represent relationships among populations. 35
Alternatively, one can use SOMs, 59 t-SNE, 66 or viSNE35,67 to identify cell populations independently of any hypothesis (Fig. 1h–i). By constructing 2D projections that capture cell–cell relationships in multivariate space, these methods allow for the visual assessment of the presence of populations, their number, and their size. This comes at the expense of biological interpretability, because the position of individual cells or clusters cannot be related to the original measurement. Relations among populations are usually lost, because optimization is focused on short distances.
Conclusion and Future
As illustrated in this article, a growing number of assay technologies are capable of recording multiple parameters of a biological system, and as the throughput of these methods increases, they are increasingly being used for screening applications. In addition, this report has described some of the tools that can be applied for the analysis of such data sets as well as some of the methods that have been used to present and visualize such results to aid the conceptualization and interpretation of such data sets.
A number of challenges in this field of multiparametric evaluation of biological systems can be anticipated. First, there will be a continued need for the development (and widespread deployment) of tools that are accepted by the screening community for the visualization of such multidimensional data sets. An important outcome of such a development is that the community will start to come to a consensus on a common format for presenting such experiments. Second, one aspect that is missing in the vast majority of reports describing multidimensional assay readouts has been the assessment and tracking of assay quality.
One of the most important contributions to HTS has been the development of the Z’ factor, a simple and easy-to-implement statistic to monitor assay quality. 78 This single measure has now been referenced >700 times since its publication (in just PubMedCentral alone) and has led to a number of alternatives or developments.79,80 It should be noted, however, that all these papers spring from the original paper of Sittampalam et al., who first published methods to monitor assay HTS quality. 81 The Z’ parameter has become so widely accepted because it is a simple, easy-to-calculate means of tracking assay performance. We believe that the analysis of multiparametric data sets for the screening community is reaching a similar inflection point at which common quality-control statistics need to be accepted by the screening community to allow different assays, assay methods, screening machines, and data sets to be compared in a consistent and accepted manner. A number of different methods have been presented in which it has been possible to condense multiple dimensions into a single value that can then be used to calculate a Z’ value.44,52,82,83 Such methods all have the disadvantage that they allow one to discern if one compound treatment or biological state is similar to a known treatment or biological state. Such measures, however, have no indication of direction, so it is not possible to determine if a treatment is driving the system closer to the desired state over the complete set of descriptors. The development of similarity measures that include direction (e.g., using a vector of cosine similarity) or visualization methods such as Pareto graphs or radviz may help to address this issue. The availability of such measures will then allow assay developers to monitor multiple readouts. This is important because without the ability to track assay quality, comparison of results among days, batches, or screening runs will not be possible.
The third challenge that scientists will face using multiparametric data sets will be to develop methods that allow the unbiased exploration of such data sets in a way that enables the discovery of previously unknown phenotypes. This is similar to identifying groups of compounds in large collections using methods such as SVMs or neural networks. Such methods can, however, be swamped by the sheer volume of data in a screening context. One approach that has been taken to overcome this problem is first to identify those treatments that leave the assay in a state similar to the untreated (or DMSO control treated) sample and remove these samples from the subsequent analysis. 59 In essence, this approach is similar to that first presented for analysis of microarray results 84 and HTS results. 85 It may also be possible to extend concepts such as a maximum common substructure (a way to identify the maximal common feature in sets of compounds), which could be applied to identify the maximum set of common features that define a phenotype.
Finally, because multiparametric data sets become larger and start to encompass not only larger numbers of readouts and samples but also different types of data collected, throughout time, new methods will be required. An example of this challenge starting to face the field was recently presented by the paper of Chen et al.; 86 in this paper, it was necessary to analyze time-series data sets using methods, such as Fourier spectral analysis, that were developed for use in other fields. Such examples of algorithms first developed in fields such as engineering, signal processing, and physics will be needed for the analysis of these larger data sets.
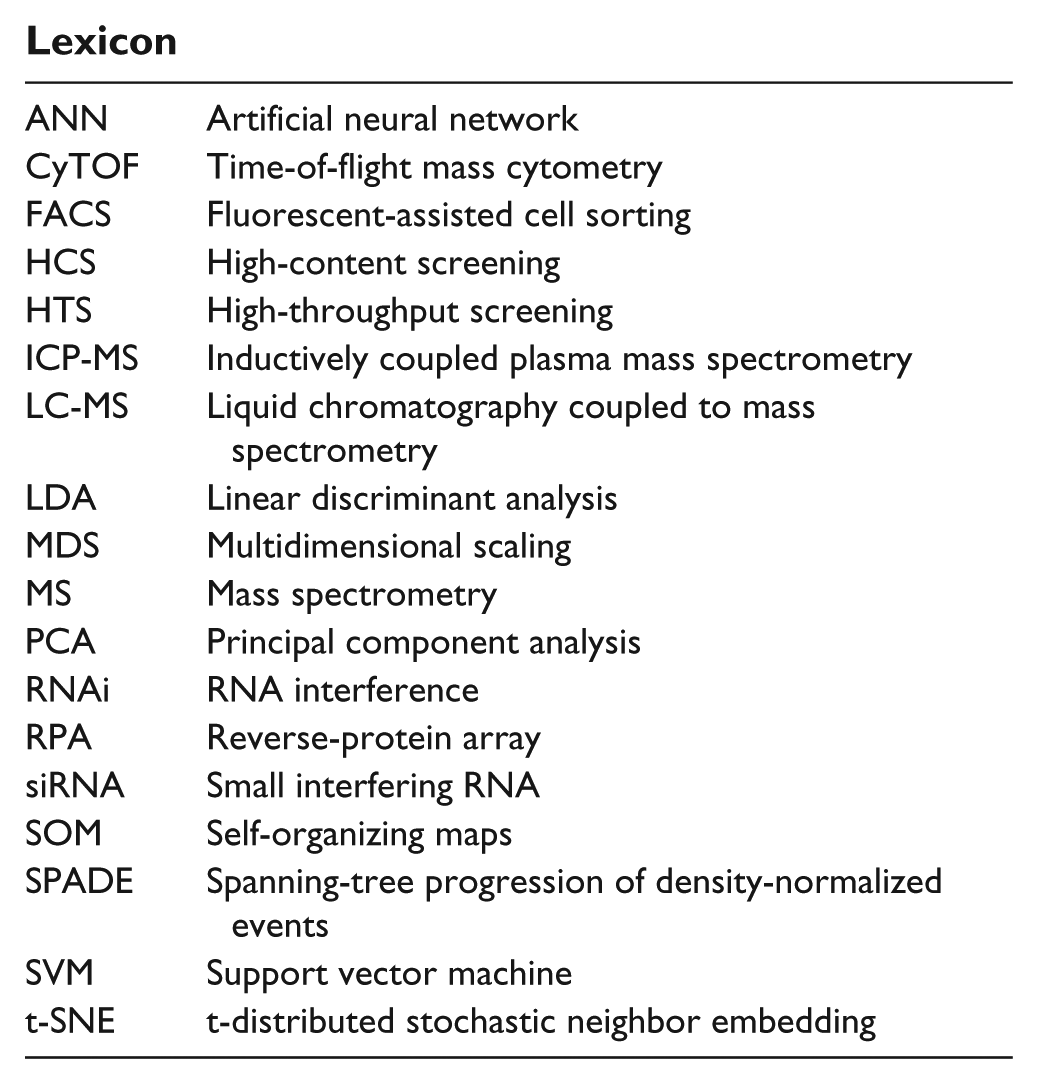
Lexicon
Footnotes
Declaration of Conflicting Interests
The authors declared no potential conflicts of interest with respect to the research, authorship, and/or publication of this article.
Funding
The authors received no financial support for the research, authorship, and/or publication of this article.