
Abstract
Agonist shift assays feature cross-titrations of allosteric modulators and orthosteric ligands. Information generated in agonist shift assays can include a modulator’s effect on the orthosteric agonist’s potency (alpha) and efficacy (beta), as well as direct agonist activity of the allosteric ligand (tauB) and the intrinsic binding affinity of the modulator to the unoccupied receptor (KB). Because of the heavy resource demand and complex data handling, these allosteric parameters are determined infrequently during the course of a drug discovery program and on a relatively small subset of compounds. Automation of agonist shift assays enables this data-rich analysis to evaluate a larger number of compounds, offering the potential to differentiate compound classes earlier and prospectively prioritize based on desired molecular pharmacology. A high-throughput calcium-imaging agonist shift assay was pursued to determine the allosteric parameters of over 1000 positive allosteric modulator (PAM) molecules for the human muscarinic acetylcholine receptor 1 (M1). Control compounds were run repeatedly to demonstrate internal consistency. Comparisons between potency measurements and the allosteric parameter results demonstrate that these different types of measurements do not necessarily correlate, highlighting the importance of fully characterizing and understanding the allosteric properties of leads.
Introduction
G-protein-coupled receptors (GPCRs) transmit signals based on conformational changes induced by ligand binding. GPCRs are influenced by ligand binding at orthosteric, as well as distally located allosteric, binding sites. Binding at an allosteric site can influence the binding of the orthosteric ligand and potentially create a response in the absence of an orthosteric ligand.1,2 Allosteric modulators are of particular interest for drug discovery because they do not displace the biologically relevant orthosteric ligand but instead can alter the efficacy of the orthosteric ligand, maintaining the native signaling system. 3 Measurements of allostery often involve lower throughput assays due to assay complexity. More conventional potency positive allosteric modulator (PAM) assays for determining the inflection point (IP) introduce the PAM compound, then a low concentration of the agonist, titrating only the PAM compound. Allosteric measurement assays involve cross-titrations of both the PAM compound and the agonist. The ability to assess allosteric behavior early in the drug discovery process could potentially allow for allosteric properties to drive decision making, rather than relying only on potency measurements (i.e., IP values). A high-throughput automated agonist shift platform to assess allosteric modulation of GPCRs has been recently described. 4 This technology was applied to investigate the pharmacological properties of M1 PAMs in a high-throughput automated assay.
The muscarinic receptors 1 to 5 (M1-M5) are GPCRs that have high sequence homology at the orthosteric ACH binding site, 5 which has complicated the development of both selective agonists and antagonists for this receptor class. This was highlighted in the clinical trials for xanomeline, an orthosteric binding M1/M4-preferring agonist, which was shown to be effective in improving several cognitive measures, but had modest patient compliance due to drug-related adverse events, most notably gastrointestinal side effects. 6 To develop subtype-selective ligands, researchers pursued the development of ligands targeting allosteric sites where sequence homology was significantly lower. 7 M1-selective PAMs BQCA 8 and PQCA 9 demonstrated improved cognition in rodent models. The discovery of selective PAM molecules brings its own complications due to the complex kinetics involved with allosteric modulation. Because M1 PAM molecules can be directly affected by altered levels of acetylcholine (ACH), the dependency of the PAM molecule on ACH concentration becomes crucial to assess during drug discovery. Furthermore, measuring changes in ACH concentration in disease states has not been achieved to date, although studies showing modest efficacy of acetylcholinesterase inhibitors in Alzheimer disease suggest that ACH levels are reduced in this disease state. 10 As a result, to achieve efficacy in a possible disease state of reduced cholinergic levels, the receptor allostery of PAM molecules will need to be well understood. While allosteric parameters are typically investigated late during compound development, it is proposed here that these experiments should be assessed much earlier, potentially during early compound evaluation and hit prioritization after ultra-high-throughput screening (uHTS).
In an effort to investigate allostery on a large scale, an automated high-throughput agonist shift assay was developed for M1 PAM molecules. One thousand compounds were examined with an automated agonist shift assay, which featured cross-titrations of the PAMs and the orthosteric ligand ACH. The increased throughput for the agonist shift assay is the first demonstration of allostery measurements on this scale, which were analyzed in an automated manner to produce quantifiable measurements of allostery: alpha (cooperativity factor), beta (efficacy), tauB (direct agonist activity of the allosteric ligand), and KB (intrinsic binding affinity of the modulator) 10 ( Fig. 1 ).
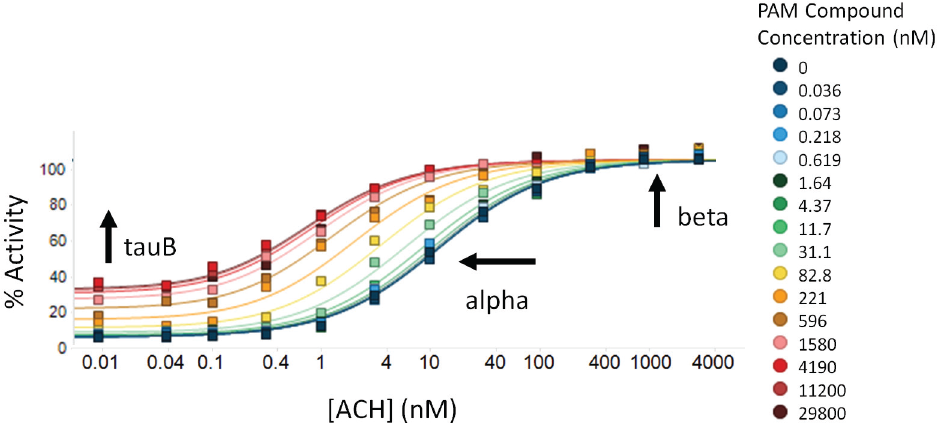
An example of the cross-titrations of positive allosteric modulator (PAM) compounds and acetylcholine (ACH) observed for M1. Increasing concentrations of the PAM compound shift the response curve up and to the left. The cross-titrations are globally fit to calculate alpha, tauB, and KB, producing the lines displayed in the graph. The color scale and concentrations displayed in this figure are held constant for all of the data shown in this publication.
Materials and Methods
Reagents
All chemicals (except in-house Merck & Co., Kenilworth, NJ, compounds) were obtained from Sigma-Aldrich (Gillingham, UK) unless otherwise noted. Cell culture reagents were purchased from Life Technologies (Carlsbad, CA). Growth media were made up of Dulbecco’s modified Eagle’s medium (DMEM) supplemented with 10% heat-inactivated fetal bovine serum (FBS), 25 mM HEPES, 1 mM Na Pyruvate, 0.1 mM Eagle′s Minimum Essential Medium Non-essential Amino Acid Solution (MEM NEAA), 1× penicillin/streptomycin, 0.25mg/mL Zeocin, and 1 mg/mL G418. Assay buffer comprised 1× Hank’s buffered saline solution (HBSS) (GE Healthcare, Little Chalfont, UK), 20 mM HEPES (Gibco, Waltham, MA), and 2.5 mM probenecid (Sigma-Aldrich). Calcium dye was prepared fresh each day with assay buffer and 8 µM Fluor 4 (Life Technologies), 0.08% Pluronic (Life Technologies), and 4% TR40 (Life Technologies). Stocks of 10 mM ACH (Sigma-Aldrich) were prepared in 75% DMSO (Sigma-Aldrich) and 25% H2O, stored at −20 °C, and thawed the day of the experiment. BQCA (1-(4-methoxybenzyl)-4-oxo-1,4-dihydroquinoline-3-carboxylic acid, benzyl quinolone carboxylic acid) (Sigma-Aldrich) was also prepared as 10-mM stocks in 75% DMSO and 25% H2O, stored at −20 °C, and thawed the day of the experiment. PAM compounds from the Merck & Co. collection were supplied dissolved in 75% DMSO and 25% H2O.
PAM Compound Plate Preparation
This procedure is based on the previously reported high-throughput agonist shift assay. 4 Cross-titrations of 12 agonist ACH concentrations versus 15 PAM concentrations were achieved using the HP D300 (Hewlett Packard, Palo Alto, CA). The plate map used for the cross-titrations allowed for five different PAM compound cross-titrations to be located on each 1536-well plate. The D300 is capable of backfilling with DMSO during dispense protocols, but it was found to be time limiting for this application. As a result, the PAM compound plates had the 75% DMSO, 25% H2O backfill volumes preplated into 1536-well untreated high base plates (Corning, Corning, NY) with the Acoustic Transfer System (ATS) (EDC Biosystems, Fremont, CA) and sealed (PlateLoc Thermal Microplate Sealer; Agilent Technologies, Wilmington, DE) the night before the assay began. The day of the assay, the plates containing the backfilled DMSO were unsealed by hand and loaded onto the robotic platform. Compound source plates were prepared ahead of time with a high and low concentration of each PAM compound (in this case, 10 mM and 33 µM) to adequately cover the PAM titration. A high and low concentration (10 mM and 13 µM) of agonist (ACH) was prepared fresh each day and located in designated positions on the robotic platform. The Biomek-FX (Beckman Coulter, Brea, CA) was used to load the D300 cassettes by loading the high and low concentrations of five PAM compounds from the compound source plates and the high and low concentrations of ACH for each assay plate. Two HP T8+ dispensing cassettes were required per plate, which were dispensed on two different D300 systems in an effort to speed up the plating process. A Multidrop Combi (Thermo Scientific, Waltham, MA) was used to add 6 µL assay buffer to the entire PAM compound plate after compound dispense to bring the source plate to final volume. Each source plate was used once. The compound dispense process maintains the compound identity and location as well as the starting and final concentrations to be paired with the data at the end of the assay. 4 The PAM compound dispense was the limiting factor for this process; the total dispense time for each PAM plate was 12 min, allowing for the preparation and subsequent screening of five plates per hour.
Automated Agonist Shift Assay
CHO-NFAT cells stably expressing the human M1 receptor, developed in-house, were plated in growth media at 3000 cells/well (8 µL of 3.75 × 10⁵ cells/mL per well) into black, cyclic olefin copolymer (COC) tissue culture–treated, clear-bottom, 1536-well plates (Corning) using a GNF bottle valve dispenser (GNF, San Diego, CA) and incubated overnight at 37 °C, 85% to 90% humidity, and 5% CO2 (Liconic, Mauren, Liechtenstein). The assay was initiated 20 h later by washing the cells twice with assay buffer, leaving 2 µL of volume and dispensing 4 µL calcium dye using the GNF Washer (GNF). Plates were incubated for 50 min at 37 °C, 85% to 90% humidity, and 5% CO2. Following the incubation, the assay plate was read on a FLIPR-Tetra (Molecular Devices, Sunnyvale, CA) using excitation filters of 470 to 495 nm and emission filters of 515 to 575 nm for 5 s. The 1536-well elastomeric head of the FLIPR-Tetra was used to transfer 2 µL of the PAM compound plate into the assay plate during the read. The elastomeric head was washed and sonicated in 50/50 DMSO/H2O after each transfer and dried at a vacuum station within the FLIPR-Tetra. The plate was imaged for 70 additional seconds. The final reported data for each well were the maximum/minimum or the ratio of the maximum peak signal normalized for the baseline signal, which was averaged for 5 s before agonist addition.
Data Analysis
Each plate was normalized and reported as percent activity using 30 µM ACH (100% activity) and 0 M ACH (0% activity) control wells as the points of reference. Plates were accepted or rejected based on the signal to background (greater than 2.5) and Z′ values (greater than 0.7) calculated using the reference controls. Accepted plates were visualized as individual titrations in Activity Base (IDBS, Guildford, UK), allowing for the exclusion of any outlying single data points. Accepted data points were processed with Prism GraphPad (version 7; GraphPad Software, La Jolla, CA) and Pipeline Pilot (version 9.0.1; Bovia, San Diego, CA) and visualized in Tibco Spotfire (version 5.51; Tibco, Palo Alto, CA). 11 The agonist concentration response curves produced by the cross-titrations were simultaneously fit using a general equation of allosterism described in detail in Zhang and Kavana. 12 In this situation, ACH produced a maximal response acting as a full agonist. As a result, the value of beta was restricted to 1, and the interpretation of alpha was as an overall cooperativity index instead of a coefficient of affinity. The value of KA was held constant at 42.67 µM, which was derived from an in-house membrane filtration binding assay for ACH binding to M1. The resulting global fits of cross-titrations of 12 ACH concentrations versus 15 PAM concentrations produced the allosteric parameters alpha, KB, and tauB for each PAM compound.
Results and Discussion
The automated agonist shift assay described here not only demonstrates shifts in potency but also assigns quantitative values to these properties, which allows for compound differentiation. The introduction of automation to agonist shift assays allows for the analysis of a large number of compounds, which can enable this information to drive compound or therapeutic decisions by highlighting trends corresponding to compound structure. Previously, compound allostery was investigated by performing titrations with a selected few concentrations of PAM compounds to ascertain if there were shifts in IP value. A more thorough treatment of the data is required because the complex interactions of the ligand will likely be overly simplified compared to the interaction that occurs dynamically in vivo. 12 Differentiation also enables empirical experimentation with compounds displaying differentiated allostery to determine which properties are more important for in vivo efficacy, safety, and so on.
While allosteric compounds have many potential therapeutic advantages, their binding is affected by orthosteric ligand binding in vivo and is dependent upon the concentration of the endogenous orthosteric ligand. Native concentrations of the orthosteric ligand are not always known for either the healthy or diseased state. Depending on the disease targeted, the orthosteric ligand concentration may be higher or lower than in healthy individuals, and it is essential to know and understand how the changes in orthosteric ligand concentration will affect the behavior of PAM compounds.
A general model of allosterism for M1 PAM compounds and the orthosteric ligand ACH is shown in Figure 1 . Increased concentrations of PAM compounds shift the percent activity observed leftward with increased alpha behavior and upward with increased tauB behavior. Beta behavior was constrained to 1 during the fitting process because the ACH signal was already maximal, and any changes to that side of the graph were considered artifacts. The concentrations of the PAM compounds as well as ACH were chosen to saturate at the tops and bottoms of both titrations. The global fitting algorithm 11 functioned best when the ACH titration had a clearly defined and saturated maximum, producing the lines shown in Figure 1 .
Automated high-throughput agonist shift assays are only valuable if they produce data as high quality as lower throughput assays. Miniaturization and automation of the M1 agonist shift assay was performed using well-understood control compounds, such as BQCA.
8
Titrations of BQCA at EC20 ACH were reproducible, independent of location on the assay plate, and comparable to lower throughput assays (
Suppl. Fig. S1
). Importantly, the reproducibility of the BQCA cross-titrations translated to reproducible allosteric parameter determination using the automated global fitting algorithm. During the high-throughput screening (HTS) campaign, control compound
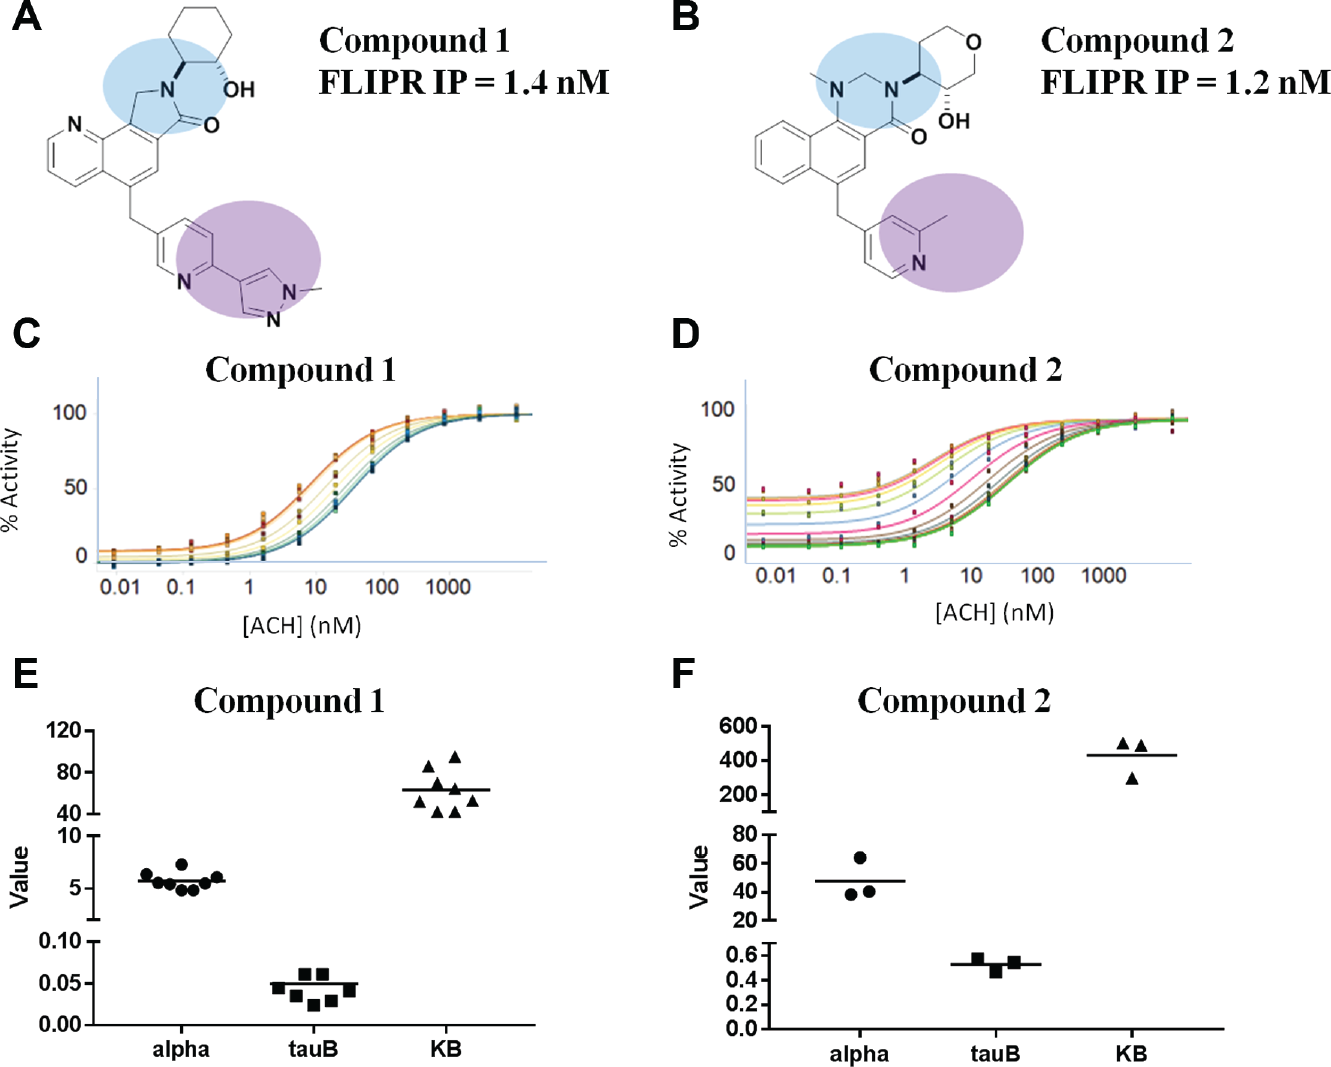
The structures of compounds
Over 1000 PAM compounds were examined using the automated agonist shift assay, all of which possess an IP in conventional PAM mode of <100 nM and were structurally representative of our PAM chemical matter. The allosteric parameters alpha, KB, and tauB were calculated for each PAM compound by globally fitting the cross-titrations of 15 PAM concentrations versus 12 ACH concentrations. The robotic platform ran 40 plates a day, with five PAM compounds located on each 1536-well assay plate. The entire 1000 PAM compound screen was completed in 1 week and had a median signal to background of 3.6 ± 0.21 and a median Z′ of 0.85 ± 0.039. The speed at which these data were collected suggests the possibility of including allostery measurements much earlier in the compound prioritization process.
A smaller set of 150 PAM compounds was screened in triplicate to assess how replicates of a large data set would behave, as an indicator of variability in the agonist shift results. Because each cross-titration is made up of 180 data points and fit as a collective set, slight variations in a few data points were anticipated to be absorbed into the fitting mechanism without perturbing the overall calculated result. Running the larger compound set in triplicate on different days, each day with freshly prepared reagents, pleasingly produced comparable results ( Fig. 3 ). The median signal to background for all 3 days was 3.4 ± 0.12 with a median Z′ of 0.85 ± 0.065. The high level of reproducibility observed with this automated agonist shift assay indicates that in the interest of throughput, one cross-titration for each PAM compound may be sufficient to categorically bucket the compounds based on their allosteric parameters. While increased replicates are always preferred, triplicate results could be prohibitive when screening larger collections due to the increased complexity of these assays. These data suggest that the additional replicates are not required to quantitatively or qualitatively assess receptor allostery. As with many automated assays, the goal would be to assess the allosteric properties of as many compounds as possible. If needed, high-priority compounds could be investigated later with replicate measurements to verify the results.
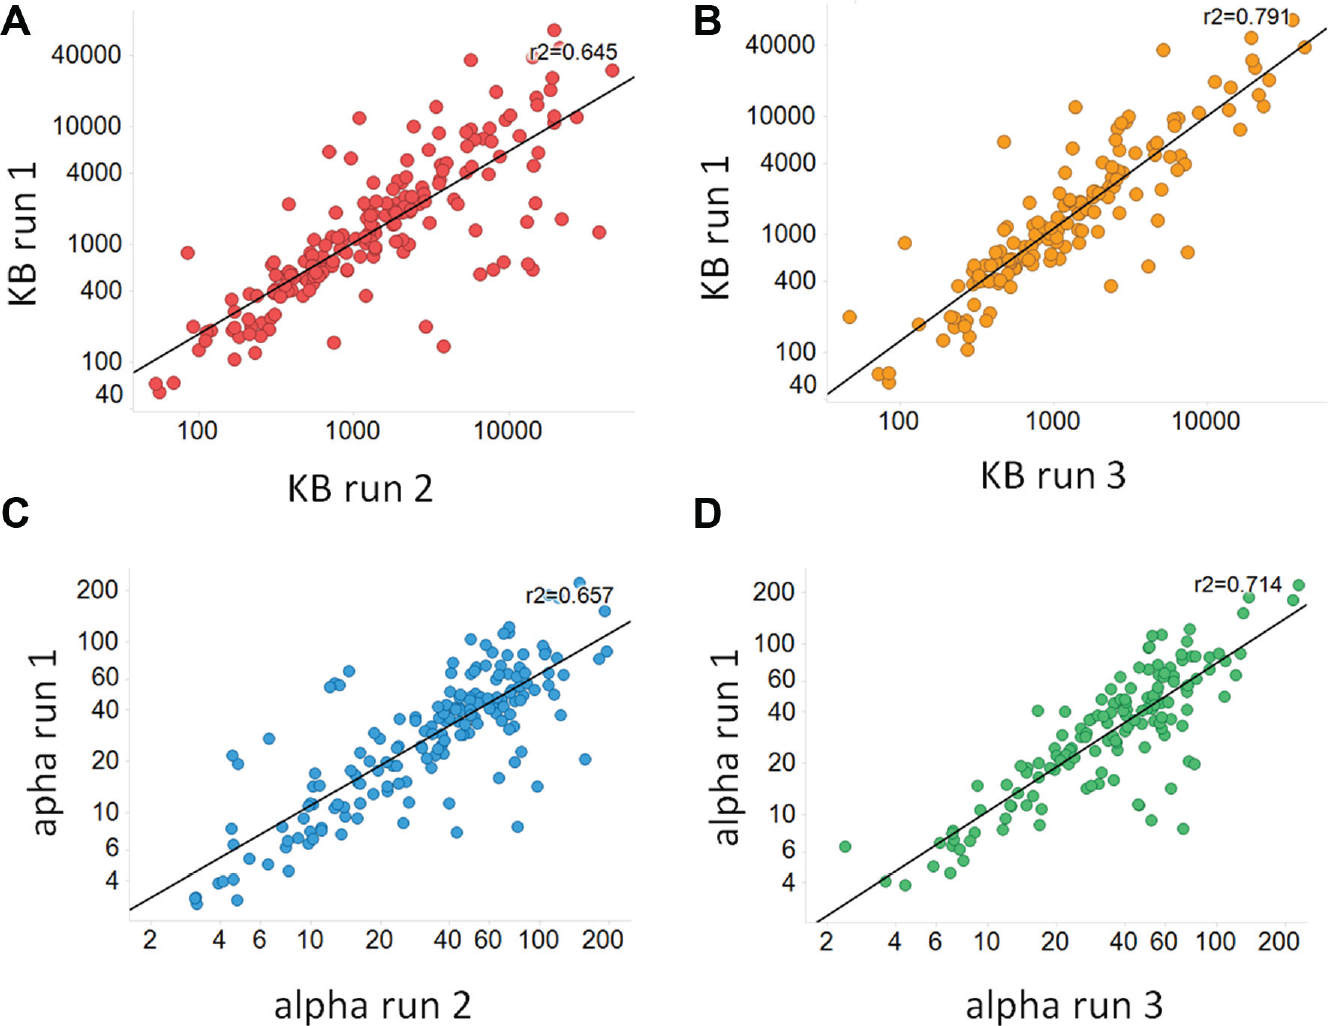
Automated agonist shift reproducibility. In total, 150 of the positive allosteric modulator (PAM) compounds were assayed in triplicate in the automated agonist shift assay on 3 different days. The calculated KB values for the three runs are compared in
Receptor occupancy of PAM compounds can be examined through the relationship of KB to alpha. 12 Figure 4 displays how this relationship was examined for the M1 PAM compounds. Increasing alpha values reflecting cooperativity between the PAM and the orthosteric ligand are observed from left to right on the plot, which is further demonstrated in the selected graphs ( Fig. 4A–C ). PAM compounds with strong effects on the unoccupied receptor display larger tauB values ( Fig. 4D vs. Fig. 4E ). By examining the allosteric parameters together in this way, a more robust understanding of how compounds interact with the receptor can be realized.
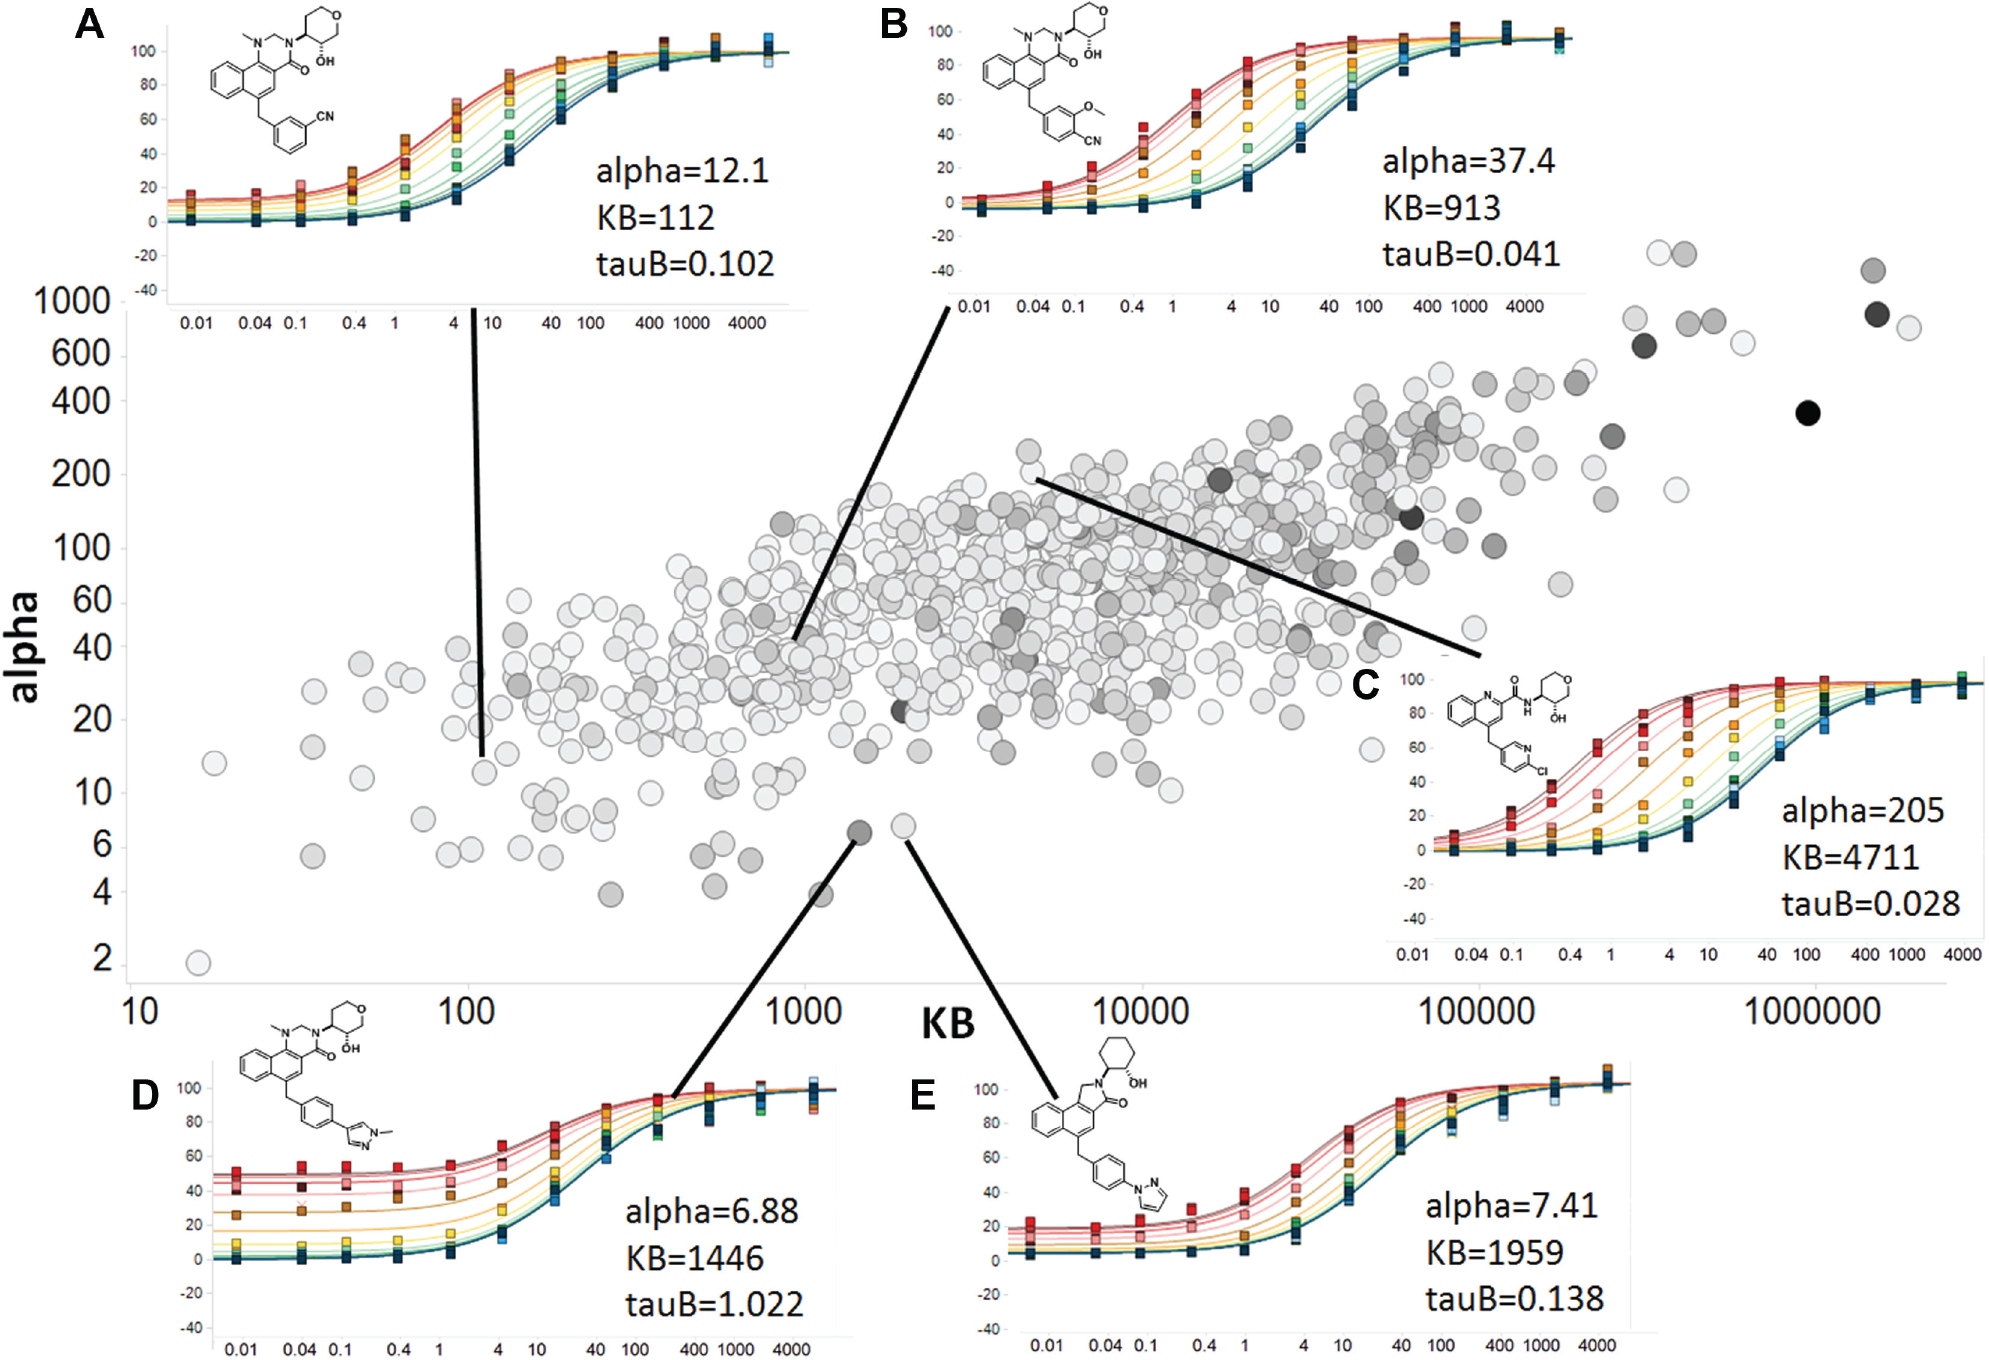
M1 Agonist shift results. Center: The allosteric parameters of the 1000 M1 positive allosteric modulator (PAM) compounds are examined with a plot of alpha vs. KB values, colored for the individual tauB value (0 to 2.6). The agonist shift results with the corresponding global fit curves are shown for some selected PAM compounds (
Compounds
Agonist shift assays can lead to a better understanding of the mode of activation (MOA) of PAM compounds by assessing compounds based on more than their functional inflection points. The ability to perform data-rich assays in an automated method will allow for the use of this type of data to enable earlier decisions during the discovery processes. The 1000 PAM compounds assessed here were screened in 1 week, indicating the ease of which this process could be applied to typical screening campaigns. This is the largest known data set of receptor allostery to date. Using the online HP D300 systems for the PAM compound and agonist dispense helped reduce the burden placed on compound management and, due to the low-volume dispense capabilities of the HP D300, consumed a small amount of each compound. While this agonist shift assay was investigating a GPCR, the automated technology could be applied to any system that would feature cross-titrations, such as enzyme kinetic studies investigating competitive/noncompetitive inhibitors. Introducing automation to advanced MOA studies, typically reserved for later stage investigations, increases the ability to make structure-activity relationship decisions based on more than just potency.
Footnotes
Acknowledgements
We thank Tony Kreamer for assistance with Spotfire figure generation.
Supplementary material is available online with this article.
Declaration of Conflicting Interests
The authors declared the following potential conflicts of interest with respect to the research, authorship, and/or publication of this article: Authors are employees of Merck & Co., Kenilworth, NJ, and potentially own stock and/or stock options in the company.
Funding
The authors received no financial support for the research, authorship, and/or publication of this article.
References
Supplementary Material
Please find the following supplemental material available below.
For Open Access articles published under a Creative Commons License, all supplemental material carries the same license as the article it is associated with.
For non-Open Access articles published, all supplemental material carries a non-exclusive license, and permission requests for re-use of supplemental material or any part of supplemental material shall be sent directly to the copyright owner as specified in the copyright notice associated with the article.