
Abstract
Drug-induced liver injury (DILI) and drug–drug interactions (DDIs) are concerns when developing safe and efficacious compounds. We have developed an automated multiplex assay to detect hepatotoxicity (i.e., ATP depletion) and metabolism (i.e., cytochrome P450 1A [CYP1A] and cytochrome P450 3A4 [CYP3A4] enzyme activity) in two-dimensional (2D) and three-dimensional (3D) cell cultures. HepaRG cells were cultured in our proprietary micromold plates and produced spheroids. HepaRG cells, in 2D or 3D, expressed liver-specific proteins throughout the culture period, although 3D cultures consistently exhibited higher albumin secretion and CYP1A/CYP3A4 enzyme activity than 2D cultures. Once the spheroid hepatic quality was assessed, 2D and 3D HepaRGs were challenged to a panel of DILI- and CYP-inducing compounds for 7 days. The 3D HepaRG model had a 70% sensitivity to liver toxins at 7 days, while the 2D model had a 60% sensitivity. In both the 2D and 3D HepaRG models, 83% of compounds were predicted to be CYP inducers after 7 days of compound exposure. Combined, our results demonstrate that an automated multiplexed liver spheroid system is a promising cell-based method to evaluate DILI and DDI for early-stage drug discovery.
Introduction
Drug-induced liver injury (DILI) and drug–drug interactions (DDIs) are concerns when developing safe and efficacious compounds. Each year, approximately 13.9–20 new cases of idiosyncratic DILIs occur per 100,000 persons.1–3 In the United States, DILI is associated with 11% of acute liver failure cases. 1 In fact, DILI is the leading cause for termination of drug development and withdrawal of approved drugs from the market. 4 It is estimated that 44.3%–87.9% of adult patients in the ICU and 75% of children in the NICU are exposed to a potential DDI. 5 Therefore, more predictive screening methodologies are required to reduce the incidences of DILI and DDIs.
Drug discovery has relied on in vitro and in vivo methods to evaluate compound safety, with recent incentives to focus on high-throughput, cost-effective measures like cell-based screening assays. The evolution of microtissue cell culture, where cells aggregate into three-dimensional (3D) biomimetic structures, has the potential to bridge the gap between traditional in vitro and in vivo compound screens. 6 3D spheroids have shown drug responses more similar to those of an in vivo model than the traditional two-dimensional (2D) cell culture, in both cancer therapeutic efficacy7–9 and hepatotoxicity.10–14 This is particularly important for limited cell models, such as primary human hepatocytes cultured in a 2D monolayer. Hepatocytes in monolayer cell culture rapidly dedifferentiate 15 and lose their morphology and functions, such as Phase I and II enzyme expression and albumin production. 12 Although 2D hepatocytes are the gold standard for xenobiotic metabolism and toxicity studies,16,17 3D HepaRG cells offer an alternative that overcomes the interdonor variability, restricted supply, and short culture lifetime of 2D primary human hepatocytes. HepaRG cells are a human cell line derived from a hepatocellular carcinoma that express functional liver markers, such as several cytochrome P450 (CYP) and Phase II enzymes, nuclear receptors, and membrane transporters.18,19 When used for cytochrome P450 3A4 (CYP3A4) induction studies, HepaRG cells were found to be an excellent surrogate for primary human hepatocytes. 20
Methods for creating the 3D tissues vary from using labor-intensive single-spheroid-per-well techniques to biomaterial-reliant approaches. 12 This study used a proprietary plate system that produced uniform, small-diameter spheroids in a high-throughput manner. In this system, multiple spheroids were cultured per well, which has provided the advantage of highly reproducible data in diabetic drug screening and oncology compound efficacy.21,22 However, in most systems, testing with multiple spheroids per well requires additional steps that can take extra resources, and are difficult to multiplex or automate.
Multiplexed assay systems to evaluate toxicity (i.e., ATP depletion) and metabolism (i.e., cytochrome P450 1A [CYP1A] and CYP3A4 activity) from a single well have been described previously. 23 Multiplexing can result in a reduction in experimental variability, reagent cost, and labor time. Larson et al. 23 developed a multiplexed assay in 2D hepatocytes proving that the system could predict CYP induction from known CYP1A and CYP3A4 inducers.
In this study, we combined a novel high-throughput multiplexed assay with 3D HepaRG spheroids to evaluate known DILI and DDI compounds. Compound metabolism and toxicity were evaluated with three assays—one viability assay and two CYP induction assays. The compounds were evaluated in a short- and long-term exposure model, where the cells were exposed to the drugs for 24 h, 3 days, and 7 days.
Materials and Methods
Reagents
Human NoSpin HepaRG cells (NSHPRG, lot HNS1003) were obtained from Biopredic International (Saint-Grégoire, France). The thawing and toxicity media (MH100, MHTAP, and MHPIT) were obtained from Triangle Research Labs (Durham, NC). The media were supplemented with 1% antibiotic/antimycotic (15240096, Thermo Fisher Scientific, Waltham, MA).
Amiodarone hydrochloride (A8423), β-napthoflavone (N3633), benzbromarone (B5774), dexamethasone (D4902), ketoconazole (K1003), olanzapine (O1141), omeprazole (O104), resorufin ethyl ether (E3763), rifampicin (R3501), rosiglitazone (R2408), salicylamide (860417), simvastatin (S6196), tamoxifen (T5648), tetracycline hydrochloride (T7660), ticlopidine hydrochloride (T6654), and troglitazone (T2573) were all purchased from Sigma-Aldrich (St. Louis, MO). DMSO (D128) was purchased from Thermo Fisher Scientific.
The Exocell Albuwell II Human Albumin enzyme-linked immunosorbent assay (ELISA) kit was purchased from Thermo Fisher Scientific.
The P450-Glo CYP3A4 Assay with Luciferin-IPA (V9001) and the CellTiter-Glo (CTG) 3D Cell Viability Assay (G9681) were obtained from Promega Corporation (Madison, WI). The P450-Glo CYP3A4 kits contained reconstitution buffer with esterase, Luciferin-IPA subtract, and Luciferin Detection Reagent. The CTG assay kit contained the CTG 3D Reagent.
Cell Preparation
HepaRG cells were thawed according to the instructions and seeded onto (1) collagen-coated 384-microwell plates (2712, Corning, Corning, NY) at 225,000 cells/cm2 for monolayer (2D) culture or (2) Likarda’s proprietary micromold plates at 445,000 cells/cm2 density for spheroid (3D) formation. A detailed scheme of cell culture in the micromolds is provided in our previous publications.17,18 Briefly, the micromold plate contains microwells, or divots, etched into the glass bottom. The cells settle into the bottom of the microwells and within 6 days, spheroids can be removed from the wells for further testing. Cell culture medium was changed every 2–3 days and replaced with toxicity medium (MHPIT). The cells were maintained at 37 °C and 5% CO2 with a water reservoir for humidity. 2D cultures were ready for test article exposure after 7 days in culture. 3D spheroids were fully formed after 6 days in culture, and were removed from the micromolds and transferred to petri dishes containing 1% serum medium for 24 h. Spheroids were then transferred to 384-microwell plates (781906, Greiner Bio-One, Kremsmunster, Austria) at approximately 50–70 spheroids per well to be used for test article exposure.
Automation and Instrumentation
An INTEGRA Biosciences Viaflo Assist and 16-channel Viaflo II electronic pipet (Hudson, NH) were used to seed single cells into 384-well plates for monolayer (2D) culture and change cell culture medium. A Hamilton Robotics STAR automated liquid handling workstation (Reno, NV) was used to seed 3D spheroids into 384-well plates, as well as prepare drug dilutions and dose test compounds, and perform the assay multiplex workflow in both 2D and 3D cultures. A BioTek Cytation 5 Cell Imaging Multi-Mode Reader (Winooski, VT) was used to measure absorbance, luminescence, and fluorescence readings on the assay plates.
Cell Characterization
Albumin production was measured using a microalbuminuria ELISA kit. The kit was used according to the manufacturer’s protocol. The test samples were collected from the cell culture medium of 2D and 3D cultures without test article (cells only), and samples were collected at 24 h, 3 days, and 7 days (n = 10). Samples were diluted 1:10 and an 8-point standard curve was prepared with the albumin standard solution provided. Absorbance was measured at 450 nm.
To analyze the protein distribution in cells grown in 2D monolayers and 3D spheroids, cells were immunofluorescently stained for albumin, CYP3A4, or multidrug resistance protein 2 (MRP2). Specifically, after fixation, 3D spheroids were immobilized by adherence onto poly-
Test Compounds
Compounds were selected according to the DILI category or CYP induction potential, with 10 compounds exhibiting hepatotoxicity, 2 compounds with no known hepatotoxicity, and 6 compounds with known CYP induction potential (
Assay Validation
Automated cell loading validation was conducted by running the viability (CTG) assay on 384-well plates loaded with single cells and 3D spheroids, as described above (n = 336 wells). The cells in the plates were cultured for 7 days prior to running the assay. The coefficient of variation (CV) was calculated according to the equation CV = StDev/Mean * 100.
Assay response and quality were determined by assessing the Z′ factor and signal window determinations of positive and negative controls for each assay and treatment type.21,25 Assay plates were prepared according to the method above for cell preparation and cultured for 7 days. For the viability assay, the positive control consisted of cells alone without test article, and the negative control was cells treated with lysis solution. For the CYP assays, the positive control wells were treated with 10 µM CYP1A and CYP3A4 inducers (i.e., omeprazole and rifampicin, respectively) and negative control wells were treated without CYP inducers for 24 h (n = 79 wells).
CYP3A4 Assay
Reagents for the P450-Glo assay (Promega) were prepared according to the manufacturer’s instructions. To perform the assay, 35 µL of supernatant was removed from each well of the cell- and test article–containing plate (i.e., 384-well, black plate) to ensure the wells did not overflow during the assay and to reduce the amount of assay reagents needed. Then 50 µL of Luciferin-IPA solution was added to each well. The plate was incubated at 37 °C for 60 min. Supernatant (30 µL) from each well was transferred to a fresh, white-walled, white-bottom 384-microwell plate. Luciferin Detection Reagent (30 µL) was added to each well and incubated at RT for 30 min. The luminescence was measured, using a 1 s integration time and autogain settings.
The P450-Glo signal was measured in relative luminescent units (RLUs). The data were blank corrected by subtracting the average of the no-cell background wells from that of the individual wells to obtain net values. The net values were divided by the CTG signal, in RLUs, from the same well to provide values normalized to the cell number. Signals from the vehicle-alone-treated cells are referred to as basal. Fold induction was calculated by dividing the treated wells by the basal wells.
The CYP3A4 fold induction values were plotted against the compound concentration, and a one-half hyperbola equation, Y = Emax*X/(EC50 + X), was fit to the ascending portion of the data set (Y = fold induction, Emax = maximum fold induction, X = inducer concentration, and EC50 = half maximal induction) using SigmaPlot software. 23
CYP1A Assay
The ethoxyresorufin-O-deethylase (EROD) assay for CYP1A detection was prepared by diluting the 2 mM 7-ethoxyresorufin and 3 M salicylamide stock (prepared in 100% DMSO) solutions in a toxicity culture medium (MHPIT) to final working concentrations of 2 µM and 3 mM, respectively. Salicylamide was used to inhibit secondary resorufin metabolism. To perform the assay, 25 µL of EROD solution was added to each well of the cell- and test article–containing plate, incubated at 37 °C for 50 min, and equilibrated to RT for 10 min, and then the fluorescence was measured (532 nm ex/582 nm em).
The EROD signal was measured in RFUs. CYP1A EC50, Emax, and potency rank order were calculated using the same methods as for CYP3A4.
Viability Measurement
CTG was used to measure the cell viability following the manufacturer’s instructions. In the cell- and test article–containing plate, 25 µL of CTG 3D Reagent was added to each well and then incubated at RT on an orbital shaker for 60 min. The luminescence was measured, using a 1 s integration time and autogain settings.
The CTG signal was measured in RLUs. The data were blank corrected by subtracting the average of the no-cell background wells from that of the individual wells to obtain net values. Signals from the vehicle-alone-treated cells are referred to as basal. The treated wells were normalized by dividing the treated well signal by the basal signal to generate a percent viability value.
Compound toxicity was determined by generating a dose–response curve from the CTG data. Half maximal effective concentrations (IC50) were calculated from a four-parameter logistic (4PL) curve fit (SigmaPlot). The margin of safety (MOS) ratio was calculated: MOS = IC50/Cmax. A 30-fold MOS threshold is an accepted cutoff between DILI-positive and -negative compounds.26,27 The MOS was plotted against the DILI severity rating, and a classification matrix was established to determine the true-positive and true-negative DILI compounds from the false-positive and false-negative results (
Multiplex
The multiplex workflow progressed through three assays sequentially, (1) P450-Glo, (2) EROD, and (3) CTG ( Fig. 1 ).
P450-Glo: In the black-walled, 384-microwell plate containing cells (termed “Plate 1” for tracking), 35 µL of medium was removed to reduce the total well volume to prepare the well for the next reagent addition. In Plate 1, 50 µL of Luciferin-IPA solution was add to each well. Then Plate 1 was incubated at 37 °C for 60 min. After Plate 1 finished the incubation step, 30 µL was removed from the wells and transferred to a white-wall, white-bottom 384-microwell plate (termed “Plate 2” for tracking). In Plate 2, 30 µL of Luciferin Detection Reagent was added to each well, the plate was incubated at RT for 30 min, and the CYP3A4 luminescence signal was recorded.
EROD: In Plate 1, 25 µL of EROD solution was added to each well and the plate was incubated at 37 °C for 60 min and equilibrated to RT for 10 min, and then the CYP1A fluorescent signal was recorded.
CTG: In Plate 1, 25 µL of CTG 3D Reagent was added to each well and then incubated at RT on an orbital shaker for 60 min. The CTG luminescent signal was recorded.
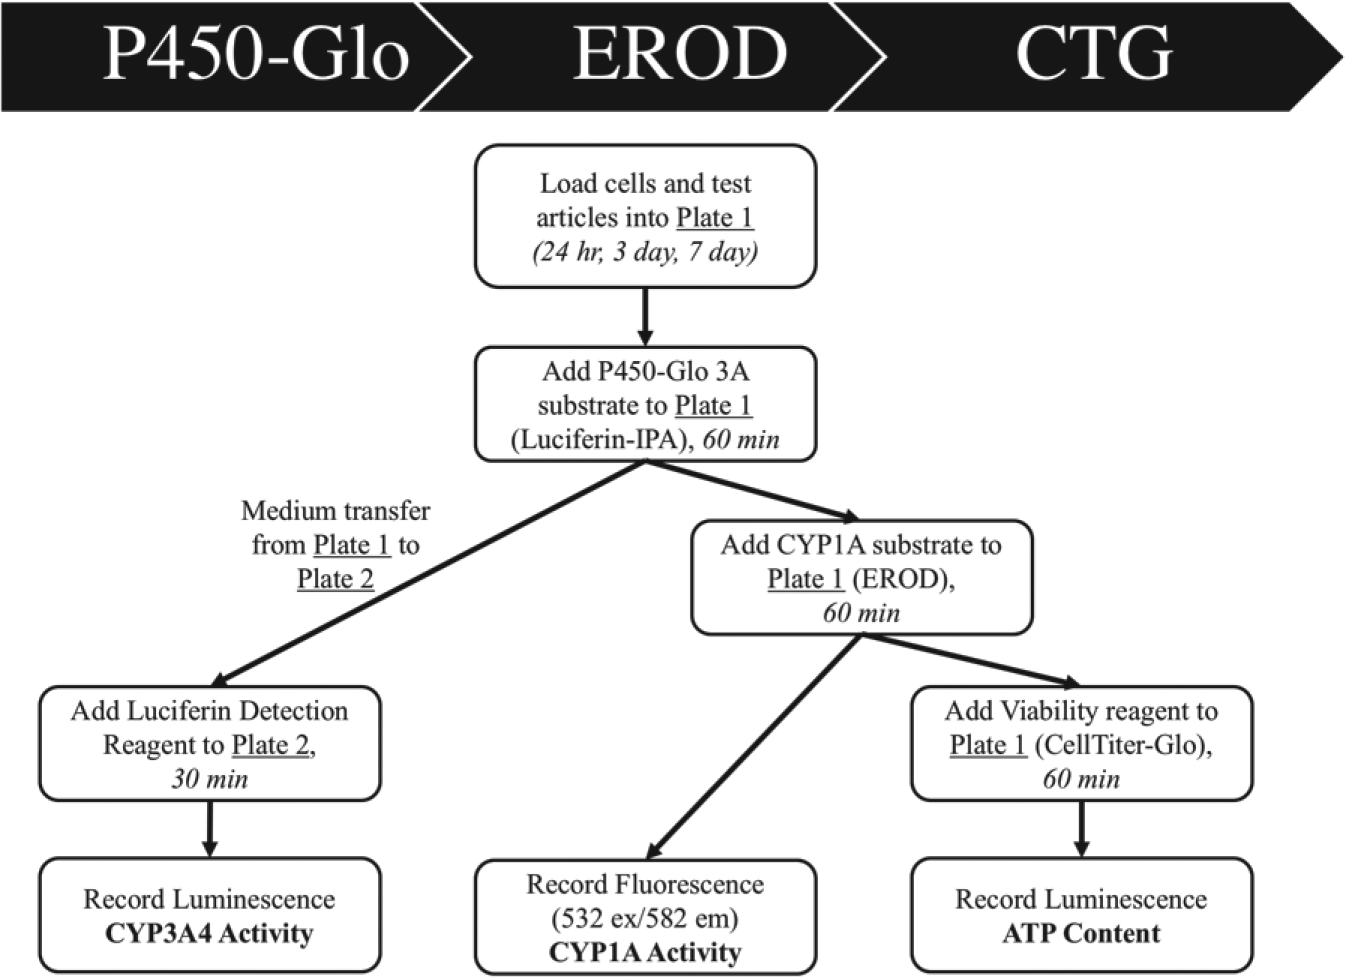
Multiplex protocol. The multiplex assays were performed with an automated liquid handling system and were executed at 24 h, 3 day, and 7 day time points (n = 4). Viability (ATP content, Promega CTG) and liver enzyme assays (CYP3A4, Promega P450-Glo Luciferin-IPA; CYP1A; EROD assay) were included in the multiplex.
Statistical Analysis
Albumin ELISA and basal CYP3A4 and CYP1A results were analyzed with a one-way analysis of variance (ANOVA) and Dunn’s post hoc test with statistical significance established at p < 0.05.
Results
2D and 3D Characterization
2D HepaRG cells maintained the recommended confluence and morphology during the 7 days of culture ( Fig. 2 ). 3D HepaRG cell spheroids remained compactly aggregated over the 7 days of culture with minor attachment to the culture surface ( Fig. 2 ). The spheroids had average diameters of 99.9 ± 21.6 µm and 89.3 ± 24.9 µm at 24 h and 7 days of culture, respectively.
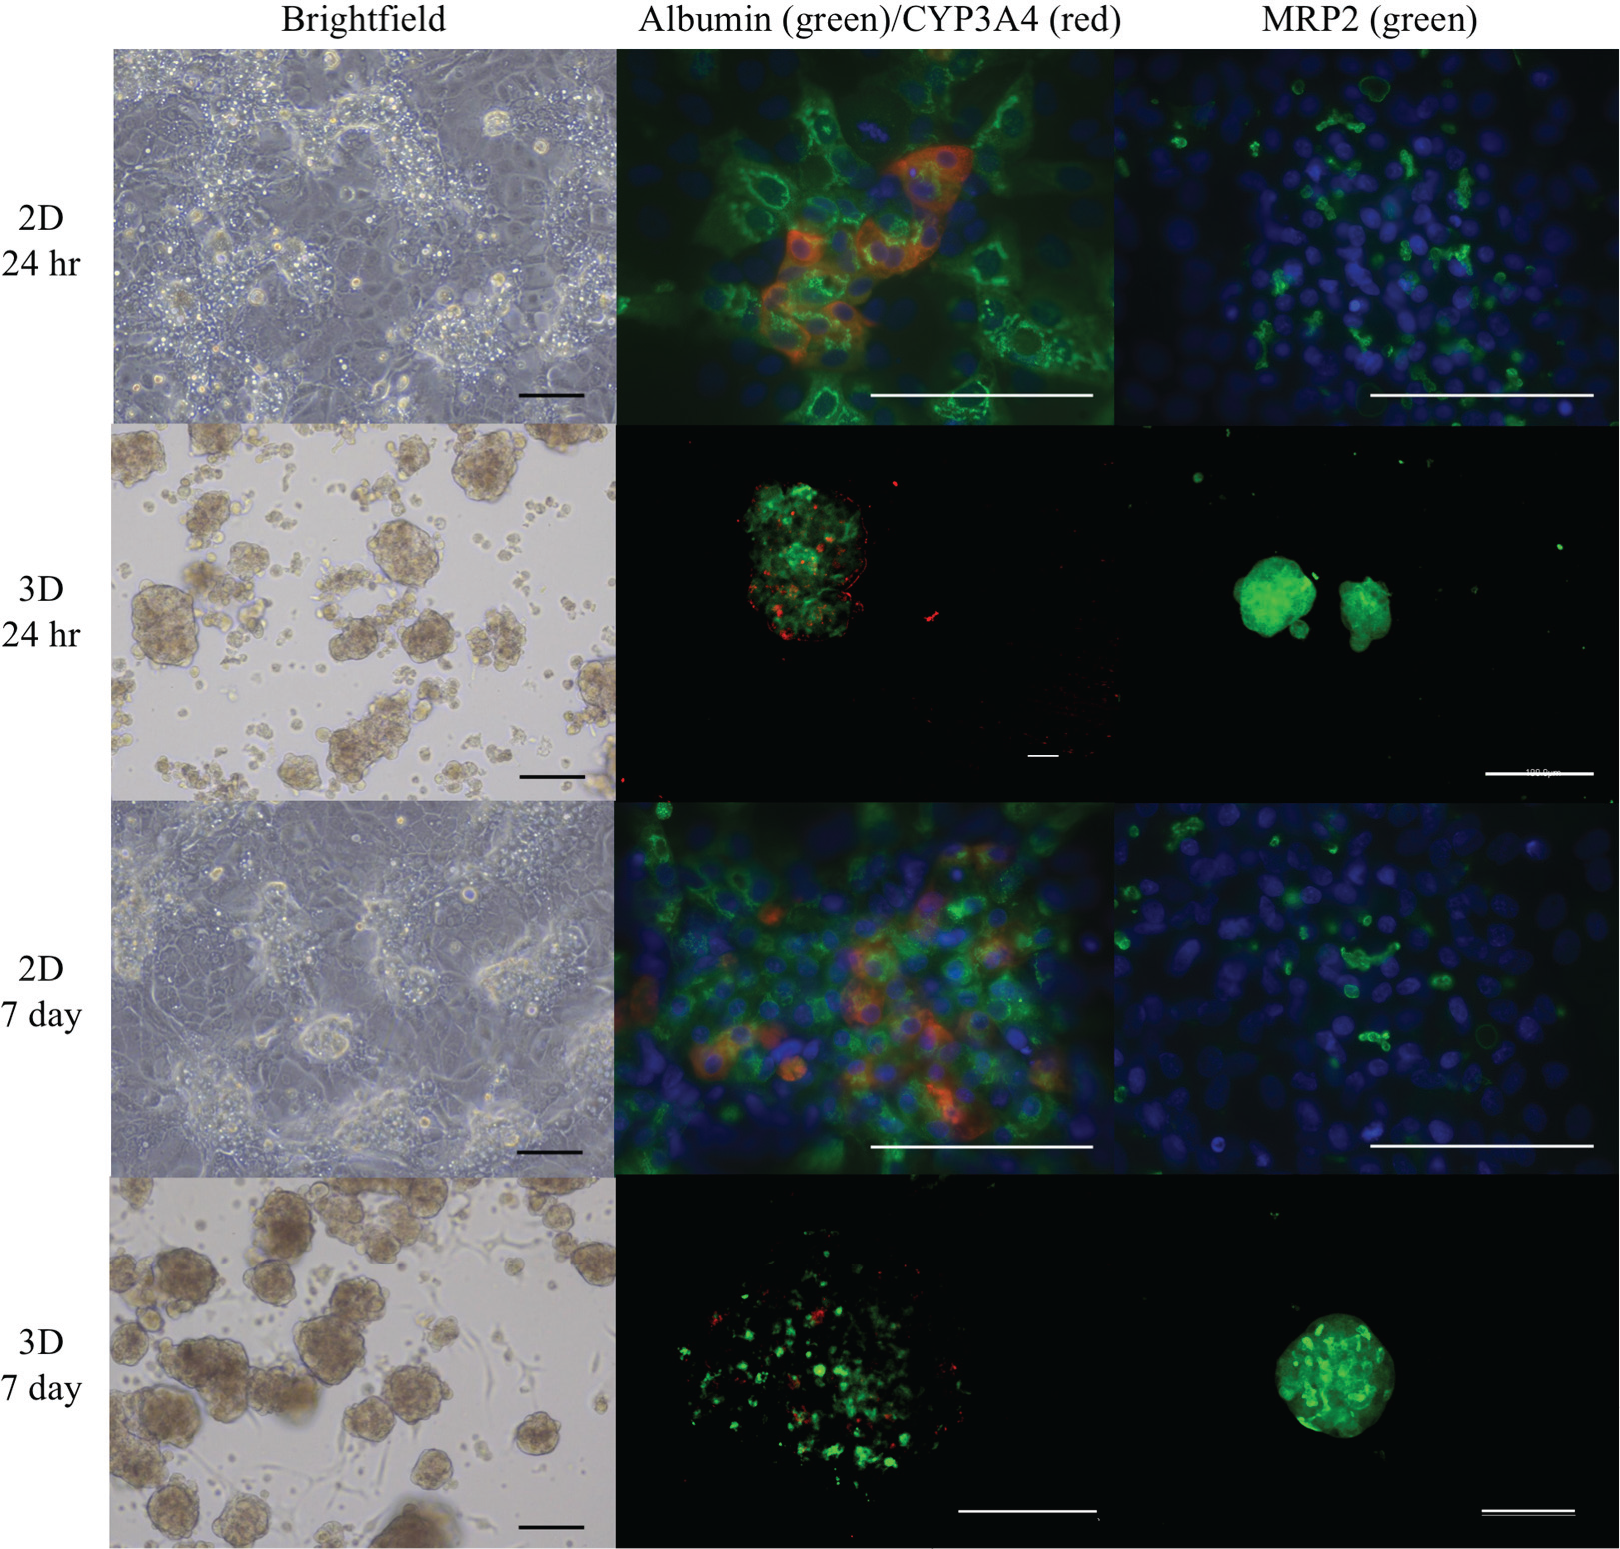
Cell morphology and functional markers. HepaRG cells were cultured in the micromold plates and produced compact spheroids. Photomicrographs (left column) illustrate cell morphology and immunostaining for liver-specific markers (albumin = Alb [green], CYP3A4 [red], and MRP2 [green]). The nuclear stain was DAPI (blue). Scale bar represents 100 µm.
Immunostaining for liver-specific proteins revealed that the Phase I enzyme, CYP3A4, and albumin were present in 2D and 3D cultures at early- and late-stage culture times. Albumin was more prevalent throughout the cell mass and was consistently expressed over time, while CYP3A4 was present in a small fraction of the cells and diminished with culture time ( Fig. 2 ). Hepatobiliary drug transporter, MRP2, was present in 2D and 3D cultures at early and late culture times, indicating the presence of functional bile canaliculi ( Fig. 2 ).
The HepaRG cell function was assessed by albumin production ( Fig. 3 ). Albumin secretion was significantly affected by culture time and cell model. 2D HepaRG cultures produced 16-fold more albumin at 24 h than at 7 days (n.s.), and 3D HepaRGs exhibited an inverse response with four orders of magnitude more production at 7 days than 24 h (p ≤ 0.001). After 24 h of culture, 2D HepaRGs produced four orders of magnitude more albumin than 3D HepaRGs (p ≤ 0.001). After 7 days of culture, 3D HepaRGs produced 19-fold more albumin than 2D HepaRGs (n.s.).
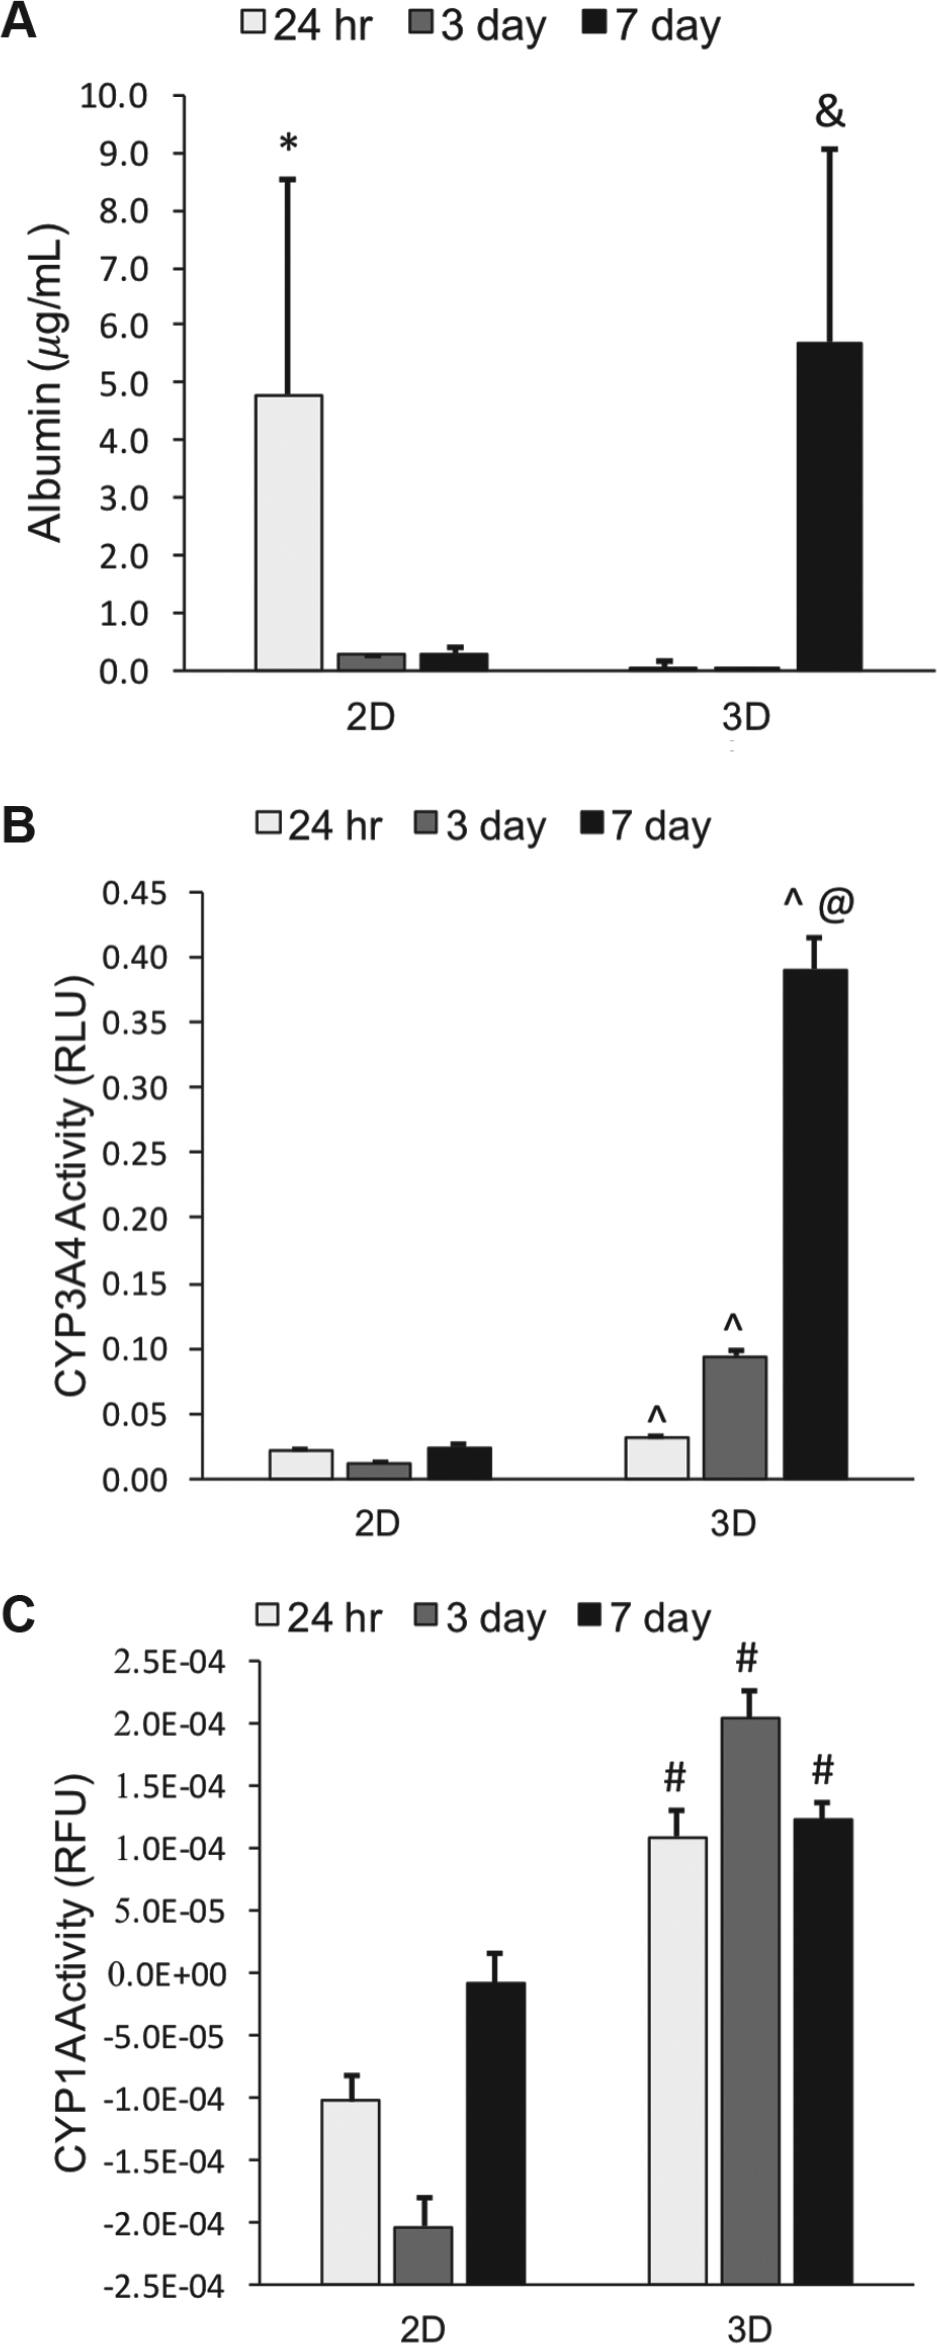
3D HepaRG cells expressed improved liver-specific functions (i.e., albumin secretion, CYP3A4, and CYP1A activity) compared with 2D cultures in prolonged culture experiments (i.e., 7 days). (
Cellular function was also assessed by evaluating the basal CYP activity levels using the P450-Glo and EROD assays ( Fig. 3 ). 3D cell models consistently possessed more active CYP enzymes, CYP3A4 and CYP1A, than 2D cultures. CYP3A4 activity levels for 3D cells were 38%, 649%, and 1502% greater than those for 2D cultures, at 24 h, 3 days, and 7 days, respectively (p ≤ 0.05). Cell culture time also enhanced CYP3A4 expression, with a 12-fold increase in activity from 24 h to 7 days in the 3D model (p ≤ 0.001). CYP1A activities for 3D cells were 142%, 872%, and 54% greater than fro 2D cultures, at 24 h, 3 days, and 7 days, respectively (p ≤ 0.001).
Assay Validation
A CV of 4%–10% is expected for adequate automated reagent dispensing.
23
The CV values for 2D and 3D loading were 11.2% and 13.2%, respectively. A Z′ factor of ≥0.4 is considered an excellent assay, and a signal window of ≥2 indicates a quality response to the drug compound.
25
The Z′ factor and signal window results for each assay were greater than 0.4 and 2, respectively (
CYP Induction
To evaluate the induction potential of drug compounds, the EC50 and Emax values were calculated from dose–response curves from six known CYP inducers (
A 1.5-fold induction cutoff (i.e., Emax ≥ 1.5 indicates an inducer) was used to predict a noninducer and inducer ( Table 1 ). In the 2D model, 100% of compounds at 24 h of exposure time and 83% of compounds at 7 days of exposure time were positive for induction. The compound that failed to reach the cutoff was rifampicin at 7 days. In the 3D model, 33% of compounds at 24 h of exposure time and 83% of compounds at 7 days of exposure time were predicted as CYP inducers. Both CYP1A compounds were classified as inducers, excluding β-napthoflavone at 24 h. Of the CYP3A4 inducers, rifampicin at 24 h and 7 days and troglita zone and rosiglitazone at 7 days were classified as inducers. Emax values for the CYP1A assay were, on average, 30 times higher than the CYP3A4 assay values. Additionally, the CYP3A4 and CYP1A Emax values from the 2D cell model were, on average, three times higher than those from the 3D cell model.
CYP Induction.
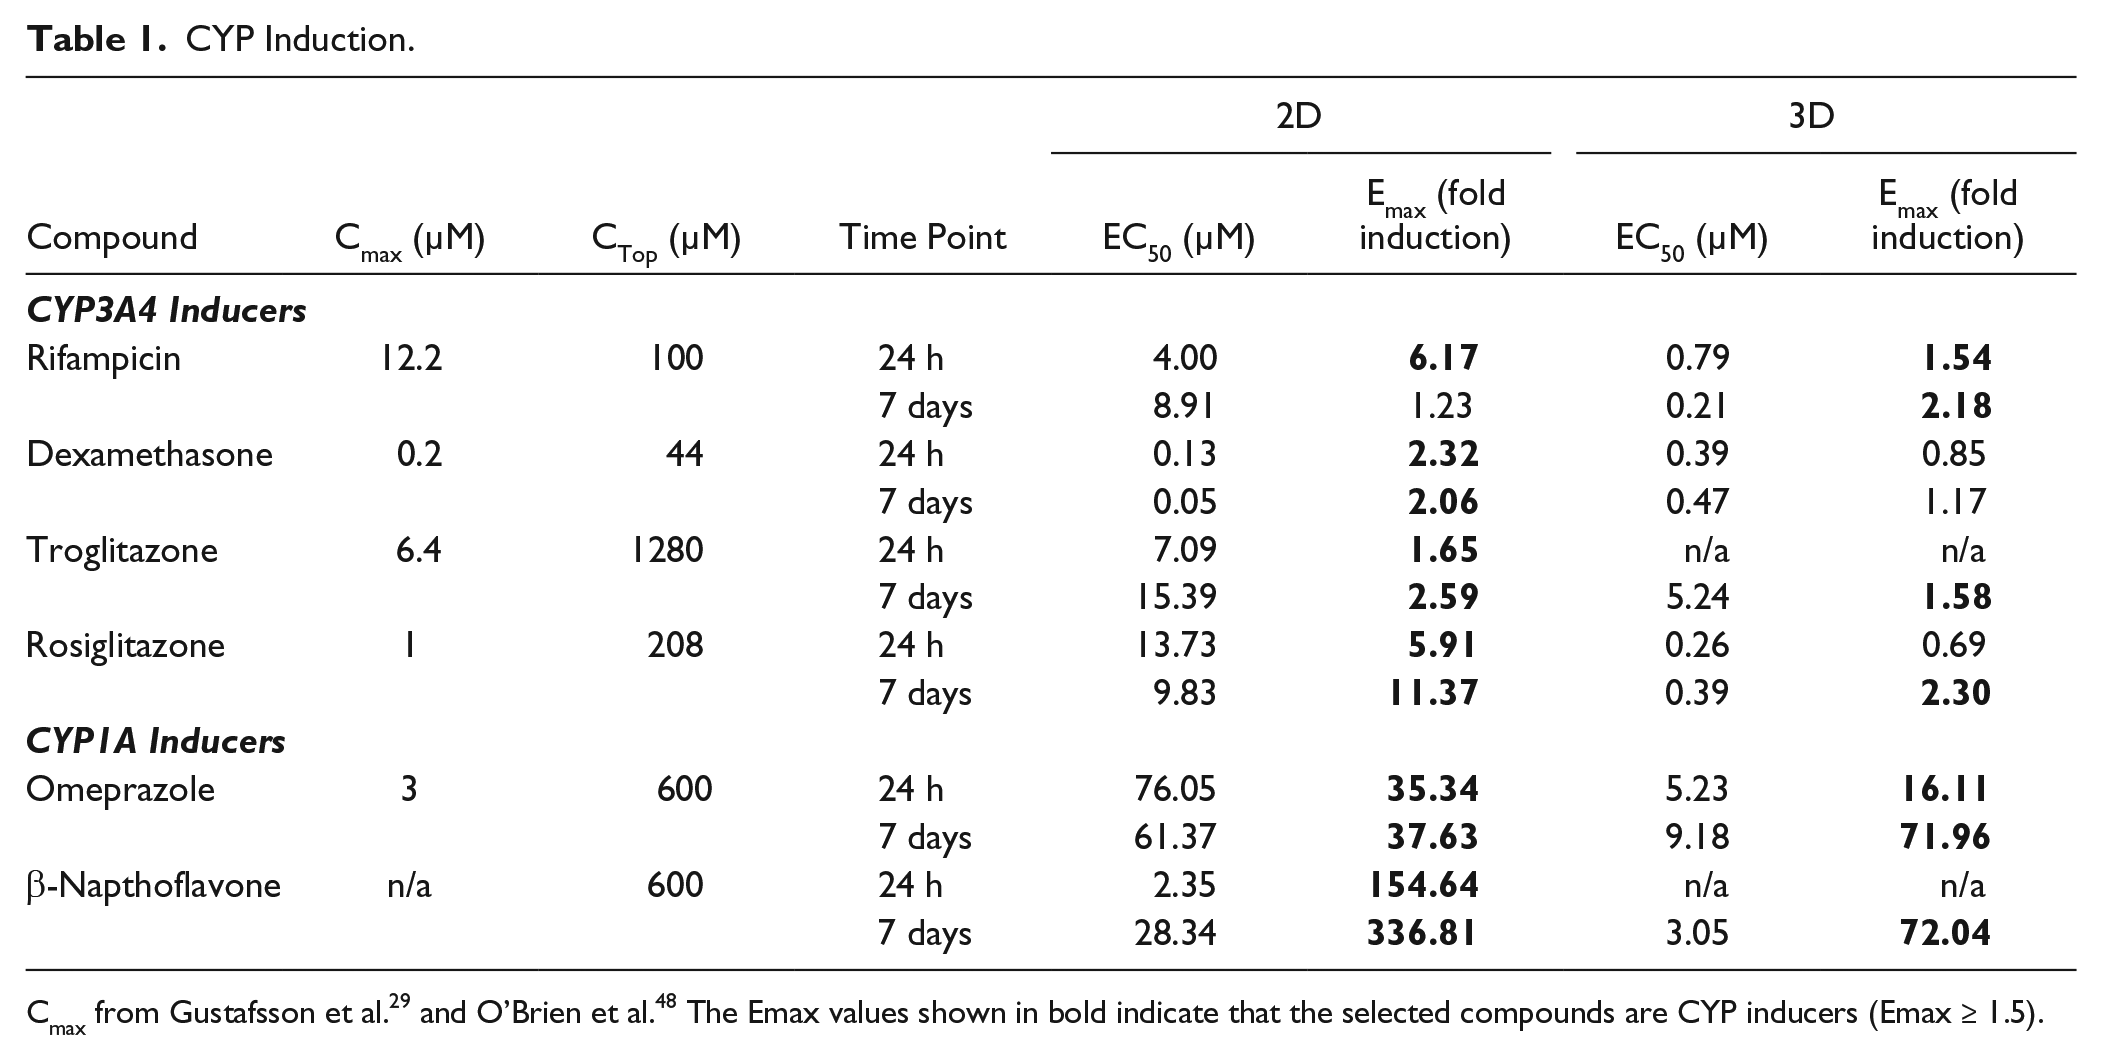
The EC50 values were arranged to create rank orders of potency, with low EC50 values being the most potent (
Toxicity Assessment
To evaluate the compound toxicity and DILI probability, IC50 and MOS values were calculated from testing known DILI-positive and -negative compounds (
Table 2
). The IC50 values were generated from a 4PL curve fit to the dose–response curve. Dose–response curves for all compounds are presented in
Hepatotoxicity Results.
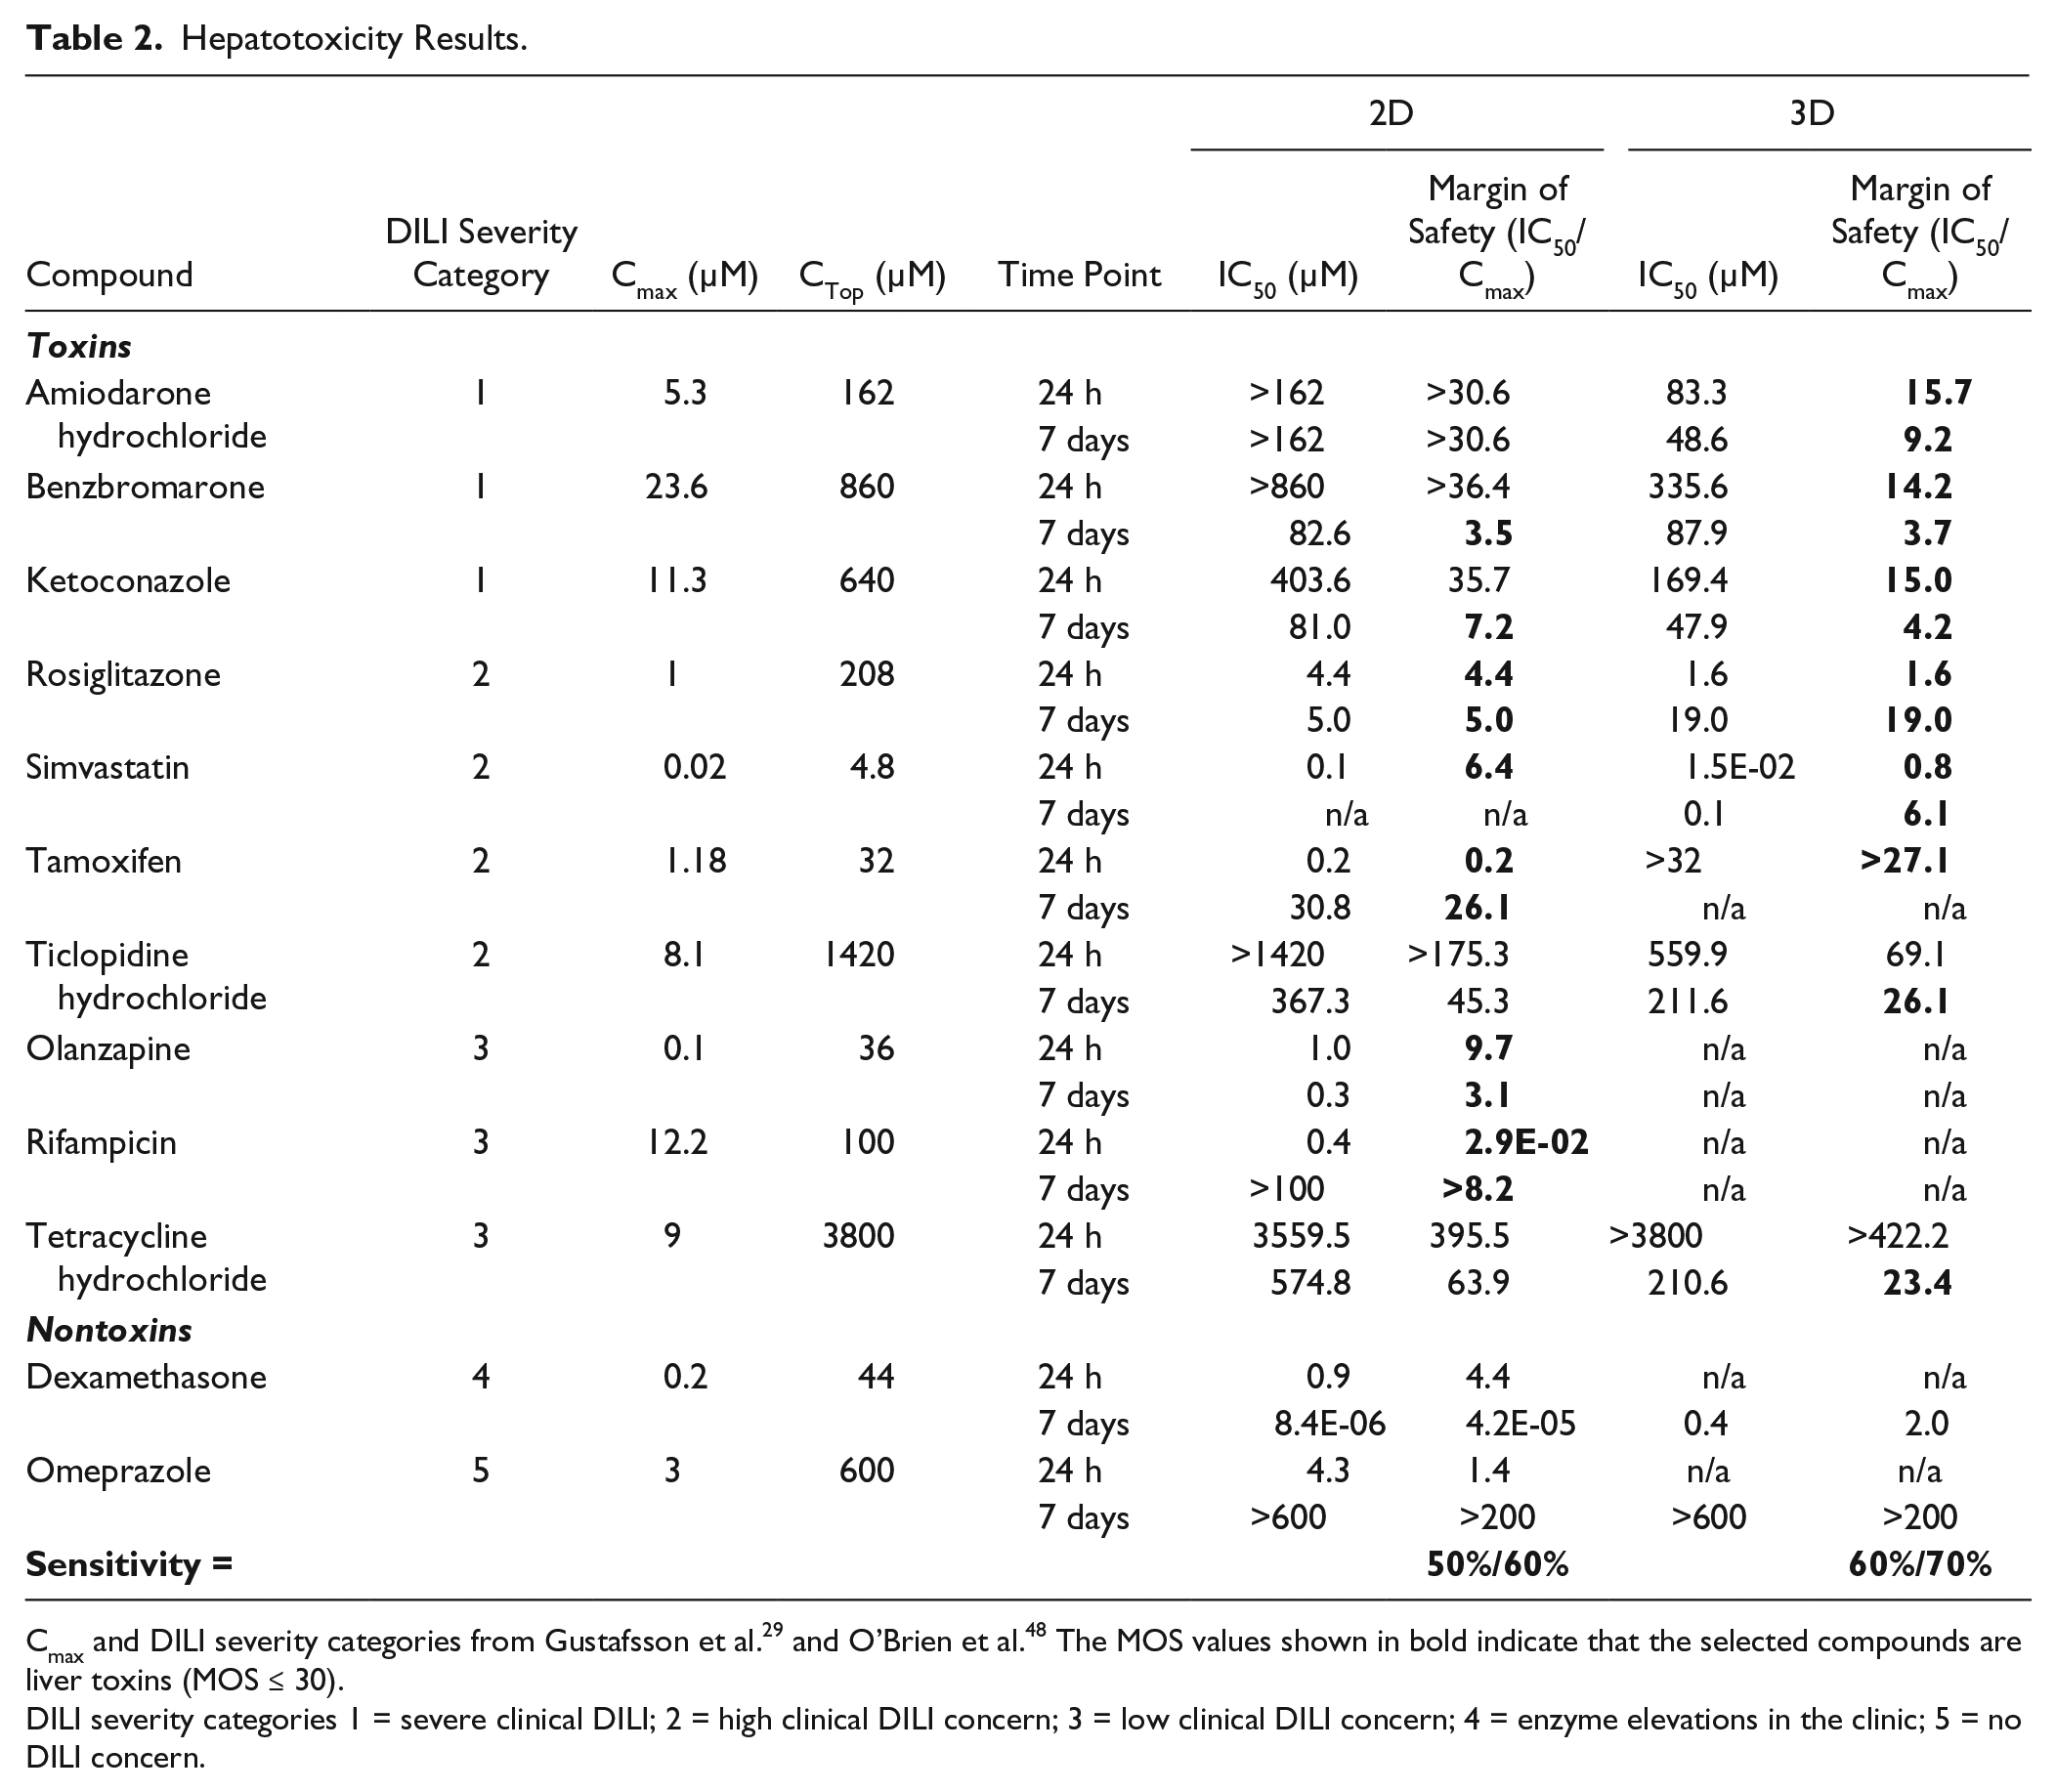
Cmax and DILI severity categories from Gustafsson et al. 29 and O’Brien et al. 48 The MOS values shown in bold indicate that the selected compounds are liver toxins (MOS ≤ 30).
DILI severity categories 1 = severe clinical DILI; 2 = high clinical DILI concern; 3 = low clinical DILI concern; 4 = enzyme elevations in the clinic; 5 = no DILI concern.
The percent of correctly identified hepatotoxins (i.e., sensitivity) was calculated for each cell model and time point ( Table 2 ). The 3D HepaRG model had a 60%–70% sensitivity at 24 h and 7 days, while the 2D model had a 50%–60% sensitivity. Of the most toxic compounds (i.e., DILI severity = 1–2), the 3D model correctly identified 86% of those compounds, while the 2D model only identified 57%. Longer exposure times increased the 2D model’s ability to detect the most toxic compounds, with benzbromarone and ketoconazole identified as toxins after 7 days, while the 3D model identified the toxins as early as 24 h. The 3D model could not detect tamoxifen as a toxin, but the 2D model did at both 24 h and 7 days.
Of the non-DILI compounds (i.e., DILI severity = 4–5), dexamethasone never fell in the true negative category for either 2D or 3D, while omeprazole was predicted to be a nontoxic compound only after longer-term exposure.
Discussion
We have demonstrated that compact 3D HepaRG cellular spheroids of relatively uniform size and shape can be created in a high-throughput manner. The spheroids exhibited superior albumin production, CYP activity, and the presence of liver-specific proteins compared with the 2D cultures. Although 3D cell cultures initially demonstrated lower albumin secretion, the cells recovered and produced more albumin than the same cells in 2D culture at a week in culture. Similarly, basal CYP1A and CYP3A4 activities were significantly higher in 3D cultures than in 2D ones.
When we examined liver-specific immunostaining (e.g., albumin, CYP3A4, and MRP2), all proteins were expressed to some degree in 2D and 3D cultures. When comparing the two CYP3A4 characterization methods, CYP3A4 immunostaining and CYP3A4 enzyme activity (i.e., P450-Glo), spheroids appeared to exhibit greater levels of enzyme activity than immunostaining. Although immunostaining provides spatial protein distribution in the monolayer or spheroid, the CYP3A4 enzyme activity data are both quantitative and validated and are ultimately the more reliable measure of CYP3A4. In summary, the albumin production and CYP enzyme activity data suggest that the 3D microenvironment may develop and preserve normal cellular function, making a 3D model ideal for chronic drug screening.
Hepatotoxicity and DDIs (i.e., CYP induction) were evaluated using an automated multiplex assay. Validation of the automation reagent dispensing, assays, and cell model response to drug compounds was largely positive, indicating accurate pharmacological measurements. The CV for 3D spheroid dispensing fell slightly outside of the accepted range, but the complex fluid dynamics of the spheroid solution could account for this deviation. The assays passed statistical validation requirements for assay response and quality (i.e., Z′ factor and signal window). This was in spite of the fact that the spheroid diameters showed greater variability than had been measured with other cell types using the same micromold process to create the spheroids. Overall, we demonstrated that our high-throughput multiplex assay using 3D spheroids passed validation requirements for use in early-phase drug discovery.
To evaluate our 3D spheroid model and multiplex assay, we challenged our cells with a library of known hepatotoxins and CYP-inducing compounds. The CYP induction results revealed that the 2D and 3D HepaRG cells were responsive to a majority of CYP-inducing compounds, and thus they were metabolically competent. Although the 3D cells exhibited a higher basal level of enzyme activity, as demonstrated in the characterization portion of the experiment, the cells did not respond to the CYP-inducing compounds as strongly as the 2D model cells. Additional analysis of upstream processes that mediate CYP induction, including transcriptional gene activation via nuclear receptors (i.e., pregnane X receptor [PXR] and aryl hydrocarbon receptor [AhR]) and CYP mRNA expression, could reveal the cause for the differences in 2D- and 3D-induced enzyme activity. mRNA levels of CYP enzymes, CYP1A2 and CYP3A4, have been shown to increase in 3D HepaRG culture after exposure to inducers. 30 Further assay validation may require gene expression in addition to the enzyme activity measured with the P450-Glo assay. Additional analysis could include assessing compound CYP induction potential, for example, the relative induction score (RIS) where EC50 and Emax values are utilized, although these methods often require clinical data (e.g., plasma concentration of inducer corrected for protein binding), which may not be available for all compounds. 31 Thus, we have shown that CYP-inducing compounds can be predicted using our 3D model in an automated multiplexed assay system, although more optimization and validation may be required to improve sensitivity.
Results from the hepatotoxicity classification portion of the multiplex assay revealed that HepaRG cells detected liver toxins in 2D and 3D cell culture formats, with greater sensitivity in the 3D model. Not only did the 3D model predict liver toxins, but it also preferentially predicted the more toxic compounds with the highest DILI severity rating. The reason for the improved sensitivity of the 3D model may be due to the improved liver-specific functionality of the cells. 2D monolayer cell culture substrates (e.g., flat, hard plastic, or glass) lack a native cellular microenvironment; instead, 3D cell culture allows the cells to form physiological architecture, provide mechanical and biochemical signals, and maintain cell–cell communication. 6 We obtained an acceptable sensitivity measurement with the 10 DILI-positive compounds tested, but could not calculate specificity from the 2 DILI-negative compounds tested. Future work may include testing our cell and assay system with more DILI-positive and -negative compounds, although the number of compounds tested is on par with other research in this area, where an average of eight compounds are tested per experiment.18,19,24,26,32–38
Interlaboratory comparison between the few hepatotoxicity studies conducted on 3D HepaRGs and 3D primary hepatocytes revealed similarities and differences in the reported IC50 values ( Table 3 ). While the reported IC50 values for tetracycline were similar in the 3D HepaRG studies, the amiodarone and rosiglitazone results varied, with our 3D HepaRG cells responding more sensitively to the liver toxins by one to two orders of magnitude than those of Mueller et al. 36 and Gunness et al. 33 The differing IC50 values for rosiglitazone and amiodarone may be due to the spheroid generation method (e.g., hanging drop method, U-bottom, additive manufacturing, and biomaterial scaffolding), spheroid maturity, cell culture conditions, and viability endpoint measurement (e.g., ATP depletion and albumin production). As 3D cell culture develops, standard practices are necessary to reduce interlaboratory variability and produce predictive data for drug development.
Interlaboratory IC50 Comparison.
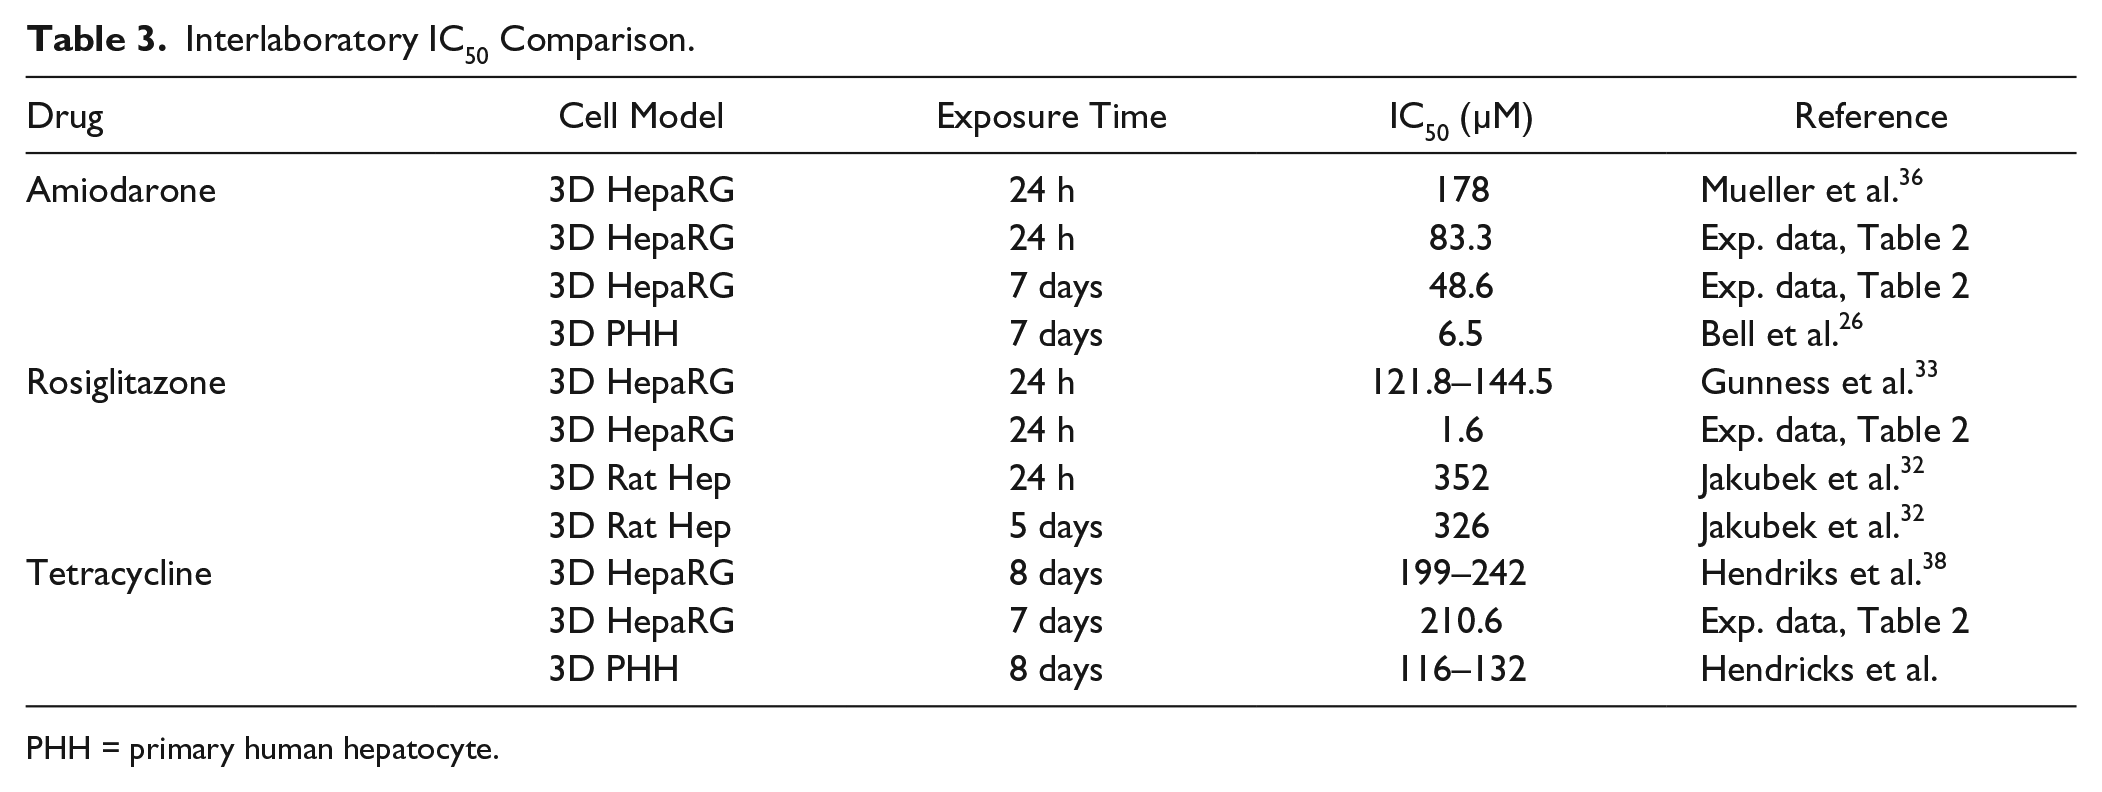
PHH = primary human hepatocyte.
When analyzing the individual compound effects on the 2D and 3D HepaRG cultures, it is important to understand that different cell systems respond slightly differently to liver toxins, dependent on the compound toxicity mechanism. Although primary human hepatocytes, in 2D and 3D, are the gold standard for testing several mechanisms of hepatotoxicity (e.g., cholestasis, steatosis, and carcinogenesis), 39 HepaRG cells can also be utilized for various toxicity and mechanistic testing applications, including steatosis,40,41 phospholipidosis, 40 cholestasis, 42 genotoxicity, 43 and mitochondrial dysfunction. 44 The compounds evaluated in this experiment are associated with steatosis (i.e., amiodarone and tamoxifen), mitochondrial dysfunction (i.e., amiodarone, rosiglitazone, benzbromarone, and tetracycline), and cholestasis (i.e., rifampicin). Both the 2D and 3D HepaRG models predicted toxins associated with steatosis and mitochondrial dysfunction, while only the 2D HepaRG model predicted cholestatic toxins. Future testing could include mechanistic evaluation of more compounds from each injury category, including genotoxicity compounds.
The 3D HepaRG cells maintained liver-specific functions in long-term culture, which would make them ideal for a chronic toxicity and metabolism screen. Bell et al. 26 reported greater sensitivity to DILI compounds by increasing the test article exposure time in a 3D hepatocyte model. The delayed reaction to drug compounds in vitro mimics the chronic presentation of DILI in vivo. 45 This presents a paradigm shift in in vitro hepatotoxicity screening, where the gold standard has been short-term toxicity screens, with 24–48 h drug exposures. Not only did the 3D spheroids maintain liver-specific functions longer than the 2D cultures, but also DILI “hits” occurred more often in chronic testing.
Future directions for assay optimization include incorporating more assays into the automated multiplex, using other cell types, tailoring the model to reflect a specific type of liver injury, and refining the data analysis method to better predict in vivo response. We included the lactate dehydrogenase assay (LDH) as another hepatotoxicity assay in our multiplex, but the data were not consistent and the ATP data (CTG) were superior. A combination of viability assays has been shown to improve the ability to predict DILI compounds, including glutathione content, caspase 3/7 activity, lipid accumulation, and reactive oxygen species (ROS) formation.24,46 With the addition of more assays, data analysis methods could include multiparametric analysis of multiple data sets to develop a predictive cutoff (e.g., receiver operating characteristic [ROC] curve). 24 Alternatively, using other hepatic cell lines might improve DILI and DDI prediction. Multiple hepatic cell types are available, including primary human hepatocytes, hepatoma-derived cell lines (i.e., HEPG2), immortalized hepatocytes (i.e., HepatoCells, Upcyte, and Fa2N-4), and induced pluripotent cell (iPSC) (i.e., iCell Hepatocytes). Additionally, the cell culture model can be tuned to address a specific type of liver injury; for instance, a cholestatic model can be induced by including bile acids in the cell culture medium, or a liver fibrosis model by creating a 3D spheroid composed of HepaRG cells and hepatic stellate cells.38,47 As these future directions are explored, the rapidly growing body of 3D cell culture research will further refine this system for better in vivo prediction of drug toxicity and interactions.
In conclusion, we have successfully combined the HepaRG cell model with our spheroid-generating plate and an automated multiplex assay to predict DILI and DDI. The microplates generated relatively uniform 3D spheroids that possessed superior liver specific functionality (i.e., albumin production and CYP activity) compared with traditional 2D cell culture. Most importantly, the 3D assay system detected DILI toxins significantly better than a monolayer of cells. Combined, our results demonstrate that a 3D liver spheroid assay system is a promising cell-based method to evaluate liver toxicity and DDI for early-stage drug discovery.
Footnotes
Acknowledgements
We would like to thank Biopredic International and Promega for providing guidance on this project. Additional thanks to Dr. Sarah Tague for her immunostaining expertise.
Supplementary material is available online with this article.
Declaration of Conflicting Interests
The authors declared the following potential conflicts of interest with respect to the research, authorship, and/or publication of this article: K.R. and L.S.B. have financial interest in Likarda, LLC and are coauthors on the patent describing the micromold used to create the spheroids. No other conflicts exist.
Funding
The authors received no financial support for the research, authorship, and/or publication of this article.
References
Supplementary Material
Please find the following supplemental material available below.
For Open Access articles published under a Creative Commons License, all supplemental material carries the same license as the article it is associated with.
For non-Open Access articles published, all supplemental material carries a non-exclusive license, and permission requests for re-use of supplemental material or any part of supplemental material shall be sent directly to the copyright owner as specified in the copyright notice associated with the article.