
Abstract
Mass spectrometry imaging (MSI) was used to investigate and provide insights into observed biliary pathology found in dogs and rats after administration of two different compounds. Both compounds were associated with peribiliary inflammatory infiltrates and proliferation of the bile duct epithelium. However, MSI revealed very different spatial distribution profiles for the two compounds: Compound A showed significant accumulation within the bile duct epithelium with a much higher concentration than in the parenchymal hepatocytes, while Compound T exhibited only a slight increase in the bile duct epithelium compared to parenchymal hepatocytes. These findings implicate cholangiocyte uptake and accumulation as a key step in the mechanism of biliary toxicity. In both cases, compounds are shown at the site of toxicity in support of a direct mechanism of toxicity on the biliary epithelium. MSI is a powerful tool for localizing small molecules within tissue sections and improvements in sensitivity have enabled localization down to the cellular level in some cases. MSI was also able to identify biomarker candidates of toxicity by differential analysis of ion profiles comparing treated and control cholangiocytes from tissue sections.
Keywords
Introduction
In the pharmaceutical industry, investigational toxicology (IT) is an integral part of non-clinical safety organizations. 33 In the discovery phase of therapeutic development, IT guides the identification and prioritization of candidates that provide the best therapeutic index. In the preclinical and clinical development phase, IT provides mechanistic safety data that enables the development of well-characterized hazard and translational risk profiles to support clinical trial design. 8 Among the many tools used in IT, imaging technologies provide spatial insight into drug effects on cells and tissue. 33 Mass spectrometry imaging (MSI) determines the spatial distribution of a small molecule compound and its metabolites in situ and enables the association of compounds with changes in morphology. 26 In addition, MSI can simultaneously detect endogenous molecules including metabolites, lipids, and peptides with potential for use as spatial biomarkers of structure, disease state, or toxicity. 37 Overall, advances in technology have extended MSI in drug discovery beyond drug disposition analysis into pharmacodynamic biomarker research and mechanistic toxicology.4-7
Drug-induced liver injury (DILI) is widely considered one of the most common toxicities encountered in drug development, which is expected, given the dominant role of the liver in metabolism and excretion of xenobiotics. Multiple mechanisms of DILI have been established, 38 including multiple mechanisms for bile duct injury, which is particularly problematic due to a lack of reliable blood biomarkers to monitor risk in clinical subjects. 12 Identifying a particular mechanism, such as a physicochemical property, 18 or an effect on transporter function, can permit rapid and targeted preclinical screening and selection of molecules that have reduced hepatotoxicity risk. MALDI MSI is the preeminent small molecule imaging tool and can significantly accelerate mechanistic evaluation by localizing drugs to lesions within tissue, detecting toxic metabolites, and determining whether drug accumulation occurs or is exaggerated by cellular injury. Furthermore, MSI can detect perturbations of endogenous molecules, which may support a particular mechanistic hypothesis or identify prodromal markers of toxicity.
Assessment of the potential for an experimental therapeutic to result in hepatotoxicity is a critical step during both early drug development and throughout the post-marketing phase. DILI causes market withdrawals, human suffering, and massive financial loss to the patients and the pharmaceutical company.13,43 DILI has been shown to be the leading cause of acute liver failure in the United States. 30 Bland cholestasis (bile deposits without inflammatory changes), cholestatic hepatitis (bile deposits with cell injury and inflammatory changes), and acute cholestasis (direct bile duct injury) are immediate, reparable damage to the liver, 7 while long-term cholestasis sees long-term injury to the liver through vanishing bile duct syndrome 28 and secondary sclerosing cholangitis. 20 Regulatory agencies require a standard series of tests based on the International Conference for Harmonization of Technical Requirements for Pharmaceuticals for Human Use (ICH) guidelines to ensure the safety and efficacy of new drugs before they are tested in humans.5,24 This regulatory battery relies on preclinical animal testing in rodents (typically rats or mice) and non-rodents (typically dogs or non-human primates [NHPs]). 33 While standard, non-clinical toxicology studies remain the gold standard to predict hepatotoxicity in humans, new approaches are necessary to improve the prediction of DILI. 16
The MSI of liver tissue sections focusing on hepatic parenchyma as well as the biliary tree can provide insight into mechanisms of drug-induced injury.31-34 Of note, the portal triad can be recognizable even without histological staining in the optical image of a liver section before a matrix coating is applied. MSI focused on the portal area, which can be performed at high spatial resolution, providing cellular imaging with high throughput.
In this report, we applied high spatial resolution (5-10 µm) MSI on sections of livers from animals administered with two different compounds, separately.
The H&E-stained images from liver sections of these dosed animals yielded a similar morphology of lesion to the large-caliber bile ducts. However, MSI revealed very different molecular spatial profiles for each compound at the site of the bile ducts of these animals. By imaging at 5-10 µm spatial resolution, the distribution of the parent compound was correlated with pathology findings at the cellular level. The distributions of endogenous bile acids were also reported to highlight the molecular response to drug dosing in the liver. In all, these results were used to initiate further downstream studies for mechanistic investigation of both compounds and demonstrate MSI as a valuable IT tool in drug development.
Materials and Methods
Ethanol (EtOH, 1117271000), xylene (214736), water (270733), acetonitrile (34998), 2,5-dihydroxyacetophenone (D107603), gelatin from porcine skin (G1890), trifluoroacetic acid (02031), pentobarbital (1507002), ritonavir (SML0491), HCl (H9892) and hematoxylin (H3136) were purchased from Sigma-Aldrich. Eosin-Y solution (314-630), phosphatidylcholine in medium-chain triglyceride, content ≥ 53.0 % (Phosal® 53 MCT, NC0706184), and polyethylene glycol 400 (PEG-400, AAB2199230) were purchased from FisherSci. Indium tin oxide (ITO) coated microscope slides (CG-81IN-S115) were purchased from Delta Technologies (Loveland, CO, USA).
DHA (100 g) was recrystallized twice with 90% ACN under 85°C and with 5 g of active charcoal (Sigma, 161551) added in the first round.
Gelatin-85 (20%) was prepared under 85°C for 4 days using the method described previously. 45
Animal Experiments
All animal studies were reviewed and approved by AbbVie’s Institutional Animal Care and Use Committee or Oversight Body (in accordance with national regulations). Animal studies were conducted in an AAALAC-accredited program where veterinary care and oversight were provided to ensure appropriate animal care. All animals were housed under standard laboratory conditions with a 12-hour light/dark cycle in a temperature and humidity-controlled room with free access to standard diet and water. Male Beagle/Marshall dogs were from Bioresources USA, Inc. (North Rose, NY). Male Sprague-Dawley rats, stock/strain Crl:CD (SD), were from Charles Rivers Laboratories (Portage, MI). All animals were acquired from in-house dose-escalation holding colonies and deemed fit for use in the study by a veterinarian.
Compound A Dosing
Compound A (30 mg/kg/day) or vehicle was administered orally for 5 days in n = 2 beagle dogs per group. The dosing vehicle was 10% EtOH + 30% PEG-400 + 60% Phosal 53 MCT. Capsules were filled with vehicle or formulated Compound A immediately prior to dosing at 1 mL/kg in capsules. Formulation was prepared by dissolving Compound A in the vehicle while stirring overnight. One Molar equivalent of HCl was added using concentrated HCl (~10 N) after the addition of formulated Compound A to the vehicle. During the dosing phase, dogs were fed 4 to 6 hours post-dose and food was removed at least 4 hours later. Dogs were fasted overnight after last dose.
At 24 hours following the last dose, dogs were anesthetized with pentobarbital and euthanized by exsanguination. Liver tissue was collected, flash frozen with liquid nitrogen, and stored under −80°C.
Compound T Dosing
Male Sprague-Dawley rats from Charles Rivers Laboratories (Portage, MI) were housed in three per cage with food and water provided ad libitum in individually ventilated cages. The dosing vehicle was Cremophor EL: PEG-400:oleic acid (10:10:80, w/w). Compound T and ritonavir were mixed with an appropriate volume of vehicle to achieve the desired final concentration (Compound T at 50 mg/mL and ritonavir at 15 mg/mL). In the first study, Compound T was dosed at 100 mg/kg/day for 5 days by oral gavage and n = 3. Rats were fasted 16 hours prior to the scheduled necropsy. At approximately 24 hours after the last dose, rats were anesthetized and euthanized, livers were collected, flash frozen with liquid nitrogen, and stored under −80°C. In the second study, Compound T was dosed at 100 mg/kg/day for 5 days by oral gavage, n = 2 for each time point group. Rats were fasted overnight prior to each scheduled necropsy and livers were similarly collected at 6, 24, 48, 72, and 96 hours after the fifth dose.
Sectioning
Livers were sectioned on a Thermo HM550 cryostat at −16°C. When embedding was needed, gelatin-85 was used. The section thickness was set at 10 µm. Section placement on ITO slides: after the section came off the blade, it was placed on a polytetrafluoroethylene microscope slide (Electron Microscopy Science, 63414-13) pre-chilled in cryostat, then the conductive side of a pre-chilled ITO slide was placed on top of the section, gentle pressure was applied so that the section was flattened and stuck on the ITO slide and then the ITO slide was separated from the PTFE slide. After this step, sections were thawed by a finger till dryness in the cryostat chamber and stored in a vacuum desiccator. Prior to matrix application, all tissue sections collected for MSI were scanned at 20× magnification on a MoticEasyScan Pro 1 slide scanner (Motic Digital Pathology) to obtain optical images of sections for MSI location guidance.
Matrix Coating
Matrix coating was applied using an HTX TM sprayer M3+. For Compound A-dosed samples, 100 mg of DHA was mixed with 9 mL of water, 1 mL of acetonitrile, and 100 µL of TFA and sonicated for 2 min at room temperature. This solution was filtered through a 0.45 µm PTFE syringe filter (Whatman, 6784-2504). Spraying conditions: 4 passes, 0.1 mL/min of flow rate, 1100 mm/min of nozzle moving speed, 2.0 mm of track spacing, 40 mm of nozzle height, 70°C of nozzle temperature, 10 PSI nitrogen pressure, and Criss Cross spraying mode. For Compound T-dosed samples, TFA was not added to the matrix solution because the MS was applied with negative ion mode; all other conditions were identical.
Mass Spectrometry Imaging
MSI sessions of matrix-coated sections were carried out on a Bruker timsTOF fleX mass spectrometer. In general, the laser was set for 50-100 shots/pixel with laser frequency at 10,000 Hz. Stage and smart beam profile (spatial resolution) were varied from 5 to 80 µm, with trapped ion mobility active. Positive ion mode was used for Compound A, and negative ion mode was used for Compound T. Data were processed with Bruker SCiLs Lab MVS 2024a Pro.
Drug Calibration Curve for Compound A
To quantify Compound A concentration in the tissue, 2 µL of serial solutions of Compound A at 0.1, 0.05, 0.01, 0.005, and 0 mg/mL in ACN were spotted on control liver sections (2 spots for each concentration). After the spots were dry, the slide was coated with DHA and MSI was carried out with the same parameters of the full imaging experiment at 5 µm resolution. The resulting data were loaded in Bruker SCiLS Lab and a linear regression was acquired to obtain the calibration curve.
To convert the concentrations of spotted solutions of Compound A (mg/mL) to resultant tissue concentrations in the format of drug weight over tissue weight (µg/g), the following parameters were used: the diameter of the spotted area was 2.3 mm (measured average value), tissue thickness was 10 µm and the density of liver was assumed as 1 mg/mm3.
H&E Staining
After mass spec imaging, the slides were immersed in 95% ethanol for 5 minutes to remove the matrix coating from sections, followed by a standard H&E staining protocol. 35 The stained sections were scanned on a MoticEasyScan Pro 1 slide scanner at 40x magnification, and images were exported using QuPath. 6 The size of cells at the bile duct area was measured using the ImageJ plugin on QuPath. 1 Average cell length was used for the comparison between dosed and control animals. Optical images were reviewed by an American College of Veterinary Pathologists board-certified pathologist to assist with selecting regions of interest.
Results
Compound A Resulted in Biliary Epithelial Hyperplasia Affecting Large-Caliber Bile Ducts
The optical scans of H&E-stained sections, highlighting large-caliber bile ducts, are shown in Figure 1. Compared to vehicle (Figure 1A), administration of Compound A resulted in biliary epithelial hypertrophy and hyperplasia characterized by piling, disorganization, and increased basophilia of cholangiocytes (Figure 1B). Additionally, periductal mixed inflammation was observed after administration of compound A. More precisely, the average cholangiocyte cell length (11 µm) of Compound A-dosed dog is larger than that of a vehicle dog (6.4 µm). There were no significant findings in the hepatocellular parenchyma by light microscopy.
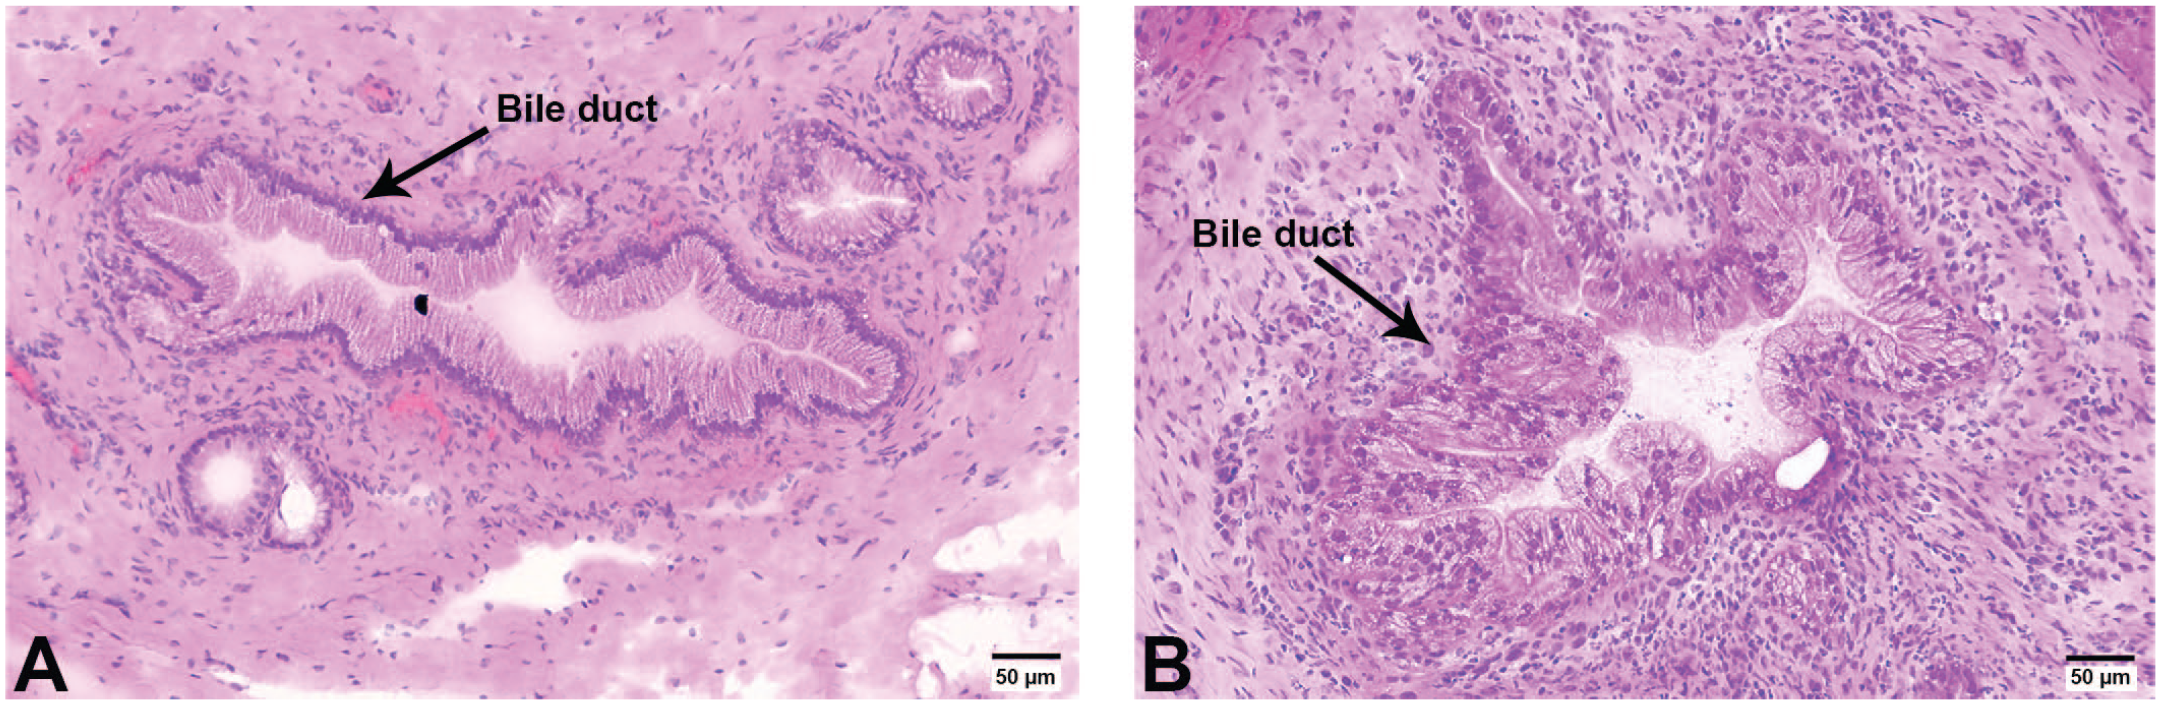
Optical images of H&E-stained Compound A and vehicle-dosed dog liver sections. (A) vehicle-dosed dog liver section. (B) Compound A-dosed dog liver section showing hyperplasia of biliary epithelial cells associated with periductal mixed inflammation.
MS Imaging Reveals Concentration of Compound A at the Bile Duct
MSI experiments were carried out with the liver sections from dosed and vehicle dogs using the same conditions, with special care paid to the matrix coating and instrument parameters.
Initially, an MSI experiment using a lower spatial resolution of 80 µm was applied to sections of vehicle and Compound A-dosed dogs, providing a rapid survey to identify areas of interest (Figure 2). The ion corresponding to the parent drug was detected in dosed dogs (Figure 2B) but was not observed in vehicle dogs (Figure 2A), demonstrating no background interference from dosing formulation or the matrix coating process. Liver sections from Compound A-dosed dogs feature stronger parent drug signals around large bile ducts than the rest of the hepatic parenchyma, indicating higher concentrations of compound A around the bile duct.
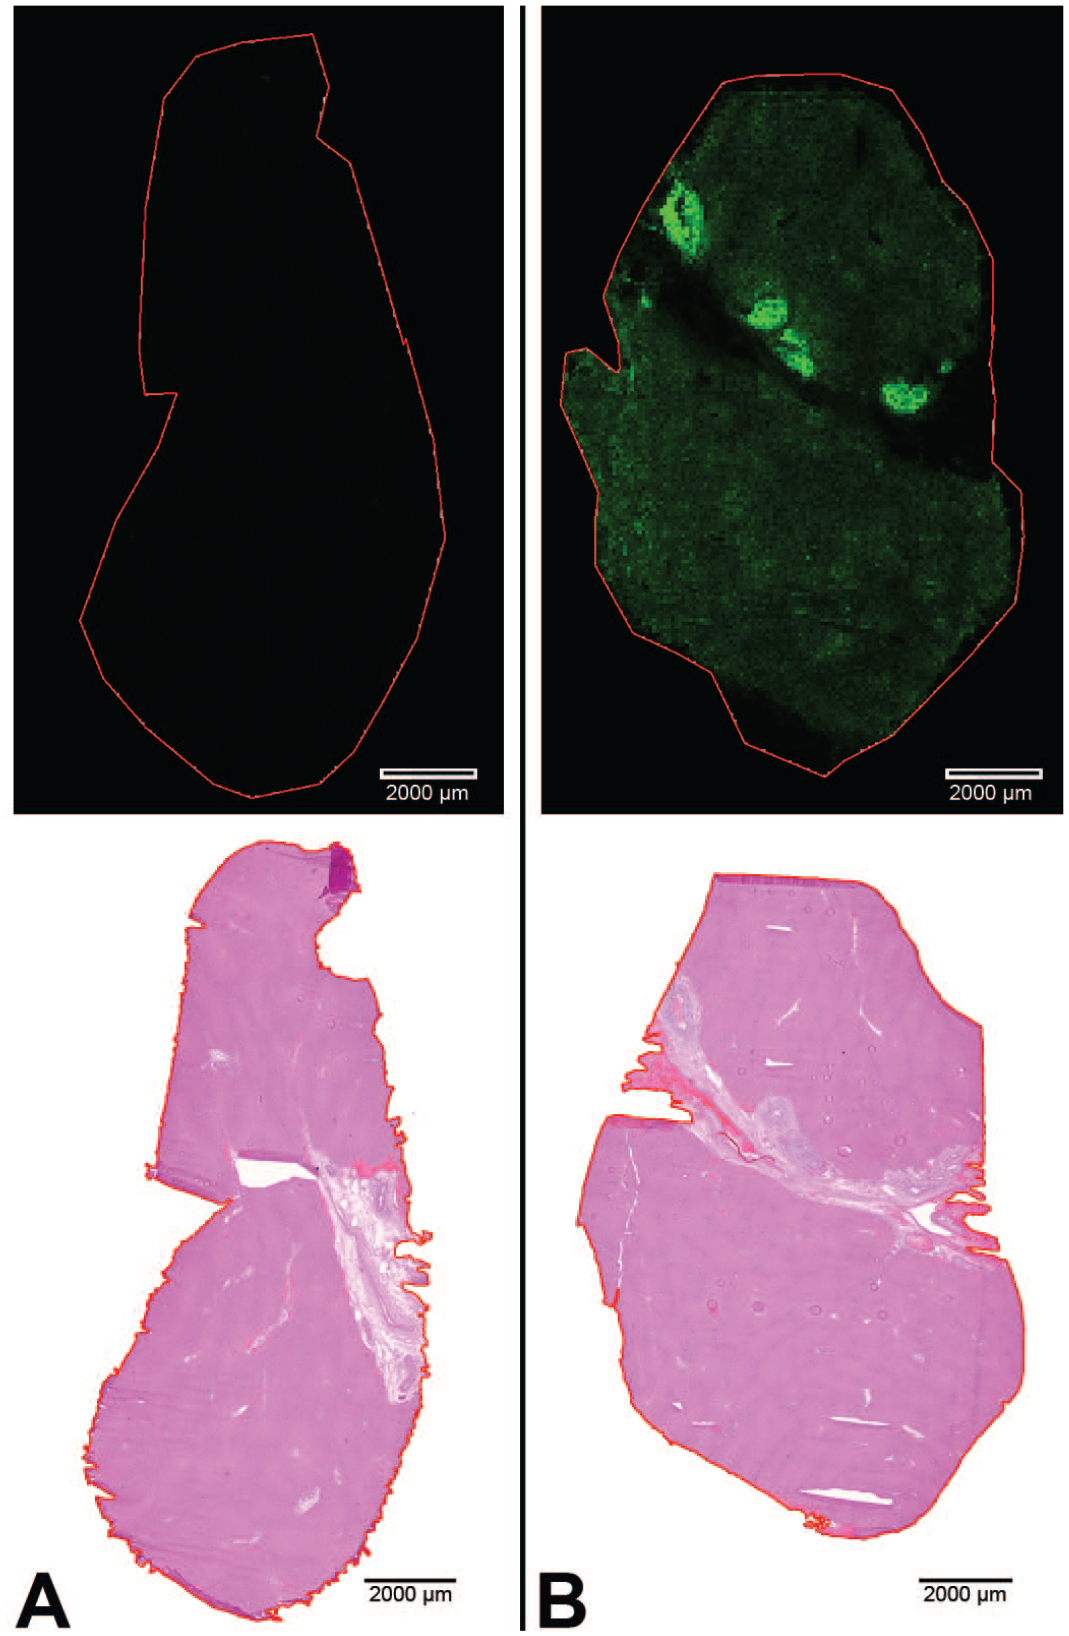
Rapid survey scan. MS ion images of Compound A at 80 µmresolution of Compound A-dosed and vehicle-dosed dog liver sections. The imaging was accomplished in 30 min. H&E optical images are below each corresponding ion image. (A) Vehicle-dosed dog liver section and H&E of the same section below. (B) Compound A-dosed dog liver section and H&E of the same section below. Hot spots at bile duct area were observed on Compound A-dosed liver section.
Next, higher spatial resolution (5 µm) MSI was obtained for Compound A-dosed dog liver sections, focused on the large bile ducts and the surrounding parenchyma (Figure 3). Compound A-dosed sections revealed that the parent drug is highly localized in bile duct epithelia, and Compound A was coincident with the sites of lesion (Figure 3B and C). In addition, the presence of potential metabolites and other drug-related material from Compound A were probed in the MSI data. An oxidative metabolite, related to either aliphatic hydroxylation or aromatic N-oxidation, was observed, along with the phase I oxidative metabolite (Figure 3D), at the same location as the parent compound. It is important to note that exact structures of isomeric metabolites are not readily distinguishable during MSI due to the lack of chromatographic separation to help facilitate fragmentation and identification. The intensity for the oxidative metabolite(s) was observed to be significantly lower than the signal corresponding to parent compound (~40:1 parent: metabolite[s]). Therefore, the hyperplasia in the bile duct area was likely attributed to the concentration of parent compound, not the metabolite(s).
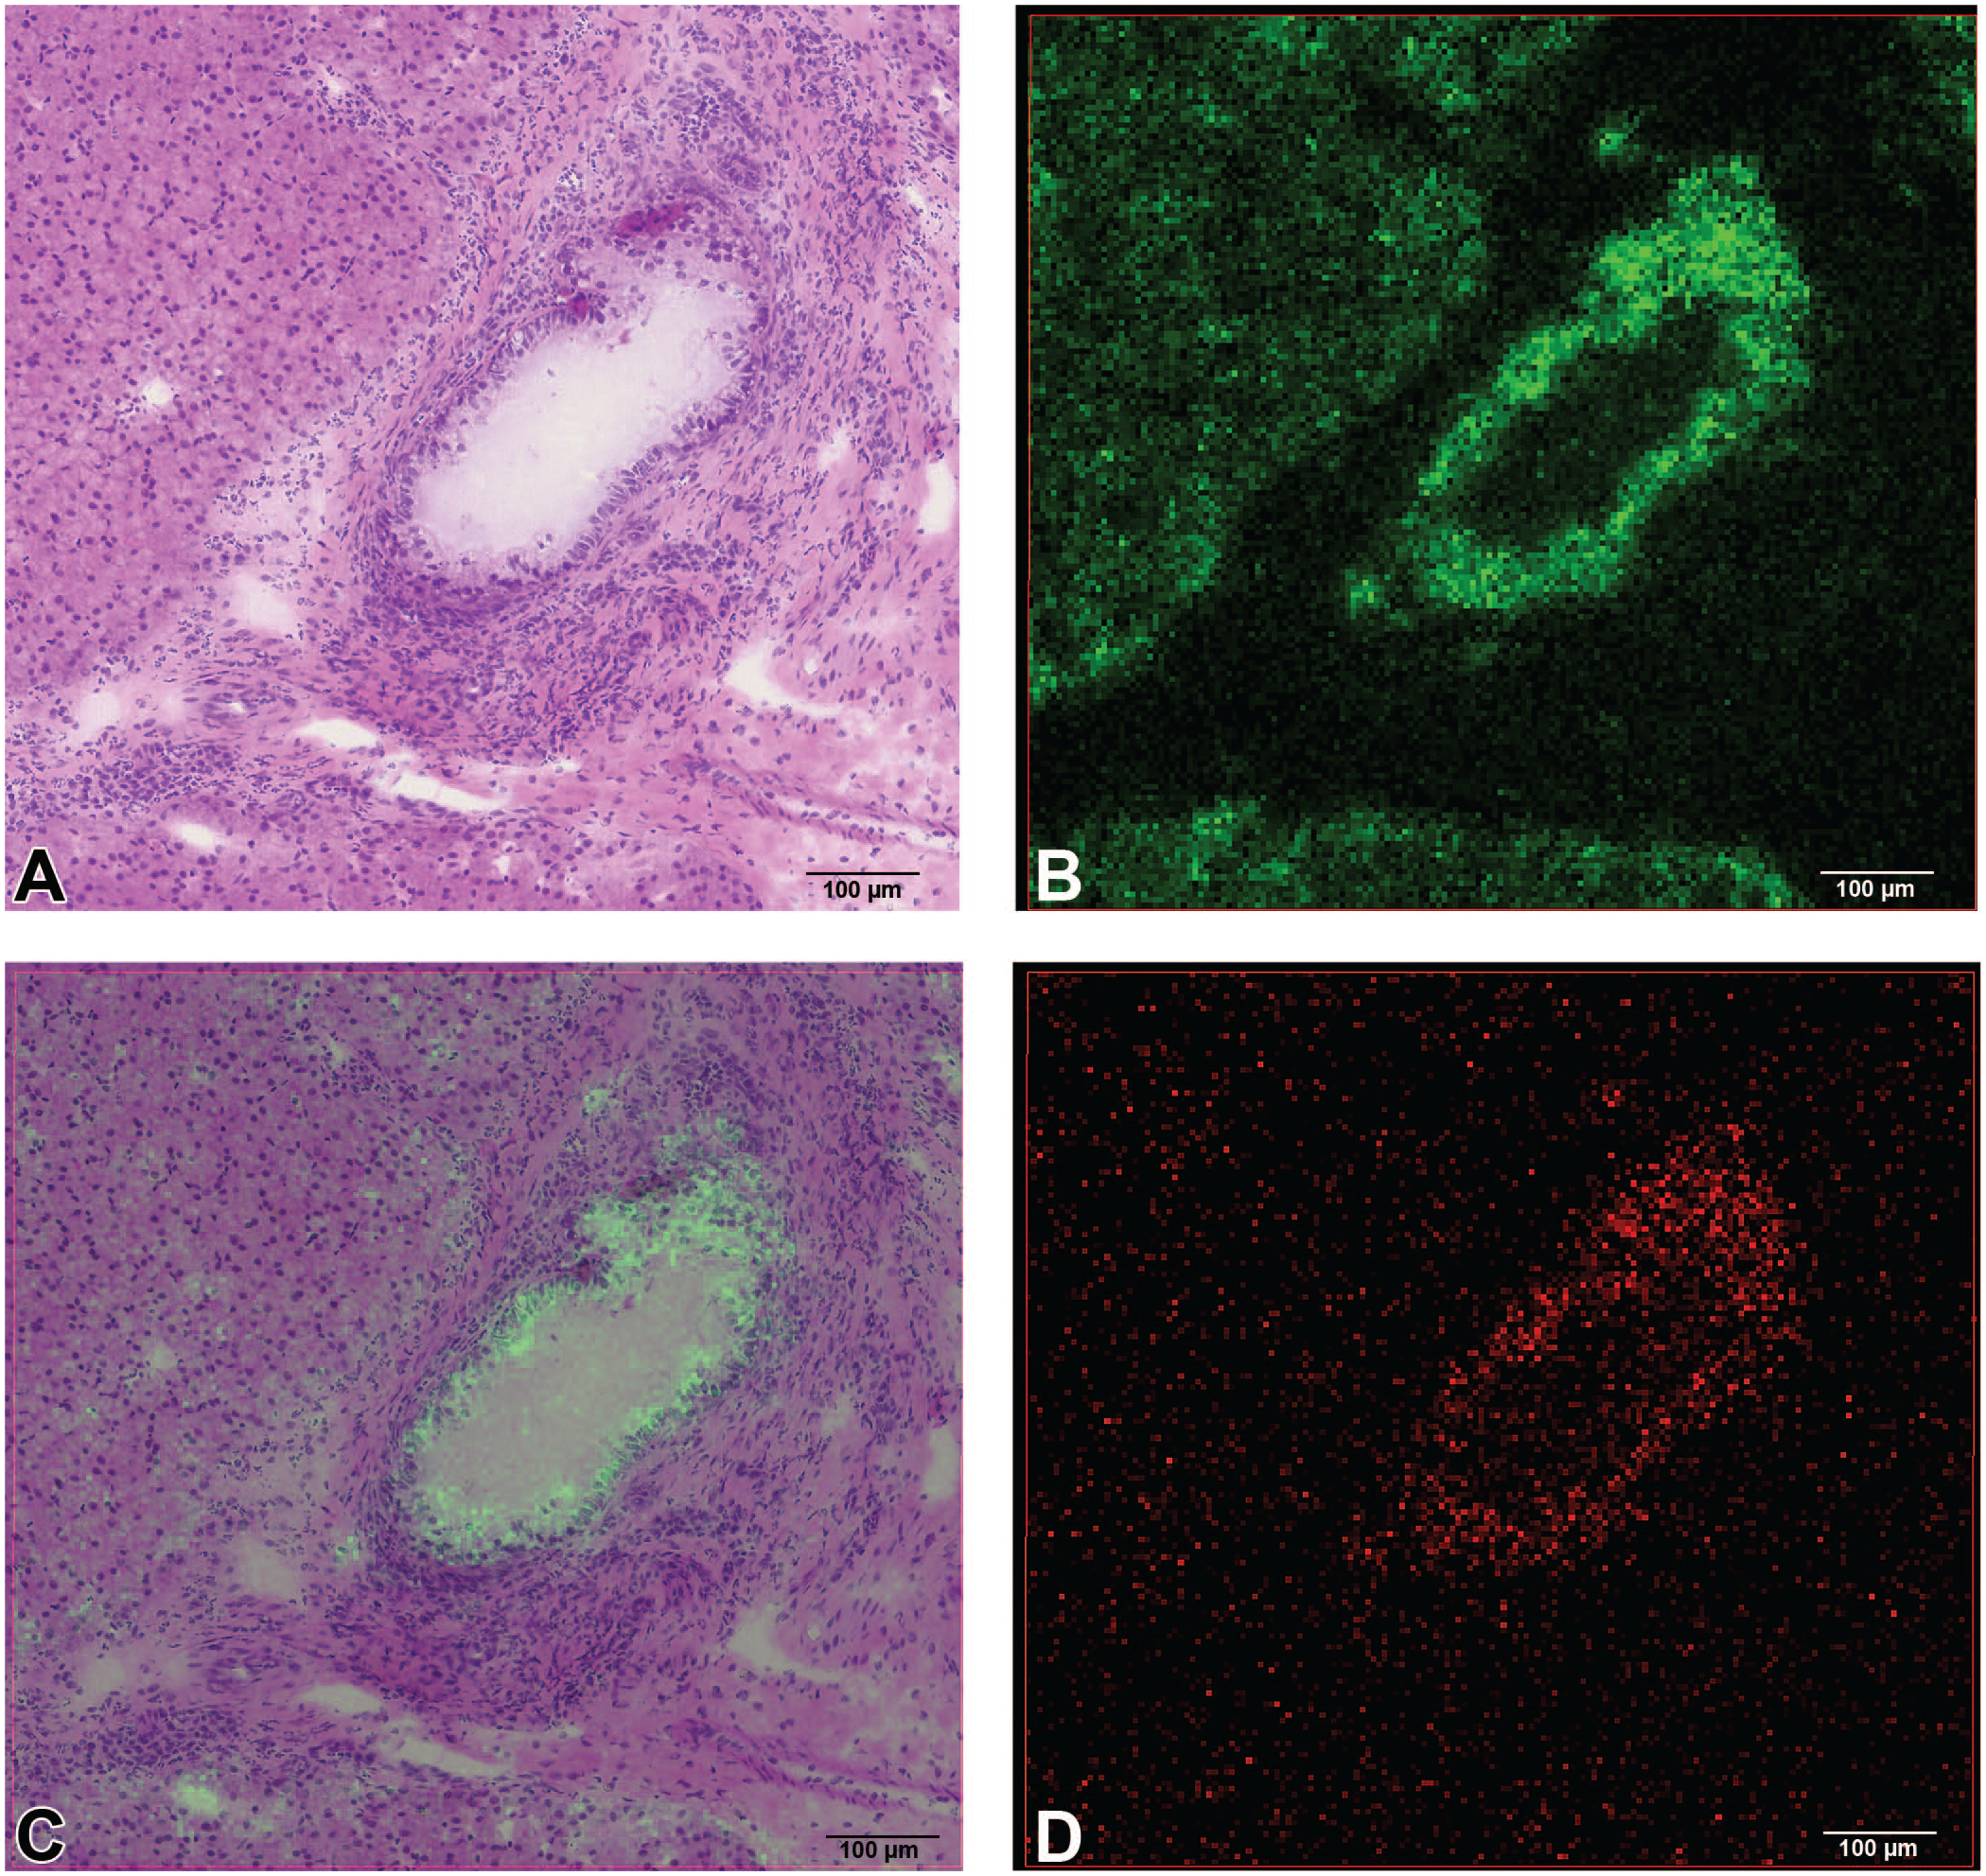
Compound A-dosed dog liver section imaged at 5 µm resolution. (A) H&E of Compound A-dosed dog liver section zoomed in bile duct. (B) ion image of Compound A. (C) overlay of ion image of Compound A with H&E image. (D) ion image of metabolite from Compound A (plus oxygen), possibly a product of aliphatic hydroxylation or aromatic N-oxidation.
Compound A Preferentially Concentrated in the Bile Duct Compared to the Hepatic Parenchyma
To further investigate and quantify the distribution of Compound A, a calibration curve was created by spotting various concentrations of compound A (with expected relevant concentrations) on section of the vehicle-dosed liver followed by MSI. This was performed under the same conditions as the MSI experiment of Compound A-dosed liver sections above. This process produced a calibration curve of peak intensity vs spotted concentration of Compound A on tissue (µg/mL) (Figure 4).
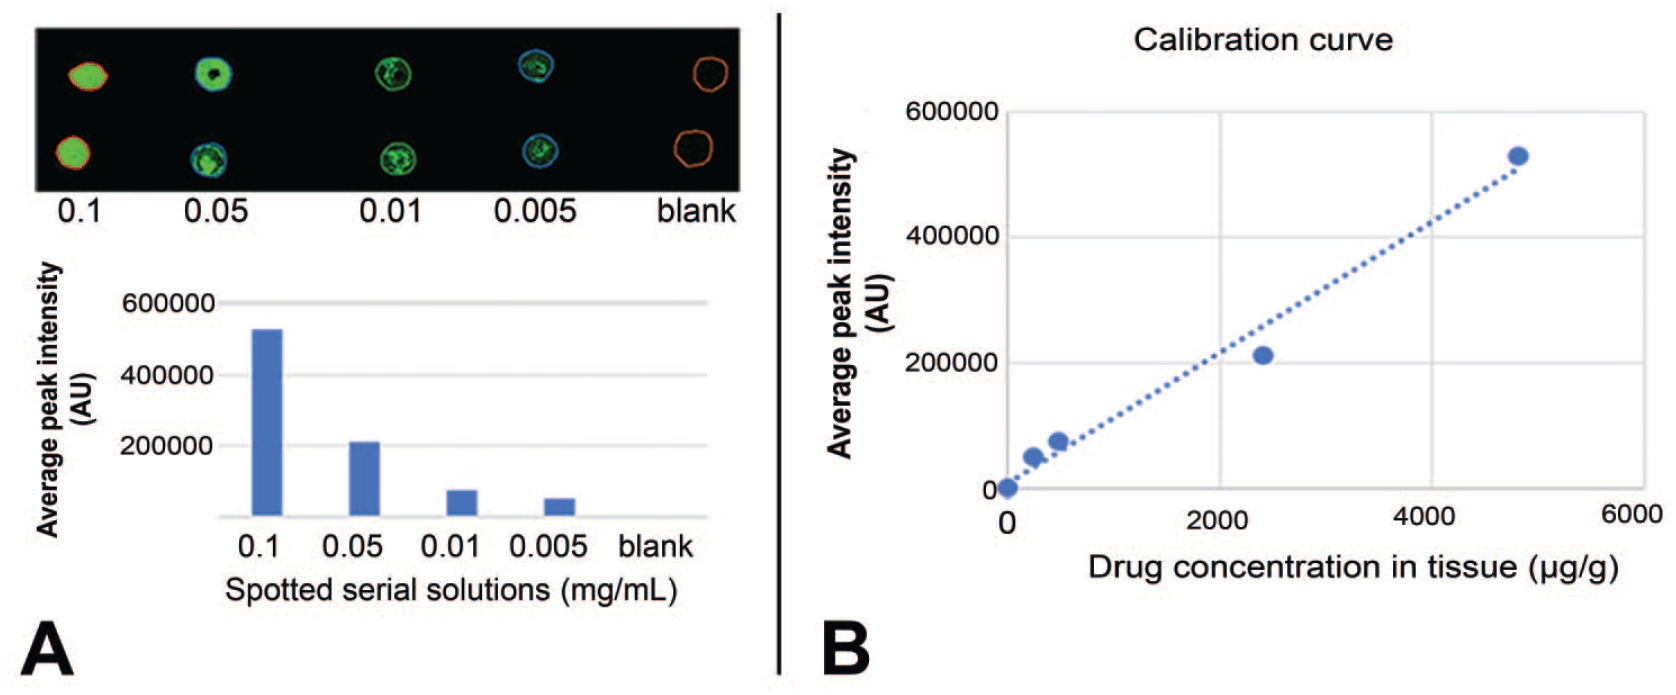
Calibration curve for quantitation of Compound A in dosed dog liver sections. (A) ion image of Compound A (in serial solutions) spotted on control liver sections (top left) and average peak intensities vs spotted serial concentrations (mg/mL) (bottom left). (B) calibration curve using the average peak intensity of Compound A ion with the concentration converted to drug weight over tissue weight (µg/g). Intensity=104*C + 7987, R² = 0.987. C is the drug concentration in tissue (µg/g).
The average concentrations of Compound A in bile ducts and hepatocytes were compared using the average peak intensity at these locations and the generated calibration curve. The ratio of Compound A in the bile ducts vs hepatocytes was approximately 5:1 (Figure 5B). Using the calibration curve from Figure 4B, the average concentration of Compound A was 640 µg/g in the bile ducts and 133 µg/g in the hepatocytes (Figure 5C). This enrichment of Compound A in the bile ducts reiterates the previous finding that Compound A is the cause of the observed pathology. The finding that the concentration ratio of Compound A in bile ducts vs hepatocytes is very close to that of relative quantitation ratio indicates that in cases where absolute quantitation is unnecessary, peak intensity in MSI can be used for relative quantification purposes when the background interference is low. When more accurate quantitation is desired, more elaborate methods can be used to obtain more accurate values, i.e., with internal standards,11,34 memetic tissue model,9,26 or tissue extraction coefficient. 21
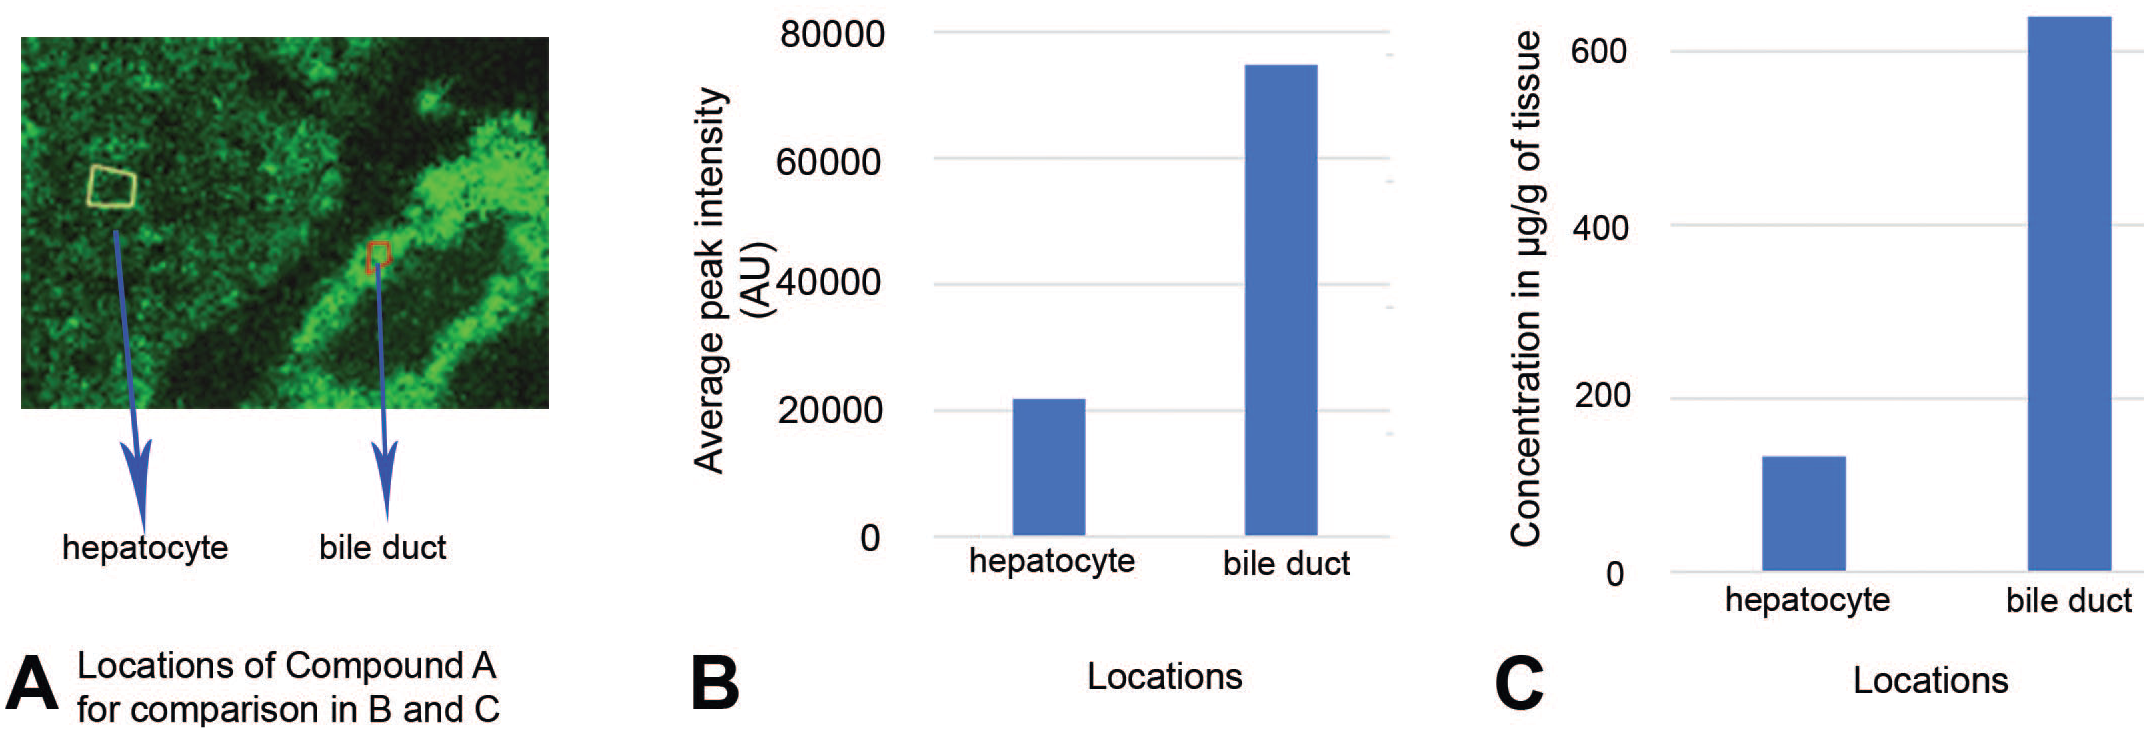
Quantitation of Compound A on dosed dog liver sections. (A) ion image of Compound A at bile duct area, the locations at hepatocyte (marked in yellow) and bile duct (marked in red) in the image were used for extracting the average peak intensity in B. (B) the average peak intensity of Compound A of each pixel at hepatocyte and bile duct. (C) the average concentration of Compound A of each pixel at hepatocyte and bile duct obtained by using the calibration curve from Figure 4.
Detecting Endogenous Bile Acids
Endogenous molecules can be imaged simultaneously with drugs and their metabolites to better encapsulate tissue response to the drug. At the site of drug-induced injury, multiple bile acids were detected. Taurine conjugated cholic acid, or taurocholate (TCA), is one molecule that appeared to accumulate in the bile ducts and peribiliary tissues of Compound A-treated dogs (Figure 6A). While TCA was detected in the vehicle group, it was more intense in the dosed group. Additionally, TCA did not entirely colocalize with the drug, and this is more clearly represented with 5 µm imaging (Figure 6B). It was no surprise that TCA was detected throughout the interstitial space of the bile ducts. Here, the bile acids that are present in bile are typically in a conjugated form, and in the case of the dog, bile acids are predominantly conjugated with taurine. 42 Of note, TCA was more intense in the dosed group, suggesting dysregulation of bile acid metabolism as a result of dosing. It is unknown if the accumulation of TCA is the cause or the result of bile duct injury and toxicity in this system, but bile acid accumulation is known to damage cholangiocytes and cause inflammation. 27
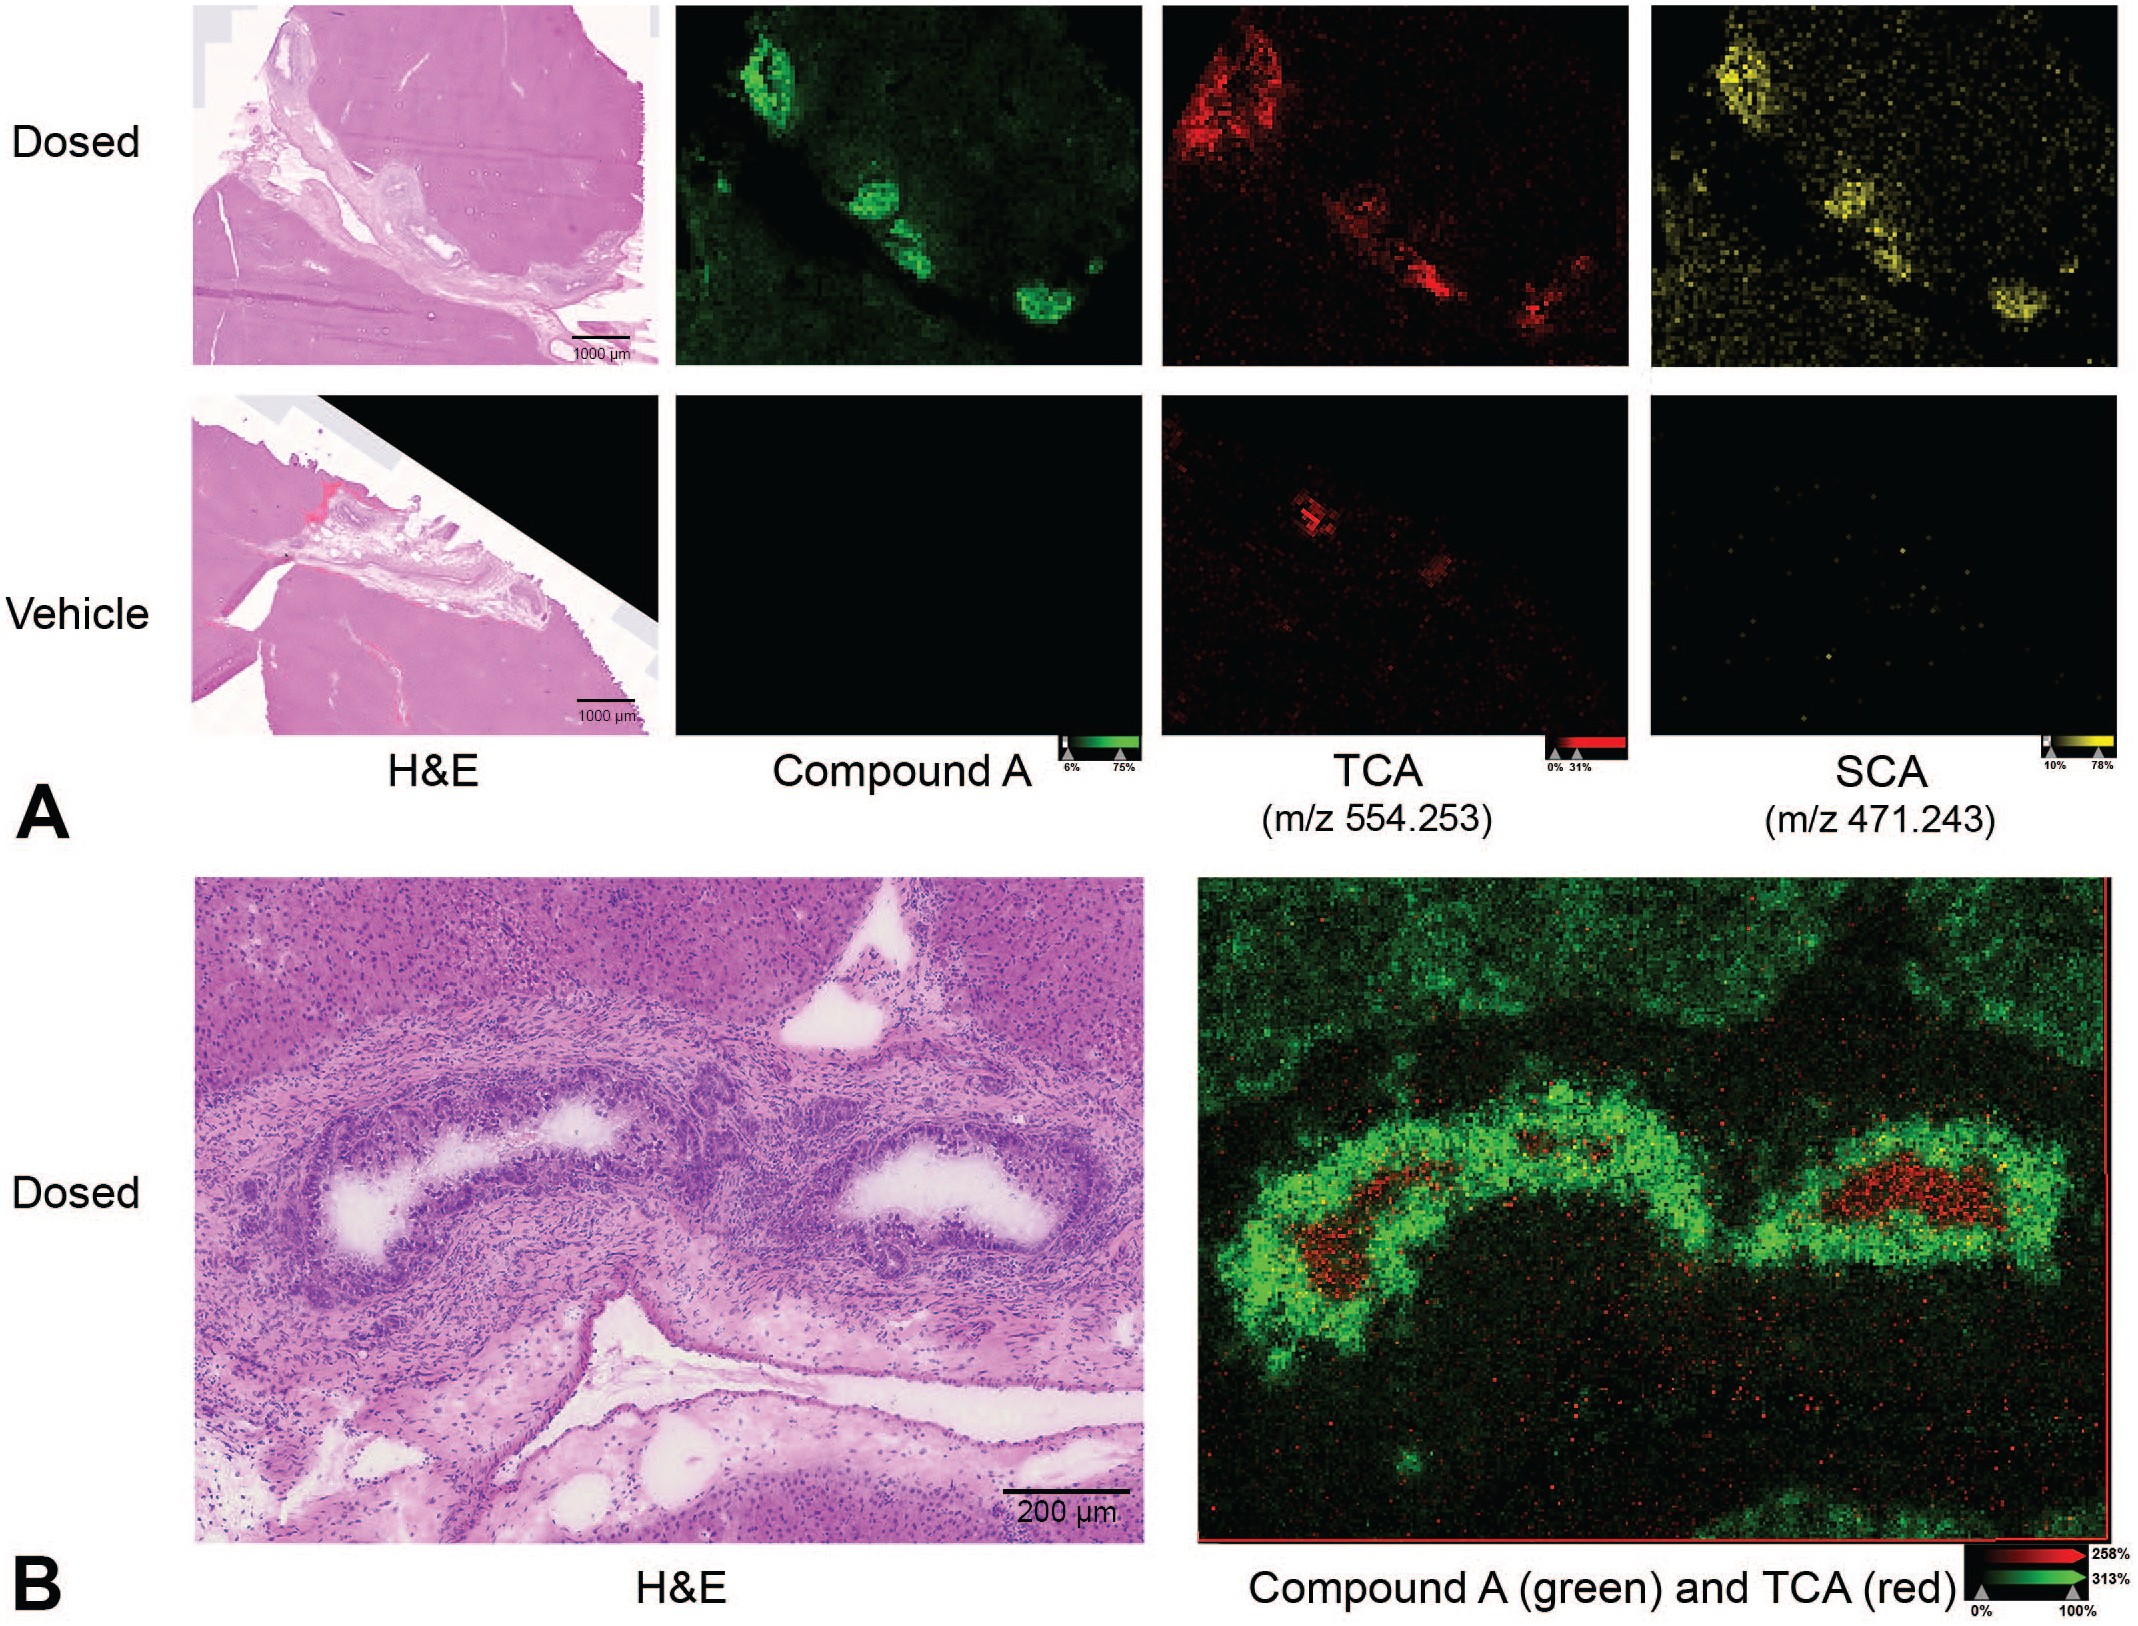
Distributions of taurocholate (TCA) and sulfocholate (SCA). (A) H&E and ion images of Compound A, TCA, and SCA at 80 µm resolution in Compound A-dosed and vehicle-dosed dog liver sections. (B) H&E and overlaid ion image of Compound A and TCA at 5 µm resolution in Compound A-dosed dog liver section.
Sulfonated cholic acid, or sulfocholate (SCA) was discovered to have a similar distribution as the drug (Figure 6A), albeit lower intensity, and thus not detected with 5 µm imaging. The high correlation of SCA and Compound A on a per-pixel basis suggests a direct molecular interaction between them. SCA is normally synthesized to alleviate toxic accumulation of bile acids. 3 Additionally, upregulation of sulfotransferase expression (e.g., Sult2a) is a known downstream effect of nuclear receptor activation in the rat. 32 Whether this upregulation of SCA production mitigates or exacerbates Compound A toxicity requires further investigation. Generally, an extensive characterization of the global bile acid pool may be necessary to elucidate a potential mechanism of DILI.
Compound T-Dosed Liver MSI Revealed Less Enrichment at Bile Duct Than That of Compound A-Dosed Liver
Following 5 days of administration of Compound T in male rats, there was a notable increase in the number of biliary profiles within portal tracts (Figure 7B) as well as an expansion of the periductal areas by loose extracellular matrix and a mixed population of inflammatory cells. Cholangiocytes within these bile ducts were also considered enlarged and piled, resulting in an undulating profile to the ductal lumen (hyperplasia). In previous experiments, dosing Compound T for 14 days led to a marked peribiliary neutrophilic inflammatory infiltrate and bile duct epithelial hyperplasia (data not shown), indicating that findings after 5 days represent an incipient inflammatory response. Despite similarities in the histologic appearance of bile ducts in Compound A-treated dogs and Compound T-treated rats, MSI showed no enrichment or preferential distribution of Compound T to bile ducts relative to the surrounding hepatocellular parenchyma (Figure 7D).
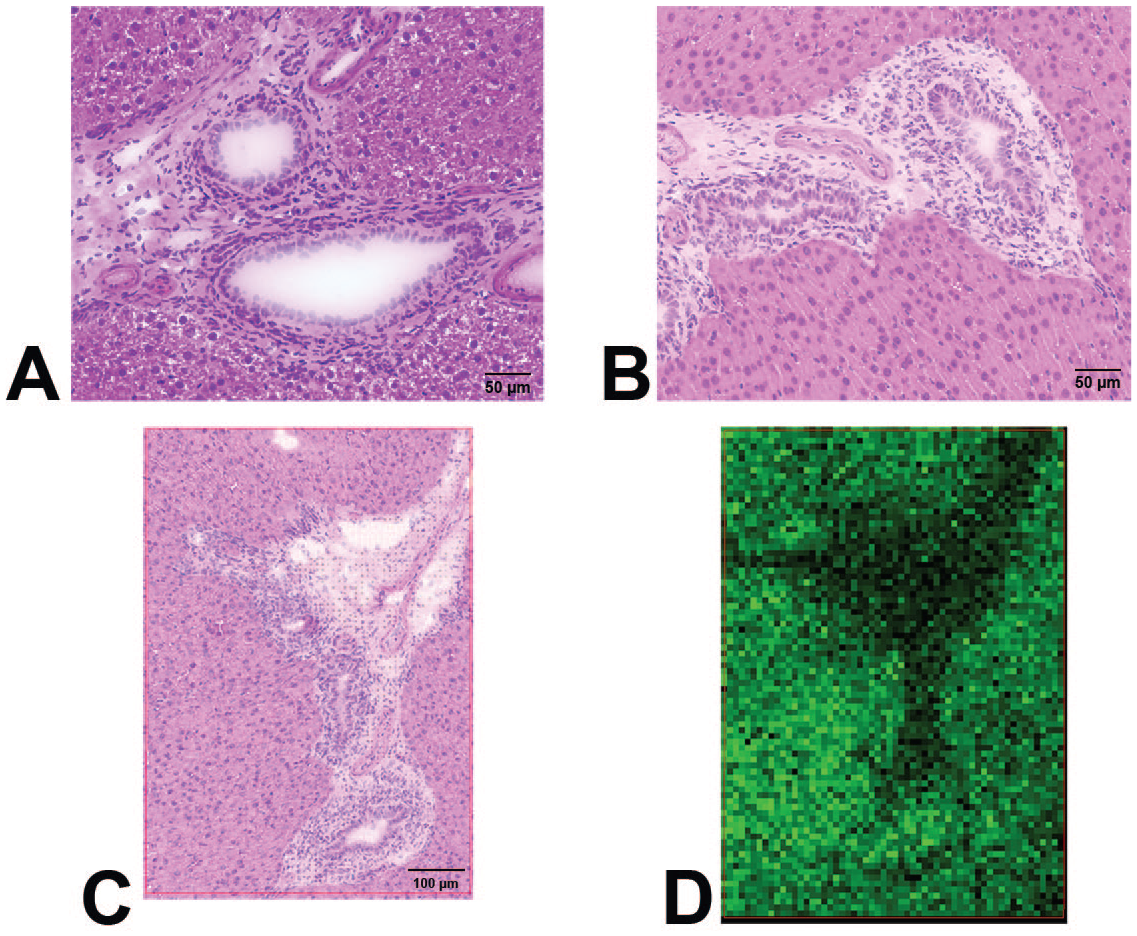
Compound T dosed rat liver sections and ion image. (A) vehicle-dosed rat liver section showing normal feature of histological liver structure. (B) Compound T-dosed rat liver section showing hyperplasia of biliary columnar epithelial cells. (C) H&E of Compound T-dosed rat liver section that was applied MSI. (D) ion image of liver section from panel C that shows no Compound T enrichment at bile duct area.
A second time course study was conducted to investigate whether Compound T preferentially persists in bile duct epithelium relative to hepatocytes at various time points after the last dose. Livers were harvested after the fifth daily dose with a time course spanning 4 days (6, 24, 48, 72, and 96 hours). We observed that over the time course of the study, Compound T decreases over time with equal average signal (within approximately 20%) in both hepatocytes and cholangiocytes, failing to implicate retention of Compound T in bile duct epithelium as a mechanism contributing to toxicity (Figure 8). This indicates a fundamental difference in the pharmacokinetic behavior of Compound T and Compound A in the liver, potentially explaining the slower onset of toxicity with Compound T. Further studies after longer in vivo dosing duration with Compound T, or in vitro assessment of its cytotoxicity to hepatocytes and cholangiocytes may be necessary to understand its distinct mechanism of toxicity.
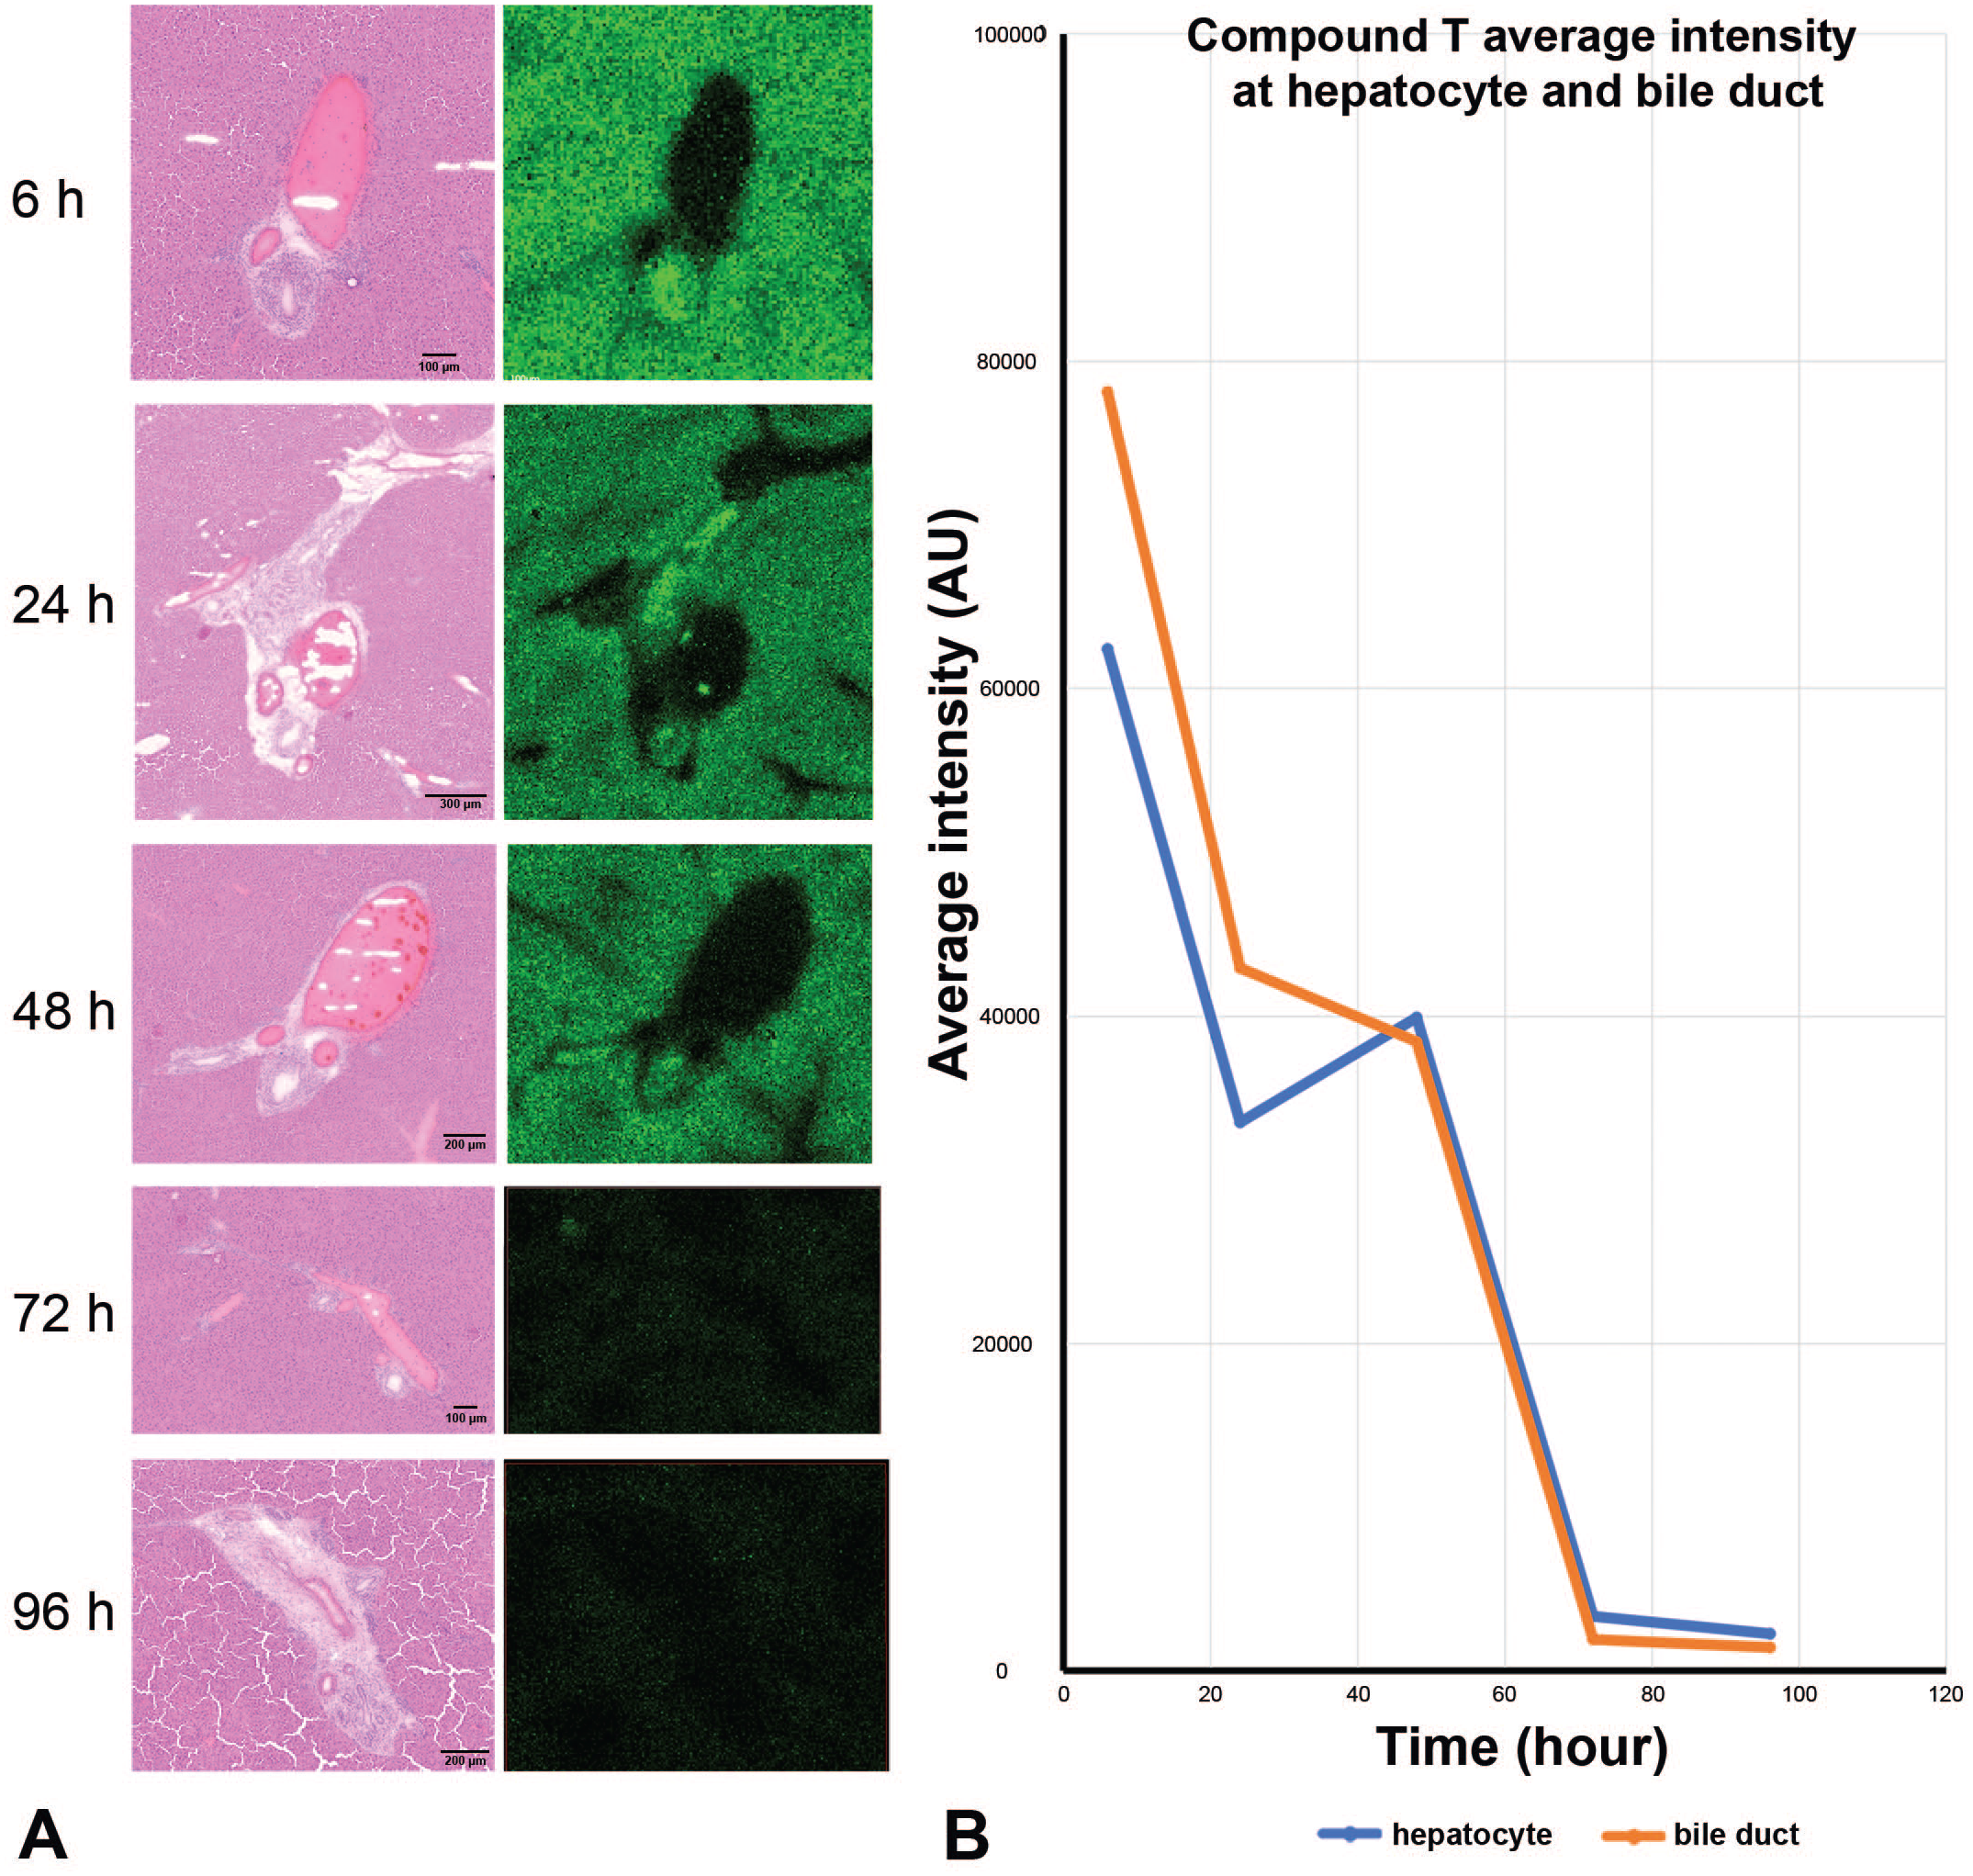
Time course study by MSI on Compound T-dosed rat liver sections that were harvested after final dose at time points of 6, 24, 48, 72 and 96 hours. (A) H&E images and ion images at different time points. (B) Compound T concentration (relative) changes at bile duct and hepatocyte locations through harvesting time points. Compound T did not highly accumulate at bile duct.
Discussion
In the course of exploratory toxicology testing, two compounds with distinct molecular targets were evaluated in the rat. Neither of these targets is normally expressed in hepatocytes nor cholangiocytes. Unexpectedly, one of the compounds, Compound T, resulted in biliary injury and periportal mixed cell infiltration after 14 days of dosing, which resulted in termination of further development. Compound A was not observed to cause significant hepatobiliary findings in the rat, but the transition to exploratory dog toxicity testing resulted in biliary hyperplasia and cholangiocyte degeneration. To better understand the role of compounds in the generation of these lesions, MSI was applied.
We have demonstrated that MSI can assist investigative toxicology for drug development by highlighting two case examples. Although similar biliary pathology was observed for both cases, the pharmacokinetics within hepatocytes and bile duct epithelial cells were distinct between compounds. Compound A was highly enriched in the bile duct epithelium and strongly co-localized with sulfocholate, while Compound T did not demonstrate cell-specific accumulation. This work was instructive in the development of subsequent in vitro assays (data not shown), which were designed to select less toxic alternatives to Compound A. Additionally, these findings potentially explain the difference in time required to develop a similar pathologic change when dosing Compound A versus Compound T. These two examples illustrate the unique ability of MSI to investigate spatial distribution of drugs and endogenous molecules to investigate mechanisms of toxicity.
Technical advances in MSI instrumentation have enabled remarkable increases in signal-to-noise, which, in turn, have enabled reduction of pixel size to 5 µm and potentially lower. This permits single-cell mass spectral analysis for most epithelial cells. It is now possible to resolve small molecule localization within a single cell layer, such as the bile duct epithelium. Improved signal-to-noise performance also enables increasingly robust calibration of ion intensity signals that can relate in vivo to in vitro compound activity. Furthermore, rapid laser scanning is amenable to working with entire sections on standard microscope slides, providing improved context for interpretation and completion of experiments possible within the timeframe of a single day. Advances in software and data analysis have now enabled computer aided detection of molecular signals using correlation criteria that may be useful for identifying biomarkers, shifts in metabolic activity, and abundance of biologically active molecules without prior knowledge. Such discoveries facilitate hypothesis generation and new avenues of investigation. Mass spectrometric analysis of tissue sections provides a small molecule complement to emerging technologies such as spatial transcriptomics and proteomics, which altogether will provide a more wholistic view of biological mechanisms.
Footnotes
Acknowledgements
The authors would like to thank the technical support from AbbVie’s team: Todd Turner, Nicole Kowalczyk, Juan Ortega, Alexandra Howland-Lopez, Trish Galassi, Thomas Thomason, Cassandra Shu, Bo Liu and Deanne Stolarik.
Authors’ Note
40-word brief description of your article for social media: MS imaging at cellular level provides insights into the pathogenesis of biliary pathology with dosed compounds. Combining pathology and MS imaging reveals the direct mechanism of toxicity on the biliary epithelium.
Declaration of Conflicting Interests
The author(s) declared the following potential conflicts of interest with respect to the research, authorship, and/or publication of this article. All authors are employees of AbbVie and may own AbbVie stock and have authorized the submission of this manuscript.
Funding
The author(s) disclosed receipt of the following financial support for the research, authorship, and/or publication of this article: AbbVie sponsored and funded the study; contributed to the design; participated in the collection, analysis, and interpretation of data, and in writing, reviewing, and approval of the final manuscript.