
Abstract
Two-dimensional monolayer cell proliferation assays for cancer drug discovery have made the implementation of large-scale screens feasible but only seem to reflect a simplified view that oncogenes or tumor suppressor genes are the genetic drivers of cancer cell proliferation. However, there is now increased evidence that the cellular and physiological context in which these oncogenic events occur play a key role in how they drive tumor growth in vivo and, therefore, in how tumors respond to drug treatments. In vitro 3D spheroid tumor models are being developed to better mimic the physiology of tumors in vivo, in an attempt to improve the predictability and efficiency of drug discovery for the treatment of cancer. Here we describe the establishment of a real-time 3D spheroid growth, 384-well screening assay. The cells used in this study constitutively expressed green fluorescent protein (GFP), which enabled the real-time monitoring of spheroid formation and the effect of chemotherapeutic agents on spheroid size at different time points of sphere growth and drug treatment. This real-time 3D spheroid assay platform represents a first step toward the replication in vitro of drug dosing regimens being investigated in vivo. We hope that further development of this assay platform will allow the investigation of drug dosing regimens, efficacy, and resistance before preclinical and clinical studies.
Introduction
Historically, the discovery of oncology drugs has been based on screening collections of compounds using 2D monolayer cell proliferation assays. However, compounds that affect cell proliferation and survival in 2D cultures often fail to have activity in preclinical models and in clinical studies. 1 The use of 2D monolayer cultures for drug discovery in oncology reflects the technical ease of implementation of these assays with standard automation equipment available in high-throughput screening (HTS) laboratories. It also reflects a gene-centric and perhaps simplified view that oncogenes or tumor suppressor genes are the key genetic drivers of cancer cell proliferation, and therefore, inhibiting these tumor driver genes with drugs should prevent tumor growth. However, there is now increased evidence that the cellular and physiological context in which these oncogenic events occur play a key role in how they drive tumor growth and therefore how effective the drugs that inhibit them are in vivo. 2 Cell lines growing as monolayers on a plastic surface are not subjected to the same cellular and physiological microenvironment of a tumor, and therefore, the pharmacological responses obtained in these assays are not as predictive of those obtained in vivo. 3 As many drugs fail to have efficacy in the clinic, there is an unmet biomedical need for ex vivo tumor models that are predictive of drug responses in clinic and help determine drug regimens and possibly resistance to treatments before going into costly clinical studies. As assay and screening technologies evolve, it is now becoming more feasible to develop cellular tumor models that include more physiological aspects of a tumor. In vitro 3D spheroid cell cultures have the potential to bridge the gap between 2D monolayer cell assays and in vivo testing, as well as to enhance the predictability and efficiency of drug discovery in cancer. 4 Many 3D spheroid models of tumors have been reported that attempt to incorporate many of the cellular and physiological complex features of tumors. These include but are not limited to cellular heterogeneity in tumor and nontumor cells, cell attachment mode, cell-cell interactions, effect of the extracellular matrix environment (ECM), and metabolic gradients, such as hypoxia, pH, and nutrients. 5
3D spheroid assays such as the soft agar anchorage-independent growth and clonogenic growth assays have been used for many years, and the challenge for their use in drug discovery is the inability to format them in HTS microtiter plates. Now, several techniques are available that enable the formation of spheroids in 96- and 384-well HTS microtiter plates. 6 Screening platforms that allow formation of spheroids by enhancing cellular aggregation include round-bottom plates with ultralow adherent (ULA) surfaces or the hanging drop techniques. Spheroids of sizes ranging from ~50 to 500 µm in diameter have been grown in wells of microtiter plates using these techniques. These small spheroids may indeed be sufficient to reflect cell-cell and cell-matrix interactions but most likely do not reflect pathophysiological conditions with hypoxic areas in the spheroid center and proliferation and nutrient gradients.7–9
Here we report the establishment of an HTS-compatible, real-time 3D spheroid formation assay in 384-well round-bottom ULA plates. The platform described uses a Hey-A8 cell line constitutively expressing green fluorescent protein (GFP), which enables real-time measurements of spheroid size using an Incucyte Live Cell Analysis System (Essen, BioScience, MI). Additional end-point assays such as adenosine triphosphate (ATP) levels (CellTiterGlo; Promega, Madison, WI) to measure cell viability, propidium iodide (PI) to measure cell death, and bright-field microscopy to characterize the viability and size of the spheroids are used to further benchmark pharmacological responses of a set of 11 chemotherapeutic drugs with different mechanism of action. The data presented here demonstrate that the 384-well, fluorescence-based, real-time 3D spheroid growth assay developed allows one to monitor tumor formation and long-duration drug dosing regimens that can mimic those used in vivo.
Materials and Methods
Cell Culture
A human high-grade serous ovarian carcinoma cell line expressing GFP (Hey-A8–GFP) was provided by Dr. Ernst Lengyel at the University of Chicago and cultured in Dulbecco’s modified Eagle’s medium (DMEM; Gibco, Life Technologies, New York, NY), supplemented with 10% fetal bovine serum (FBS; HyClone, Logan, UT) and antibiotics (1× penicillin/streptomycin [P/S]; Sigma Aldrich, St. Louis, MO). The Hey-A8–GFP cell line was constructed using a lentivirus vector expressing copepod GFP (CD511B-1) and the lentivirus packing kit (LV500A-1).
3D Spheroid Formation Using 384-Well, Round-Bottom ULA Plates
For 3D spheroid formation, Hey-A8–GFP cells were washed with Dulbecco’s phosphate buffered saline (DPBS) (Gibco), trypsinized with 0.25% trypsin (Gibco), counted, and then seeded at 500 cells in 40 µL DMEM per well in a 384-well round-bottom ULA plate (Corning, Corning, NY) by using a Multidrop Combi Reagent dispenser and a small pin cassette (Thermo Scientific, Fisher Scientific, Fair Lawn, NJ). Spheroids were allowed to form for at least 5 days, grown in DMEM, and supplemented with 10% FBS and 1× P/S, 37 °C, 5% CO2, and 95% relative humidity (RH).
IncuCyte Zoom Live Cell Analysis System Assay
Hey-A8–GFP ovarian cancer cells were seeded at 500 cells/well in 40 µL DMEM supplemented with 10% FBS and 1× P/S in a round, clear-bottom 384-well ULA tissue culture plate for 3D spheroids or a flat, clear-bottom 384-well tissue plate for 2D monolayers (Corning 3830 and Corning 3712, respectively). The plates were then placed in the IncuCyte Zoom (Essen BioScience, Ann Arbor, MI) in an incubator set at 37 °C, 5% CO2, and 95% RH. Measurement of GFP signal (fluorescent object area, µm2) for spheroids or percent confluency of GFP-expressing cells for 2D monolayers was done every 4 h. Cells were dosed with the 11 compounds in a 16-point 1:2 dose response, from 100 µM to 2.5 nM, after either 2 or 5 days of 3D spheroid growth or 5 days of 2D monolayer growth. Each dose response was done in duplicate in the same plate.
Cell Viability Assay
To determine the presence of metabolically active cells, a luminescence assay measuring cellular levels of ATP was performed according to manufacturer’s instructions (3D CellTiterGlo; Promega). In total, 30 µL 3D CellTiterGlo was added to the 40 µL of the assay well and incubated at room temperature for 25 min on an orbital plate shaker at 500 rpm, and then relative luminescence units (RLUs) were measured with a Viewlux multireader (PerkinElmer, Waltham, MA).
High-Content Imaging
Hey-A8–GFP spheroids were stained with 10 µg/mL Hoechst dye 33342 (Invitrogen, Carlsbad, CA) and 2 µg/mL PI (Invitrogen) and incubated for 2 h at room temperature. Fluorescence and bright-field images were acquired with a GE InCell 2000 (GE Healthcare, Piscataway, NJ) using a 4× objective. Image analysis to quantitate signal was done with the GE Healthcare’s InCell Developer toolbox (V1.9.2).
Data Analysis
Data were extracted from the readers and processed in GraphPad Prism version 4.0 (GraphPad Software, La Jolla, CA) to fit dose responses and generate IC50 and maximum response (percent activity at the highest dose tested) values for the different readouts. For the InCuyte data, fluorescent object area (µm2) or percent confluency of GFP-expressing cells was processed to calculate an area under the curve (AUC) using GraphPad Prism, and a percent activity was calculated using the AUC for the DMSO treatment growth curve for the same experiment as 100% activity and an AUC of 0 as 0% activity. TIBCO spotfire (PerkinElmer, Akron, OH) was used to generate heat maps for comparison between various data sets, and the Hierarchical Clustering function within TIBCO was used to generate clustering for the responses of the compounds in the different readouts.
Results
Spheroid Formation in a 384-Well Round-Bottom ULA Plate Using Size, Cell Viability, and Death Measurements
The basic characteristics of the 3D Hey-A8–GFP spheroids in the 384-well round-bottom ULA plate were first established by measuring several parameters for spheroid growth, including size, cell viability, and life/death cells. Spheroid size was assessed using area measurements from bright-field and GFP microscopy, spheroid viability was assessed using an ATP-level readout (CellTiterGlo), and live/dead cells were determined using Hoechst staining of all cells and PI staining of dead cells. Microscopy digital images of bright-field, GFP, Hoechst, and PI signals were measured using a magnification of 4× with the InCell 2000 at 5, 8, 11, and 13 days after cell seeding ( Fig. 1A ). After 5 days, Hey-A8–GFP cells had already formed compact spheroids, as seen by the bright-field image. The staining pattern for the nuclear stain Hoechst showed an outer ring staining mostly likely due to lack of dye penetration because of the compactness of the spheroid. At day 5, there was no PI staining in the core of the spheroid, and the GFP staining showed a complete staining of the spheroid, confirming the lack of a necrotic core. From days 5 through 13, the size or number of viable cells in the spheroid did not change significantly. However, from days 5 through 13, the PI staining in the inner core increased and the GFP staining decreased, suggesting that the inner core of the spheroid was becoming necrotic. Figure 1B shows a plot that quantitates the slight increase in area of the spheroids with time. The average area of the Hey-A8–GFP spheroids increased over time from days 5 through 8, plateauing slightly through day 11. In addition to microscopy readouts, the cell viability of the spheroids was determined by measuring cellular ATP levels at different time points of growth using the CellTiterGlo reagent. The viability of the Hey-A8–GFP cells in the spheres as measured by CellTiterGlo is shown in Figure 1B and shows a slow steady increase from days 5 through 11, indicating that the cells in the sphere remain viable during this time period.
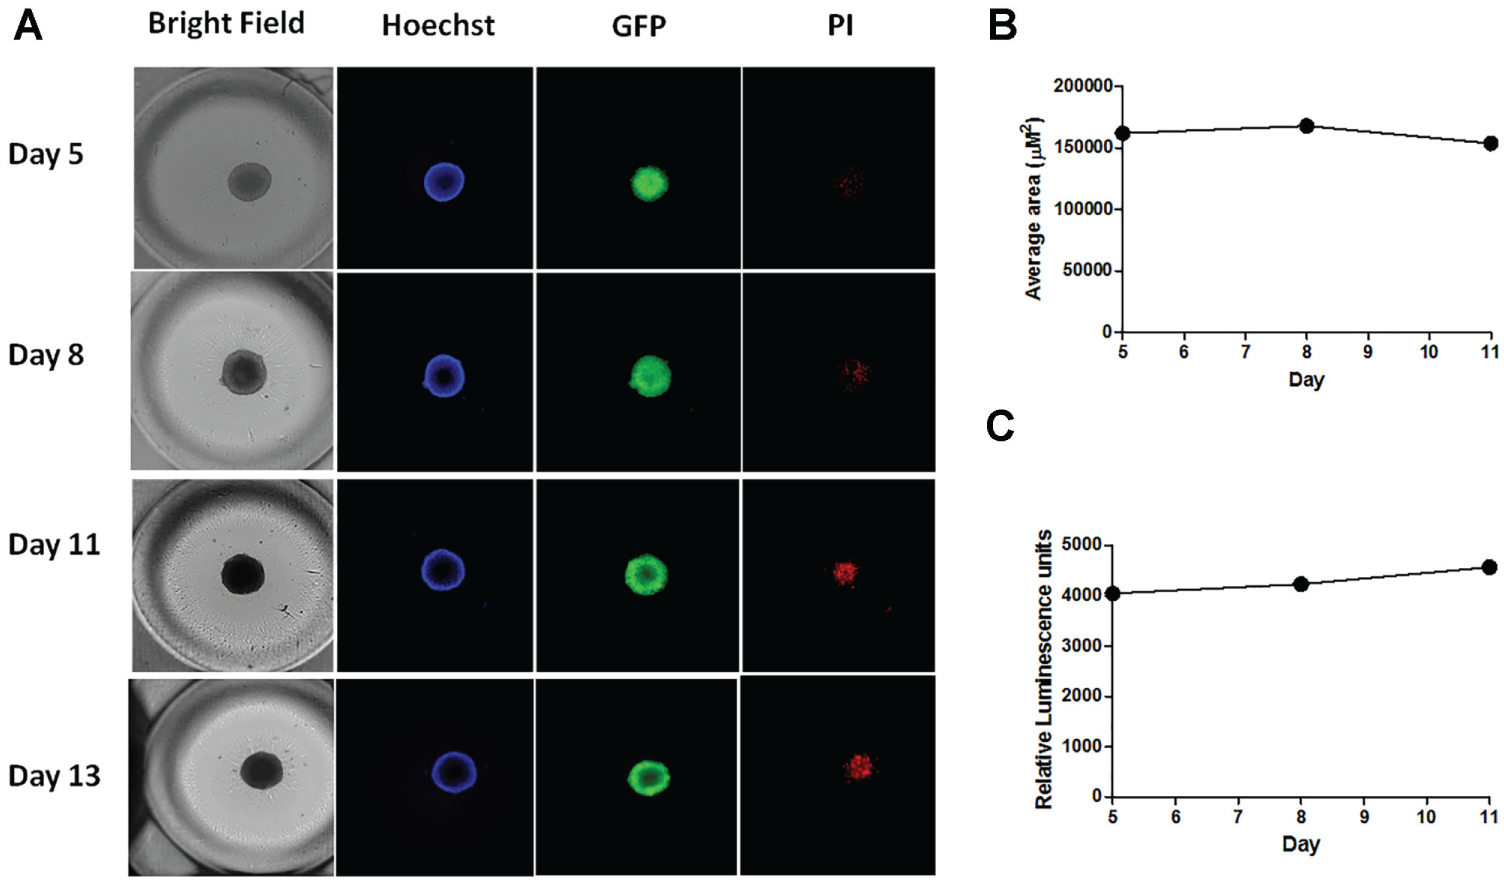
Formation of 3D spheroids in a 384-well round-bottom, ultralow attachment (ULA) plate. (
Real-Time Measurements of Pharmacological Responses on 3D Spheroids
Real-time measurements of spheroid size in response to drug treatment provide an assay system to model drug dosing regimens used in vivo. Sphere formation can be monitored real time using the fluorescence measurement and analysis capability of the IncuCyte Zoom Live Cell Analysis System. The effects of 11 compounds can be tested in a dose response, in duplicate, in a 384-well round-bottom ULA plate by continuously measuring the GFP fluorescence area of the sphere from the Hey-A8–GFP cells. The system allows for very flexible assay designs, particularly regarding the time and duration of compound treatments. The experiments reported here focused on the time of addition of the treatments (48 h after cell seeding when spheroids were forming [
Fig. 2A
, traces corresponding to a dose response of the compound SRT1720, see below] and 120 h after cell seeding, when spheroids had reached almost full growth [
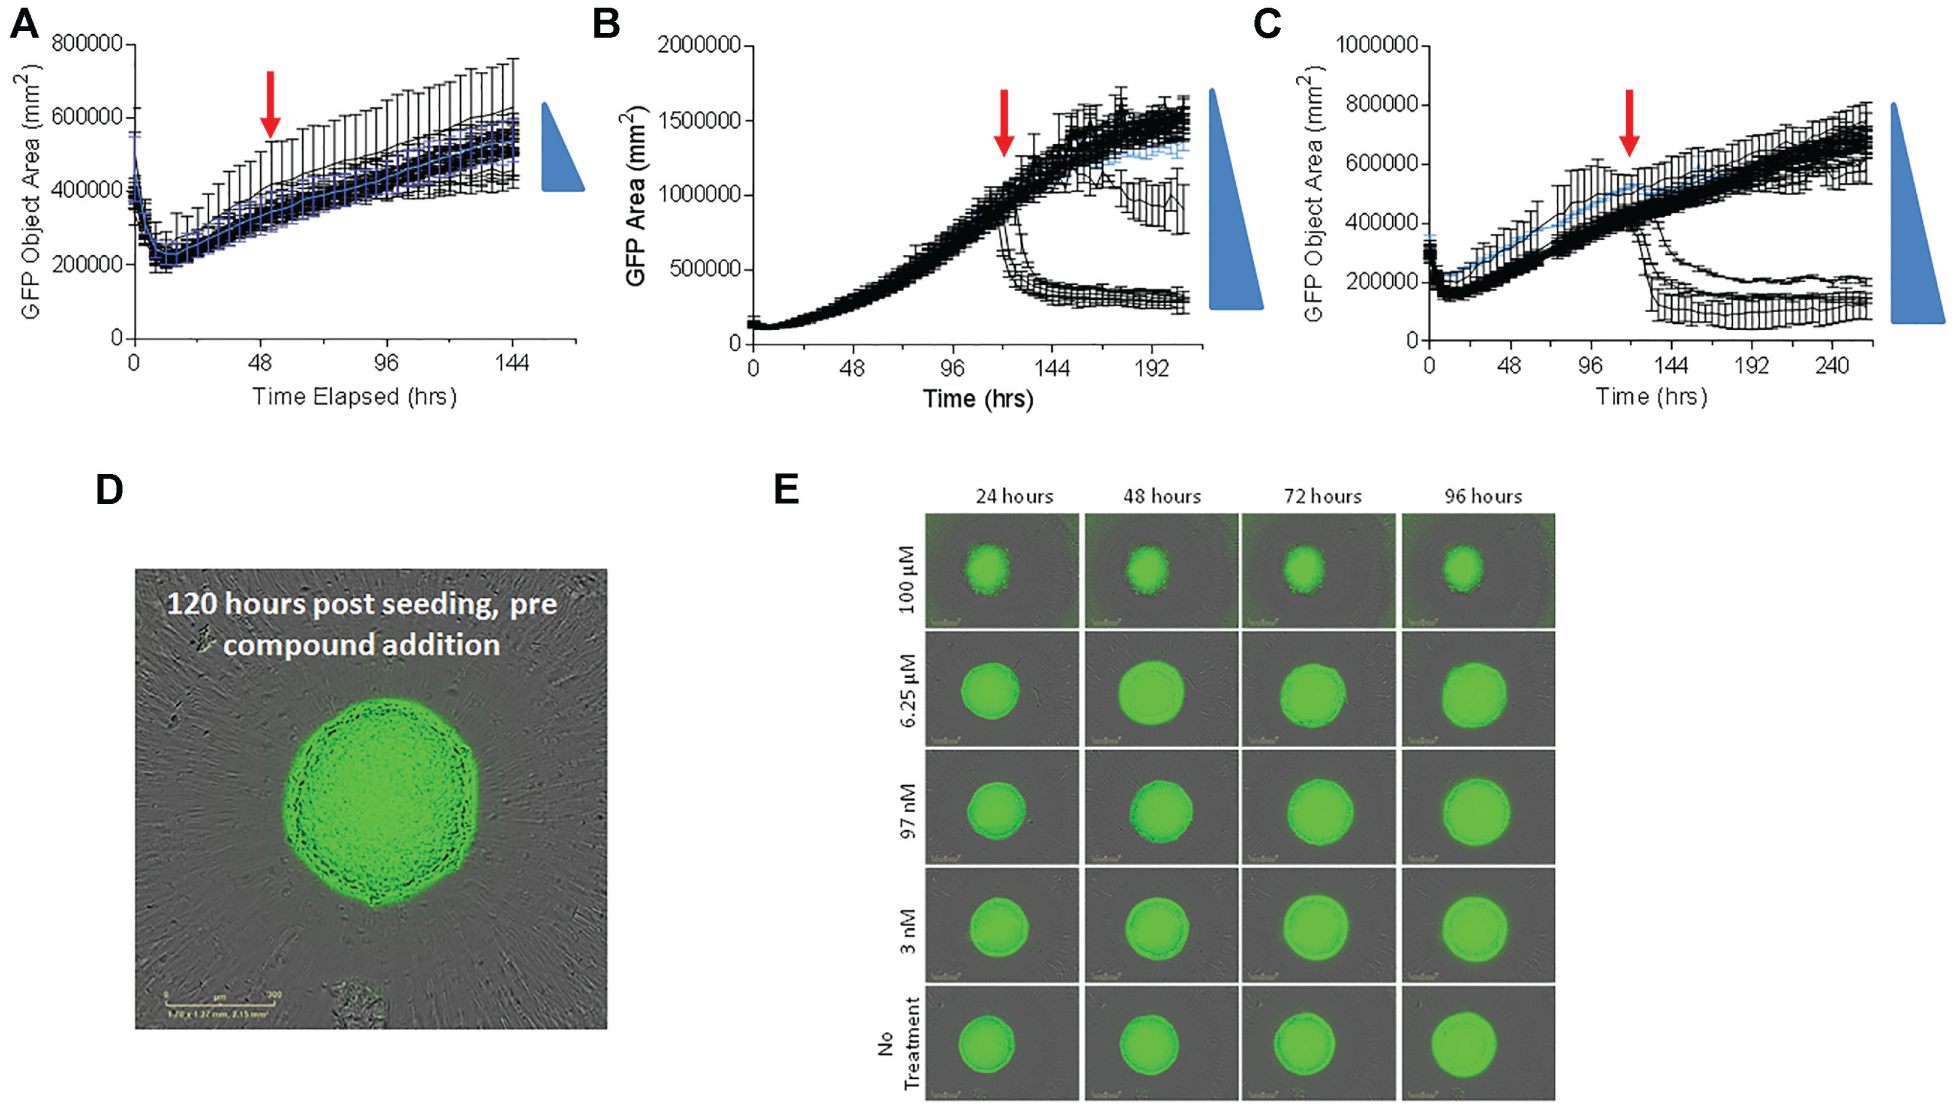
Real-time measurements of Hey-A8–green fluorescent protein (GFP) spheroid growth. IncuCyte Zoom Live Cell Analysis System traces of GFP fluorescent object area changes measured every 4 h. Signal from each time point is a duplicate from two wells, each with one spheroid. Trace in blue indicates the untreated control. Red arrow indicates time of compound addition. Traces in black correspond to a dose response of SRT1720. Blue triangle indicates direction of increased compound dose. Error bars indicate standard error of the mean (SEM). (
Eleven chemotherapeutic agents spanning a range of mechanisms were tested to benchmark the pharmacological responses in the real-time 3D spheroid growth assay. The compound set included three HDAC inhibitors (romidepsin, vorinostat, trichostatin A); everolimus, a mammalian target of rapamycin (mTOR) inhibitor; salonimycin, a compound shown to target cancer stem cells; bardoxolone methyl, an nuclear factor (NF)–κB signaling downregulator; two alkylating agents, temozolomide (TMZ) and carmustine; dasatinib, a Bcr-Abl inhibitor; vinblastine, a tubulin targeting agent; and SRT1720, a sirtuin activator. These compounds were selected because they have previously been shown to be efficacious in in vivo models of ovarian cancer Each compound was tested in an 11-point dose response, in duplicate, and the effect on spheroid size was quantitated by measuring changes in GFP object area and calculating an AUC for the time trace at each dose of compound, from the time of addition of the compounds. Here, AUCs for each compound at each dose were calculated at 96- and 144-h treatments. The dose responses for all the compounds tested in each of the three assay condition are shown in
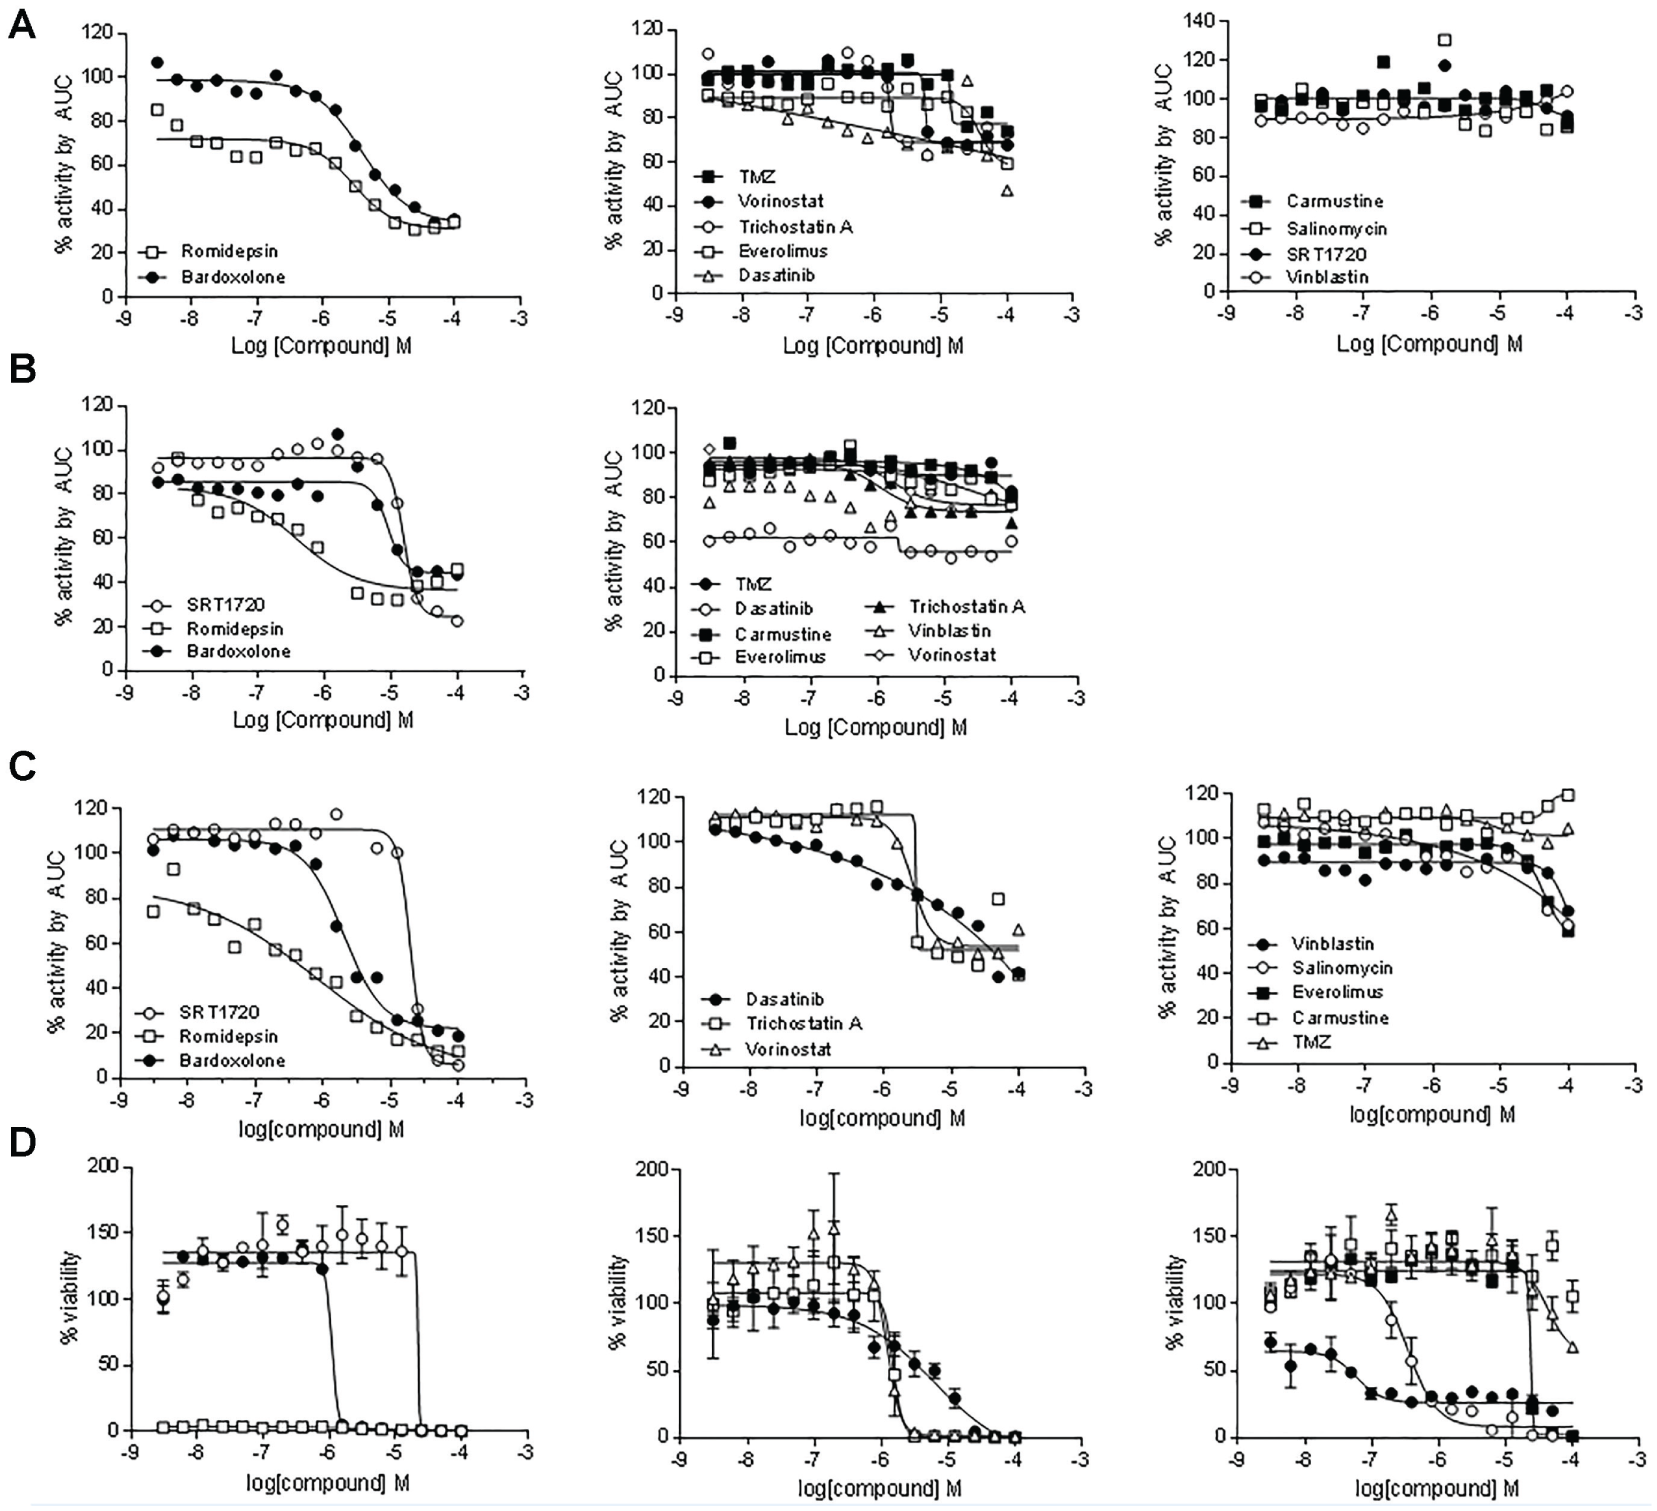
Dose-response plots of percent activity of the area under the curve (AUC) from the IncuCyte Zoom Live Cell Analysis System real-time traces of the green fluorescent protein (GFP) abject area. (
IC50s for Compounds in Assay Conditions.
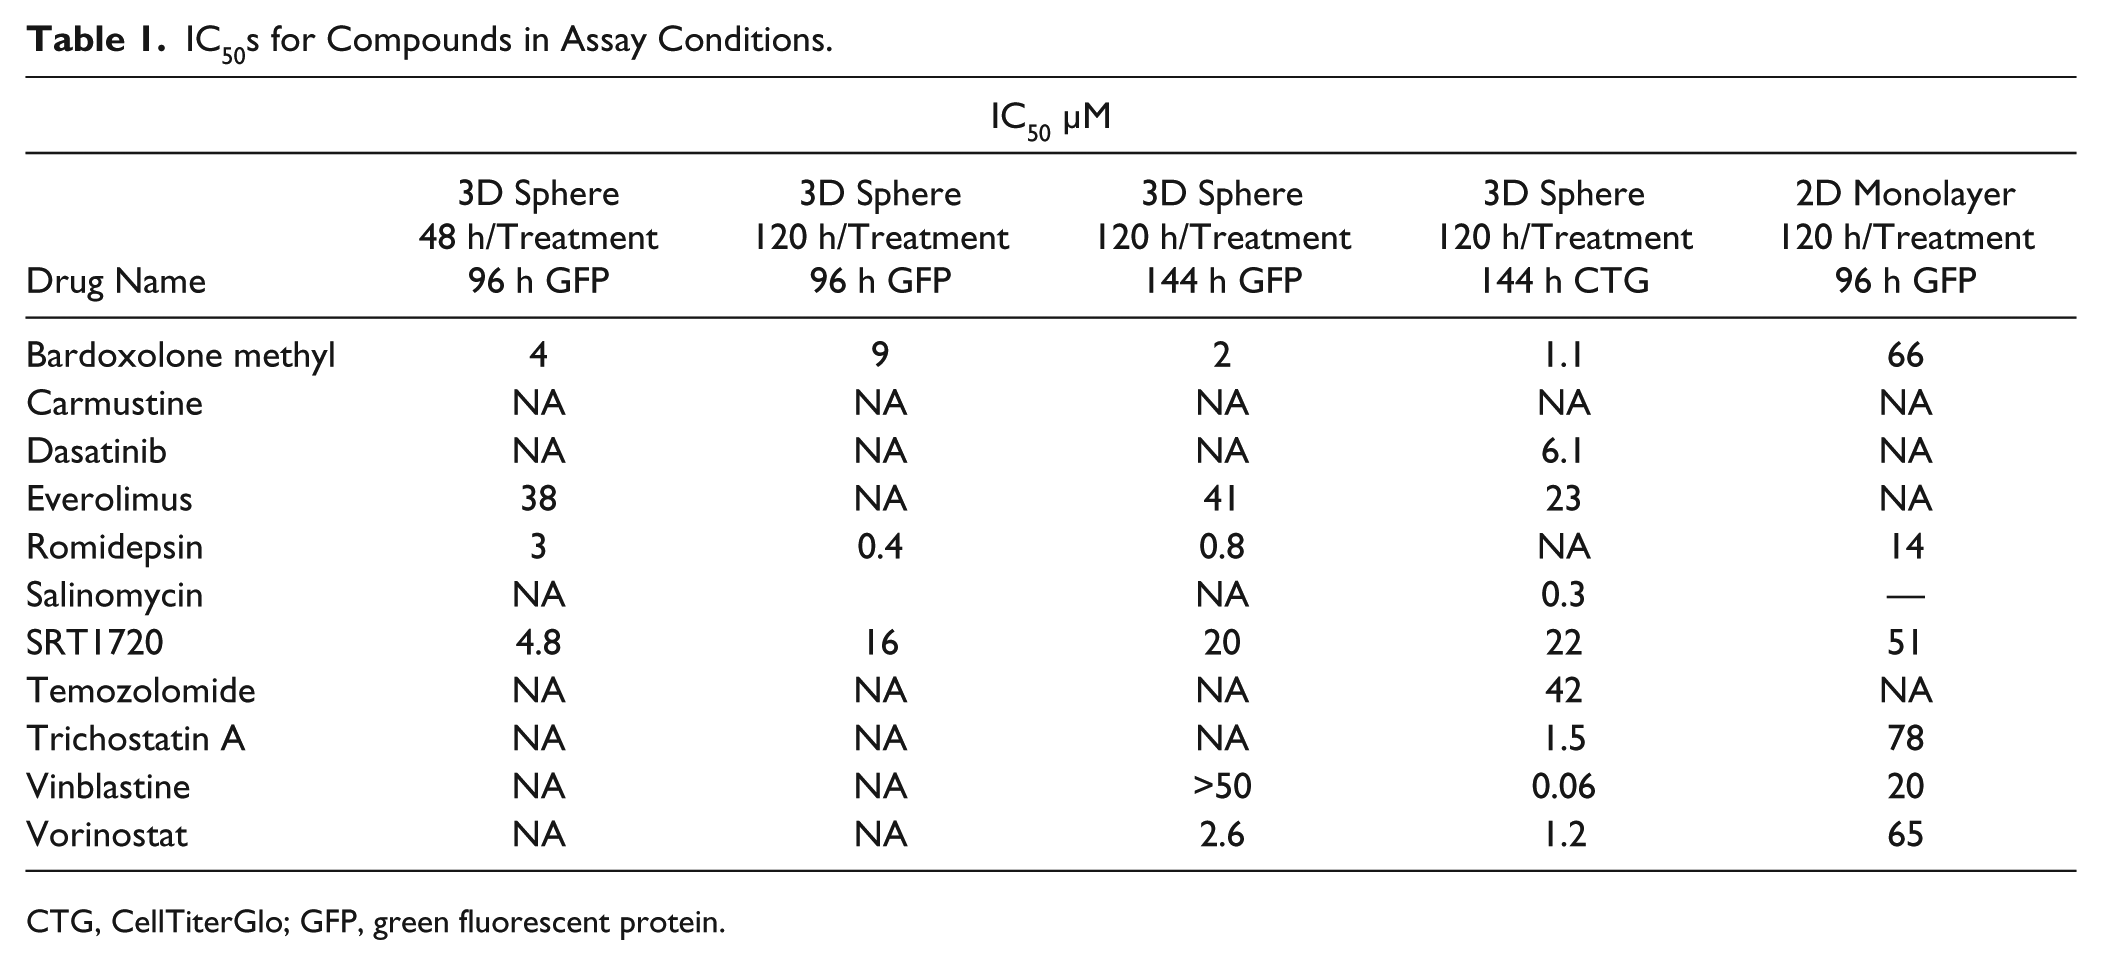
CTG, CellTiterGlo; GFP, green fluorescent protein.
Real-Time Measurements of Pharmacological Responses on Confluent 2D Monolayers
Because these spheroids are generated using a single cell type and no microenvironment features were included in the assay, it is expected that the pharmacological responses will be affected by gradients of cell proliferation rates in the spheres and changes in cell biology due to contacts between cells in the sphere. To determine whether the pharmacological responses obtained from the treatment on spheres are a consequence of reduced cell proliferation rates, drugs were also tested in a 2D monolayer culture 120 h after seeding. At this time, the cells are in a 2D confluent, quiescent monolayer. The plots in Figure 4A show real-time traces of Hey-A8–GFP cells growing as monolayers, measuring percent confluence by GFP-expressing cells (left panel) and percent confluence by total number of cells using phase contrast (right panel). The plots also include traces for a dose response of SRT1720 added 120 h after cell seeding. Figure 4B shows images of the confluent cells after 120 h of incubation (left panel) and the effect of SRT1720 at increasing doses (left), showing how it reduces the number of GFP-expressing cells at higher doses. Figure 4C shows plots of dose responses of the compounds using the percent confluency by GFP-expressing cells to calculate AUC. As shown in the left panel of Figure 4A , although SRT1720 had an effect on GFP-expressing cells in 2D, it did not affect percent confluency of the total number of cells by phase contrast, and similarly, none of the compounds had any effect on the percent confluency of the total number of cells by phase contrast. When measuring the effect of the compounds on percent confluence of GFP-expressing cells in 2D, SRT1720, vinblastine, and vorinostat are strongly efficacious at the highest doses, but they are in general weak in potency. Bardoxolome methyl, dasatinib, romidepsin, and trichostatin A are only weakly efficacious, and at the highest dose, they inhibit percent confluence by more than 50%.
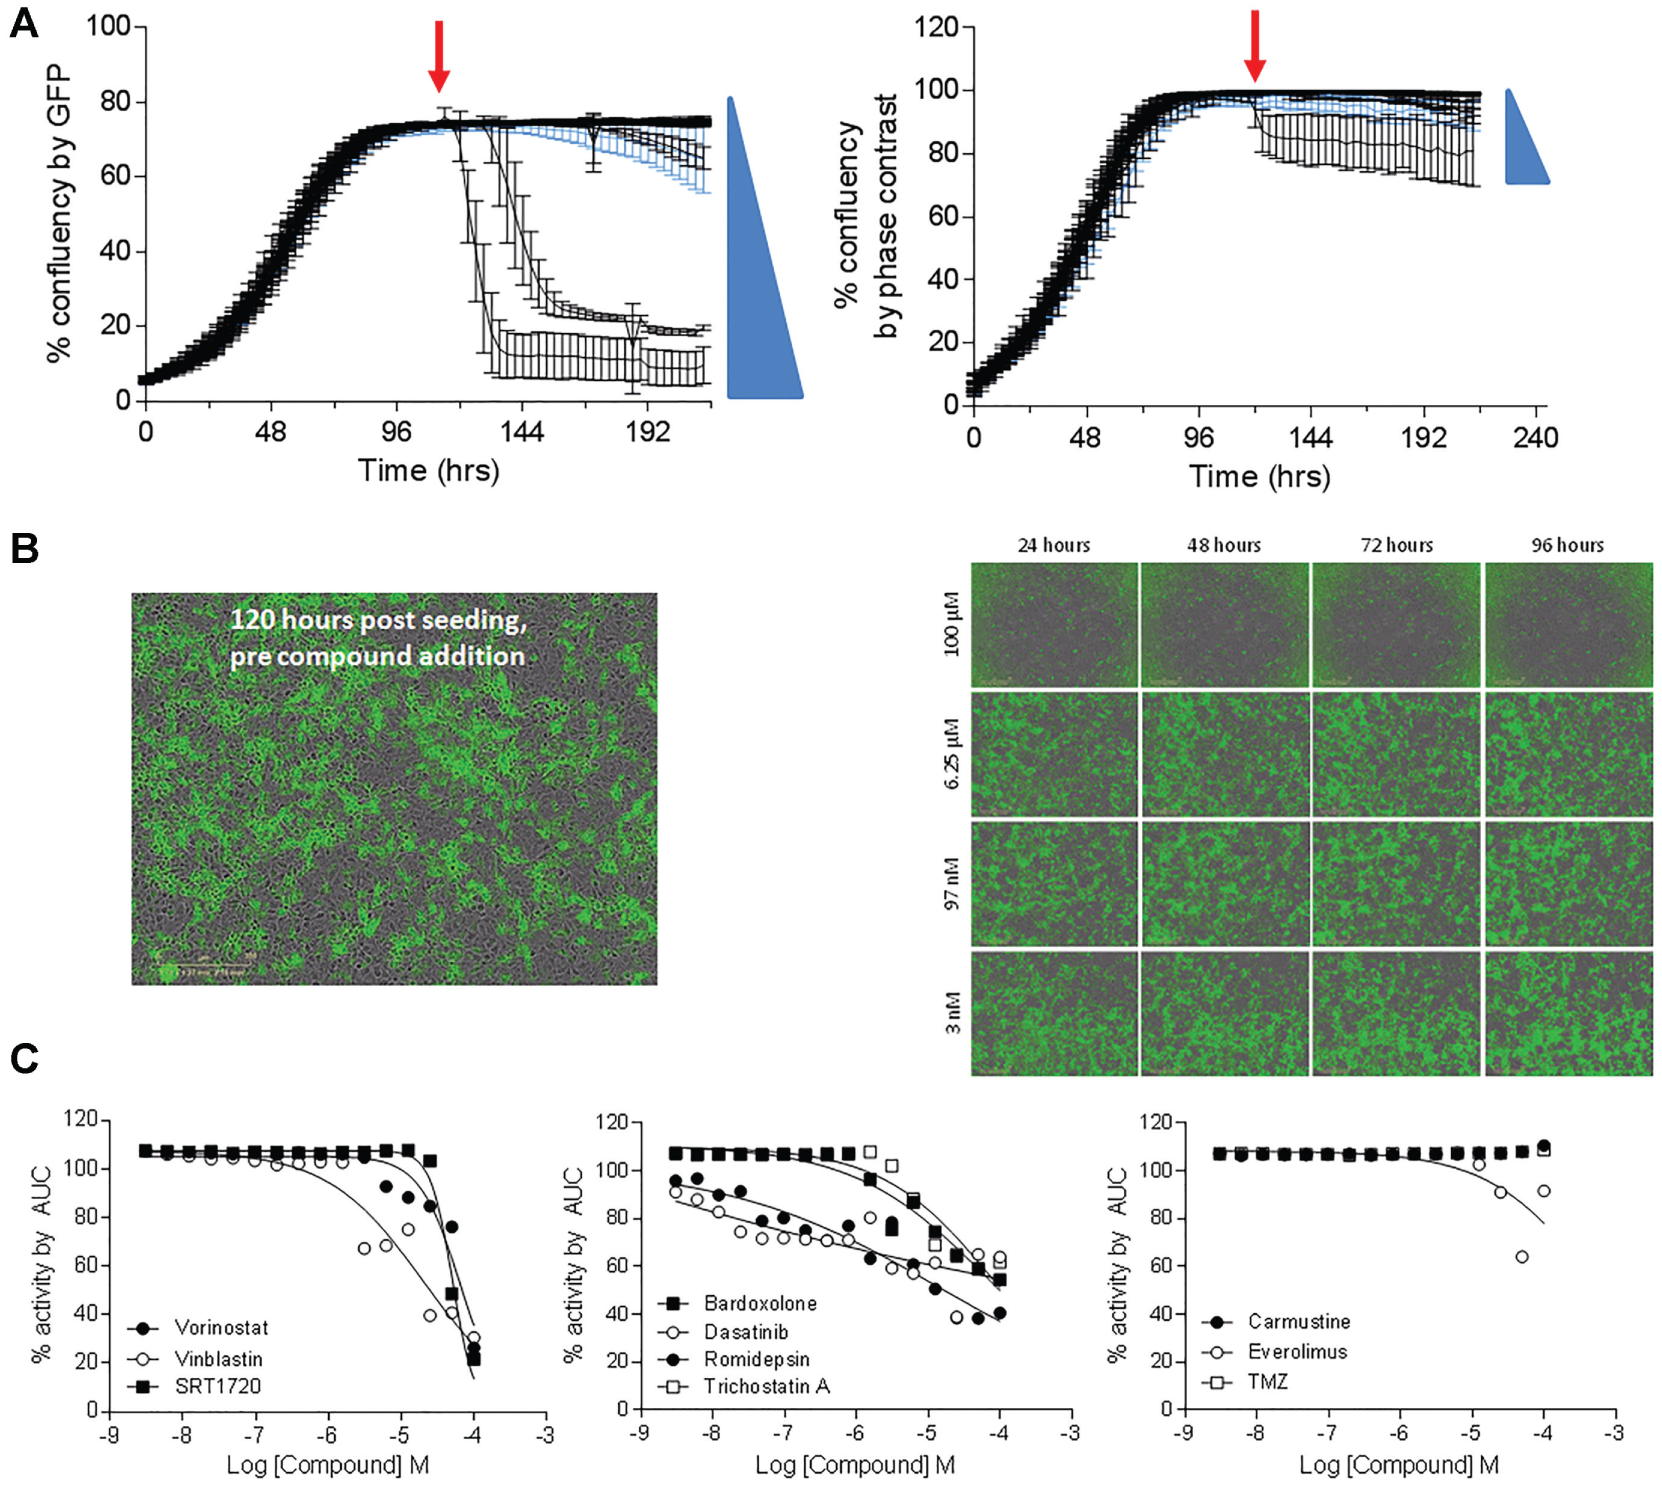
Real-time measurements of Hey-A8–green fluorescent protein (GFP) 2D monolayer growth using the IncuCyte Zoom Live Cell Analysis System. (
Multiparametric Validation of Pharmacological Responses on Hey-A8 3D Spheroids
Bardoxolone methyl, SRT1720, and romidepsin were the three chemotherapeutic agents that were potent and efficacious in 3D spheroids treated from 96 to 144 h after 120 h of growth as determined by both their dose-dependent decrease in GFP fluorescence and viability, as shown in Figure 3B–D . We then looked at the effect of these chemotherapeutic agents on different morphological parameters of the Hey-A8–GFP spheroids after 120 h and 72 h of treatment using several assay parameters, including spheroid integrity as determined by bright-field microscopy and GFP fluorescence and live and dead cell populations as measured by Hoescht and PI staining. Images of Hey-A8–GFP spheroids treated with bardoxolone methyl, SRT1720, and romidepsin are shown in Figure 5 . Treatment of 3D spheroids with bardoxolone methyl ( Fig. 5A ) resulted in a dose-dependent decrease in GFP fluorescence and a dose-dependent increase in PI staining, indicating an increase in the dead cell population with increasing concentration of the drug from 1.5 nM to 50 µM. The bright-field image shows the spheroid integrity remains intact. Similarly, treatment with SRT1720 ( Fig. 5B ) shows a pattern of decreasing GFP fluorescence and increased PI staining with increasing concentrations of the drug. However, a decrease in spheroid size at higher concentrations of the drug is observed. Treatment of the spheroids with romidepsin ( Fig. 5C ) showed that this drug is very potent, and even at the lowest doses, there is complete disappearance of GFP fluorescence signal and an appearance of PI staining, indicating cell death within the sphere, which is otherwise intact, although it looks smaller but more compact by bright-field microscopy.
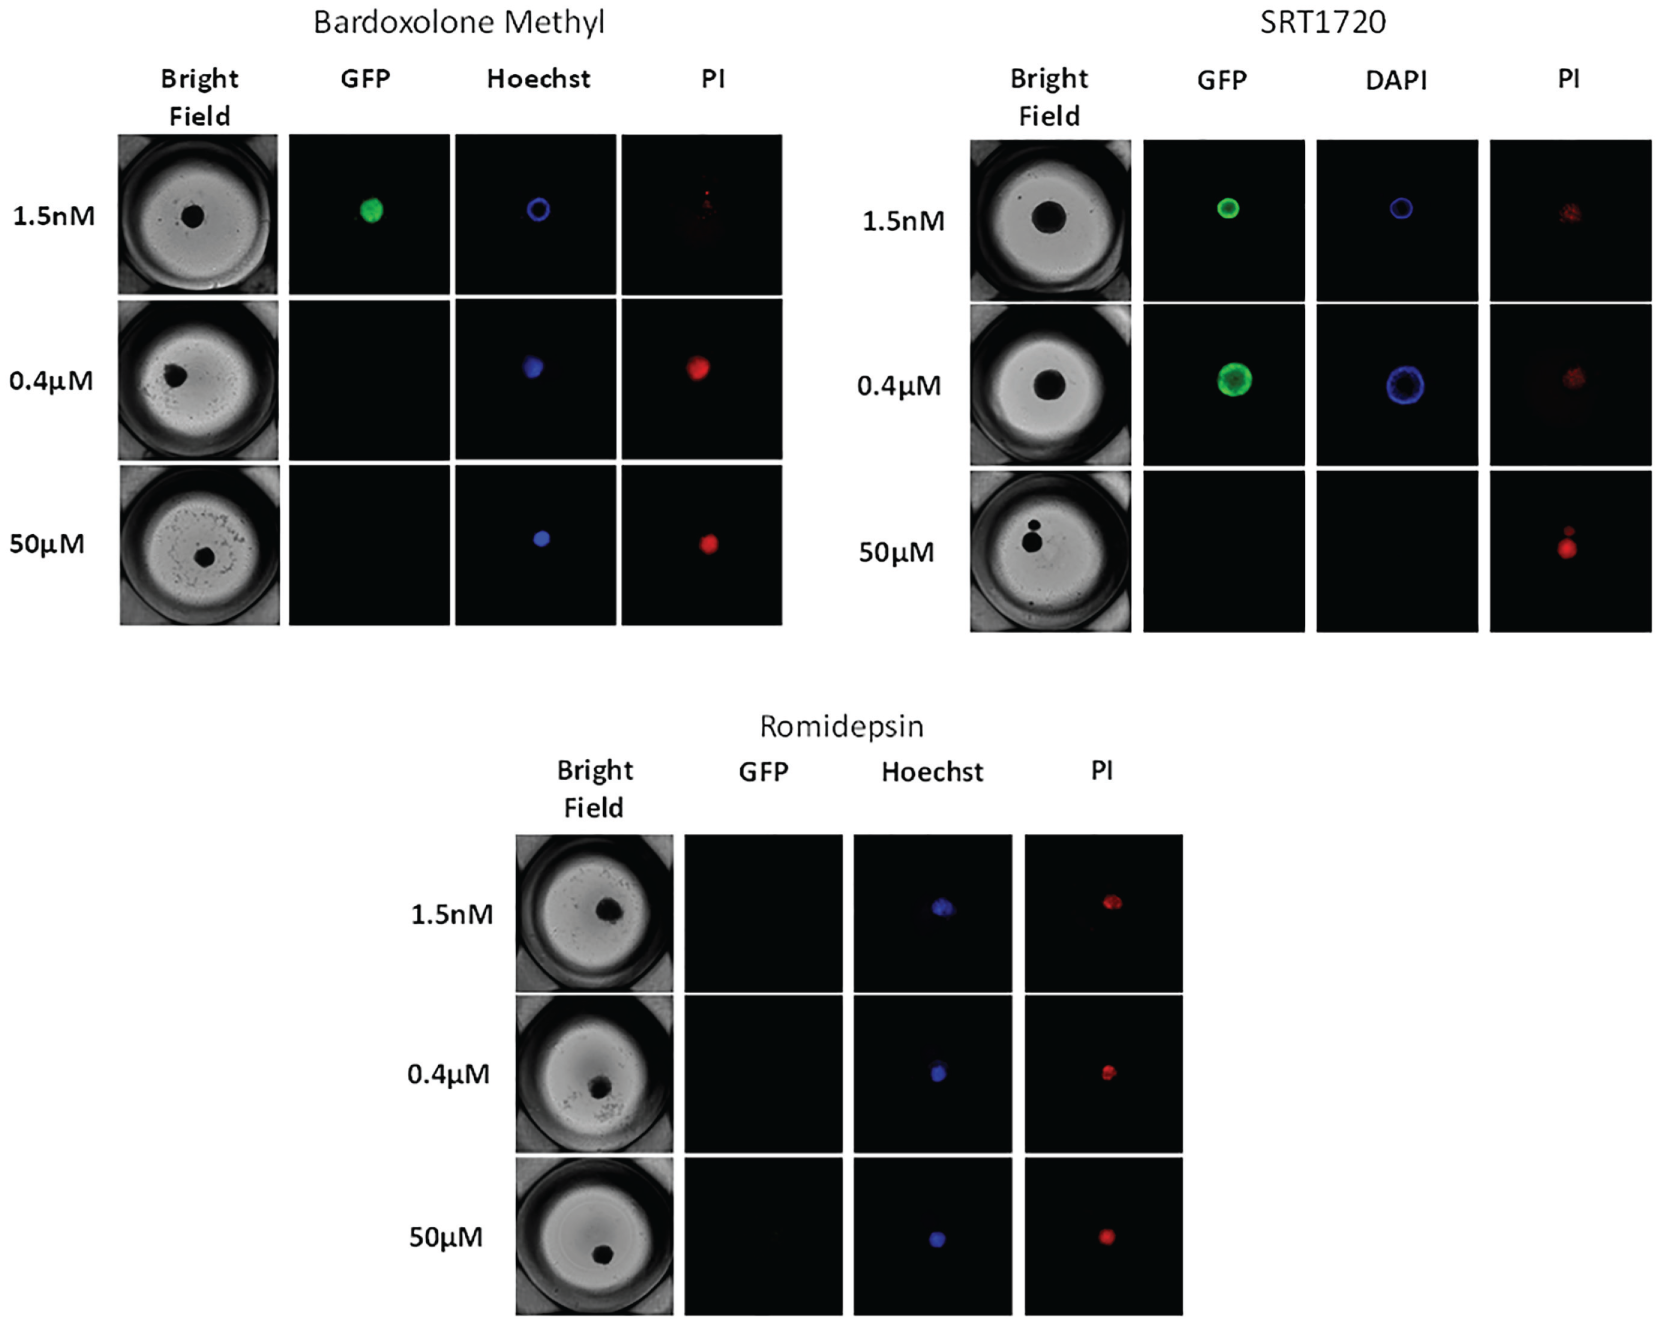
Images of Hey-A8 spheroids after 120 h of growth and subsequent treatment with bardoxolone methyl, SRT1720, and romidepsin for 72 h at the doses indicated. Images were collected with a GE InCell 2000 high-content reader using a 4× objective.
Discussion
In vitro model assays that are designed to recapitulate cellular context by reestablishing key physiological cell-cell and cell-ECM interactions in 3D offer the opportunity to screen and study compounds in a more therapeutically relevant setting that will hopefully be more predictive of pharmacological responses in vivo and in the clinic. 10 3D spheroid cultures of cancer cells are being used as tumor models and to probe the function of potentially therapeutically relevant genes and pharmacological treatments in a more relevant in vitro setting.11,12 It has been shown that cancer cells in 3D cultures have marked differences in genotype and phenotype compared with conventional 2D monolayer systems. 13 Pharmacological responses of chemotherapeutics have also been shown to be different in these 3D spheroid models compared with 2D monolayer cultures. 14 The complexity of the 3D spheroid models that have been reported varies, including single cell-type systems, multicell types, and those including aspects of the tumor microenvironment such as ECM. 15 In parallel, platforms are being developed to enable the formation of these 3D spheroids in a 96- and 384-well screening format to increase the number of the compounds that can be practically tested. In most cases, the assays used to screen using spheroids are end-point assays, which limits the assay conditions in which to test the compounds. Assays that measure the real-time effect of drugs on 3D spheroids are needed to be able to mimic dosing regimens used in vivo. This report illustrates the development of a real-time 3D spheroid high-throughput assay for studying spheroid size, followed by validation of the drug responses using cell viability and survival studies on the 3D spheroids.
Spheroid size is an important consideration when comparing chemotherapeutic responses because cell metabolism, proliferation, and survival state vary within the spheroids as they grow larger, and nutrient and oxygen gradients become more pronounced. As shown in Figure 1A , Hey-A8–GFP 3D spheroids in a 384-round bottom ULA well grow to a diameter of approximately 400 µm. Spheroids with a diameter between 400 and 700 µm have regions of hypoxia and proliferation gradients that might resemble a more pathophysiological condition. 8 The spheroid generated here reached almost its full size after 5 days, but it took another 6 days before a core of dead cells was apparent, most likely due to lack of nutrients and hypoxic conditions. When studying the effect of drugs on 3D tumor spheroids, it is therefore important to establish the time of initiation of treatment because in early stages (less than 5 days), the cells are rapidly proliferating, forming the sphere, and at later stages (after 5 days), the cells in the inner core are likely not to be proliferating and are beginning to be nutrient starved and hypoxic. 16 In this study, dosing of the compounds was done at 48 h and 120 h after cell seeding while the 3D spheroid was still growing and was almost fully formed but not yet with a core of dead cells, respectively. In our real-time measurements of the growth and effect of the compounds on the tumor size, SIRT1720 (a sirtuin activator), romidepsin (a pan-HDAC inhibitor), and bardoxolone methyl (a NRF2 activator that inhibits the NF-κB pathway) were shown to be the most effective compounds. As described previously, SRT120 shows a potent decrease in GFP object area in spheroids grown for 120 h but has no effect on spheroids grown for 48 h. SRT1720 is only very weakly active in confluent 2D monolayer cultures with an IC50 of 51 µM. It has been recently reported that SIRT1 activation leads to increased in vitro and in vivo cytotoxicity in multiple myeloma by an ataxia-telangiectasia mutated (ATM)-dependent mechanism. Various groups have independently reported the very strong ATM-dependent DNA damage response that is functional and overactive in 3D spheroid models under conditions of hypoxia. 16 The potent mechanism of action of the SIRT1 activator could be attributed to the formation of a hypoxic core after spheroid formation for 120 h compared with 48 h. In contrast, romidepsin, an HDAC1 inhibitor, is equally efficacious at causing a loss in GFP fluorescence in spheroids grown for both 48 and 120 h but is slightly more potent in the spheroid model treated at 120 h with an IC50 of 0.4 µM compared with 3 µM. Conversely, romidepsin is not as potent in decreasing GFP fluorescence in a confluent 2D monolayer assay, with an IC50 of 14 µM, which suggests that the effects seen in 3D spheroids are likely not a consequence of cells not proliferating and epigenetic downregulation of GFP expression. For bardoxolone methyl as well, the time of dosing seems not to be the critical factor in determining efficacy on spheroid growth. Treatment with bardoxolone methyl at 48 and 120 h after growth shows a dose-dependent decrease in GFP fluorescence over 96 h with IC50s of 4 and 9 µM, respectively. However, the effect of bardoxolone methyl was much more potent when it was assessed at 144 h posttreatment, with an IC50 of 2 µM. This decrease in GFP fluorescence was mirrored by the decrease in viability in the same 3D spheroid model with an IC50 of 1.1 µM. Bardoxolone methyl also had a marginal effect on confluent 2D monolayer cultures with an IC50 of 66 µM. Bardoxolone methyl is a NRF2 activator, and it would be expected to be much more efficacious under stress conditions, such as nutrient depravation and hypoxia. The general differences observed in drug potency and efficacy in our assay conditions, depending on the size of the sphere, the time of dosing, and the duration of the treatment, illustrate the importance of these two parameters when designing physiologically relevant 3D spheroid-based assays for drug discovery.
The ability to increase the throughput of real-time 3D spheroid-based assays will enable the generation of pharmacological profiles of chemotherapeutic agents and will hopefully be more predictive of efficacy preclinical and clinical studies. We envision that the same basic approach can be used while increasing the complexity of the 3D spheroid model but adding additional cell types to the sphere, such as cancer-associated fibroblast or macrophages, and elements of the tumor microenvironment such as ECM and vasculature components. Furthermore, dosing studies with on and off phases to study recurrence and resistance can be practically implemented with this system for lengths of times of weeks, which are closer to the times evaluated in vivo and much longer than possible in 2D monolayer systems. The ease of handling of the protocols described herein for highly robust and reproducible spheroid culturing and real-time measuring of spheroid size, coupled with end-point assessment of morphology and cell viability, will enable the inclusion of such an assay as part of the standard repertoire for cancer drug testing.
Footnotes
Declaration of Conflicting Interests
The authors declared no potential conflicts of interest with respect to the research, authorship, and/or publication of this article.
Funding
The authors disclosed receipt of the following financial support for the research, authorship, and/or publication of this article: This work was funded by the NIH Intramural Research Program to the National Center for Advancing Translational Sciences.