
Abstract
Dysregulation of the basal autophagic flux has been linked to several pathological conditions, including neurodegenerative diseases and cancer. In addition, autophagy has profound effects on the response of tumor cells to therapy. Hence, the search for pharmacological modulators of autophagy is of great clinical relevance. We established a drug screening assay in which the autophagic flux is measured by recording the fluorescence emission of the tandem fusion protein mRFP-GFP-LC3 by dynamic live-cell imaging. We optimized the assay for the identification of autophagy modulators in three dimensions with U343 glioma cell spheroids, which represent a more realistic cancer model than conventional 2D cell cultures. We validated the assay by screening a library of known autophagy modulators. As the first application, a small library of 94 natural compounds was screened for its impact on autophagy. We discovered the cyclic ionophore nonactin as a new and potent autophagy inducer. This novel autophagy screening assay based on 3D tumor spheroids is robust, reproducible, and scalable. It provides a valuable tool for both basic research and drug screening campaigns.
Introduction
Autophagy is an intracellular catabolic process based on lysosomal degradation. The dysregulation of autophagy (e.g., at level of the PI3K/AKT/mTOR signaling pathway; Fig. 1a ) is involved in the formation and progression of neurodegenerative diseases and tumorigenesis. 1 Thus, the search for potent and pharmacologically suitable autophagy modulators is performed in industry as well as in academia. 2
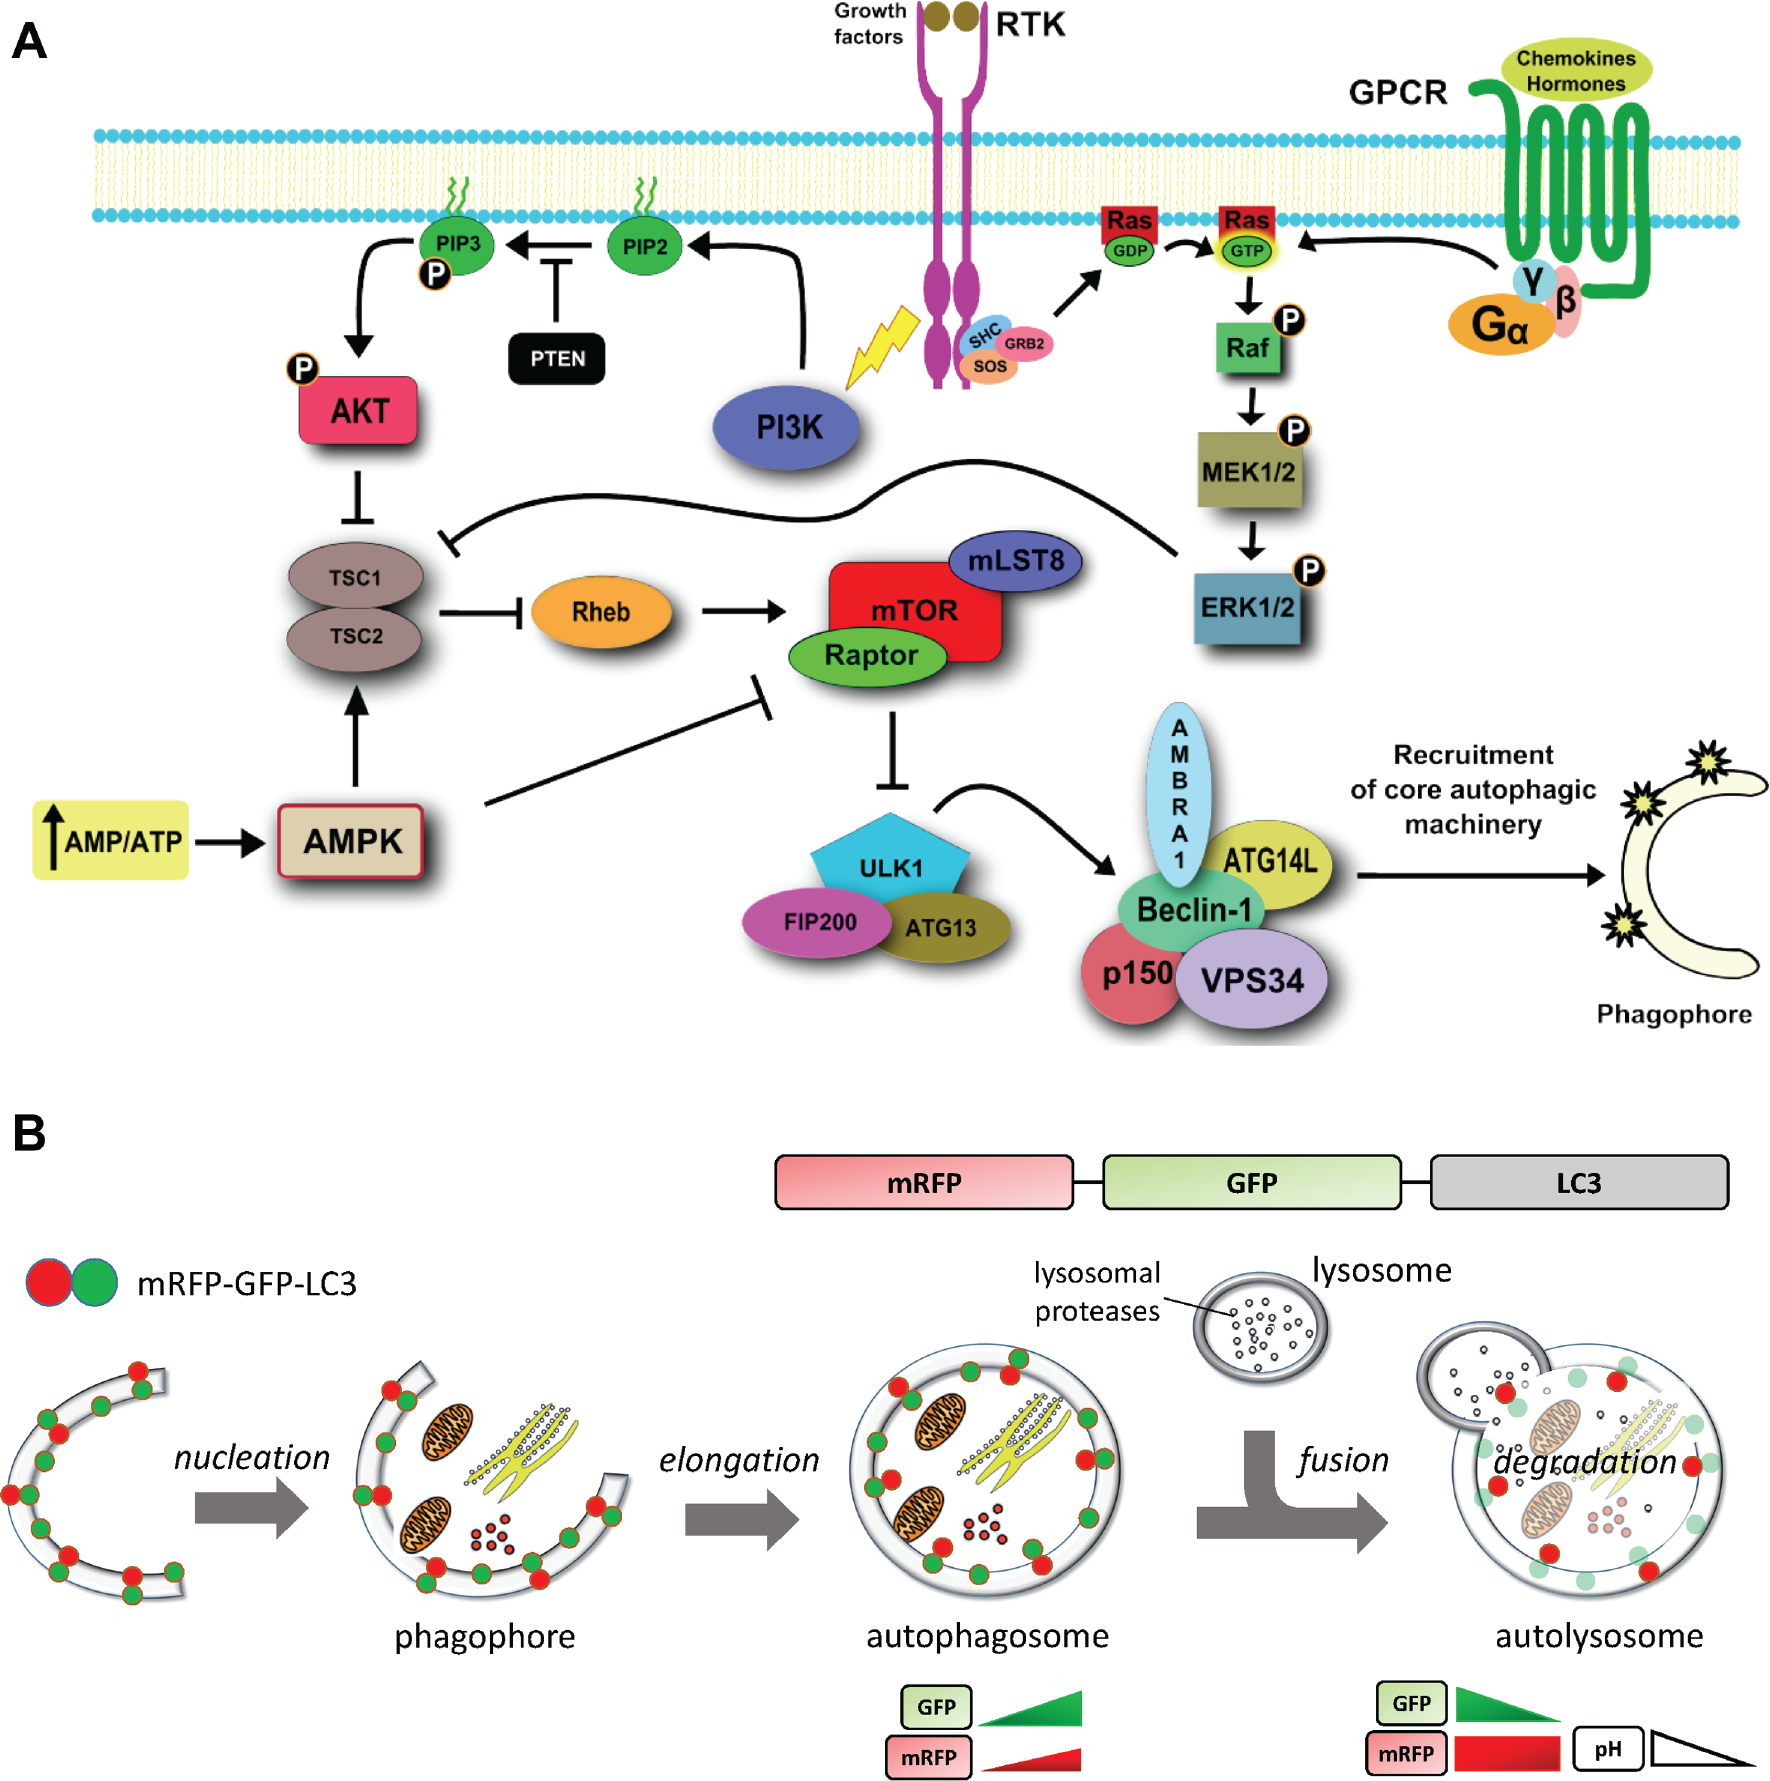
Autophagy pathways and the principle of the autophagy sensor mRFP-GFP-LC3. (
The dynamic process from the formation of autophagosomes to the cargo digestion in the autolysosome is generally known as autophagic flux. According to the widely accepted autophagy measurement guidelines, experimental methods that provide static “snapshots” of the autophagic flux, such as the detection of the expression of autophagy proteins with sodium dodecyl sulfate polyacrylamide gel electrophoresis (SDS-PAGE), can lead to wrong interpretation of the results. 3 Only time-resolved methods, such as fluorescence live-cell imaging, provide a comprehensive description of the autophagic flux. Autophagy is straightforwardly monitored by imaging fluorescent constructs of the ubiquitin-like LC3 protein (microtubule-associated protein 1A/1B light chain 3), which is bound to the autophagosome membrane from its formation until the lysosomal degradation. 3 In particular, the fluorescent tandem construct mRFP-GFP-LC3 distinguishes the autophagosome and the autolysosome populations in live cells due to the quenching of green fluorescent protein (GFP) signal in the acidic lysosomal environment 4 ( Fig. 1b ). The usual approach measures the autophagic flux by counting fluorescent autolysosomal and autophagosomal puncta. 3 However, this method has several drawbacks. First, a reliable segmentation pipeline to identify the puncta is required. Second, it is difficult to discriminate autophagosomes against aggregates of the reporter protein. Third, due to the high variability among cells and the further variability in the morphology and intracellular localization of the puncta, 5 a large cell population is required to achieve statistical significance and robustness of the data. Fourth, strict criteria that avoid experimental biases and robust image-processing algorithms are required. 6
These drawbacks are overcome by flow cytometry, which analyzes mRFP-GFP-LC3 expressing cells at the population level. 7 However, flow cytometry of adherent cells requires trypsinization, which is a stressful step and influences the autophagic response. Moreover, since flow cytometry is not an imaging technique, a microscopic assessment of the cellular phenotype is not possible.
To increase both the reliability and the physiological significance of cell-based assays testing autophagy, we have developed a semiautomated screening of autophagy modulators (both inducers and inhibitors) based on wide-field fluorescence time-lapse imaging of cellular spheroids. The spheroids are formed with U343 glioblastoma cells expressing the fusion protein mRFP-GFP-LC3. The autophagic flux is measured by the ratio of the fluorescence intensity emitted by monomeric red fluorescent protein (mRFP) and GFP over time.
Physiologically relevant cellular models are essential for drug discovery and for the validation of the pharmacological activity and toxicity of drug candidates. By mimicking tissue-like cell-cell interactions, cellular spheroids are closer to the tissue physiology compared with 2D cultures of isolated cells. 8 Spheroids are easily obtainable from most cell lines as well as from primary cells and do not require the addition of an exogenous scaffold to aggregate. Cellular spheroids obtained from liver cells are employed in toxicological screens. 9 Recently, a high-content screening with tumor cellular spheroids identified substances that selectively induce cell death in the tumor’s hypoxic core. 10
One striking advantage of analyzing cellular spheroids over 2D cell cultures is that each single spheroid comprises a large population of interacting cells ranging from a few hundred to thousands. This potentially allows a more robust and statistically relevant data analysis.
We have previously described a method to measure the autophagic flux in spheroids. 11 Here, we present a novel screening pipeline monitoring the autophagy flux over 24 h in U343 glioma spheroids. Using glioma spheroids in the search of autophagy-modulating substances is motivated by the fact that these tumors frequently exhibit a high degree of resistance to apoptosis. Thus, modulation of autophagy, particularly the induction of autophagy-dependent cell death, is a promising therapeutic approach for this kind of tumor. 12
Here, we screened an autophagy modulator library as a benchmark and a small library of natural compounds as proof of principle for the identification of novel autophagy-modulating drugs. The effects of the drugs at different time points and at different concentrations on the autophagic flux were quantitatively determined. We identified the cyclic ionophore nonactin as a new potent autophagy inducer with pharmacological potential.
Materials and Methods
Autophagy Flux Sensor mRFP-GFP-LC3 (tfLC3)
The autophagic flux was monitored by the tandem fluorescence protein mRFP-GFP-LC3 (tfLC3). The properties of tfLC3 have been described in detail by Kimura et al. 4 The working principle of tfLC3 is schematically shown in Figure 1b .
Cell Culture
The human glioma cell line U343 was used in this work. The measure of the autophagic flux was conducted in U343 cells stably expressing the tandem fluorescent fusion protein mRFP-GFP-LC3 (tfLC3).4,13 The cells were cultured at 37 °C and 5% CO2 in 1× Dulbecco’s modified Eagle’s medium (DMEM) (31053-028; Gibco/Thermo Fisher Scientific, Darmstadt, Germany) supplemented with 10% fetal bovine serum (FBS) (10270106; Gibco Germany), and 2 mM L-glutamate (250300024; Gibco Germany). The cells were cultured up to a maximum confluence of 90% and subcultured up to the 15th passage.
Establishment of a Stable U343-tfLC3 Line with an RCAS Vector
U343 cells stably expressing tfLC3 were produced with the RCAS (replication-competent avian sarcoma-leukosis virus long terminal repeat with splice acceptor) vector system. 14 First, U343 cells were transiently transfected with the avian tumor virus receptor (TVA) by using electroporation (Nucleofector 4.D. transfection system; Lonza, Cologne, Germany). The electroporation was conducted by using the preset “FF150” program. Following electroporation, the cell suspension was cultured with full medium at 37 °C and 5% CO2. After a 1-day incubation, the medium was replaced by the viral stock supernatant, which contained the tfLC3 RCAS vector construct. The transfected cells expressed visible levels of mRFP-GFP-LC3 within ~3 to 7 days. Finally, the transfected cells were sorted by fluorescence-activated cell sorting (FACS) to isolate the cell population expressing tfLC3.
U343-tfLC3 Spheroid Formation
For the natural compound screening, the spheroid formation was accomplished in 384-well plates by the liquid overlay method.
15
First, each well of a 384-well plate was coated with 15 µL of 1% low melting point agarose. The coating was accomplished automatically with a pipetting robot (Hamilton, Martinsried, Germany; Microlab STARlet liquid handling workstation) by using custom-programmed pipetting layouts (see
The benchmark test of the autophagy modulator library was performed in 96-well plates. For 96-well plates, all the previously discussed steps were performed manually with an eight-channel pipette (Eppendorf Xplorer plus, Eppendorf AG, Hamburg, Germany).
Compound Libraries and Drug Screening Setup
Autophagy library
The Enzo Life Sciences (Lörrach, Germany) Screen-Well Autophagy library was used as a benchmark to identify and optimize the screening parameters. The library contains compounds with known autophagy-modulating effects. The list of compounds is given in
Natural compounds library
The library is a subset of the Enzo Life Sciences Screen-Well natural compounds library. The subset comprises 94 drugs of natural origin. The compound list is provided in
Time-Lapse Fluorescence Microscopy
Long-term time-lapse fluorescence imaging of the live tfLC3 U343 spheroids was performed with an inverted Zeiss (Carl Zeiss AG, Oberkochen, Germany) Cell Observer automated wide-field fluorescence microscope equipped with incubator box and environmental control system. The microscope is controlled by the Zeiss ZEN Blue software (version 1.1.1.0). The environmental parameters in the incubator box were set accordingly to standard cell culture conditions (37 °C, 5% CO2). Images were recorded over 24 h at an interval of 1 h for each channel (bright-field, GFP, and mRFP) and each well. The acquisition parameters are given in
Image Processing, Data Generation, and Data Analysis
The image-processing theory and the procedures for data generation as well as data analysis are described in details in the supplementary methods.
For the quantification of the autophagic flux with the mRFP-GFP-LC3 fluorescent sensor, we assume that the rate of change of the mRFP and GFP emission intensities is proportional to the rate of change of the number of autolysosomes and autophagosomes in the cells, respectively. Thus, the autophagic flux is expressed by plotting the ratio of the mRFP and GFP intensity over time, IR/IG versus t. We verified experimentally this assumption. Indeed, by fluorescence imaging of cells treated with 1 µM rapamycin, we observed a strong increase of the mRFP fluorescence signal over the GFP signal compared with the control (
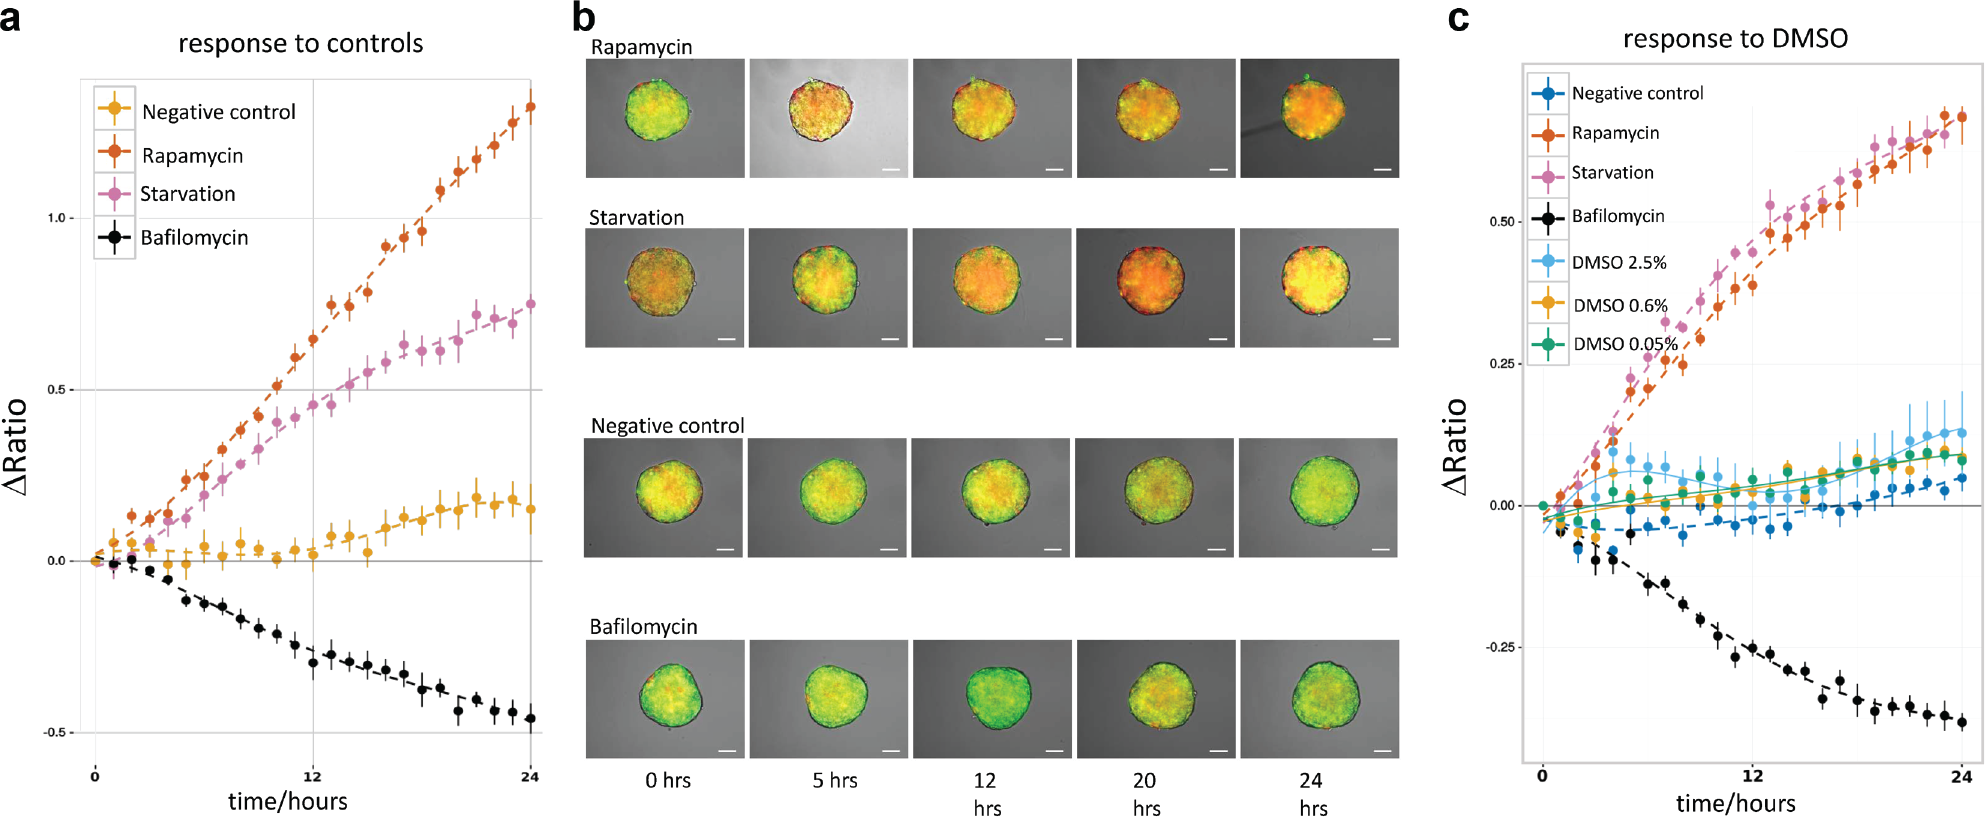
Control experiments. The level of autophagic flux is specified by the ΔRatio over time. An increasing ΔRatio indicates a growth of the autolysosome population and thus the stimulation of autophagic flux. A decreasing ΔRatio indicates the accumulation of autophagosomes and the reduction of the autophagic flux. (
Statistical Analysis
A one-dimensional linear mixed-effects model (LME) was used for the statistical analysis of the data. The detailed procedure is described in the supplemental methods. The results were obtained from six independent measurements, and all data analysis is treated equally.
We considered p values less than 0.05 statistically significant. Compounds with p < 0.001 were considered “strong modulators,” compounds with p < 0.01 were “moderate modulators,” and the ones with p < 0.05 were “weak modulators.”
Data Visualization
To visualize the autophagic flux, the IR / IG ratio was calculated, normalized to time point t = 0 hours, and plotted as “ΔRatio” over time (
Fig. 2
,
Fig. 4
,
Fig. 6
, and supplementary plots). Alternatively, the ΔRatio time evolution was visualized with heat maps (
Fig. 3
,
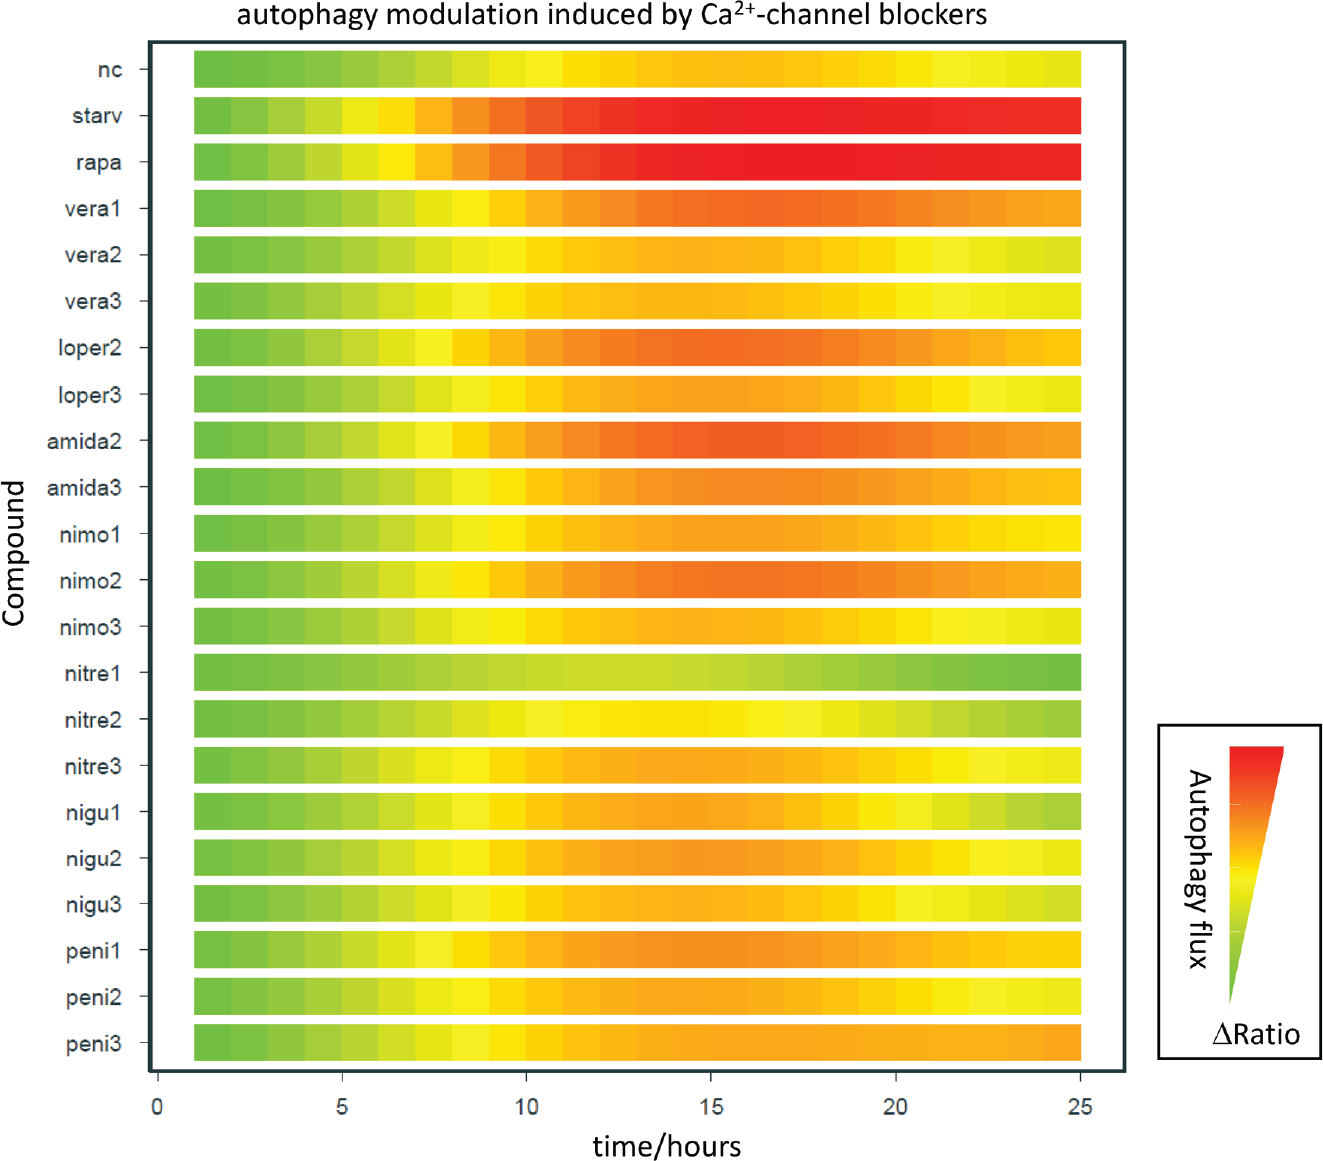
Autophagy modulation by calcium channel blockers. The autophagic flux (ΔRatio/time) is shown as green-red color gradients. Red indicates a high level of green fluorescent protein (GFP) quenching and thus high autophagosomal turnover. Green indicates inhibition of the autophagic flux. Apart from nitrendipine, all calcium channel blockers induce autophagy. nc, negative control; starv, starvation; rapa, rapamycin (1 µM); vera, verapamil; loper, loperamide; amida, amidarone; nimo, nimodipine; nitre, nitrendipine; nigu, niguldipine; peni, penitrem A. 1/2/3 refers to 50 µM/12.5 µM/1 µM, respectively.
Results
Response to Rapamycin, Starvation, and Bafilomycin A1
For the screening of the natural compounds library, we used the prototypical autophagy inducers rapamycin and starvation (the EBSS starvation medium) as positive control for autophagic flux induction. Bafilomycin A1 was included as a positive control for flux inhibition. Rapamycin is a strong autophagy inducer that acts by inhibiting the mTOR complex 1. Starvation triggers an immediate and strong autophagic response in the cells. Bafilomycin A1 inhibits autophagy at a late stage by blocking the lysosomal V-ATPase that pumps protons in the lysosomal lumen: the low pH needed in the lysosome’s lumen for degradation is not achieved and the autophagic flux is blocked. In the negative control, the spheroids were incubated with complete culture media containing 0.5% v/v DMSO, which is in the concentration range of the compounds applied in all of the experiments (see following paragraph). The corresponding response plots and representative images of the tfLC3 U343 spheroids are shown in Figure 2 . As expected, both rapamycin and starvation show a strongly increasing positive IR/IG ΔRatio over time, indicating a clear shift of the autophagic flux toward autolysosomal degradation. In contrast, the bafilomycin-treated spheroids show a strongly decreasing negative IR/IG ΔRatio over time, reflecting the accumulation of autophagosomes in the spheroids. Finally, the spheroids cultured in full medium show values close to the baseline, as expected from a basal autophagic flux. These three plots shows that the assay reliably discriminates between inducing and inhibiting autophagy-modulating drugs.
Response to DMSO
DMSO is the standard solvent used to solubilize the large variety of chemicals tested in screening procedures. We tested the effect of DMSO on basal autophagy in the concentration range relevant for our experiments. All the compounds of the ENZO autophagy library have a stock concentration of 10 mM. This implies a 0.5% v/v concentration of DMSO in the group of compounds at the highest concentration applied to the spheroids (50 µM). The stock concentration of the drugs in the ENZO natural compound library is 2 mg/mL. This implies a maximum final DMSO concentration of 2.5% for the compound with the highest molecular weight (valinomycin), in the highest concentration group (50 µM). Thus, we quantified the autophagic flux at the three DMSO concentrations (0.05%, 0.6%, and 2.5%) and compared it with the negative control (full medium with 0.5% DMSO). The results ( Fig. 2c ) show that a 2.5% DMSO concentration significantly increases autophagy compared with 0.5%. However, the autophagic flux induced by 2.5% DMSO is still less than the flux induced by strong autophagy modulators.
Benchmark Screening of an Autophagy Modulator Library
The complete list of drugs included in the library is shown in the
Autophagy inducers
mTOR complex inhibitors
The analysis confirms that plumbagin, an inhibitor of the AKT/mTOR pathway (
Fig. 1a
) that exhibits anti-inflammatory and antioxidant properties,
17
highly increases autophagy at a medium (12.5 µM) concentration (
Further analyzed mTOR complex inhibitors were amidarone, caffeine, curcumin, licochalcone, PI-103, timosaponin A-III, glucosamine, metformin, niclosamine, and rottlerin. All these compounds except the latter four increased the autophagic flux at least at one applied concentration. Unexpectedly, glucosamine, niclosamine, metformin, and rottlerin reduced the autophagic flux.
Ca2+ channel blockers
Calcium homeostasis is regulated by different types of calcium channels and pumps, including Ca2+ ATPases and voltage-dependent Ca2+ channels. Blockage of these calcium channels has been reported to induce autophagy (e.g., by the calcium channel blockers verapamil, loperamide, nimodipine, nitrendipine, 18 amidarone, 19 niguldipine, and penitrem A 5 ). The results of the screening of Ca2+ channel blockers are shown in the heat-map data visualization in Figure 3 . The data support the autophagy-inducing effect of verapamil, loperamide, and nimodipine for at least one applied concentration. On the other hand, high intracellular Ca2+ concentration inhibits autophagy. 20 Correspondingly, we verified that the drug nitrendipine inhibits autophagy at the concentrations of 12.5 µM and 50 µM. The L-type Ca2+ channel agonist Bay K8644 inhibits autophagy as reported previously. 18 The compounds A23187 21 and capsaicin 22 induce autophagy by endoplasmic reticulum (ER) stress-induced Ca2+.
cAMP-pathway inhibitors
Previous studies have shown that the imidazoline-1 receptor agonists clonidine and rilmenidine lower the cAMP level and induce autophagy in mouse neuronal cell culture and in a mouse model of Huntington disease at a 1-µM concentration.
18
However, we did not observe any significant effect of clonidine or rilmenidine compared to the basal autophagy in U343 spheroids at all tested concentrations (
Autophagy inhibitors
cAMP-pathway activators
Elevated intracellular cAMP levels induced by adenylyl-cyclase inhibit autophagy.
18
Consistently, we observed that the adenylyl-cyclase cAMP activator forskolin, as well as the cAMP analogues 8-CPT-cAMP·Na and dibutyryl-cAMP·Na, inhibited the autophagic flux (
PI3K inhibitors
Autophagosome biogenesis represents the initiation step of autophagy. This process involves the activation of small membrane structures, which subsequently evolve to phagophores. The activation process is mediated by the ULK1 and PI3KC3 complexes.
23
The measured ΔRatio curve confirmed the inhibitory effects of the PI3K inhibitors wortmannin and Ly294002 (
Microtubule-interfering agents
Autophagosomal turnover is achieved by the fusion of autophagosomes with lysosomes. Mature autophagosomes are actively transported to lysosomes by dynein-microtubule interactions. Interference with the dynamic microtubule cytoskeleton and therefore with the transport mechanism of the autophagosomes to the lysosomes is the suggested mechanism by which nocodazole inhibits the autophagic flux. Our data confirm that nocodazole effectively inhibits the autophagic flux at all tested concentrations (
Inhibitors of lysosomal activity
The lysosomal degradation inhibitors bafilomycin A1, chloroquine, and hydroxychloroquine are widely used to inhibit autophagy for research purposes and have been suggested as potential candidates for cancer treatment, particularly as adjuvant therapy.3,24 Bafilomycin A1 inhibits the lysosomal V-ATPase that pumps protons into the lysosomal lumen to establish low pH within the lysosome, which is required for proper lysosomal activity. The assay shows that bafilomycin A1 has a clear inhibitory effect already at the lowest concentration. Chloroquine and hydroxychloroquine showed similar results (
Screening of a Natural Compound Library
The outcome of the screening of the natural compound library is presented in
Figure 4
and
Figure 6
for six and four autophagy inducers and inhibitors, respectively. The complete list of compounds is shown in
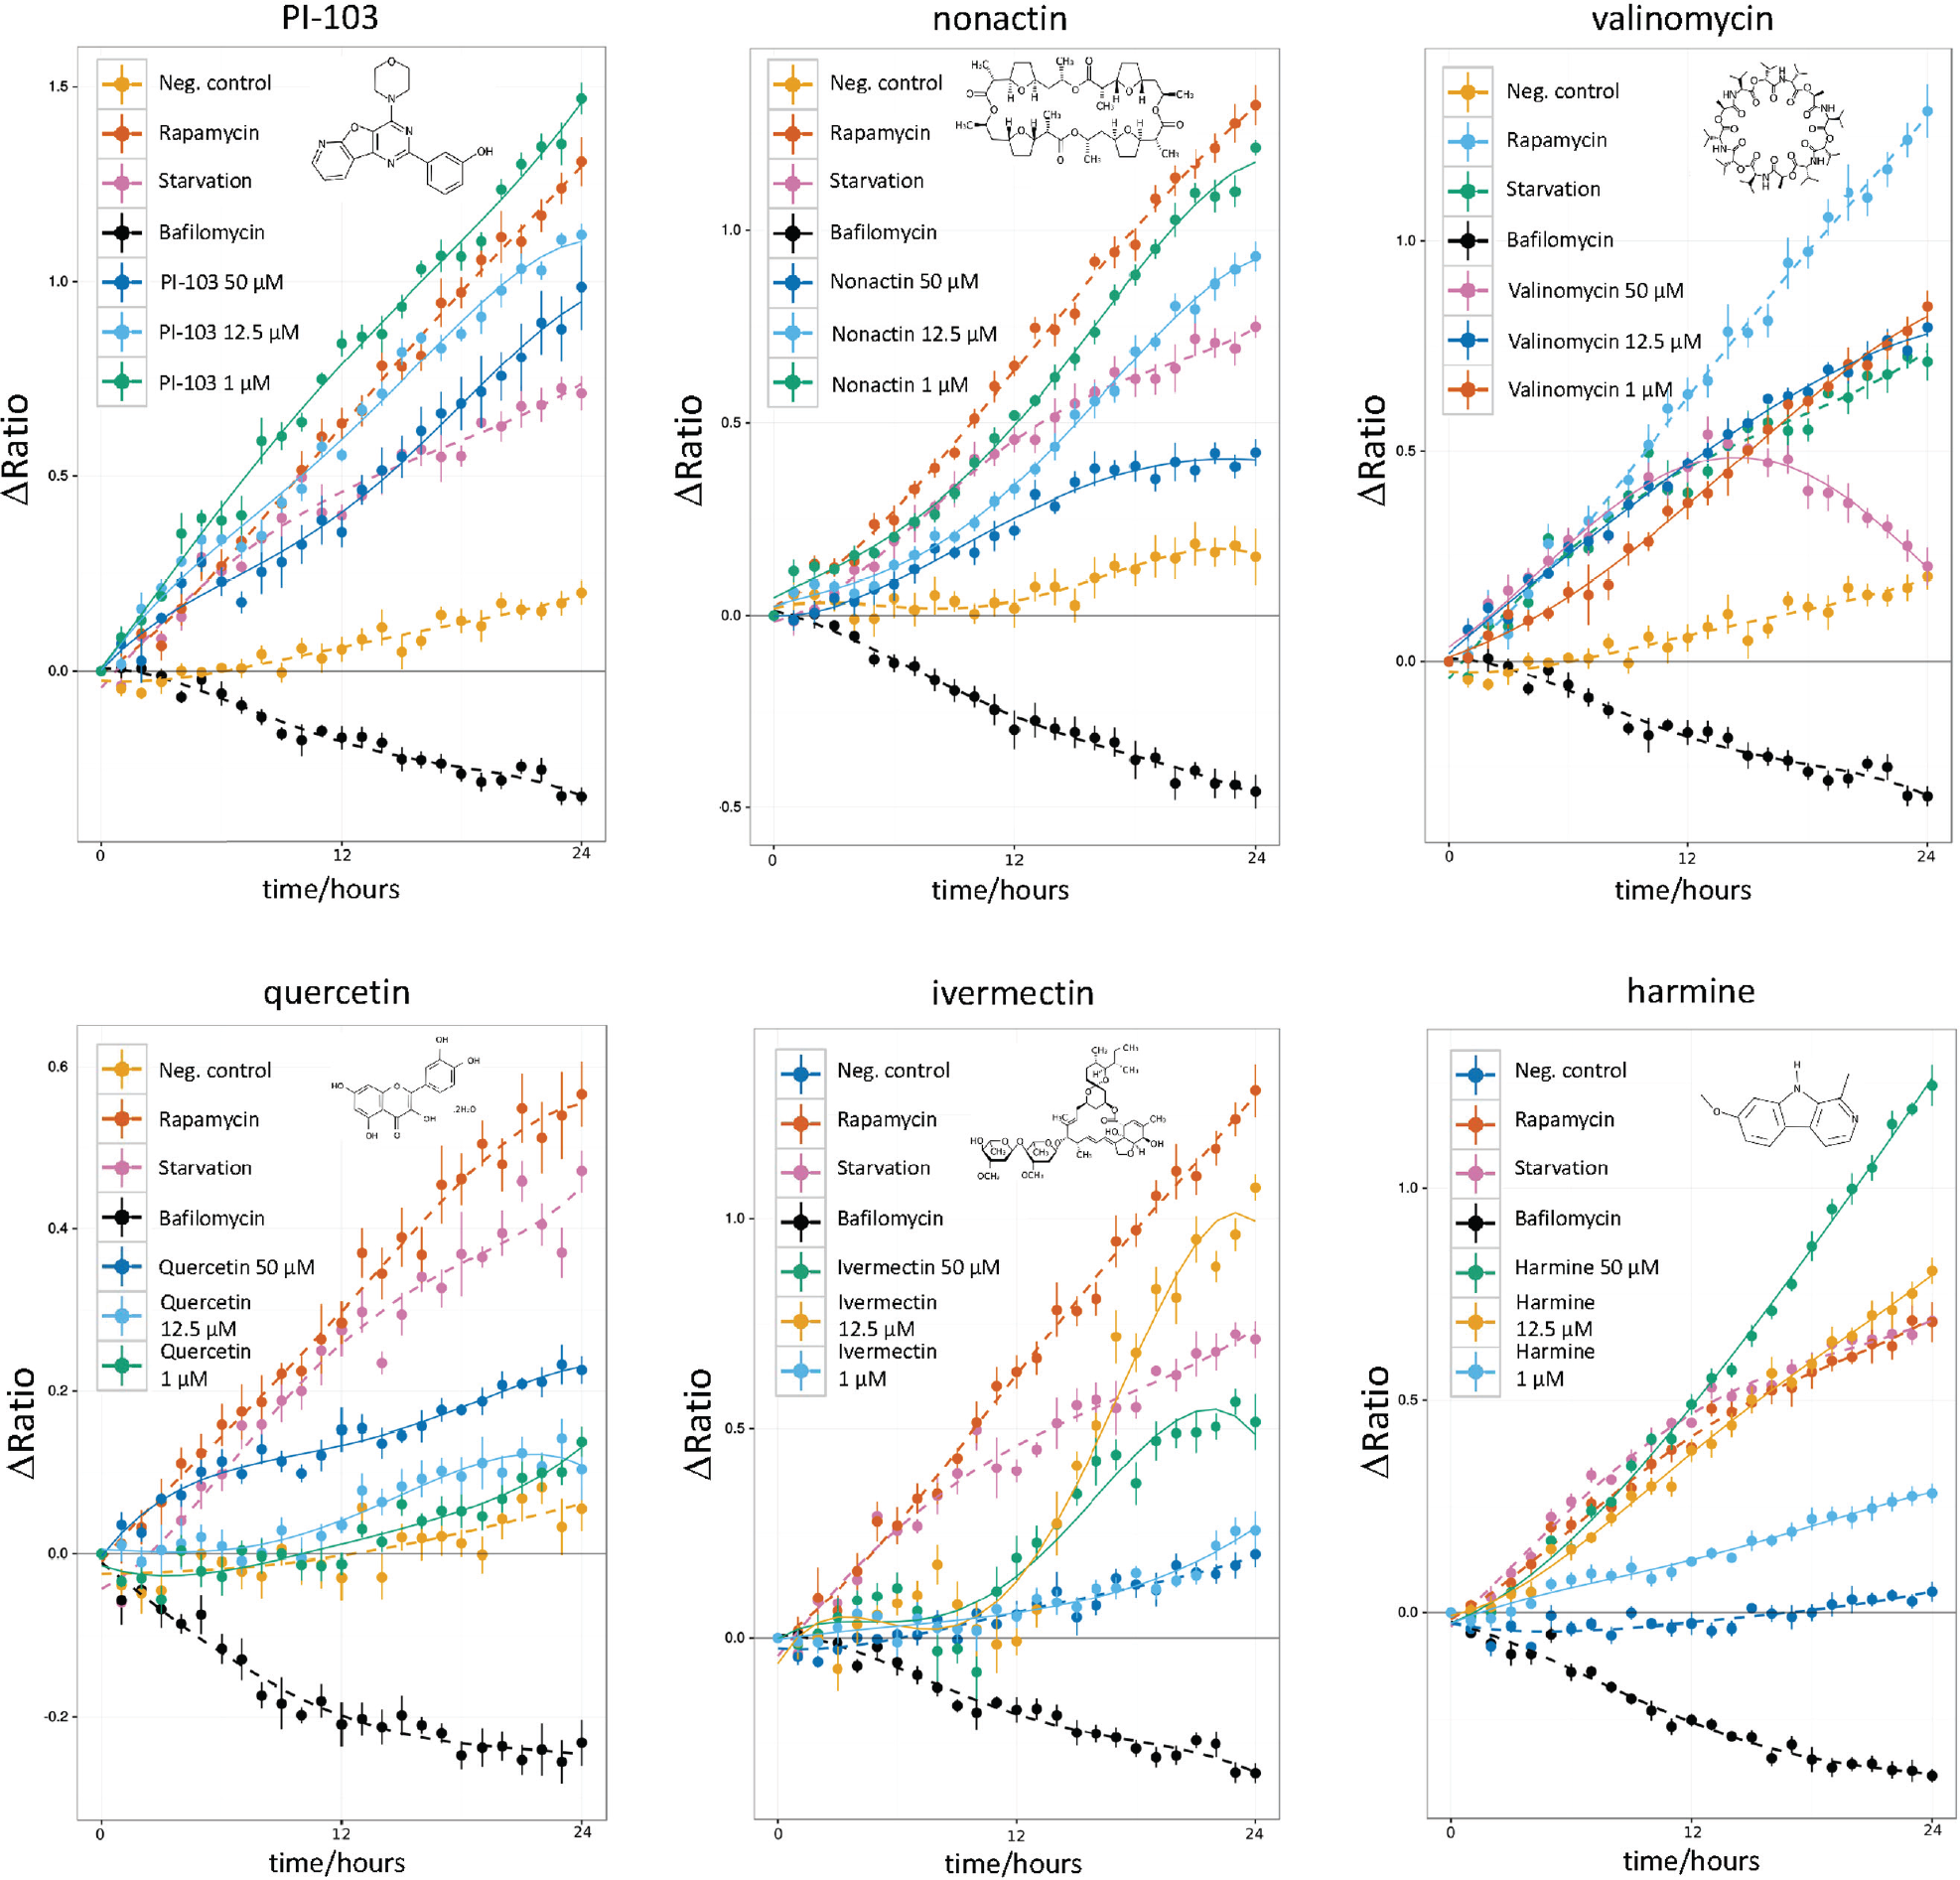
Autophagy-inducing natural compounds. An increase of the ΔRatio/time indicates autophagy induction, while a decrease indicates autophagy blockage. The control data (negative control, rapamycin, starvation, bafilomycin A1) are included in each plot. Compounds PI-103 and nonactin show an autophagic flux induction comparable to rapamycin and starvation. Nonactin shows the highest autophagy inducer potency at a concentration of 1 µM. The potency decreases at 12.5-µM and 50-µM concentrations. Interestingly, valinomycin shows an initial strong induction of autophagy at the highest concentration (50 µM) followed by a flux decrease 14 h into the experiment. Also noteworthy is the characteristic response to ivermectin, with a sudden steep flux increase about 10 h poststimulation.
Autophagy inducers
In total, the screening identified 28 “moderate” and “strong” autophagy inducers. Among these, six molecules (PI-103, nonactin, valinomycin, quercetin, ivermectin, and harmine) triggered a strong autophagic flux in U343 spheroids at all tested concentrations. The ΔRatio versus time plots of these compounds is reported in Figure 4 .
PI-103
The pyridinylfuranopyrimidine PI-103 is an adenosine triphosphate (ATP)–competitive inhibitor of PI3K, mTORC1/2, and about 40 other kinases. PI-103 induces autophagy in the U343 spheroids at all tested concentrations, further confirming the findings from the benchmark screening ( Fig. 4 ).
Nonactin
Nonactin is a macrotetrolide antibiotic and cyclic ionophore. We found that nonactin is a strong autophagy inducer at all tested concentrations. The autophagy-modulating properties of nonactin have not been known so far. The 1-µM concentration induced the strongest autophagosome turnover. Nonactin is poorly solubilized in water; thus, enough time for complete solubilization should be allowed at the highest concentration (50 µM) ( Fig. 4 ). Nonactin increased the autophagic flux deep inside the spheroids, as shown by in toto imaging of optically cleared spheroids ( Fig. 5 ).
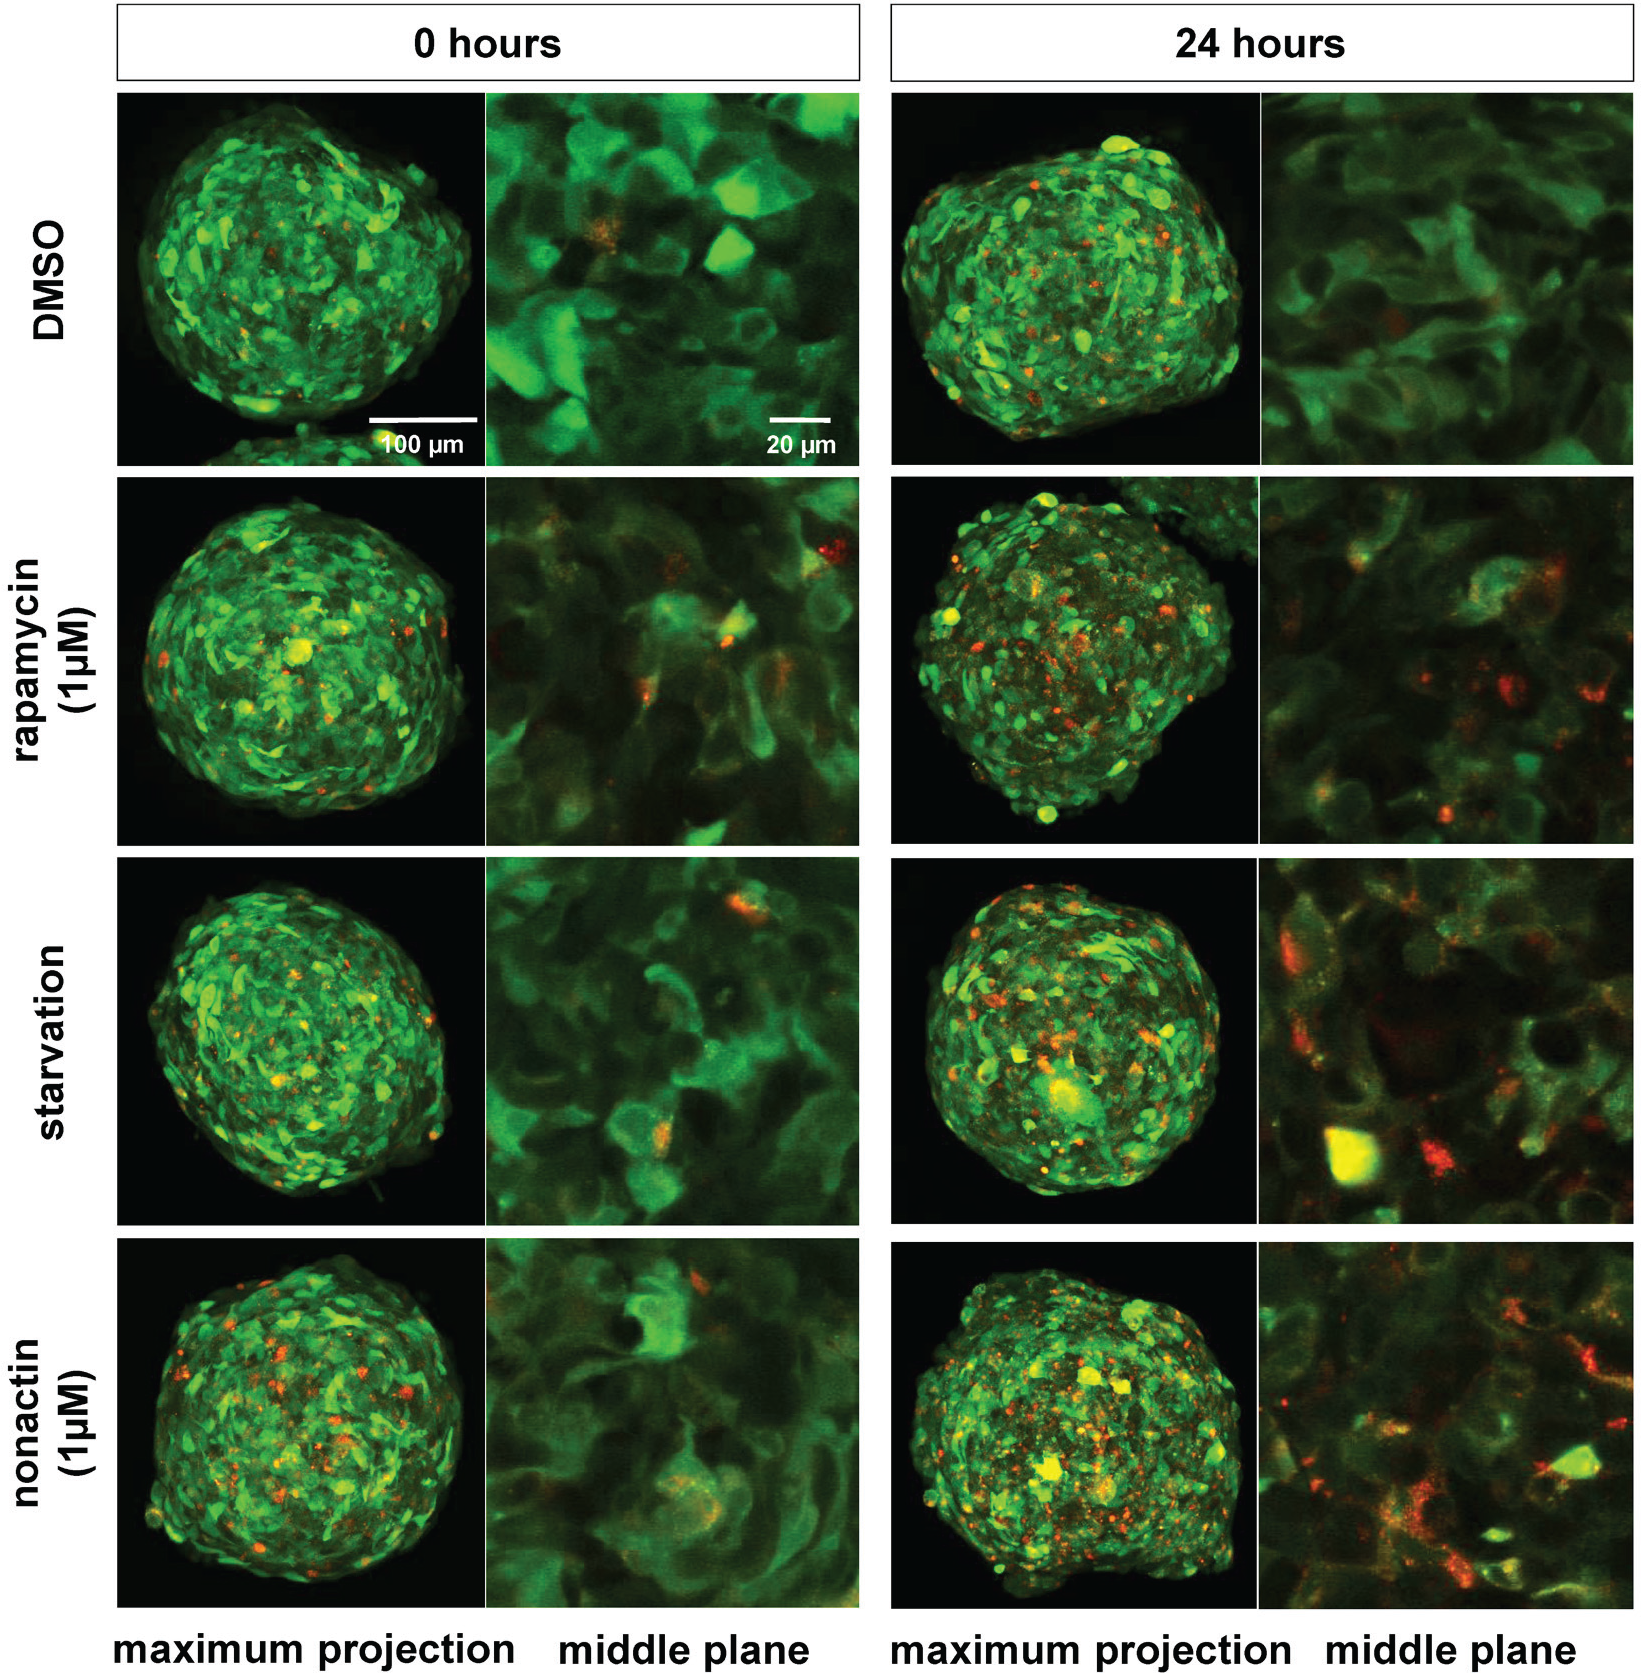
In toto imaging of U343 spheroids treated with nonactin. U343 spheroids were incubated with nonactin (1 µM) and with the three controls for 24 h, fixed with PFA, and optically cleared. The drug treatment triggered autophagy also in the cells deep inside the spheroid. Nonactin triggered a strong autophagic flux consistent with the data shown in Figure 4 . The spheroids were imaged with a confocal microscope (Carl Zeiss [CZ] LSM 780; objective lens: CZ 25×/NA 0.8 W; green fluorescent protein, excitation/emission: 488/544 nm; red fluorescent protein, excitation/emission: 594/667 nm; image resolution: 1024 × 1024 pixels, 16 Bit). For both time points, the maximum projection of all planes (left) and the middle plane (z = 120 µm) of the spheroids (right) is shown.
Valinomycin
Valinomycin is a dodecadepsipeptide that belongs to the group of macrolide antibiotics present in Streptomyces species strains. Treatment with valinomycin resulted in a strong autophagic flux as indicated by the increasing ΔRatio over time. Interestingly, at the highest concentration of 50 µM, after 12 h of incubation, a decrease of the autophagic flux was observed. 25
Quercetin
The flavonoid quercetin is a natural antioxidant with anti-inflammatory and antiangiogenic properties. 26 We observed strong autophagy induction at a concentration of 50 µM ( Fig. 4 ), which could be caused by the inhibition of the AKT/mTOR signaling pathway. 27
Harmine
The alkaloid harmine is isolated from Peganum harmala and has psychoactive properties. 28 Harmine has shown therapeutic potential to treat Parkinson disease by increasing dopamine levels. Next to PI-103 and rapamycin, harmine is a potent protein kinase inhibitor. Effects of harmine on autophagy are not known so far. In tfLC3 U343 spheroids, harmine increased the autophagic flux at all tested concentrations.
Ivermectin
Ivermectin induces autophagy at 8 µM and rapid cell death above this concentration over 24 hours incubation, as reported in Dou et al. 29 It has been shown that ivermectin induces cytostatic autophagy in breast cancer cells by inhibiting the PAK1 kinase and thus blocking the AKT/mTOR pathway. 29
Autophagy inhibitors
We identified 22 compounds inhibiting the autophagic flux. Of these, 11 showed strong inhibition at least at one concentration. The four most potent inhibitors are described in the following paragraphs. The complete hit list is shown in
Phorbol-12-13-dibutyrate
The phorbol-ester phorbol-12-13- dibutyrate (PDB) is a component of the plant-derived croton oil. As ascertained from the ΔRatio versus time-response curve and from a visual inspection of the stimulated spheroids ( Fig. 6 ), following PDB treatment, autophagosomes accumulated rapidly in the cells. However, the flux was blocked at the level of the autolysosomal degradation. The response curve shows a minimum ΔRatio at around 8 h after stimulation at all tested concentrations ( Fig. 6 ).
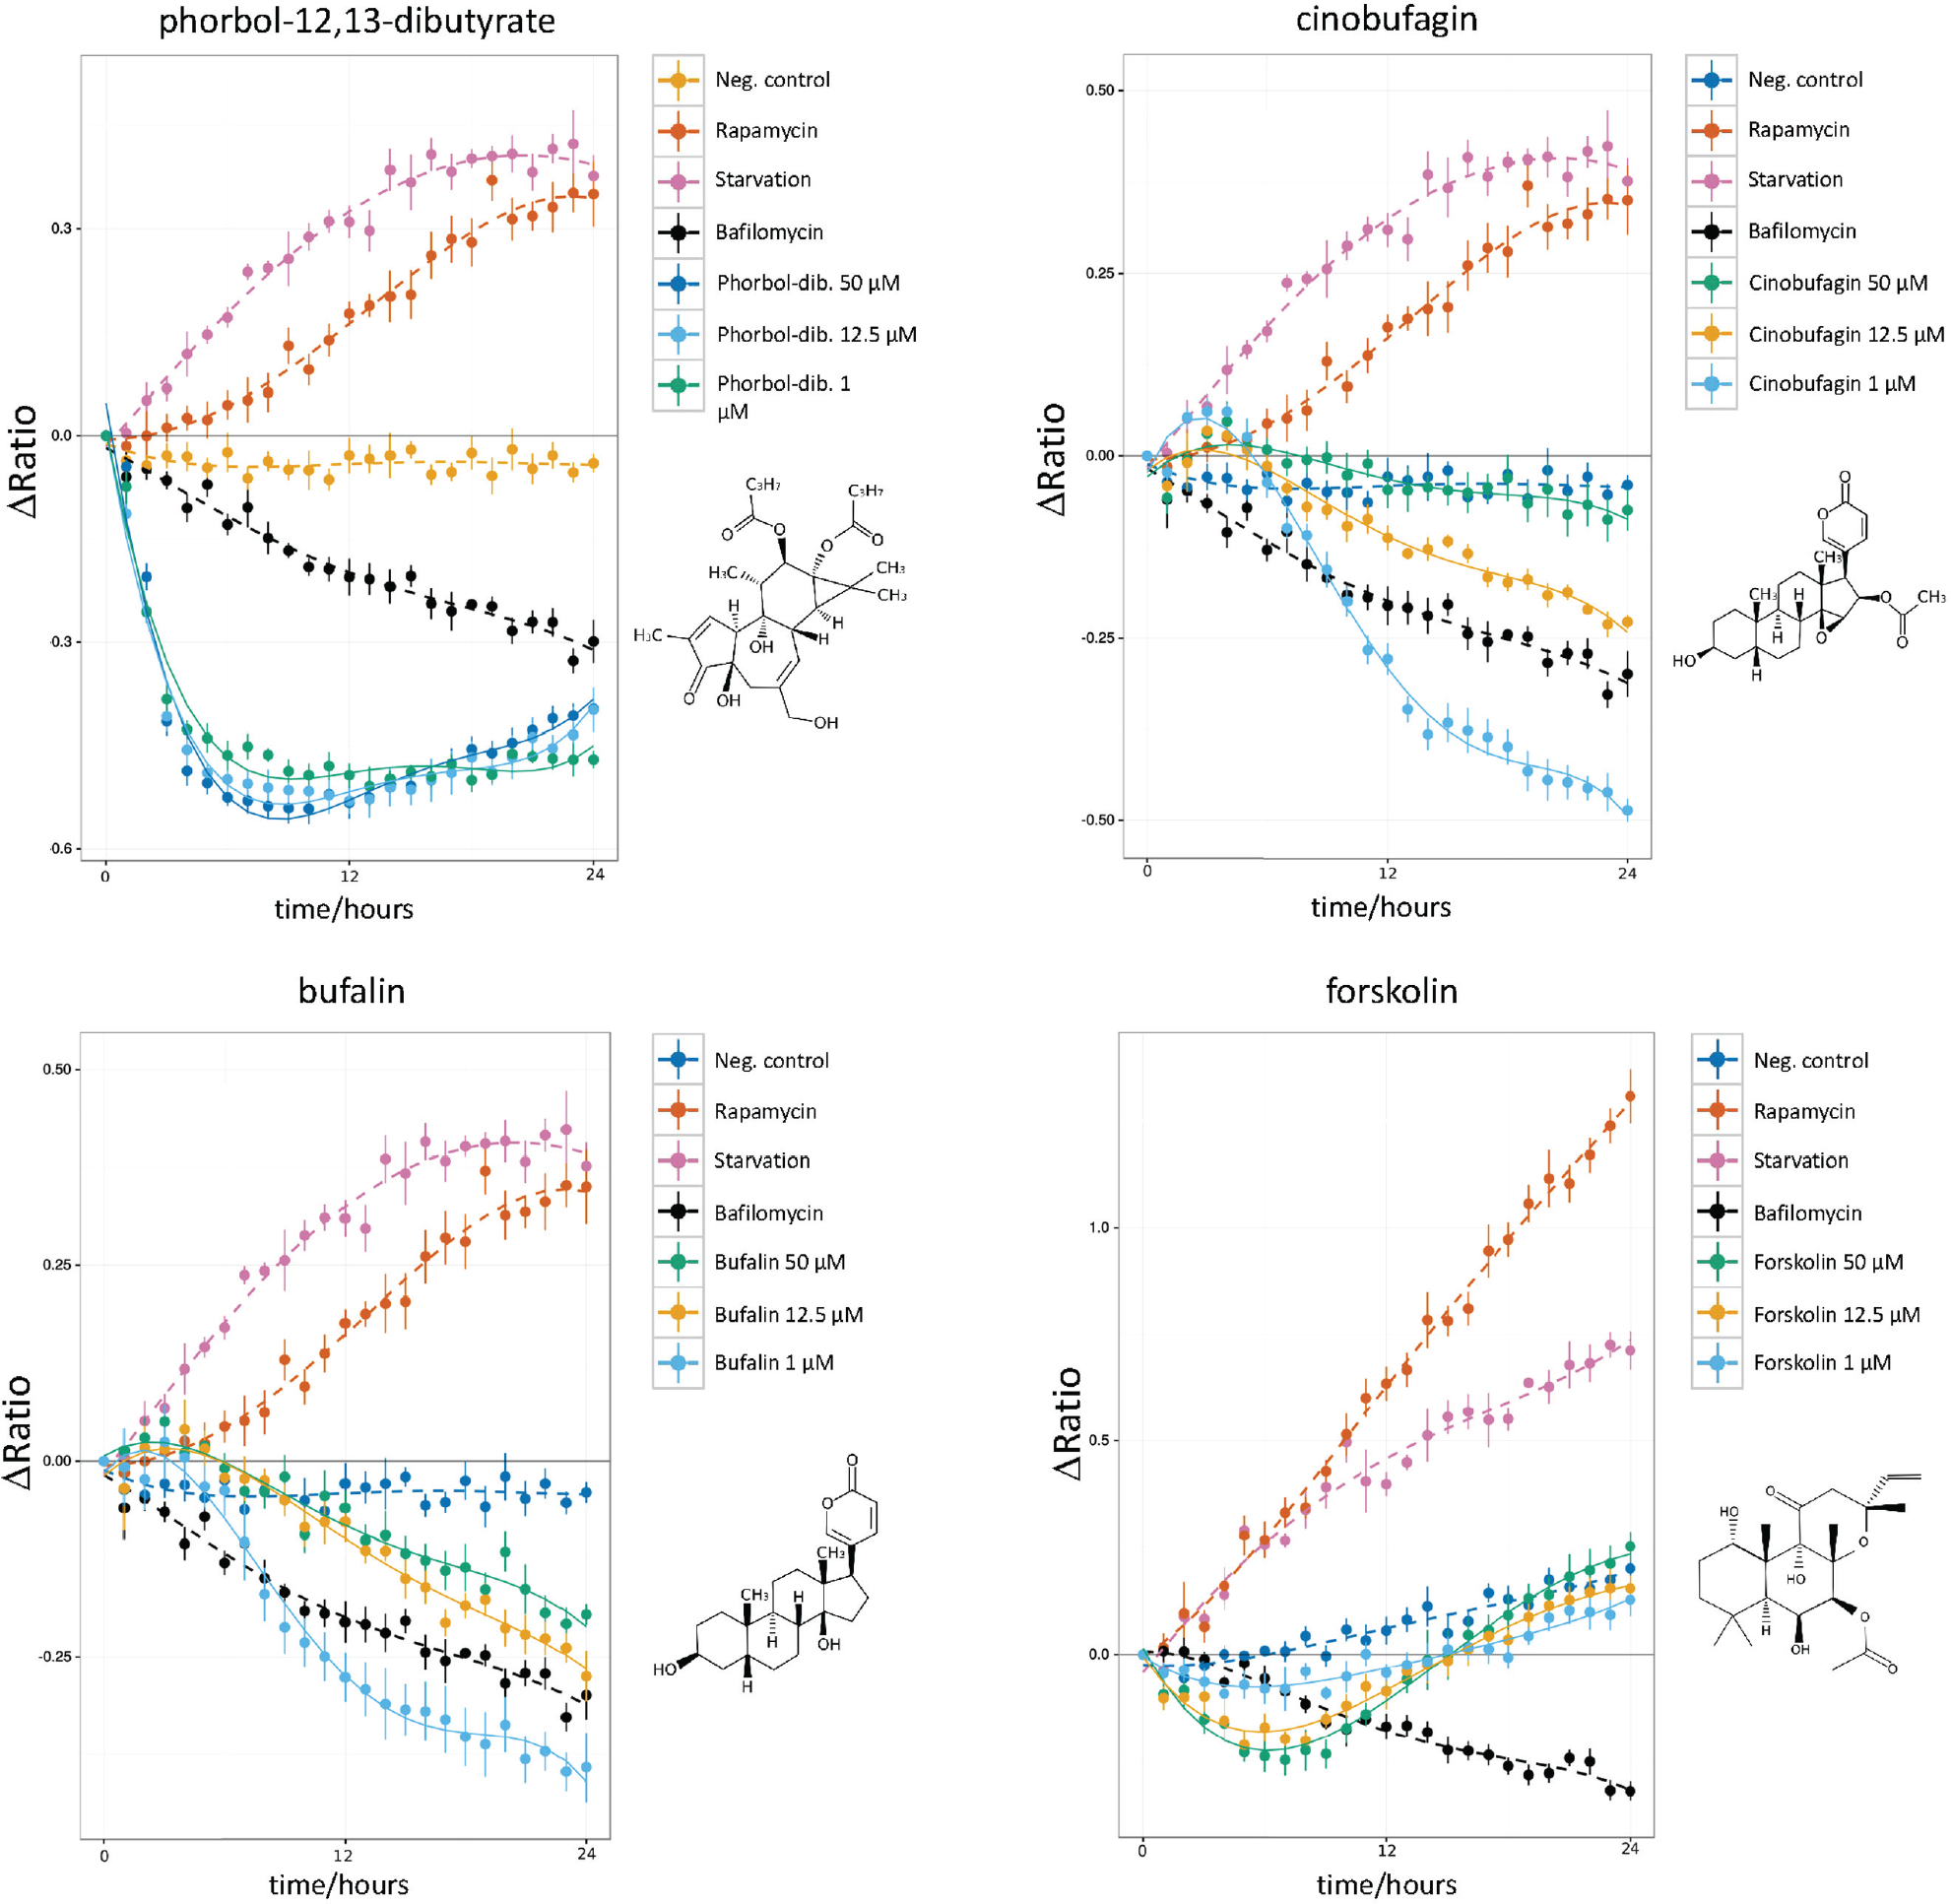
Autophagy-inhibiting natural compounds. The decrease of the ΔRatio over time measures the autophagy-inhibiting properties of these compounds. The control plots (negative control, rapamycin, starvation, bafilomycin A1) are included for each compound. Phorbol-12,13-dibutyrate shows a strong inhibition of the flux, followed by the onset of a steady-state response at all concentrations. Both cinobufagin and bufalin show a similar constant flux inhibition. Forskolin shows a different behavior: initially a strong flux inhibition, more potent than the one induced by bafilomycin A1, which is followed by a return to the basal-level autophagy.
Cinobufagin
Cinobufagin belongs to the group of bufadienolides, which are known for their cardiotonic and antineoplastic properties. 30 The results show that the most effective concentrations were 1 µM and 12.5 µM ( Fig. 6 ), whereas the strongest effect was observed at the concentration of 1 µM. At this concentration, the autophagosome accumulation peaked between 6 and 12 h ( Fig. 6 ). Some membrane blebbing appeared at 12 h after stimulation at the spheroid’s edge, signalizing cellular stress (data not shown). However, the spheroids’ morphology remained compact over the entire stimulation time.
Bufalin
Bufalin is a cardiac glycoside isolated from the venom of the Bufo toad. It is a potent inhibitor of SRC-1 and SRC-3 and stops the growth of cancer cells in vitro at nanomolar concentration. 30 Similarly to cinobufagin, the strongest inhibition of autophagy was observed at a concentration of 1 µM ( Fig. 6 ).
Forskolin
The diterpene forskolin is extracted from the plant Plectranthus barbatus. Forskolin is a nonselective stimulator of adenylyl cyclases and raises the intracellular cAMP concentration, activating several signal transduction pathways dependent on G-protein receptors. At all concentrations, forskolin rapidly inhibited the autophagic flux, peaking after 6 h of stimulation. After 12 h, the flux settled to the basal state ( Fig. 6 ).
Discussion
We describe a novel spheroid-based screening assay to measure the dynamic autophagic flux in living cells. We measured over time the ratio of mRFP and GFP fluorescence emission intensity in spheroids expressing the autophagy sensor mRFP-GFP-LC3. From this straightforward ratiometric readout, we obtained all the essential information on the autophagic flux. Spheroid-based assays have several advantages compared to assays performed with 2D cell cultures. In spheroids, the cells are not isolated but establish tissue-specific cell-cell contacts. This is in contrast with 2D cultures, which facilitate a proliferative, nonphysiological phenotype. 31 A further advantage of our assay is that each individual spheroid comprises about 2000 cells. Therefore, each time-point measurement reflects the response of a large cell population instead the one of isolated cells. This improves the robustness and the reproducibility of the data. A further advantage of the assay is that the fluorescence signal of the entire spheroid is recorded; thus, all cell layers, from the external ones down to the spheroid’s core, are considered. The distribution and penetration of the compounds in the spheroids can be further assessed with in toto imaging, as demonstrated in Figure 5 for nonactin (see supplementary methods for details about optical clearing and in toto imaging).
In our screening, we tested the effects of each compound at three different concentrations. This is essential to grasp dose-dependent effects in the modulation of autophagy. A further improvement of our assay is that the autophagic flux is monitored in real time over a period of 24 h. This allows extracting the kinetics of the autophagic flux from the data.
Our benchmark screening of the autophagy modulator library produced results consistent with previous studies. Interestingly, some compounds earlier identified as autophagic flux inducers by Western blot analysis of LC3-I to LC3-II conversion or by counting LC3-GFP puncta reveal a different behavior once the entire flux is analyzed with our assay. One striking example is the disaccharide trehalose, which protects cells against external stresses (e.g., dehydration) and is considered an autophagy activator.
32
In contrast, our time-resolved analysis of the flux (
From the screening of the natural compounds library, we identified several compounds with known properties as autophagic flux inducers and inhibitors. We discovered that the cyclic ionophore antibiotic nonactin, never described so far in the literature as an autophagy modulator, is a potent autophagic flux inducer. Nonactin selectively forms complexes with K+ ions and transports them across the cell membrane. 33 Nonactin abolishes the mitochondrial membrane potential, thus blocking the mitochondrial transport. It inhibits the P170-glycoprotein efflux pump expressed in multiple drug-resistant tumor cells. 33 Nonactin is also an inhibitor of the mitochondrial enzyme adenine nucleotide translocase (ANT), which is responsible for adenosine diphosphate/ATP transport. 34 The ANT-mediated ATP flux across the mitochondrial membrane is a key process to control the cellular energy balance. Thus, nonactin is a modulator of cellular energy metabolism. These observations could explain the strong autophagic flux induced in the cell by nonactin at all tested concentrations. Thus, this antibiotic is a promising autophagy modulator for clinical applications. However, several improvements are required before a pharmacological investigation on nonactin can be started. In particular, the poor solubility of nonactin in an aqueous environment requires the synthesis of new water-soluble derivates.
In summary, we described a novel screening assay to measure the autophagic flux in 3D cellular spheroids by using a straightforward ratiometric approach. The spheroids applied in our study were formed with U343 glioma cells expressing the fluorescence autophagic flux sensor mRFP-GFP-LC3. By recording the mRFP/GFP ratio for 24 h with time-lapse fluorescence microscopy, we achieved a time-resolved analysis of the autophagic flux in the drug-treated spheroids. To confirm the validity of the assay, we screened a library of known autophagy modulators and a small library of natural compounds. We identified the antibiotic nonactin as a novel potent autophagy inducer. In future studies, our newly developed spheroid-based autophagy assay will be essential to identify additional drug candidates by screening a much larger compound library comprising about 7000 molecules.
Footnotes
Acknowledgements
We thank Berit Reinhardt for programming the pipetting robot and Sigrun Becker for the work with the RCAS vector. We also thank Stefanie Hartung, Felix Harth, and Patrick Henzner for conducting early stage preliminary experiments.
Supplementary material is available online with this article.
Declaration of Conflicting Interests
The authors declared no potential conflicts of interest with respect to the research, authorship, and/or publication of this article.
Funding
The authors disclosed receipt of the following financial support for the research, authorship, and/or publication of this article: We acknowledge the funding by the European Union’s Horizon2020 programme (Project LSFM4LIFE), by the Hessian LOEWE Ub-Net (speaker Ivan Dikic), and by the Cluster of Excellence Frankfurt for Macromolecular Complexes (CEF-MC, EXC 115, speaker Volker Dötsch) organized by the DFG (Deutsche Forschungsgemeinschaft). Donat Kögel was supported by the DFG (SFB1177 on selective autophagy).
References
Supplementary Material
Please find the following supplemental material available below.
For Open Access articles published under a Creative Commons License, all supplemental material carries the same license as the article it is associated with.
For non-Open Access articles published, all supplemental material carries a non-exclusive license, and permission requests for re-use of supplemental material or any part of supplemental material shall be sent directly to the copyright owner as specified in the copyright notice associated with the article.