
Abstract
Automatization in microscopy, cell culture, and the ease of digital imagery allow obtainment of more information from single samples and upscaling of image-based analysis to high-content approaches. Simple segmentation algorithms of biological imagery are nowadays widely spread in biomedical research, but processing of complex sample structures, for example, variable sample compositions, cell shapes, and sizes, and rare events remains a difficult task. As there is no perfect method for image segmentation and fully automatic image analysis of complex content, we aimed to succeed by identification of unique and reliable features within the sample. Through exemplary use of a coculture of vascular smooth muscle cells (VSMCs) and macrophages (MPs), we demonstrate how rare interactions within this highly variable sample type can be analyzed. Because of limitations in immunocytochemistry in our specific setup, we developed a semiautomatic approach to examine the interaction of lipid-laden MPs with VSMCs under hypoxic conditions based on nuclei morphology by high-content analysis using the open-source software CellProfiler (www.cellprofiler.org). We provide evidence that, in comparison with fully automatic analysis, a low threshold within the analysis workflow and subsequent manual control save time, while providing more objective and reliable results.
Introduction
Image analysis plays a pivotal role in biological research and many other fields, including, but not limited to, radiology, astronomy, robotics, and automatization. Image segmentation can be defined as partitioning of an image into several regions with distinct homogenous properties. This means that regions with similar content are created by combining neighboring pixels with the goal to alter the image for easier interpretation and analysis.1,2 Segmentation is an essential step in automatic image analysis,3,4 although algorithms have been proposed that extract information without the need of prior segmentation.5,6 The first approaches of semiautomatic image analysis track back to the 1980s, but only the digital age, with cheap data storage and advanced computation, opened up new opportunities. Automatization in research, especially with liquid handling robots, in cell culture and microscopy has enabled us to analyze larger samples in a shorter period of time, while data tend to be more and more complex. The growing amount of fluorochromes, monoclonal antibodies, and organelle-specific dyes allows for investigation of complicated matter in multidimensional images. A higher amount of difficult data, however, connotes a greater effort in analysis. Although automatization is integrated in most modern microscopy systems on the market, the number of people who make the most out of their equipment seems to be moderate. The gap between the possibilities and the usage of mass image analysis might be a result of insufficient education in the field of manual, semiautomatic, and automatic image analysis.
While simple applications, such as counting cell nuclei and measuring their size, can easily be handled with, for example, ImageJ, 7 sophisticated operations require a lot of knowledge within the field and program, as well as personal effort and time. Thus, manual segmentation in high-content analysis is not economical. Automatic segmentation is a reliable and reproducible method, and many segmentation methods have been proposed. However, the results strongly depend on the kind of image and the desired application, and there is no perfect method for segmentation.4,8 Fully automatic segmentation on complicated images tends to yield poor results. Especially, biological images are hard to explore due to noise, autofluorescence, low resolution, blur, unstable brightness, overlapping targets, unclear boundaries, deformation, and other obstacles. 4 Semiautomatic segmentation presents a solution in analyzing highly complex fluorescence images and maintaining a high throughput as well.
Especially in vascular biology, the hurdles for imaging remain high since atherosclerosis is a chronic inflammatory disease of the vascular wall in which various vascular and bone marrow–derived cells interact under certain environmental conditions characterized by inflammation, changes of the extracellular matrix, mechanical forces, and at late stages, hypoxia. A common approach in vascular biology is to drastically simplify by using one cell type, for example, vascular smooth muscle cells (VSMCs) or endothelial cells, to analyze the pro-atherogenic potential of a given factor. But these cell cultures can only be rough representations of the convoluted processes occurring inside the vessel wall. For decades, vascular biologists have striven to simulate the complexity by using more sophisticated cell culture systems to better represent the vessel wall.9–12 Cocultures of different cell types are a valuable tool to achieve this goal, 13 but also imply that the analysis might be more difficult than single cultured cells. On a transcriptional level, the usage of xenogeneic cell composure and subsequent species-specific primers can be one expedient. Since classical biochemical analysis, such as Western blot, cannot dissect single-cell-type contributions, microscopy is often the only method to characterize the contribution of a solitary cell type in a complex setting. However, cell phenotypes may blur, which makes an automated analysis even more difficult. For example, we could demonstrate that lipid-laden macrophages (MPs), also known as foam cells, are able to actively transport lipids into VSMCs, thereby giving them a foam cell–like appearance. 14 In this previous study, time lapse microscopy and high-resolution Z-stack imaging were used to prove that fluorescence-labeled acetylated LDL (FL-acLDL) is transported in a time-dependent manner from MPs into the VSMCs during cell–cell contacts in vitro. This transport event resulted in a phenotypical change of the VSMCs toward a foam cell–like phenotype, as demonstrated by lipid droplet formation, increased phagocytosis, and changed gene expression patterns of the VSMCs, as described previously for cholesterol-laden VSMCs by Rong et al. 15 Control experiments, like the separation of the cocultured cells via trans-well inserts or the usage of preconditioned media, were not resulting in any FL-acLDL-positive VSMCs or phenotype changes. These events are rarely directly seen in live cell imaging and accumulate depending on cell density and culture duration of the coculture. Thus, for quantification under changing conditions, such as hypoxia occurring during plaque growth, a high-throughput approach was mandatory.
Automated analysis proved to be difficult due to high autofluorescence in human VSMCs; hypoxic conditions; varying cell morphology in terms of size, shape, and intensity; scarce events; and the unavoidable necessity of a lipophilic tracer substance. FL-acLDL served in our coculture as a model of modified lipids as they are present in the atherosclerotic lesion.
To our knowledge, there is no possibility to perform a sufficient cell membrane permeabilization without compromising the FL-acLDL, since any used substance removing cholesterol from the membrane would also remove it from the FL-acLDL. Therefore, it was not possible to perform immunocytochemistry in order to distinguish between the two cell types. In this study, we describe the use of the open-source software CellProfiler (CP) (www.cellprofiler.org) for semiautomatic image analysis to examine the interaction of lipid-laden MPs with VSMCs in coculture under normoxic and hypoxic conditions based on nuclei morphology. Along this exemplary setting, we show and discuss the obstacles of image segmentation and why a low threshold and subsequent manual control of the results are the key to studying rare events in complex composed imagery.
Materials and Methods
Cell Isolation and Culture
Peripheral blood mononuclear cells (PBMNCs) were isolated by density gradient centrifugation of the blood from healthy donors using lymphocyte separation medium LSM 1077 (PAA Laboratories GmbH, Coelbe, Germany). An additional density gradient centrifugation with Percoll (GE Healthcare, Little Chalfont, UK) at a density of 1.064 g cm−3 was used to achieve a higher purified monocyte fraction. Adherent PBMNCs were further cultivated on Costar ultralow attachment six-well plates (Corning, Inc., Corning, NY) for 14 days to obtain monocyte-derived MPs.
Mice VSMCs were obtained by spontaneous outgrowth from the abdominal aorta of healthy transgenic green fluorescent protein (GFP) mice (C57BL/6-Tg(ACTB-EGFP)1Osb/J, The Jackson Laboratory, Bar Harbor, ME) in Dulbecco’s modified Eagle’s medium (DMEM) low glucose supplemented with 10% fetal calf serum (FCS), streptomycin sulfate (100 mg/mL), penicillin (100 IU/mL), and amphotericin B (0.25 mg/mL) (D10F+). The abdominal aortas were solely taken from untreated control mice euthanized at the end of other animal studies. Intraperitoneal injection of pentobarbital (100 mg/kg) was used for anesthesia. All procedures were in conformance with the Guide for Care and Usage of Laboratory Animals (8th ed., 2011) published by the U.S. National Institutes of Health, as well as the current version of the German law on the protection of animals, and approval was secured from the local animal care and use committee.
Human VSMCs were obtained from leftover explants of patients undergoing arterial surgery, which was approved by the local ethics committee complying with the principles of the Declaration of Helsinki. The human arterial explants were mechanically cleaned from the tunica adventitia and endothelial cells and cultured in small pieces to obtain VSMCs by spontaneous outgrowth. The VSMCs were used at passages 4–8.
Cells were grown in an incubator at 37 °C with 5% (v/v) CO2, split after trypsin/EDTA treatment, and handled according to standard protocols, with D10F+ medium being changed three times a week. Medium and all additives were acquired from PAA Laboratories. Equally treated monocultures were used for control experiments.
Macrophage Labeling
Monocyte-derived MPs were loaded with FL-acLDL after at least 2 weeks of differentiation. Two milliliters of D10F+ with 20 µg of Alexa Fluor 594 acLDL conjugates (Life Technologies, Carlsbad, CA) was added to one well of Costar ultralow attachment six-well plates on the day before cocultures were created. FL-acLDL that had not been internalized overnight was removed completely by changing the medium the next day.
Cocultures and Hypoxia
Cocultures were set up on six-well plates (Greiner Bio-One GmbH, Kremsmuenster, Austria) with semiconfluently seeded VSMCs of the GFP mouse (30,000 cells/well). Mitomycin C (AppliChem GmbH, Darmstadt, Germany) treatment (2 µg/mL in D10F+ for 2 h), followed by triple washing with phosphate-buffered saline (PBS), was used to stop VSMC proliferation and prevent overgrowth during the culture period. FL-acLDL-labeled MPs were removed from the Costar ultralow attachment six-well plates with a cell scraper and equally added. Cocultures were incubated for 10 days before fixation and staining. An acrylic chamber (Nalgene 5317-0070, Rochester, NY) with separate gas supply was used to create hypoxic conditions. The oxygen level was regulated using nitrogen and carbon dioxide with a gas mixer (Okolab, Ottaviano, Italy) and oxygen controller (BioSpherix, Parish, NY) to reach a continuous level of 1.5%–2% O2 (v/v). Controls were treated identically under normoxic conditions.
Immunocytochemistry/Staining
After 10 days of coculture, cells were washed with PBS and fixed with freshly prepared 4% formaldehyde/PBS for 10 min. After washing, cell nuclei were stained with DAPI (0.1 µg/mL) for 10 min. ProTaqs MountFluor mounting medium (Quartett, Berlin, Germany) and round coverslips were used for conservation and to prevent bleaching.
Immunocytochemistry was performed in various preliminary experiments to test different fixatives, cell membrane permeabilization, and staining, but not for the samples described in this study (data not shown).
Microscopy
Microscopy was performed with a Zeiss Axiovert 200M-based epifluorescence wide-field imaging system equipped with an AxioCam MRm camera and the fluorescence filter sets Zeiss No. 49, HQ-FITC (EX BP 480/40, BS 505, EM 535/50), and HQ-Texas Red (EX 560/55, BS 595, EM 645/75) (Chroma Technology Corp., Bellows Falls, VT). Acquisition and device control were performed by AxioVision 4.8.1 (Carl Zeiss MicroImaging GmbH, Jena, Germany). Images were acquired with an automated scanning stage (Maerzhaeuser Wetzlar GmbH & Co. KG, Wetzlar, Germany) using predefined positions with autofocus based on nuclei. All images were saved as 12-bit Zeiss AxioVision ZVI files in a resolution of 1388 × 1040 pixels, and single channels were later exported as 8-bit Tagged Image Files (TIFs) for further processing. A shading correction using autofluorescent plastic slides (Chroma Technology) was applied before image acquisition.
Characterization of Cell Type–Specific Nuclei Size Using ImageJ
ImageJ was used to quantify phenotypic differences between human MP and mouse VSMC nuclei. Two hundred images of either solely DAPI-stained and fixed MPs or VSMCs from monocultures were obtained. After binarization through manual thresholding, nuclei number and size were measured using the “Analyze Particle” module.
Usage of CellProfiler for Semiautomatic Image Segmentation
The open-source software CellProfiler 2.0.0 (rev dde5672; www.cellprofiler.org) was used to develop an algorithm (pipeline) for semiautomatic image segmentation and exploration based on a variety of preliminary experiments, test runs, and quality controls.16,17
All experiments were conducted with the same modules and settings. Thresholds for binarization were manually chosen based on sample images. The same thresholds were used for one setup. The control experiments for segmentation of nuclei were conducted with changed parameters in the modules, “3. FlagImage,” “4. IdentifyPrimaryObjects,” “9. FilterObjects,” and “11. FilterObjects,” due to small image variations, for example, intensity variations for image sets acquired on different days/months, and are stated in braces.
Figure 1 demonstrates the principle and most important steps of our CP pipeline. Figure 2 shows examples of whole images, including correctly segmented objects, wrong thresholding, and artifacts.
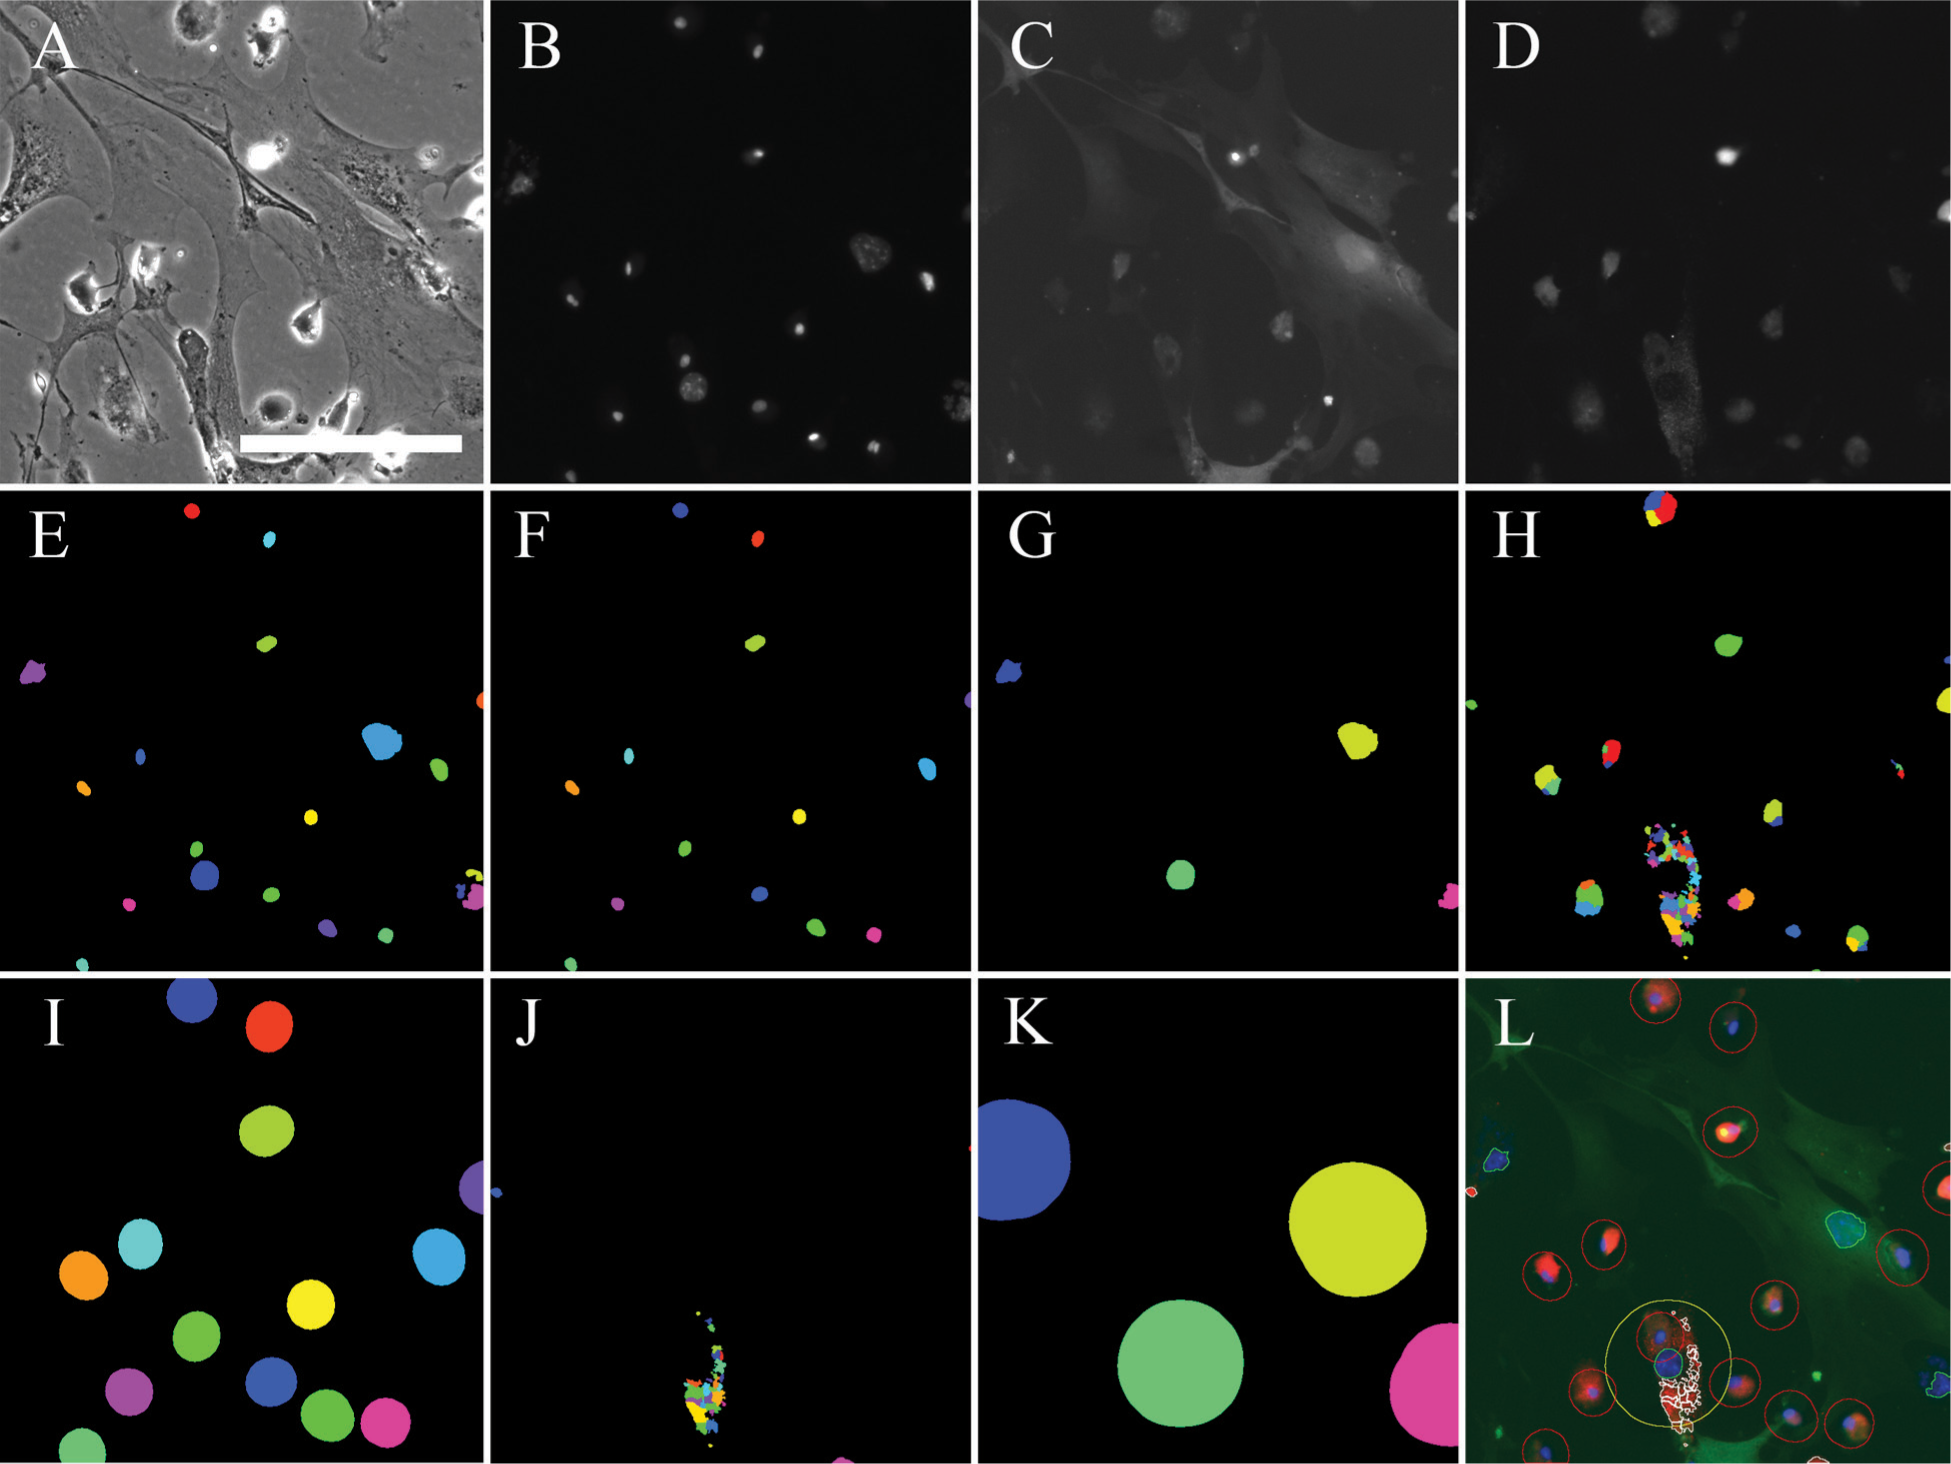
450 × 450 µm section of a representative image to demonstrate the CP pipeline. (
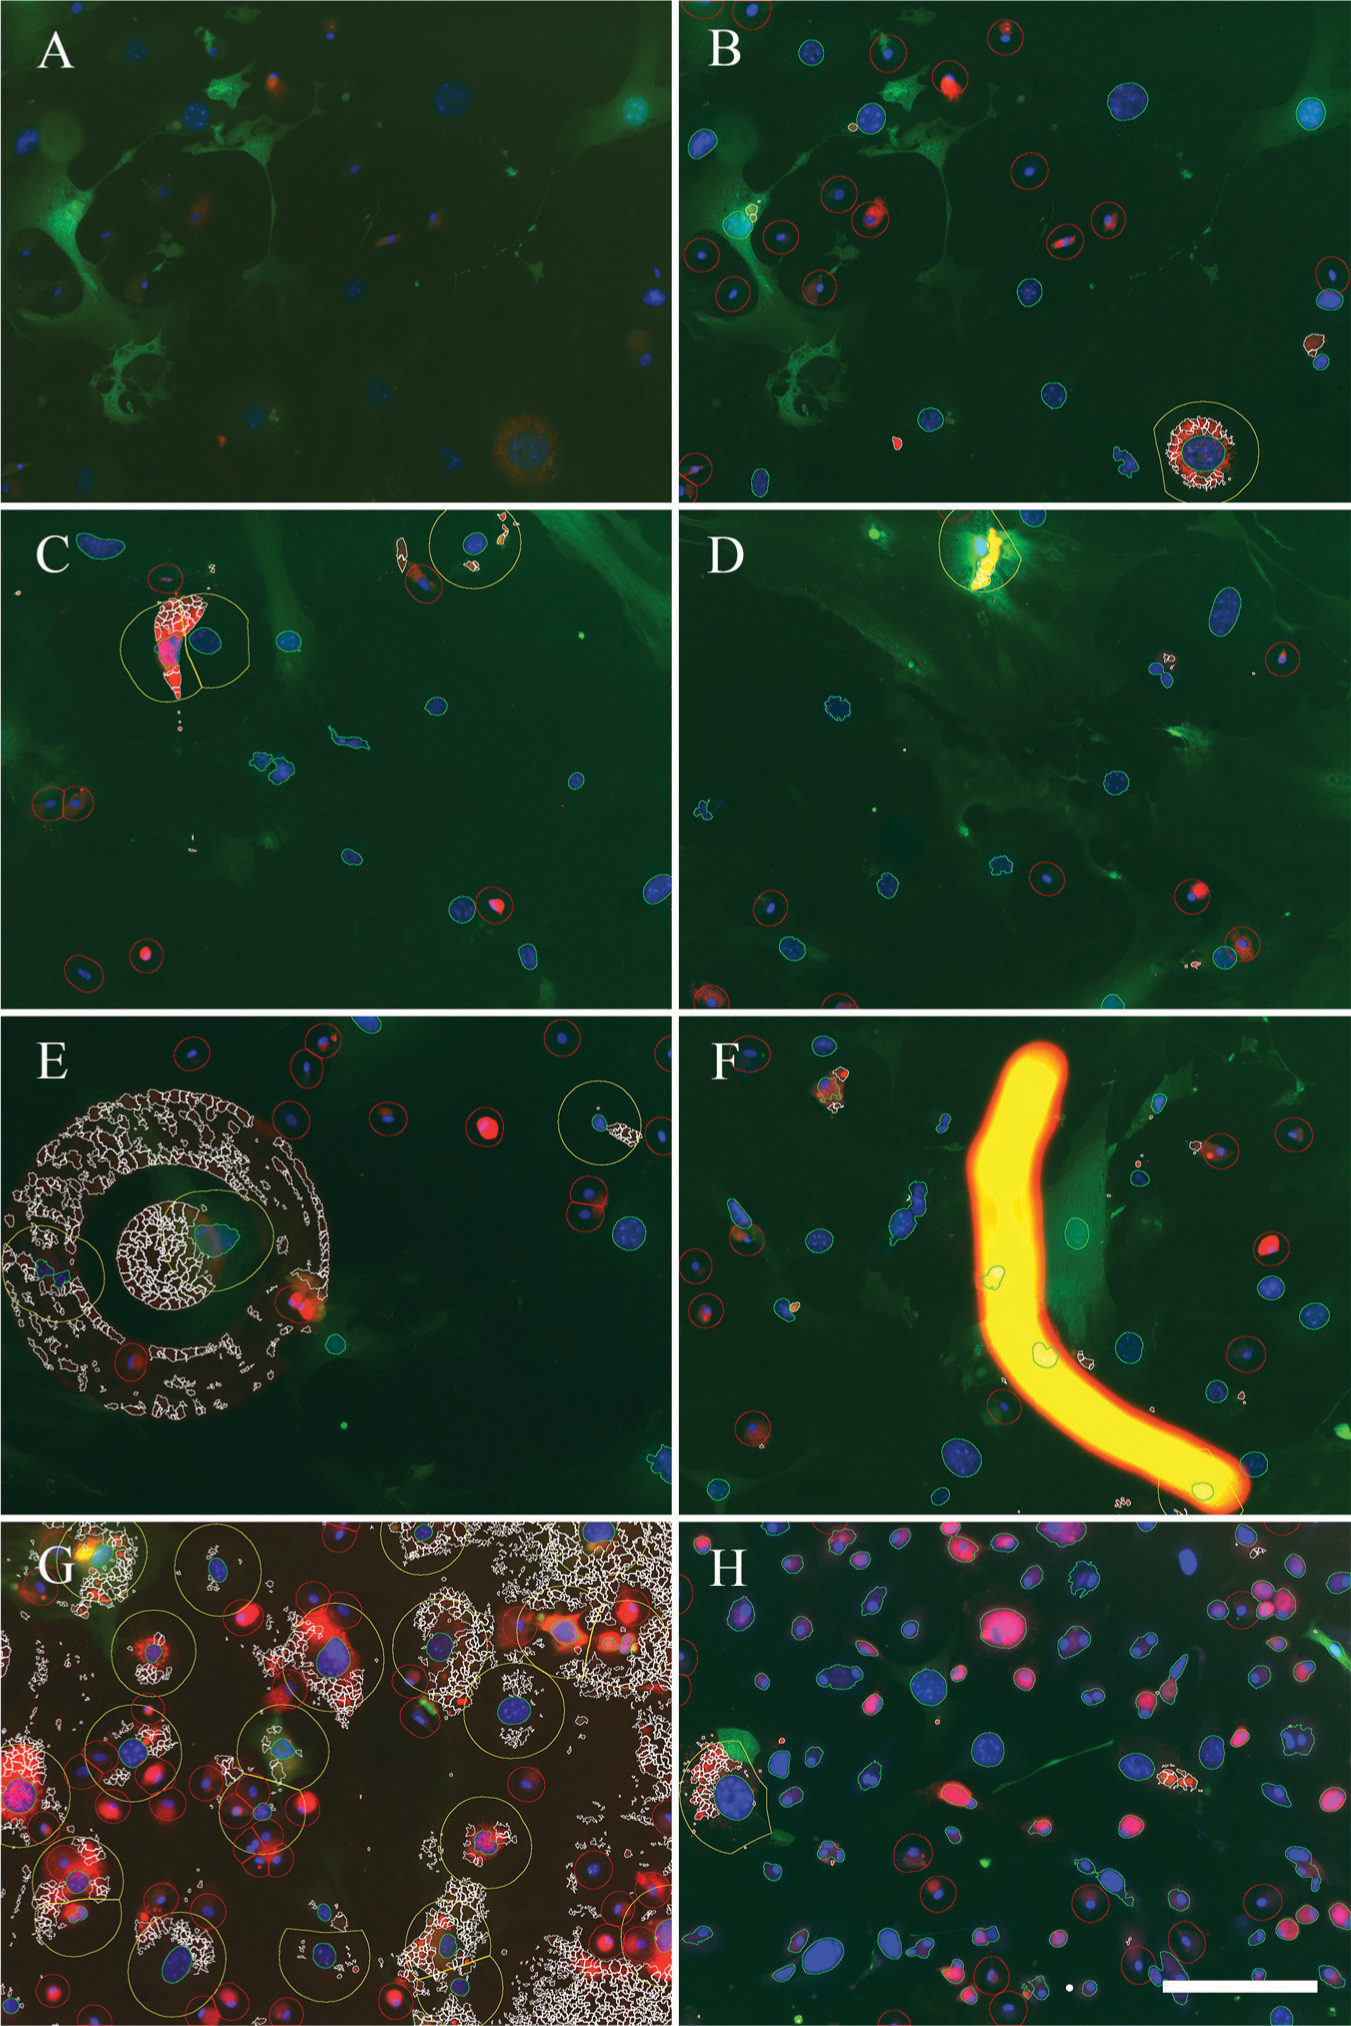
Examples of automatic image segmentation with the CP pipeline, including incorrectly segmented objects. (
The whole pipeline and sample images can be downloaded in the supplement section of this paper.
LoadImages: All TIF files were imported and named according to color channel. (“OrigBlue,” DAPI; “OrigGreen,” GFP; “OrigRed,” Alexa Fluor 594).
MeasureImageQuality: A local focus score for all “OrigBlue” images was calculated based on a resolution of 30 × 30 pixels to detect out-of-focus images.
FlagImage: All out-of-focus images were excluded from further processing based on a focus score below 0.07 [0.05].
IdentifyPrimaryObjects: Manual thresholding based on sample images was used for binarization and segmentation of all nuclei (“AllNuclei”). Objects with a diameter smaller than 10 pixels or larger than 140 pixels were excluded. Holes in objects were filled. Relative thresholds were used between 0.08 and 0.12 [0.16] ( Fig. 1E ).
MeasureObjectSizeShape: Size and shape features for all nuclei were measured to distinguish between MPs and mouse VSMCs during the next steps.
FilterObjects: All nuclei with an area larger than 749 pixels were classified as “VSMCNucleiUnfiltered.”
FilterObjects: All nuclei with an area smaller than 750 pixels were classified as “MacNucleiUnfiltered.”
MeasureObjectIntensity: Intensity features were measured for “VSMCNucleiUnfiltered.”
FilterObjects: All “VSMCNucleiUnfiltered” with a relative mean intensity greater than 0.6 [0.9] were removed from further analysis to exclude artifacts that may have the same size and shape of mouse VSMCs, but have been identified as too bright in initial quality controls and smaller test image sets. The remaining objects were then classified as “VSMCNuclei” ( Fig. 1G ).
MeasureObjectIntensity: Intensity features for “MacNucleiUnfiltered” were measured.
FilterObjects: Oversegmentation casually occurred on weakly stained mouse VSMCs. MP nuclei are brighter than mouse VSMC nuclei, however. Small, dull objects from “MacNucleiUnfiltered” with a mean intensity below 0.18 [0.3] were removed from the analysis. Often, these objects represent fragments of oversegmented VSMC nuclei and would otherwise have been handled as MPs. New objects are named “MacNuclei” ( Fig. 1F ).
ExpandOrShrinkObjects: “VSMCNuclei” were expanded by 70 pixels in each direction to include the perinuclear area, where the FL-acLDL signal is located, to the measured object area. New objects were named “Expanded VSMC” ( Fig. 1K ). Object outlines were named “Propagated VSMCOutlines.”
IdentifyPrimaryObjects: Manual thresholding based on sample images was used for segmentation of the red channel and detection of FL-acLDL. Relative thresholds were used between 0.11 and 0.15. Size restrictions were applied to remove artifacts and noise: Objects with a diameter smaller than 5 pixels or larger than 50 pixels were excluded. Several small FL-acLDL particles were usually detected as a single object, so they were separated based on local intensity peaks after the application of a blur filter with a pixel size of 5 to smooth the image. Objects were named “LDL” and outlines saved ( Fig. 1H ).
ExpandOrShrinkObjects: “MacNuclei” were expanded by 25 pixels in each direction to simulate MPs. New objects were named “Expanded MacNuclei” and outlines were named “Expanded MacNucleiOutlines” ( Fig. 1I ).
Relate Objects: FL-acLDL within “Expanded MacNuclei” was detected.
FilterObjects: FL-acLDL within “Expanded MacNuclei” was excluded from further processing, and the remaining FL-acLDL was classified as “LDL prefiltered.” This step was necessary to avoid false positives due to MPs situated on top of VSMCs without actual FL-acLDL being located within the VSMCs.
ExpandOrShrinkObjects: VSMCNuclei were shrunken by two rows of pixels and named “Shrunken VSMCNuclei.”
RelateObjects: All “LDL prefilteredObjects” located on “Shrunken VSMCNuclei” were detected.
FilterObjects: Objects from 18 were removed and new objects were classified as “LDL filtered” ( Fig. 1J ).
Relate Objects: All “LDL filtered objects” that were colocalized with “Expanded VSMC” were detected.
FilterObjects: All VSMCs containing at least six particles of FL-acLDL were filtered and classified as “LDL positive VSMC.”
FlagImage: All images that did not contain at least one “LDL positive VSMC” were removed from further processing.
MeasureObjectSizeShape: Measurements of “VSMCNuclei” and “MacNuclei” were taken to receive their total count.
ExportToSpreadsheet: Numbers of “VSMCNuclei,” “MacNuclei,” and “LDL positive VSMC” were exported as an MS Excel file.
ApplyThreshold: All pixels with a relative value smaller than 0.1 were removed from the “OrigRed” image. A new grayscale image was created (“ThreshRed”) with the purpose to remove background noise for the next step.
GrayToColor: The grayscale images “ThreshRed,” “OrigGreen,” and “OrigBlue” were combined into a new RGB image. Channels were weighted differently (red 5×, green 1×, blue 2×).
OverlayOutlines: Outlines of “LDL positive VSMC,” “Expanded MacNuclei,” “VSMC nuclei,” and “LDL filtered” were combined with the RGB image (“RGB Overlay”).
SaveImages: The “RGB Overlay” was saved as a TIF image. Steps 25–28 served the purpose to create a new RGB image that differs from the originals to highlight certain features in order to facilitate a manual control ( Fig. 1L ).
Send Email: An e-mail was sent after all images had been processed when this module was activated.
PauseCellProfiler: All processing was paused after each image when this module was activated. This step was only active for test runs.
Statistical Analysis and Tables
Statistical analysis, as well as tables, was performed with Prism 5 (GraphPad Software, Inc., La Jolla, CA). Results were expressed as mean ± standard deviation or mean ± standard error of the mean (SEM) and were considered as statistically significant with a p value of ≤0.05.
Hardware
Image analysis with CP was exclusively performed on a standard lab PC with the following specifications:
Operating system: Windows 7 Professional, 64 Bit, Service Pack 1
CPU: Intel Core2 Quad Processor Q9400 (6 MB Cache, 2.66 GHz, 1333 MHz FSB)
RAM: 4 GB
GPU: NVIDIA GeForce 210 (512 MB DDR2)
Results
Mouse VSMCs and MPs Can Be Distinguished Based on Nucleus Morphology
Because of difficulties with cell membrane permeabilization, autofluorescence in human VSMCs, and heterogeneous GFP expression in murine VSMCs, we solely differentiated MPs and mouse VSMCs based on morphology of the nucleus. Figure 3 shows the size distribution of nuclei from both cell types. Perfect segmentation cannot be achieved, but the error rate is small enough to be neglected. It worked nicely for mouse VSMCs that have been treated with mitomycin C properly to stop proliferation and were given enough time and space to grow in size (data not shown).
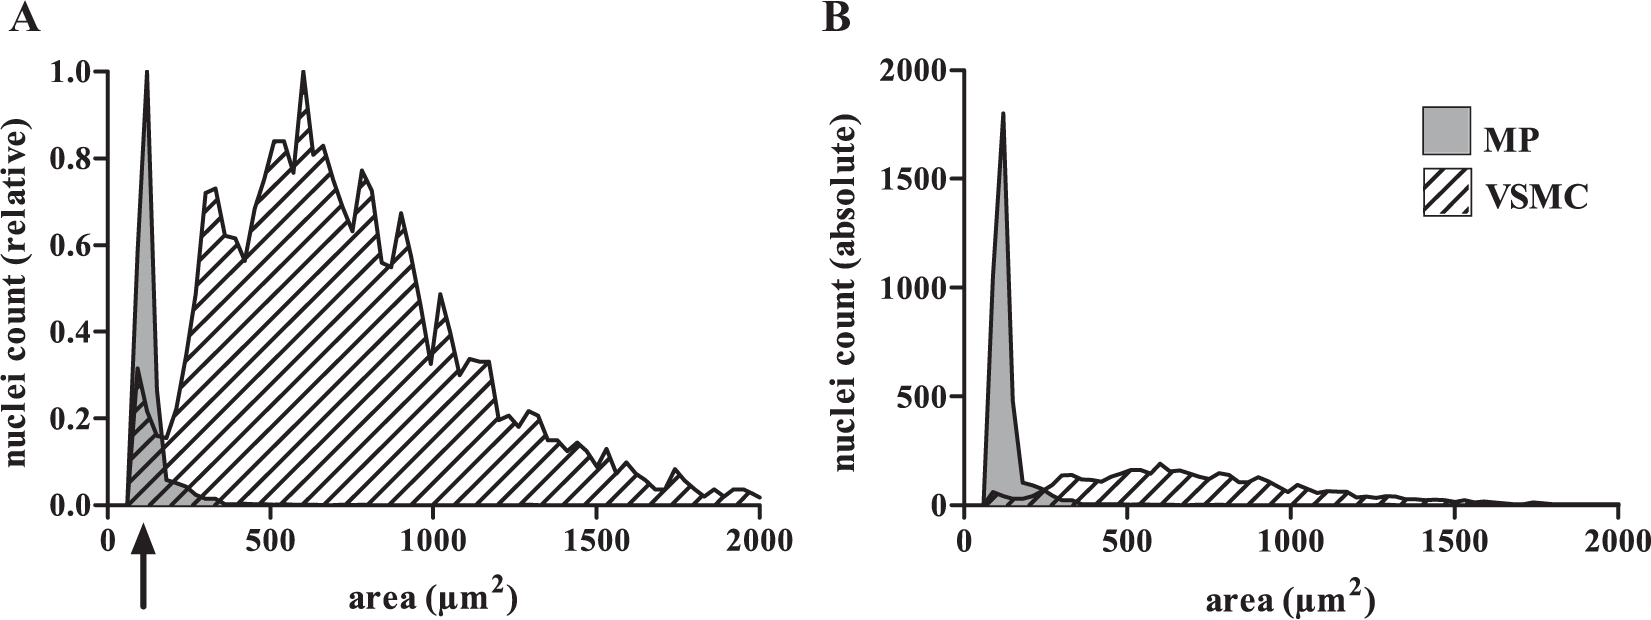
Nucleus size of mouse VSMCs and human MPs. Two hundred images of either solely DAPI-stained and fixed MPs or VSMCs from monocultures were analyzed with ImageJ to quantify phenotypic differences between human MPs and mouse VSMCs. Objects with an area ranging from 90 to 2000 µm2 are shown. (
Automatic Segmentation of VSMCs and MPs
With the knowledge that mouse VSMCs and MPs can be distinguished based on their nuclei, we performed control experiments on monocultures to validate the CP pipeline for segmentation of both cell types. Two hundred control images of about 5100 VSMCs and 4100 MPs in total were computed with different thresholds.
The effect of different thresholds on segmentation is shown in Figure 4 . Figure 5 shows that up to 97% of VSMCs are segmented correctly. Nuclear size did not change under hypoxic conditions. Therefore, the pipeline could also be used for the comparison of different O2 tensions.
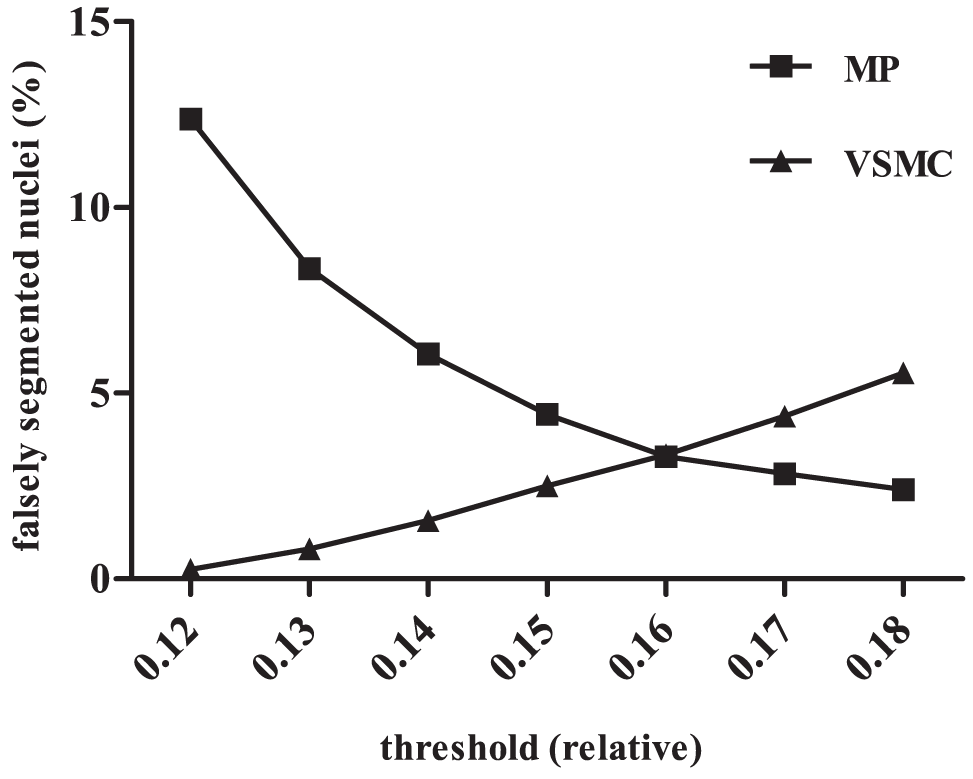
Error rates of nuclei segmentation, depending on different thresholds. Two hundred images of either human MPs or mouse VSMCs were analyzed with the CP pipeline and different thresholds. The error rate was defined as MPs detected as VSMCs and vice versa. A more stringent threshold led to a better segmentation of MPs because they were separated correctly. On the other hand, the error rate of VSMCs rose, since objects (VSMC nuclei) were not detected completely anymore, but shrank until their size matched MPs. A perfect segmentation was not possible, but the systematic error could be reduced to an acceptable level by choosing the right threshold. In this case, one would probably have chosen a value between 0.15 and 0.17. Sometimes, it was useful to favor a certain population, e.g., by focusing on the best detection of VSMCs if a flawed detection of MPs was acceptable.
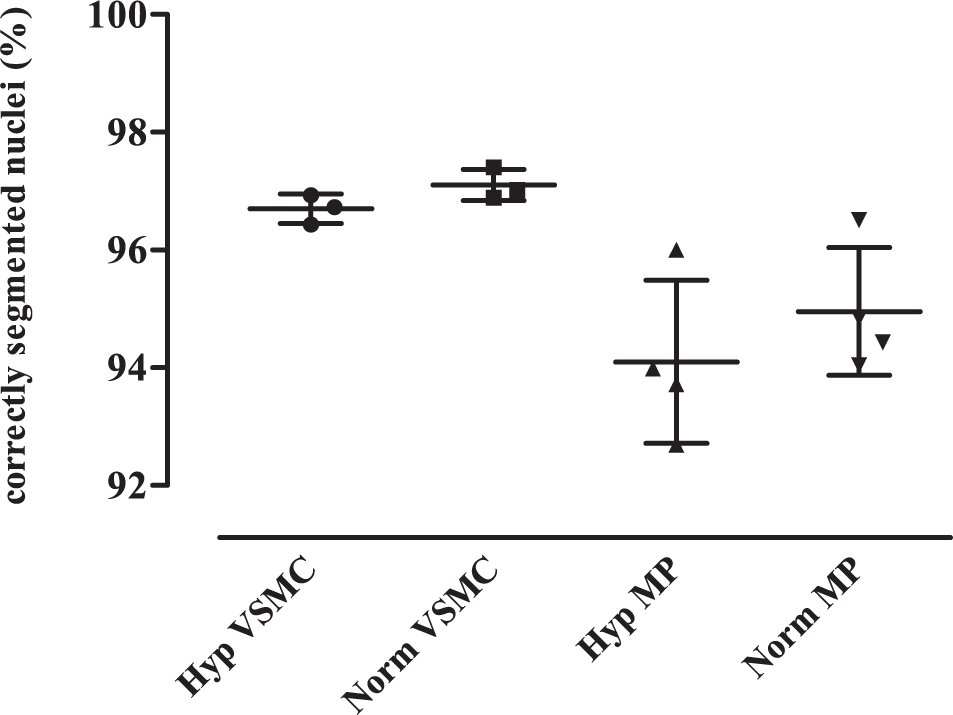
Success rate of nuclei segmentation. Fourteen samples of monocultures containing either MPs or mouse VSMCs were treated as usual, and 600 images were acquired from each sample. Analysis was performed with the CP pipeline and a relative threshold of 0.16. The amount of correctly segmented nuclei was ascertained. Detection of VSMCs worked significantly better than segmentation of MPs but was still acceptable at more than 90% (p = 0.0008, unpaired t test with Welch correction). For later investigations, the exact count of MPs was irrelevant anyway. Supposed FL-acLDL-positive VSMCs that were actually MPs were detected during the manual control.
Detection of FL-acLDL-Positive VSMCs and Manual Control
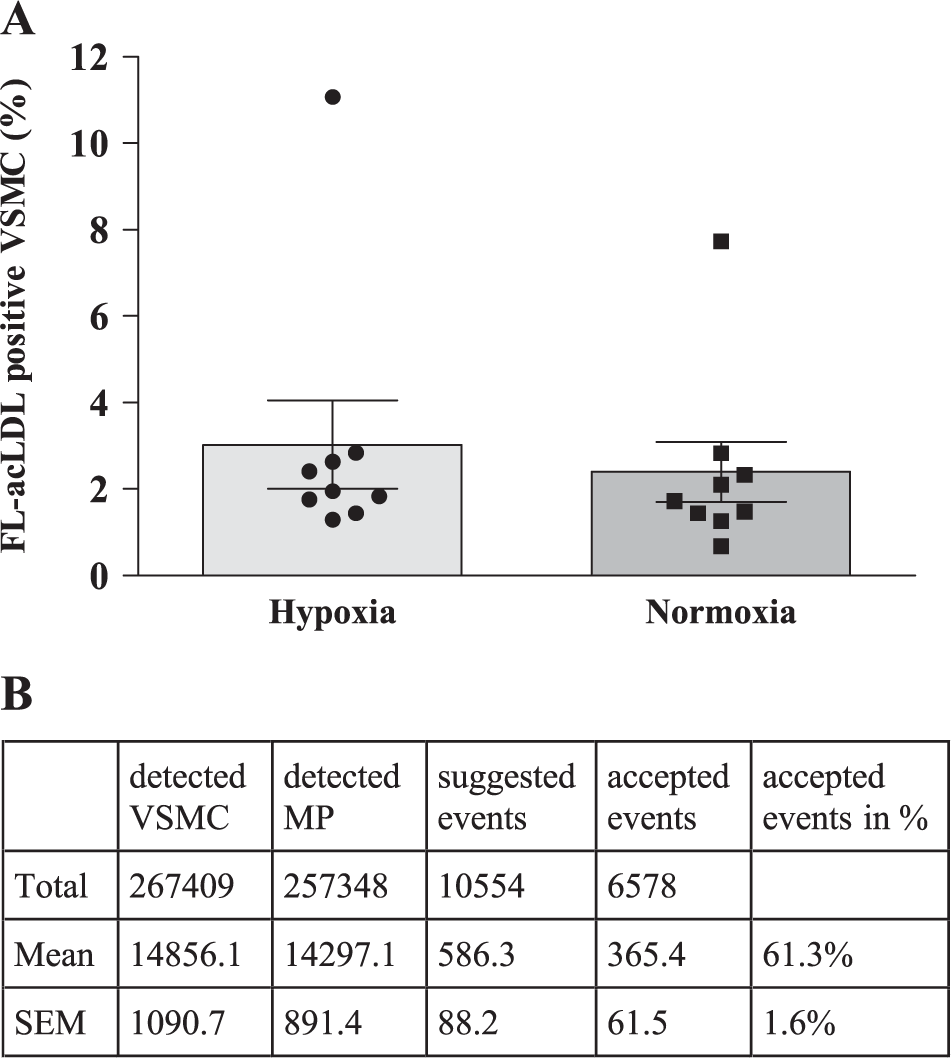
Our CP pipeline was used to differentiate between mouse VSMCs and human MPs and to detect FL-acLDL-positive VSMCs in the cocultures. Relevant images were exported with enhanced features as RGB images for manual control. The pipeline was suitable for a reliable detection of FL-acLDL-positive VSMCs. False positives could effectively be eliminated through manual control. Figure 6B shows a synopsis of our hypoxia main experiment. About half a million cells were analyzed in total. Out of 10,554 FL-acLDL-positive VSMCs that were initially suggested after processing, 6578 (61.3%) were found to be correct by manual control. About 100,000 single images were generated for this experiment. Exclusive manual analysis of this amount of data would be neither reasonable nor efficient. By using the CP pipeline, only 3.9% of the VSMCs had to be actually seen by an investigator. The remaining images could be analyzed much faster and objectively due to preprocessing by enhancing colors, removing noise, adding outlines, and removing images without any events. The amount of data was reduced by 63% from 11.1 MB of a ZVI file to 4.1 MB of the final RGB image. By combining low-threshold semiautomatic analysis with manual control, we achieved the highest amount of objectivity and efficiency in exploiting rare events in highly complex image data while ensuring that only a few FL-acLDL-positive VSMCs were missed. This method provides a higher validity than manual counting of cells, which relies on smaller samples and solely on a human investigator, thus being more prone to errors.
Results of the investigation on FL-acLDL transport from MPs to murine VSMCs and synopsis of the hypoxia experiment. (
Proof of Transport of Lipid-Laden Lysosomes from MPs to VSMCs under Hypoxic Conditions
The transport of lipid-laden lysosomes from MPs to VSMCs was investigated with nine paired samples. Cocultures from human MPs and mouse VSMCs were kept under hypoxic or normoxic conditions for 10 days before fixation, staining, and image acquisition. Analysis was performed with our CP pipeline and subsequent manual control. Figure 6A shows that FL-acLDL transfer happens under hypoxic conditions as well. There is no significant difference between normoxic and hypoxic conditions.
Discussion
The technical ability to perform automated image acquisition has arrived in most laboratories, but a lot of users cannot or do not use the full potential of their equipment. Even when acquired manually as a series of fields of view, most microscope users do not have profound knowledge of image processing and analysis. In our daily interaction with other microscope users and collaboration partners, we strive to generate awareness of the multitude of options that image analysis can provide today. Although widely spread image analysis software like ImageJ and Fiji is regularly used by us, there are problems that cannot be reasonably solved by mainly manual investigation, such as large image sets with rare events and a complex problem. Therefore, we tested automatization using the most complex fluorescence microscopy data created in our lab. We started as typically experienced ImageJ/Fiji users, performing object and intensity measurements via the “Particle Analyzer” module or assembling time lapse and wide-field deconvolution Z- stacks to movies or three-dimensional objects, and were able to establish a high-content image-based analysis. The given pipelines, sample image sets, and documentation of the CP site enabled us to have an easy start with most of the basic functions we needed, and when specific help was needed, the forum was a good place to interact and find answers.
On the one hand, there was the demand to make more out of our already existing equipment without spending a fortune; on the other hand, there was also a biological question with rare events, which seemed only solvable with a lot of manual labor or the establishment of a smaller image set. CP had already been established for years in the literature, but for its first usage, we would not trust an analysis of thousands of images without any manual control. Therefore, the whole approach was to sort out all images without any detected event (FL-acLDL-negative VSMCs) and to verify suggested events later. This step also allowed us to set the threshold relatively unrestricted, thereby granting that nearly none of the rare events were missed. Subsequently, manual control of the events detected by CP turned out to be correct only in 61.3% of events ( Fig. 6B ). Usage of automated unrestricted image acquisition can always result in images tainted with various artifacts, for example, dust or air bubbles, unspecific or autofluorescence, over- and undersegmentation, and out-of-focus images that were missed by previous filters. Further problems that occurred included images simply too complex even for our advanced algorithm, like those containing polynuclear cells, neighboring nuclei lying extremely close to each other, or simply MPs situated on top of VSMCs that were not removed in step 16 of our CP pipeline.
A variety of these obstacles are shown in Figure 2C–H and can easily result in misinterpretation by image segmentations. Therefore, an export of the analyzed imaging results as overlay or outline and a subsequent manual control proved to be superior to relying on the pure result from any image segmentation. Humans are still much more effective than filters within the image segmentation procedure. A more restricted setting of the thresholds, for example, a higher number of FL-acLDL signals within the perinuclear area (step 21) or lower expansion of the VSMC nuclei (step 12), would have yielded a lower number of totally suggested events, thereby lowering the manual work and heightening the acceptance rate, but would also have resulted in missed positive events, thereby corrupting the data. Since we were not interested in an absolute number but in a relative comparison between two conditions, a lower number of total events due to this systematic error would not have been a major problem. But with the combination of automatic and subsequent manual control, we strove to be as accurate as possible and to have the most control over the image analysis process. In the past, the combination of automatic analysis and manual control had been shown to be the most precise approach. 3 A variable thresholding played a crucial role in this pipeline because it directly affected the success rate of nuclei segmentation. The high amount of false positives was intended in order to avoid false negatives. By using test sets of images, the threshold was adjusted accordingly, as given in the brackets for single experiment duplicates, thereby taking experimental and biological variations into account. With this approach, although done manually, we acknowledge the work of Gilbert et al., who demonstrated that automatic iterations of thresholds and filters are superior to fixed settings. 18
One of the main problems at the beginning of our tests was the sample quality. Cocultivation of human VSMCs and human MPs was planned during the first approach. Immunocytochemistry was intended to differentiate between both cell types. However, human VSMCs showed significant autofluorescence, depending on culture time and probably attributed to the age pigment lipofuscin (data not shown), which has been described previously. 19 Another problem we faced was the fact that staining protocols could not be optimized in regard to preservation of the FL-acLDL signal. The protocols that enabled us to visualize smooth muscle actin within the VSMCs, and thereby discriminate between cell types, always led to the loss of FL-acLDL because of the organic solvents that had to be used. Therefore, we changed the cellular composition to a xenogeneic cell composure with GFP-positive VSMCs and human monocyte–derived MPs, knowing already from our previous work that a xenogeneic approach is valid. 14 Yet, we were not able to establish a CP pipeline that detected the GFP-positive VSMCs with absolute accuracy due to highly variable expression levels of GFP on the single cell level. A critical evaluation of the images led to the final idea to use the nuclear size as the discriminator between both cell types, and to use the GFP expression of the VSMCs for a fast evaluation of the suggested results for manual control. Subsequently, monocultures of each cell type were used to carve out differences in nuclear size and intensity ( Fig. 3 ). These single cultures were also used to optimize the initial relative threshold, as given in Figure 4 . Nevertheless, a perfect discrimination by automatic segmentation was not possible, but the systematic error could be reduced to an acceptable level ( Fig. 5 ), thereby not putting too much workload into the manual control part. To facilitate the manual control, single-channel enhanced RGB TIFs with analysis result overlays were merged into one image and exported in steps 25–28 of the CP pipeline. Although we analyzed only one specific feature of our samples, CP and high-content analysis are able to provide even more information and probably reveal unsuspected features within the sample. 20
Most actual imaging platforms are already prepared to acquire large image sets, for example, Zeiss acquisition modules “mark and find” and “MosaiX” and Leica’s “Power Mosaic” and “MultiStep,” or can be easily adopted, for example, with the micro-Manager. 21 However, image-based research results should probably rely on a more representative basis by acquiring more images and using automatic selection of the fields of view. In order to process these data and spend less time on manual analysis or counting, one needs to get used to image analysis tools like ImageJ, Fiji, and CP. Furthermore, one of the big advantages of open-source imaging software is that the user can adapt them to their special needs as well. Even more importantly, one can make use of plug-ins and sample pipelines already described and established in the scientific community.
If the research is focusing on rare events, one might only use a CP pipeline to presort images, thereby gaining more time for the actual problem. And in our opinion, the use of CP or comparable image analysis tools does not apply only to microscopy. It might also be an applicable tool for image analysis in all fields of clinical imaging. Combining automatic analysis with manual control might be a good starting point for beginners in the field of automated image analysis, especially since semiautomatic procedures have been shown to be more efficient and accurate than fully automatic analysis. 3
An investigator is not capable of analyzing thousands of images within minutes to hours, detecting and counting objects, and screening for certain features as we did with the CP. Yet, the human brain is unrivaled in its faculty of abstraction. It is obvious to utilize a combination of processing power and human competence, hence opening up new possibilities in the analysis of biomedical and other data.
Footnotes
Supplementary material is available online with this article.
Author Contributions
MR, SW, and RCBD contributed to the conception and design of the experiments. MR performed cell culture, immunocytochemistry/staining, and fluorescence microscopy; developed the CP pipeline; and performed the semiautomatic segmentation. SW performed and analyzed experiments. RCBD provided funding. MR and SW drafted the manuscript. All authors analyzed the data and have read and approved the final manuscript.
Declaration of Conflicting Interests
The authors declared no potential conflicts of interest with respect to the research, authorship, and/or publication of this article.
Funding
The authors disclosed receipt of the following financial support for the research, authorship, and/or publication of this article: This work was supported by a grant from the Deutsche Forschungsgemeinschaft (SFB 854 TP2).
References
Supplementary Material
Please find the following supplemental material available below.
For Open Access articles published under a Creative Commons License, all supplemental material carries the same license as the article it is associated with.
For non-Open Access articles published, all supplemental material carries a non-exclusive license, and permission requests for re-use of supplemental material or any part of supplemental material shall be sent directly to the copyright owner as specified in the copyright notice associated with the article.