
Abstract
The tumor microenvironment plays an important role in the processes of tumor growth, metastasis, and drug resistance. We have used a multilayered 3D primary cell culture model that reproduces the human ovarian cancer metastatic microenvironment to study the effect of the microenvironment on the pharmacological responses of different classes of drugs on cancer cell proliferation. A collection of oncology drugs was screened to identify compounds that inhibited the proliferation of ovarian cancer cells growing as monolayers or forming spheroids, on plastic and on a 3D microenvironment culture model of the omentum metastatic site, and also cells already in preformed spheroids. Target-based analysis of the pharmacological responses revealed that several classes of targets were more efficacious in cancer cells growing in the absence of the metastatic microenvironment, and other target classes were less efficacious in cancer cells in preformed spheres compared to forming spheroid cultures. These findings show that both the cellular context of the tumor microenvironment and cell adhesion mode have an essential role in cancer cell drug resistance. Therefore, it is important to perform screens for new drugs using model systems that more faithfully recapitulate the tissue composition at the site of tumor growth and metastasis.
Keywords
Introduction
Traditionally, the screening of large collections of compounds to discover new cancer drugs has been performed using cell proliferation assays in which cells grow as monolayers attached to plastic surfaces. However, there is now ample evidence that the tumor microenvironment is critical for tumor physiology and pharmacological responses to drug treatments in vivo.1–4 Although current monolayer growth assays on plastic capture the proliferative aspect of cancer cells, the cellular complexity of the tumor and the interactions with the microenvironment are not included, and as a consequence, the activity of drugs in these assays can be quite different from the activity in vivo. In vivo, tumor physiology is modulated by its niche through direct cell-to-cell contact,5,6 secreted signaling molecules,7,8 and physical properties of the environment like low pH or oxygen levels. These factors modify drug penetration into the tumor, regulate expression of cellular drug transporters, modulate signaling pathways, and, in general, activate mechanisms that in many cases render the cells less susceptible to the effects of drugs. 2 It is therefore critical to develop assays in which the tumor microenvironment is included so that the effects of the drugs better mimic those seen in clinic for native tumors.
The standard of care for high-grade serous ovarian carcinoma (HGSOC) has shifted to neoadjuvant and dose-dense chemotherapy, including platinum and taxane, followed by cytoreductive surgery. 9 However, the rate of ovarian cancer recurrence within 2 years of initial treatment remains the same. Therefore, new effective therapeutic regimens are needed to treat HGSOC. In an attempt to find more effective therapies for HGSOC, we developed a 3D culture model that captures the interaction of ovarian cancer cells with the omentum metastatic niche. 10 The assay system included a 3D layered omentum model with human omentum-derived mesothelial and fibroblast cells, together with collagen type I and fibronectin, as extracellular matrix (ECM) elements, and measured the adhesion of ovarian cancer cells to this layered omentum as an assay for ovarian cancer metastasis. We have previously demonstrated that this 3D layered assay system that mimics the ovarian cancer metastatic niche could be adapted to 384-well and 1536-well microtiter plate formats for large-scale high-throughput screening (HTS). 11 Compounds that prevent attachment of HGSOC cells to the omental model were identified, and validated in vivo. These compounds could potentially be developed as potential antimetastatic drugs.
In the study reported here, the goal was to identify compounds that prevented cancer cell proliferation in the context of the metastatic ovarian cancer niche. Our hypothesis was that compounds might produce different cytotoxic effects in the cellular and extracellular contexts of the metastatic ovarian cancer microenvironment. Therefore, we adapted the 3D omentum layered system to investigate the effect of the metastatic niche on the growth of ovarian cancer cells and on the pharmacological responses of a collection of 1912 oncology drugs of the NCATS Mechanism Interrogation PlatE (MIPE) oncology collection.12–14 Target-based analysis of the pharmacological responses revealed that compounds modulating many targets were more efficacious in cells growing on plastic than on the omental microenvironment, implying that the cellular context and a 3D environment have important effects in drug resistance. These results underscore the importance of performing screens for new drugs using model systems that more faithfully recapitulate tissue composition of the site of tumor growth.
Materials and Methods
Cell Lines and Reagents: The human ovarian cancer (OvCa) cell line, HeyA8, was provided by Dr. Gordon B. Mills (MD Anderson Cancer Center) and is cultured in Dulbecco’s modified Eagle’s medium (DMEM) with 10% fetal bovine serum, 1% penicillin–streptomycin, and 1% L-glutamine. The cells were validated by short tandem repeat DNA fingerprinting using the AmpFℓSTR Identifier kit (Applied Biosystems, Waltham, MA, USA) and compared with known American Type Culture Collection fingerprints, the Cell Line Integrated Molecular Authentication database (CLIMA), and the University of Texas MD Anderson Cancer Center fingerprint database. The green fluorescent protein (GFP)-labeled HeyA8 OvCa cells were constructed using a lentivirus vector expressing copepod GFP (CD511B-1) and the lentivirus packing kit (LV500A-1). The lentivirus vector expressing copepod (c)GFP (CD511B-1) and the lentivirus packaging kit (LV500A-1) were purchased from System Biosciences (Mountain View, CA, USA). Specimens of fresh human omentum were obtained from patients undergoing surgery for benign conditions and those who provided informed consent before surgery. The protocol was approved by the University of Chicago Biological Sciences Division/the University of Chicago Medical Center Institutional Review Board. Primary human mesothelial cells and fibroblasts were isolated from normal human omentum, and purity was verified by vimentin and cytokeratin immunohistochemistry. 10 All primary human fibroblasts and mesothelial cells were used within the first two passages after isolation. All primary human cells were collected and stored in liquid nitrogen immediately after isolation for use in screens. They were maintained in DMEM with 10% fetal bovine serum, 1% penicillin– streptomycin, and 1% L-glutamine. Stem cell media (SCM) contained 10 ng/mL human basic fibroblast growth factor (FGF-Basic, Sigma F0291; Sigma Aldrich, St. Louis, MO, USA), 20 ng/mL human epidermal growth factor (EGF, Sigma E9644), and 0.4% bovine serum albumin (BSA, Sigma A9418) supplemented with 1× Insulin Transferrin Selenium (Gibco 51300-044; Life Technologies, Carlsbad, CA, USA) and 1% KnockOut Serum Replacement (Gibco 10828-028). The positive control compound bortezomib was purchased from Selleck (Houston, TX, USA).
1536-Well Cell Proliferation Assays: Assays were conducted in sterile, tissue culture–treated, 1536-well white solid-bottom tissue plates (catalog no. 789173-F; Greiner Bio-One, Monroe, NC, USA). For the monolayer cell growth assay, 500 Hey A-8 GFP cells per well were seeded in 5 µL DMEM supplemented with 10% fetal bovine serum and 1× penicillin–streptomycin in sterile, tissue culture–treated, 1536-well white solid-bottom tissue plates (catalog no. 789173-F; Greiner Bio-One) using a Multidrop Combi Reagent dispenser and a small pin cassette (Thermo Scientific, Fisher Scientific, Fair Lawn, NJ, USA). After overnight incubation, 23 nL of compound solution in DMSO was transferred using a Kalypsys pintool (San Diego, CA, USA). The plates were then covered with stainless-steel Kalypsys lids and placed into an incubator at 37 °C with 5% CO2 and 95% relative humidity for 48 h, and then 3 µL of CellTiter-Glo assay from Promega (Madison, WI, USA) was added using a BioRAPTR (Beckman Coulter, Brea, CA, USA). Plates were incubated for 30 min at room temperature and spun at 1000 rpm, and relative luminescence units (RLUs) were quantified using a ViewLux (PerkinElmer, Waltham, MA, USA). For cells forming spheres conditions, spheres were first grown in a T75 ULA flask (catalog no. 3814; Corning, Corning, NY, USA) in 50 ml of SCM+KO+ITS with 5000 cells per ml for 7–14 days. Spheres were then dispersed with trypsin and spun, and the cell pellet was resuspended in the required amount of SCM+KO+ITS to seed 500 cells in 5 µl per well of 1536-well, white solid-bottom tissue plates using a Multidrop Combi Reagent dispenser and a small pin cassette. SCM contained 10 ng/mL human FGF-Basic (Sigma F0291), 20 ng/mL human EGF (Sigma E9644), and 0.4% BSA (Sigma A9418) supplemented with 1× Insulin Transferrin Selenium (Gibco 51300-044) and 1% KnockOut Serum Replacement (Gibco 10828-028). Compound addition and 48 h incubation were performed as described above for the 2D cell line growth assay. RLUs for each well were normalized to the median RLUs from the DMSO control wells as 100% viability, and median RLUs from the no-cell control wells as 0% viability. For preformed spheres, spheres were first grown in a T75 ULA flask (Corning 3814) in 50 ml of SCM+KO+ITS with 5000 cells per ml for 7–14 days. Spheres were then dispersed with trypsin and spun, and the cell pellet was resuspended in the required amount of SCM+KO+ITS to seed 500 cells in 8 µl of SCM+KO+ITS per well using the Multidrop Combi. Plates were then sealed with an adhesive plate seal (aluminum thermovell sealing tape, Corning 6569) and placed in the incubator at 37 °C with 5% CO2 and 95% relative humidity. After 7 days, stainless-steel lids from Kalypsys were used to cover the plate to be able to automate the compound addition and detection reagent. Compound addition and 48 h incubation were performed as described above. RLUs for each well were normalized to the median RLUs from the DMSO control wells as 100% viability, and median RLUs from the no-cell control wells as 0% viability.
Layered ECM: For the assay conditions in which cells were grown on top of the ECM, an ECM layer was first constructed by adding 0.02 µg fibronectin and 0.02 µg collagen type I in 4 µl per well DMEM supplemented with 10% fetal bovine serum, 1% penicillin– streptomycin, and 1% L-glutamine using a Multidrop Combi Reagent dispenser and a small pin cassette. The plates were then covered with stainless-steel Kalypsys lids and placed into an incubator at 37 °C with 5% CO2 and 95% relative humidity for 48 h. Hey-A8 GFP cells were added as described before, depending on the growth mode.
For the determination of the cell proliferation rates on ECM, the ECM was dispensed 4 µl/well into 1536-well, black clear-bottom tissue plates (E8 1B1-210000; LW Scientific, Lawrenceville, GA, USA) with 0.02 µg fibronectin and 0.02 µg collagen type I in DMEM, and 40 µl/well in 384-well black clear-bottom tissue plates (Corning 3712) with 0.2 µg fibronectin and 0.2 µg collagen type I in DMEM. The plates were placed in the incubator at 37 °C with 5% CO2 and 95% relative humidity. For 1536-well plates, the same protocol was used as described above. Hey-A8-GFP cells were added to the wells: 1000 cells for 384-well plates and 250 cells for 1536-well plates. The 384-well plates were placed in an IncuCyte ZOOM (Essen BioScience, Ann Arbor, MI, USA) in an incubator set to 37 °C with 5% CO2 and 95% relative humidity for 72 h after the addition of Hey-A8 cells. Percent confluency from the GFP signal was calculated using the IncuCyte ZOOM software. The 1536-well plates were incubated in an incubator at 37 °C with 5% CO2 and 95% relative humidity; GFP signal produced by the cells was quantitated total fluorescence area (µm2) in a well using a fluorescent cytometer (TTP Labtech Acumen eX3; TTP Labtech, Melbourn, UK) at each time point, and growth rates were reported as changes in confluency of the GFP-expressing cells, calculated as the percentage of the area of GFP signal to the total well surface area of the bottom of the well (2.5e 6 µm2, http://csmedia2.corning.com/LifeSciences/Media/pdf/cc_surface_areas.pdf) per hour.
Layered 3D Omentum: For the assay conditions in which cells were grown on top of the omental layer, the omentum was constructed by seeding 40 primary human omental fibroblasts and 400 mesothelial cells with 0.02 µg fibronectin and 0.02 µg collagen type I in 4 µl of growth media using a Multidrop Reagent Combi dispenser. The plates were then covered with stainless-steel Kalypsys lids and placed into an incubator at 37 °C with 5% CO2 and 95% relative humidity for 48 h. Hey-A8 GFP cells were added as described before depending on the growth mode.
For the determination of the cell proliferation rates on layered 3D omentum, primary human omental 400 fibroblasts and 4000 mesothelial cells were seeded with 0.2 µg fibronectin and 0.2 µg collagen type I in 40 µl DMEM into 384-well clear-bottom tissue plates using a Multidrop Combi Reagent dispenser. The plates were placed in the incubator at 37 °C with 5% CO2 and 95% relative humidity. For 1536-well plates, the same protocol was used as described above. Hey-A8-GFP cells were added to the wells: 1000 for 384-well plates and 250 cells for 1536-well plates. The 384-well plates were placed in an IncuCyte ZOOM (Essen BioScience, Ann Arbor, MI, USA), in an incubator set to 37 °C with 5% CO2 and 95% relative humidity for 72 h, after the addition of Hey-A8 cells. Percent confluency from the GFP signal was calculated using the IncuCyte ZOOM software. The 1536-well plates were incubated in an incubator at 37 °C with 5% CO2 and 95% relative humidity, and GFP signal total number of fluorescent cells were quantitated using a fluorescent cytometer (TTP Labtech Acumen eX3) at each time point as described above.
Mechanism Interrogation PlatE (MIPE) Compound Library: The library used in these studies is an NCATS internal collection of 1912 small molecules known to modulate oncology targets, pathways, and phenotypes, referred to as the MIPE-oncology library.12–14 The library includes approved drugs, compounds in clinical development for cancer treatment, and compounds in preclinical development. In addition, when feasible, the library includes several compounds for each target class or cellular mechanism and process. In many cases, a compound might have known polypharmacology (e.g., kinase inhibitors), and the intended target for which the compound was developed was used for target enrichment analysis.
Quantitative High-Throughput Screening (qHTS): For the screen, the compounds in the MIPE library were transferred to columns 5–48, and controls were added in columns 1–4 of the 1536-well assay plate. Column 1 contained media only, column 2 contained cells with added DMSO, and columns 3 and 4 contained the proteosome inhibitor bortezomib (final concentration 10 µM). Compounds were tested as dose responses starting at a stock concentration of 10 mM (final compound concentration of 46 µM) in DMSO, and diluted threefold, also with DMSO. The library was tested at 11 compound concentrations for qHTS analysis as described previously. 15 RLUs for each well were normalized to the median RLUs from the DMSO control wells as 100% viability, and median RLUs from control wells with media only as 0% viability.
Hit Selection from qHTS: Activity of the compounds from the dose response qHTS screen was determined based on three parameters: (1) curve response class (CRC) classification from dose response HTS, in which normalized data is fitted to four-parameter dose response curves using a custom grid-based algorithm to generate the CRC score for each compound dose response.15,16 CRC values of −1.1, −1.2, −2.1, and −2.2 are considered the highest quality hits; CRC values of −1.3, −1.4, −2.3, −2.4, and −3 are inconclusive hits; and a CRC value of 4 denotes inactive compounds. (2) Percentage viability at the maximum concentration of compound tested (maximum response parameter, or MAXR); and (3) logAC50. See the Supplementary Material for lists of MAXR, CRC, and logAC50 for the compounds screened in all conditions.
Principal Components Analysis (PCA): We considered the subset of 1341 MIPE compounds that were annotated with a primary target (corresponding to 388 unique targets). Furthermore, we consider those targets for which three or more compounds were tested, resulting in a final set of 150 targets. Using this set of targets, we aggregated the per-compound curve-fit parameters by target for each protocol (i.e., cell type). The aggregated parameters were then converted to Z-scores. As a result, each cell type is represented by a 150-element vector of Z-scores. When computing the PCA for MAXR, we considered all 1341 compounds, but for LogAC50, we considered the subset of compounds that had a curve class of −1.1, −1.2, −2.1, and −2.2. Based on the target vector representation, we computed the PCA using the prcomp function from R 3.3.1. 17 We then visualized the analysis by plotting the first two principal components (which explained 71.3% and 50.1% of the total variance for the MAXR and LogAC50 cases, respectively).
Target Enrichment Analysis: Given a selection of compounds, we identified the annotated targets for these compounds and computed the enrichment for each target, compared to background, using Fisher’s exact test. 18 For this test, the background was defined as all the targets annotated in the MIPE collection. The p-value from the test was adjusted for multiple hypothesis tests using the Benjamini–Hochberg method. 19
Target Differential Analysis (Pairwise Protocol Comparison): We quantified differential behavior of individual curve fit or HTS parameters (MAXR and logAC50) between two assay conditions in a target-wise fashion. For any two cell growth conditions, we collected the parameter of interest for each compound, grouped by target. We only considered those targets for which there were at least three compounds annotated with the target. For the case of MAXR, all compounds tested were considered. For the case of logAC50, we only considered compounds that exhibited high-quality curve classes (CRC scores of −1.1, −1.2, −2.1, and −2.2). The median values for each parameter were calculated for each target, and differences in median value were estimated using the Mann–Whitney test. 20 The p-values from the test were adjusted for multiple hypothesis tests using the Benjamini–Hochberg method. Results of the pairwise protocol target differential analysis are included in the “Lal et al. Omentum qHTS Target Differentiation Analysis” Excel file in the supplemental material.
Target Differential Analysis (Multiple Protocol Comparison): We performed a differential analysis using analysis of variance (ANOVA) on the individual curve fit parameters (i.e., MAXR and logAC50). We grouped data from assay protocols based on assay conditions (monolayer, sphere, preformed sphere, or omentum) and considered the subset of 1341 compounds with annotated targets (only considering targets for which there were at least three compounds). For MAXR-based analysis, we included data on all compounds, whereas for logAC50, we considered the set of compounds whose curve classes were one of the following: −1.1, −1.2, −2.1, and −2.2. The ANOVA model was then specified (for the MAXR case) as:

where ctype corresponds to the cell type, and gene corresponds to the compound’s annotated primary target. A similar model was built for logAC50. We then performed a post-hoc analysis using Tukey’s range test 21 to identify targets whose compounds showed a statistically significant difference (p < 0.05, after correction using the Benjamini–Hochberg method) between pairs of cell types.
Results
Determination of Growth Rates of Hey-A8 Cells on the 3D Omentum Layered System in 384- and 1536-Well Microtiter Plates
To investigate whether the tumor microenvironment has an effect on pharmacological responses to drugs, we screened the oncology collection of cells proliferating both as monolayers and in conditions in which cells formed spheroids, directly on a plastic surface, on a layer of ECM (collagen and fibronectin), and on a 3D layered omentum model (primary human omental fibroblasts and mesothelial cells, collagen, and fibronectin). We further compared the pharmacological responses obtained for cells growing as monolayers or toward forming spheres to those obtained in 3D preformed sphere cultures to further determine whether any of the differences observed were due to the effects of the omentum layer or cell adhesion mode. We also screened the library against the 3D layered culture model without adding the ovarian cancer cells, as a control condition for cytotoxic effects on the omentum (see Fig. 1A for a schematic of assay modes screened).
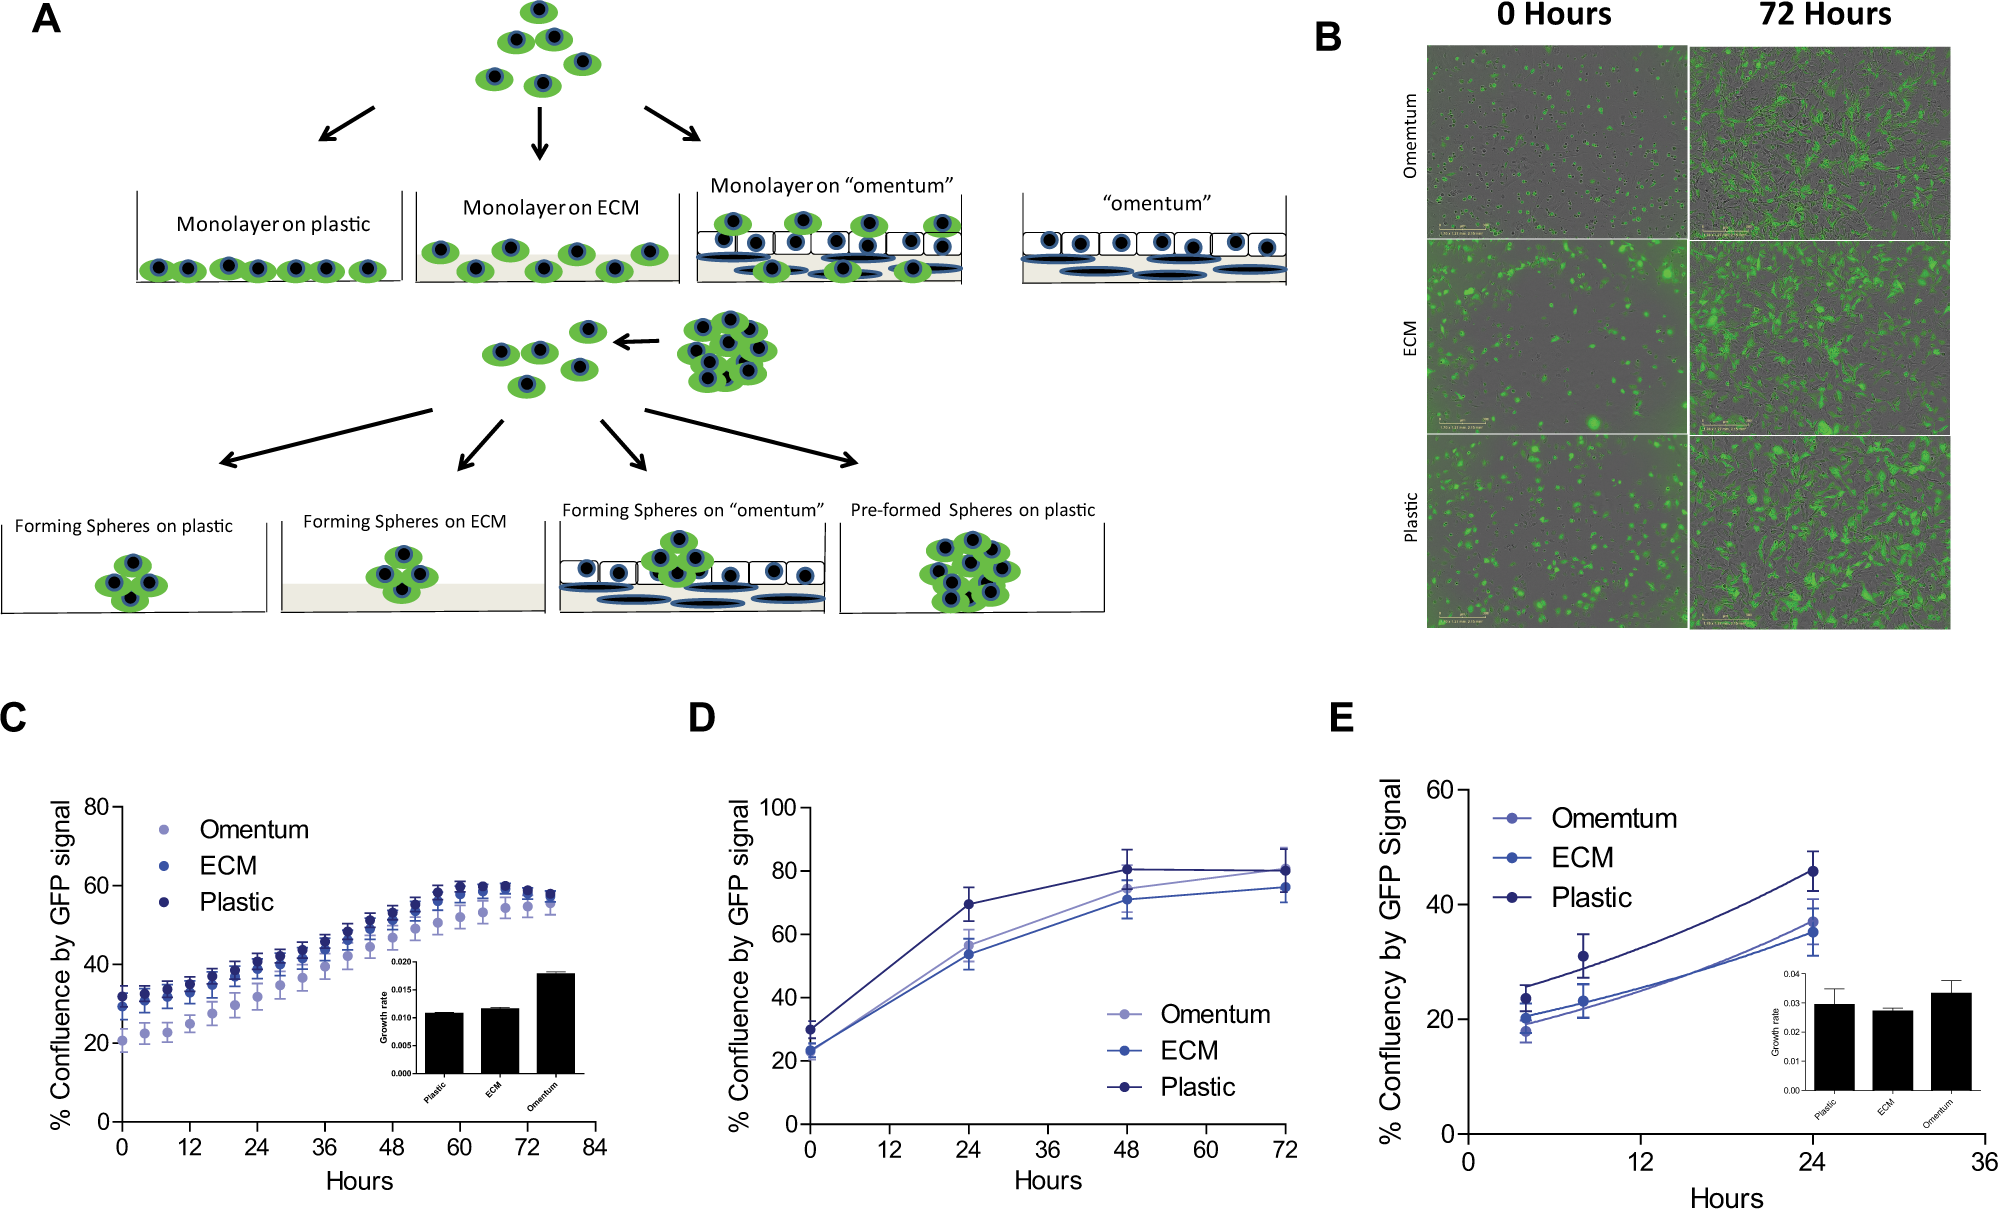
Determination of cell proliferation rates. (A) Schematic of the eight assay conditions used for screening. (B–C) Hey-A8-GFP cells were seeded in wells of a 384-well plate at 1000 cells per well, and percent confluency was measured with an IncuCyte ZOOM instrument in an incubator. Images of cells taken with the IncuCyte ZOOM show the increase in confluence, and how the percent confluency by green fluorescent protein (GFP) does not reach 100% due to some heterogeneity in the population of GFP-expressing cells. Data was exported to GraphPad, and data points higher than 50% confluence were excluded before fitting to an exponential growth function to obtain growth rates (insert), as percent confluency GFP signal per hour. (D–E) Hey-A8-GFP cells were seeded in wells of a 1536-well plate at 250 cells per well, and percent confluency was measured from the GFP fluorescence signal using an Acumen fluorescent cytometer reader (TTP Labtech). Data from shorter time points was exported to GraphPad, and fitted to an exponential growth function to obtain growth rates (insert) as percent confluency GFP signal per hour. Error bars are expressed as SD.
When comparing pharmacological responses between different cells or cell growth conditions, it is important to determine that the cells are growing at similar growth rates; otherwise, the efficacy and potency of certain classes of compounds (e.g., compounds that regulate cell cycle checkpoints) might be more effective in those cells that grow faster in vitro. We first determined the exponential growth rates for the Hey-A8 cells in both 384- and 1536-well microplate formats in the different assay conditions. In the 384-well format, we used an IncuCyte ZOOM real-time confluency measurement using the GFP signal expressed by the cells, and determined that the proliferation rate at the exponential growth phase was similar regardless of the surface, whether plastic, ECM coated, or omentum coated ( Fig. 1B and 1C ). For the 1536-well format used for screening, we measured GFP signal expressed by the cells as total fluorescence area (µm2) in a well using an Acumen Explorer (TTP Labtech), and we reported growth rates as percent confluency of the GFP-expressing cells using a total well surface area of the bottom of the well as 100% confluence. The growth rates of Hey-A8 cells grown on plastic, ECM, or omentum were also similar ( Fig. 1D and 1E ).
Dose Response Quantitative Screening of the MIPE Oncology Collection
After characterizing the cell growth rates in the different assay conditions, the dose response screening of the NCATS MIPE oncology collection was performed. Eight assay conditions were compared using the cell proliferation reagent CellTiterGlo as a readout with Hey-A8 cells grown as follows (see Fig. 1A ): (1) as a monolayer on omentum culture, (2) as a monolayer on ECM, (3) as a monolayer on plastic, (4) forming spheres on omentum culture, (5) forming spheres on ECM; (6) forming spheres on plastic, (7) preformed spheres on plastic, and (8) a control condition of omental cell culture alone. The omentum culture was composed of primary human omental mesothelial and fibroblast cells, with collagen type I and fibronectin, while the ECM culture was composed of collagen type I and fibronectin without cells. For the dose response screens, compounds were tested at 11 doses, starting at 46 µM, and diluted threefold to generate dose responses. Data was analyzed using the curve response class (CRC) algorithm developed at NCATS for dose response qHTS data.27,28 This analysis yields several curve response parameters, including a CRC score for the overall quality of the dose response (overall measure of potency and efficacy), an IC50 (potency), and percent activity at the maximum concentration tested (MAXR), as a measure of efficacy of the compound. The results from the CRC analysis for each compound in each cell culture mode screened are found in the “Lal et al. MIPE HTS Data” Excel file in the supplemental material.
Hierarchical clustering of the screening results using MAXR, a measure of compound efficacy ( Fig. 2A ), shows that the pharmacological responses of the compounds from the MIPE collection clustered together when growing as 2D monolayers, regardless of the plate coating; the MAXR obtained from the protocol using forming spheres on plastic or ECM clustered together, while pharmacological responses from cells forming spheres on omentum were much reduced and clustered separately from the rest of the assay conditions. Pharmacological responses for the omentum-only condition were different from the rest of assay conditions, and so were responses on preformed spheres, although these responses are more similar to those of forming spheres on plastic or ECM. The heat map also shows that a higher number of compounds were more efficacious at reducing percent viability in cells grown as monolayers, compared to cells forming spheres or cells in preformed spheres, which were the most resistant to the compounds’ cytotoxic effects.

Selection of compounds that are Hey-A8 cytotoxic in all growth conditions. (A) Heat map plot of maximum response parameter (MAXR) for all the compounds in the Mechanism Interrogation PlatE (MIPE) collection in each assay protocol tested. Data was clustered using the Hierarchical Clustering function in TIBCO Spotfire (TIBCO, Palo Alto, CA, USA). Red indicates a low percentage of cell viability, and blue represents a high percentage of cell viability. (B) Compounds with cytotoxic activity for Hey-A8 cells in all the assay conditions tested were selected using two criteria: both high-quality dose response curves (curve response class −1.1, −1.2, −2.1, and −2.2) and MAXR <30% in all assays with Hey-A8 cells. Pie charts of the targets of the compounds identified with the numbers of compounds that were active in each target class. (C) Heat map of MAXR for all the histone deacetylase (HDAC) inhibitors in the MIPE collection clustered using the Hierarchical Clustering in Spotfire. (D) Dose responses of selected representative HDAC inhibitors: () Hey GFP (green fluorescent protein) monolayers on plastic, ( ) Hey GFP monolayers on extracellular matrix (ECM), (▲) Hey GFP monolayers on omentum, (
 ) Hey GFP-forming spheres on plastic, (
 ) Hey GFP-forming spheres on ECM, () Hey GFP-forming spheres on omentum, (*) Hey GFP preformed spheres, and (
 ) omentum only.
We first looked for compounds that were cytotoxic to Hey-A8 GFP cancer cells under all assay conditions, using two methods: MAXR <30% (efficacy) and CRC −1.1, −1.2, −2.1, and −2.2 (a combination of both efficacy and potency). Twenty and 13 compounds, respectively, were identified as hits by each analysis method. Target analysis of these hit compounds revealed that histone deacetylase (HDAC) inhibitors are the major class of inhibitors of Hey-A8 proliferation ( Fig. 2B ), as determined by both MAXR and CRC. Interestingly, HDAC inhibitors exhibited no cytotoxicity in the omentum-only conditions, which would suggest a therapeutic window to treat the cancer cells while not affecting the normal omental microenvironment. In addition, the pan-HDAC inhibitors were more active than the inhibitors selective for HDAC6 and HDAC2 ( Fig. 2C ). Figure 2D shows exemplary dose responses for four HDAC inhibitors, illustrating how, in general, these compounds are fully efficacious. Romidepsin in particular is a very potent cytotoxic agent for these cancer cells.
Principal Component Analysis (PCA) of Pharmacological Responses across All Cell Growth Conditions
A PCA was used to explore how pharmacological responses of the MIPE library could separate the different assay modes. PCA analysis was performed using two curve response parameters, which as explained measure efficacy (MAXR), and potency (logAC50). Figure 3A shows how the PCA analysis using MAXR ( Fig. 3A , top panel) separates cell treatments into three separate groups: (1) cells growing as monolayers, (2) cells forming spheres, and (3) cells grown as preformed spheres or an omentum culture−only control. Using logAC50 ( Fig. 3A , bottom panel), there is also a separation between the responses between monolayers and forming spheres, although preformed spheres appear more similar to forming spheres. A target-based differential analysis of pharmacological response was used to identify targets, against which compounds showed differential efficacy or potency. This analysis identified CDK1 inhibitors as being more efficacious in the assay protocols for forming spheres and omentum-only control culture compared to the monolayer (p-value <1e-6); EGFR and MCL1 inhibitors were more efficacious in monolayers compared to the forming-spheres condition (p < 0.0005); and, finally, PSDM1 inhibitors were identified as more efficacious in forming spheres rather than omentum-only control culture (p < 0.0005) ( Fig. 3B , top panel). Likewise, inhibitors of HSP90, MTOR, and TUBB showed increased potency (comparing logAC50’s) in forming spheres compared to monolayer conditions (p < 0.002) ( Fig. 3B , bottom panel).

Principal component analysis (PCA) of pharmacological responses. (A) Dot plot of the PCA of the pharmacological response by maximum response parameter (MAXR; top panel) and logAC50 (bottom panel; only high-quality dose response curves with curve response classes in plot −1.1, −1.2, −2.1, and −2.2 were included in the analysis). Dots were colored as follows: () Hey-A8 growing as monolayers, ( ) Hey-A8 growing as forming spheres, (
 ) Hey-A8 as preformed spheres, and (
 ) omentum without Hey-A8 cells. (B) Box plot of the targets that were significantly (p-value <0.05) differentially active between two assay protocols by MAXR (top panel) and logAC50 (bottom panel).
Target Classes with Differential Pharmacological Responses between Cells Growing on Plastic versus Omentum
Although the PCA indicated that monolayer versus forming spheres was the main differentiating driver of pharmacological responses among the different growth conditions, we did pairwise comparisons of pharmacological responses in each microenvironment condition to identify any potential target classes with different pharmacological profile between growths on plastic versus ECM versus omentum. Figure 4A shows a volcano plot of the differences in the mean MAXR values (per target class) between cells grown as monolayers on plastic versus cells grown as monolayers on omentum culture. This analysis identified 11 targets that were more efficacious on Hey-A8 cells grown as monolayers on plastic than those grown on omentum culture (a difference mean target class MAXR of at least 30% and a p-value of <0.01 per target class). Box plots for the MAXR values of compounds modulating these targets between monolayers growing on plastic and omentum are shown in Figure 4B . Figure 4C shows a volcano plot of the differences in the target class mean MAXR values between cells grown to form spheroids on plastic versus those grown to form spheroids on omentum culture. When considering the same cutoffs of a target-based mean MAXR difference of at least 30% and a p-value of <0.01, 19 targets were shown to be more efficacious in cells forming spheres on plastic than on the omentum culture. In this case, PSDM1 and HDAC1 inhibitors appeared to be slightly more efficacious in omentum than plastic. Box plots for the MAXR values of compounds modulating these targets between monolayers growing on plastic and omentum are shown in Figure 4D . Of the targets identified to be differentially active between cells grown on plastic versus omentum culture, only androgen receptor (AR) and GSK3β modulators are common, although the differences for GSK3β are very marginal. Figure 4E shows dose responses for finasteride, an AR modulator, and vicriviroc, a CCR5 modulator, a class of compounds that were more efficacious for Hey-A8 cells forming spheres grown on plastic compared to Hey-A8 cells forming spheres grown on omentum culture. No targets were observed to be significantly enriched (p-value <0.01) and have a fold change of greater than threefold in AC50 (a difference in logAC50 of 0.5) when comparing Hey-A8 cells growing as monolayer or forming spheres on plastic versus omentum. A similar analysis was performed comparing Hey-A8 cells growing as monolayers or forming spheres, on plastic versus ECM. Only ATM and TERT were significantly enriched (p-value <0.01) and had a mean difference in MAXR of >30% for cells growing as monolayers (see “Lal et al. Omentum qHTS Target Differentiation Analysis” Excel file in the supplemental material).

Selection of differentially active compounds between cells growing on plastic versus omentum. (A) Volcano plot of targets that are differentially active by maximum concentration tested (MAXR) between cells growing as monolayers on plastic versus omentum. Highlighted targets are significantly enriched (p-value <0.01) and have a differential target-based mean MAXR of >30%. (B) Box plot of the mean MAXR for the compounds in the target classes highlighted in the volcano plot. (C) Volcano plot targets that are differentially active by MAXR between cells growing as forming spheres on plastic versus omentum. Highlighted targets are significantly enriched (p-value <0.01) and have a differential target-based mean MAXR of >30%. (D) Box plot of the mean MAXR for the compounds in the target classes highlighted in the volcano plot. (E) Dose responses finasteride, a represetative AR modulator, and Vicriciroc, a representative CCR5 modulator. () Hey GFP-forming spheres on plastic, ( ) Hey GFP monolayer on plastic, (
 ) Hey GFP-forming spheres on omentum, and (
 ) Hey GFP monolayer on omentum.
Target Classes with Differential Pharmacological Responses between Cells Growing as Monolayers versus Preformed Spheres
In addition to exploring the effect of cells growing on different surfaces, we also wanted to investigate how cell adhesion mode modulated pharmacological responses. A similar target-based pairwise comparative analysis between responses from different growth conditions was performed to identify targets with differential activity between cells growing as monolayers compared to cells treated when already in a preformed sphere. Figure 5A shows volcano plots of targets with differential activity between cells growing as monolayers on plastic (top panel) or on omentum culture (bottom panel) versus preformed spheres, using MAXR as activity measure. Sixteen and five targets were statistically enriched (p-value <0.01) and had better efficacy by a target-based mean MAXR difference of >30% for monolayers on plastic (top panel) and omentum (bottom panel), respectively, compared to preformed spheres. The five targets that had increased efficacy in the monolayer on omentum versus preformed spheres were also included in the list of targets enriched for the monolayer on plastic versus preformed spheres comparison; they were AKT1, EGFR, STAT3, CHEK1, and SRC. Figure 5B shows box plots for the targets identified as differentially active by efficacy using the same criteria as described above between cells grown in a monolayer on plastic (top panel) and in a monolayer on omentum culture (bottom panel) versus preformed spheres. Figure 5E shows dose responses for two exemplary SRC inhibitors, a class of compounds that were more efficacious in both Hey-A8 cells growing as monolayers on plastic and omentum compared to preformed spheres.
Selection of differentially active compounds between cells growing as monolayers and preformed spheres. (A) Volcano plot of targets that are differentially active by maximum concentration tested (MAXR) between cells grown as monolayers on plastic versus preformed spheres (top panel) and monolayers growing on omentum versus preformed spheres (bottom panel). Highlighted targets are significantly enriched (p-value <0.01) and have a differential target-based mean MAXR of >30%. (B) Box plot of the mean MAXR for the compounds in the target classes highlighted in the volcano plot for cells growing as monolayers on plastic versus preformed spheres (top panel) and monolayers growing on omentum versus preformed spheres (bottom panel). (C) Dose responses for two selected SRC inhibitors, saracatinib and PD-173955: (•) Hey GFP monolayer on omentum, () Hey GFP monolayer on plastic, and ( ) Hey GFP preformed spheres.
Discussion
Increasing evidence shows that the tumor microenvironment affects the efficacy of drugs on cancer cells.1–4 Therefore, screening assays that capture these interactions are needed to better predict the activity of drugs in vivo. Our study focused on a model of ovarian cancer metastasis to the omentum. 22 We used a previously reported 3D model of the omentum to investigate the pharmacological responses of a collection of 1912 oncology-focused compounds on the cell proliferation of ovarian cancer tumor cells growing on supports mimicking the omentum metastatic site. The screening results were analyzed to identify which targets are differentially active when cells grow in different supports mimicking different aspects of the tumor microenvironment on the omentum metastatic site. In addition, the pharmacological responses of cells growing as monolayers and cells growing in conditions in which they were forming spheres were compared, as a model that possibly better recapitulates the growth of cells toward formation of tumors in a metastatic site.
The drug class of HDAC inhibitors was very cytotoxic to Hey-A8 cells in all growth conditions tested, whereas these inhibitors had no effect on the cells in the omentum conditions. Previous observations by others in ovarian cancer and other solid-tumor types indicate that selective targeting of HDAC3, which is a Class I HDAC, potentially could be an attractive therapeutic strategy. 23 It has been shown that inhibiting Class I HDACs reduces cellular growth and survival and de-represses p21 transcription.24–26 Class I HDAC inhibition does not induce similar antitumor effects in normal ovarian epithelial cell lines, which affords this treatment strategy a potential therapeutic window. 23 Collectively, these findings suggest that HDAC inhibitors could effectively target the cancer cells while having little to no effect on the peritoneal microenvironment. Indeed, certain HDAC Class I inhibitors in combination with approved chemotherapeutic agents have been proven efficacious in recent clinical trials treating primary peritoneal metastasis. 27 However, a limited clinical benefit of HDAC inhibition in HGSOC has been reported. 27 These findings could be explained by a variety of factors, including (1) the selectivity and type of inhibition, (2) phenotypic and molecular features of the tumors, and (3) the type of combination treatment tested. There is substantial evidence in preclinical models that show that class I biased HDAC inhibitors decrease cell proliferation and increase apoptosis, likely through enhanced DNA damage and decreased DNA repair, especially in ovarian cancer cells that are molecularly vulnerable.24,28–30 Potential therapeutic approaches include but are not limited to combination therapies of class I HDAC inhibitors with other epigenetic drugs such as DNA methyl transferase inhibitors, DNA damaging agents and small-molecule inhibitors of oncogenic pathways such as the PIK3CA/AKT and NFκB signaling pathways.
When comparing the pharmacological responses in the different assay conditions, adhesion mode, that is, whether the cells are growing as monolayers or forming spheroids or preformed spheres, was the factor that better grouped the drug responses, not whether the cells were growing on plastic, ECM, or omentum. That adhesion mode modulates drug responses is not surprising because it has been reported that disruption of adhesion proteins that regulate cell–cell interactions and the epithelial-to-mesenchymal transition (EMT) sensitized tumor spheroids to certain drugs like 5-fluorouracil, paclitaxel, vinblastine, and etoposide, but not cisplatin, in ovarian cancer cells. 6 The effect of the ECM on the pharmacological responses appears to be negligible for cells either growing on monolayers or forming spheres, and even inhibitors of targets that modulate ECM remodeling like metalloproteases (MMPs) are not active or show differential activity in our assay conditions. The omental microenvironment appears to reduce the efficacy, but not potency, of several target classes, but this is conditional on whether the cells are growing as monolayers or forming spheres. In particular, AR modulators appear to be less effective in the presence of the omental microenvironment. This is interesting because AR is frequently expressed in ovarian cancer cells. Although not extensive, there is evidence from in vitro studies suggesting that androgens affect gene expression, growth, invasion, and survival in ovarian cancer cell lines. Shi et al. showed that androgens promote the survival of ovarian cancer cells through increased expression, activity, and phosphorylation of telomerase. 31 Activation of the androgen receptor has also been shown to stimulate ovarian cancer cell invasion and an androgen-mediated degradation of the cell cycle inhibitor, p27. 32 Taken together, these results suggest a role for AR antagonists in the treatment of ovarian cancer. The fact that Hey-A8 cells are more sensitive to AR modulators on plastic than on the omental microenvironment suggests that the omentum might downregulate AR in tumor cells and might help explain why therapeutic approaches that inhibit androgen signaling have so far produced only modest response rates in clinic. 33 Furthermore, it has been reported by Scully et al. 34 that ovarian metastases from gastrointestinal tract carcinomas had stroma that were found neither in the primary gastrointestinal tumor nor in the extra ovarian metastasis and contained luteinized, steroidogenic ovarian stromal cells. This suggests a highly androgenic ovarian primary tumor microenvironment that might explain the sensitivity of Hey-A8 cells to AR modulators as compared to the cells in the omentum niche. CC chemokine receptor 5 (CCR5) antagonists also showed reduced cytotoxicity activity against Hey-A8 cells forming spheres grown on plastic compared to forming spheres grown on the omental culture. CCR5 and its ligand CC chemokine ligand 5 (CCL5/RANTES) also have been shown to be important for proliferation and invasion of ovarian cancer. It has been reported previously that elevated MMP9 expression was seen as a consequence of the interaction of CCL5 and its receptors CCR1, CCR3, and CCR5 via the NFκB signaling pathway in ovarian cancer stem-like cells. 35 Ovarian cancer cells grown in spheres have an increased concentration of stem-like cells; 36 therefore, it is conceivable that forming spheres on plastic have a higher expression of stem-like markers than they do once they attach to the omentum and differentiate.
Our pharmacological profiling of ovarian cancer cells grown in the presence of various elements of the tumor metastatic microenvironment has identified therapeutic targets that are not influenced by the primary tumor microenvironment. Furthermore, other target classes of drugs have reduced responses in the presence of the omental metastatic niche, which could possibly explain the lack of responses in vivo. Further work will be needed to determine whether similar effects are seen with other HGSOC cells, and determine the cellular mechanisms by which the differential responses are produced. However, the assays developed here are implemented in a HTS format and should be easily integrated as part of a drug development platform to investigate possible mechanisms of drug resistance and to develop drugs modulating a particular target.
Footnotes
Acknowledgements
We would like to thank Carleen Klumpp-Thomas for help with the robotics implementation of the screens.
Supplementary material is available online with this article.
Declaration of Conflicting Interests
The authors declared no potential conflicts of interest with respect to the research, authorship, and/or publication of this article.
Funding
The authors disclosed receipt of the following financial support for the research, authorship, and/or publication of this article: This work was funded by the National Institutes of Health (NIH) Intramural Research Program to NCATS, and by Bears Care, the charitable beneficiary of the Chicago Bears Football Club, to EL; and by the University of Chicago Women’s Board to HAK.
References
Supplementary Material
Please find the following supplemental material available below.
For Open Access articles published under a Creative Commons License, all supplemental material carries the same license as the article it is associated with.
For non-Open Access articles published, all supplemental material carries a non-exclusive license, and permission requests for re-use of supplemental material or any part of supplemental material shall be sent directly to the copyright owner as specified in the copyright notice associated with the article.