
Abstract
Dysregulated transcription, translation, and protein degradation are common features of cancer cells, regardless of specific genetic profiles. Several clinical anticancer agents take advantage of this characteristic vulnerability and interfere with the processes of transcription and translation or inhibit protein degradation. However, traditional assays that follow the process of protein production and removal require multistep processing and are not easily amenable to high-throughput screening. The use of recombinant fluorescent proteins provides a convenient solution to this problem, and moreover, photoconvertable fluorescent proteins allow for ratiometric detection of both new protein production and removal of existing proteins. Here, the photoconvertable protein Dendra2 is used in the development of in-cell assays of protein production and degradation that are optimized and validated for high-throughput screening. Conversion from the green to red emissive form can be achieved using a high-intensity light-emitting diode array, producing a stable pool of the red fluorescent form of Dendra2. This allows for rates of protein production or removal to be quantified in a plate reader or by fluorescence microscopy, providing a means to measure the potencies of inhibitors that affect these key processes.
Keywords
Introduction
The ability to follow the protein life cycle in living cells from translation through degradation is commonly achieved through the use of several different multistep methods.1–3 Most of these require samples to be manipulated at each time point to be studied, either through cell lysis or fixation for microscopy. In this context, the protein life cycle is analyzed through bulk effects or, alternatively, by stitching together data from different groups of cells probed at each time point. More convenient and informative approaches are needed to follow these key cellular processes on both the individual cell and population levels.
Fluorescent proteins such as green fluorescent protein (GFP) have been shown to be useful tools to monitor proteins in living cells, where individual cells or the same group of cells can be measured over the complete time frame of the experiment. The drawback to using fluorescent proteins, however, is that they are continuously being synthesized and degraded, so quantitatively probing these specific processes individually is not possible. One alternative is to use a ratiometric approach so that changes in protein level can be assessed. This is possible using proteins that can be triggered by external stimuli to change their properties. 4 Such systems would allow for a single genetically encoded protein to provide both an internal control and a real-time report of protein levels.
A number of light-activated fluorescent proteins, characterized by changes in spectral properties induced by exposure to high-energy light, have been developed for cell-based imaging applications. These include proteins such as photoactivatable GFP 5 and mCherry, 6 as well as photoconvertible proteins such as Kaede, 7 EosFP,8,9 and Dendra2. 10 These switchable spectroscopic features, combined with molecular biology techniques, allow fusions of fluorescent proteins to be used for spatial tracking of individual proteins or to study interactions between biomolecules and degradation of proteins and for super resolution microscopy.11–13
Dendra2 exhibits GFP-like fluorescence, with excitation at 488 nm and green emission centered at 507 nm when synthesized and folded. This protein, however, undergoes irreversible conversion to a red emissive species upon exposure to 405 nm light.14,15 The mechanism of photoconversion is due to covalent changes in the protein backbone, which result in a chromophore containing an imidazolinone conjugated to an imidazole ring.16,17 The new chromophore exhibits an emission centered at 573 nm. Both forms of the protein are monomeric, nontoxic, and not prone to aggregation. The maturation time (the t1/2, or half-life for the immature state) is only 38 min. 11 The green emitting species is continually synthesized by the cell, whereas the red emitting population is generated only upon light exposure. Thus, the green emission increases over time, and the red emission remains constant or decreases as a result of degradation. This allows Dendra2 to serve as a ratiometric detector of protein production or degradation by comparing the emission in the green and red region of the spectrum.
Several medically important drugs have been developed where their mechanism of action involves the disruption of either protein production or degradation. For example, the platin family of compounds, which are used to treat several types of solid tumor cancers, are thought to interfere with nucleic acid function through covalent adduct formation with nucleic acids. 18 This has been shown to involve both DNA and RNA, 19 with associated impacts on the DNA damage response and transcription and translation. The proteasome inhibitor, Velcade (bortezomib), blocks protein degradation through inhibition of the 20S proteasome and has shown remarkable efficacy in the treatment of multiple myeloma and mantle cell lymphoma. Many compounds that target the ribosome are essential antibiotics, and inhibition of translation is an increasingly active area in cancer research. 20 Accordingly, early identification of compounds that modulate different aspects of the protein life cycle is important in medicinal chemistry efforts. Depending on the type of target protein to be modulated by small-molecule compounds, this assay could be used to rapidly identify lead scaffolds from a compound library or to determine possible off-target toxicities.
The field of bioinorganic medicinal chemistry has developed many cytotoxic agents with potential as chemotherapeutics. One challenge, however, is that the mechanism of action for inorganic agents can be particularly hard to identify. Many compounds have been shown to interact with DNA in several in vitro assays,21,22 but it remains to be determined if the behavior is the same in live cells. Alternatively, many compounds work through as-yet unknown mechanisms. As the field progresses toward developing metallodrugs, a rapid assay to follow protein production and/or degradation in cells would assist in structure activity relationship (SAR) efforts.
Here we have developed a high-throughput plate reader assay that uses an affordable commercial light-emitting diode (LED) flood array to rapidly photoconvert Dendra2 in 96- and 384-well plates. We demonstrate the utility of this method to follow either protein production or protein degradation using Dendra2 or a fusion of Dendra2 with nuclear factor of kappa light polypeptide gene enhancer in B-cells inhibitor, alpha (IκBα), respectively, and validated the assays using several small molecules known to affect these processes.
Materials and Methods
Equipment
A Loctite Flood Array emitting 405 nm light with 144 individually reflectorized LEDs (item No. 1167593; regulated with an LED Flood System Controller, item No. 1359255) was used to provide uniform illumination for photoconversion of Dendra2 over large surfaces, as in multiwall plates. A SpectraFluor Plus plate reader (Tecan, Männedorf, Switzerland) was used for the data collection of cells expressing soluble Dendra2, whereas an Omega Bio-Tek plate reader was used for the IκBα fusion protein studies.
Cell Lines
HEK-T-REx cells were maintained in Dulbecco’s modified eagle medium (DMEM) media supplemented with 10% fetal bovine serum, 50 U/mL penicillin, 50 µg/mL streptomycin, and 7.5 µg/mL of blasticidin. A Matrigel solution was used to coat the surface of all dishes used in this study. To prepare the Matrigel solution, 5 mL of Matrigel was thawed on ice and then added to 500 mL of DMEM media. Dishes were incubated with the Matrigel at 37 °C for a minimum of 10 min, the media were removed, and then cells were added.
Tet-Responsive Dendra2 and IκBα-Dendra2 Cell Lines
Dendra2 was amplified by PCR with primers containing KpnI and NotI restriction sites and ligated into the pcDNA4/TO vector. The ligation mix was transformed into DH5α chemically competent cells and selected on Luria broth (LB) agar plates containing 100 µg/mL carbenicillin. Colonies were grown in LB with 100 µg/mL ampicillin, followed by plasmid isolation. The presence of Dendra2 was verified by restriction analysis followed by sequencing. For the creation of the IκBα-Dendra2 fusion construct, IκBα (provided by Dr. Tom Huxford, San Diego State University) was used after sequence verification and gene amplification by PCR with primers containing the HindIII and KpnI restriction sites. The pcDNA-4TO Dendra2 vector was digested with HindIII and KpnI and ligated in the presence of IκBα, placing IκBα at the 5′ end of Dendra2. After transformation into DH5α cells, plasmid isolation and sequence analysis was used to confirm the presence of pcDNA4-TO-IκBα-Dendra2.
Cell lines were generated using lipofectamine transfection followed by antibiotic selection. HEK-TREX cells were plated at 250,000 cells per well on a Matrigel-coated six-well dish and allowed to adhere overnight. For transfection, 1 µg of plasmid and 2 µl of lipofectamine 2000 was added to the cell in opti-MEM and allowed to incubate with the cells for 8 h. The media were aspirated and growth media added, followed by antibiotic selection with 500 mg/ml of zeocin and 7.5 mg/ml of blasticidin. For the Dendra2 cell line, a stable pool of cells was used. For IκBα-Dendra2, the stable pool was sorted by flow cytometry into separate pools based on the intensity of the Dendra2 emission after 18 h in the presence of 1 µg/mL tetracycline.
Microscopy Studies
Stable cell lines under the control of the Tet repressor protein were plated in eight-well Matrigel-coated glass-bottom dishes at 30,000 cells per well and allowed to adhere overnight in the presence of 1 µg/mL tetracycline. The cells were then placed in L-15 media. Photoconversion and imaging were performed on an Olympus IX81 equipped with 405, 488, and 561 nm lasers. The intensity of the 405 nm light was 1.5 W/cm2.
Exposure of the cells to 30 s of 405 nm light resulted in photoconversion of 50% of the Dendra2 in the cells, as determined by the relative changes in intensity of both the green and red emission. Once the cells were photoconverted, at least three regions for each well were collected during each experiment. Samples were excited with both 488 nm and 561 nm excitation (100 mW/cm2), and images were collected every 30 min. The plating density was sufficient to result in thousands of cells being imaged for each region. For all images, background was subtracted using a sliding paraboloid algorithm in ImageJ. The mean fluorescence intensity was then extracted for each region for all time points in the series. For each data set, the emission intensity was normalized to the first time point. The mean of multiple regions was then plotted with error bars determined from the standard deviation.
High-Throughput Screening in 96- and 384-Well Plates with a 405 nm Flood Array
The wells of 96- or 384-well plates were coated with Matrigel for 30 min at 37 °C. The wells were aspirated, and cells were added in DMEM growth media containing 1 µg/mL tetracycline (30,000 cells/well for 96- and 12,000 cells/well for 384-well plates). After 18 h, the media were removed from the plates, and L-15 media containing 1 µg/mL tetracycline were added to each well and the plates returned to the incubator.
Compounds were serially diluted in L-15 media with 1 µg/mL tetracycline and transferred to the cells. To photoconvert Dendra2, a 405 nm LED flood array was set up with the lamp set at a distance of 15 cm from the plate. The output from the array was measured at 400 mW of power (509 mW/cm2), 2.5× the output from the 405 nm laser on the microscope.
After a 1 h incubation with compound, the plates were exposed to the 405 nm light source for 1 min and then placed in a SpectraFluor Plus plate reader thermostated at 37 °C. The plates were read in kinetic mode, with readings taken every 30 min for a period of 15 h. For each time point, two readings were taken. The first scan was performed with 485 nm excitation and 530 nm emission, whereas the second scan was with a 535 nm excitation and 595 emission. Band pass filters were used with cutoffs of ±20 nm, except for the 595 nm emission filter, which had a cutoff of ±25 nm.
Results
Production of Newly Synthesized Dendra2 Measured in Real Time
The utilization of the tetracycline on-off system allowed for the controlled expression of proteins in mammalian cells but does not discriminate between transcription and translation. Because of the time requirements for transcription and then translation to produce sufficient quantities of protein for fluorescent detection, protein production is generally not observed at time periods of less than 8 h. To reduce this lag time, tetracycline was used to induce protein expression for 18 h, followed by subsequent photoconversion of Dendra2. This ensured that a sufficiently large pool of protein was available for immediate fluorescent detection and also allowed for sensitive detection of rapid modulators of protein production, which could be added immediately prior to or following photoconversion.
The HEK293 cell line was created using the Tet-on plasmid, where Dendra2 expression remained silent until the addition of 1 µg/mL of tetracycline-induced transcription. For microscopy, glass-bottom dishes were coated with Matrigel solution to adhere the cells to the bottom of the dish. The cells were then added in media containing tetracycline and allowed to adhere for 18 h. After that time, the cells were exposed to a 405 nm laser for 30 s with a 4× objective to induce conversion of a population of the pool of Dendra2 from the green to the red emissive form (
Fig. 1A
). This objective was chosen as it allowed for the photoconversion of a larger population of cells in each field of view for improved statistical analysis. The population of newly synthesized Dendra2 (green emission) was observed over 8 h, with images taken every 30 min. To verify that the increased emission was due to newly synthesized protein, experiments were performed with the translation inhibitor, cycloheximide (CHX). Addition of CHX suppressed the production of new, green-emissive Dendra2 by 91% (
Fig. 1B
,
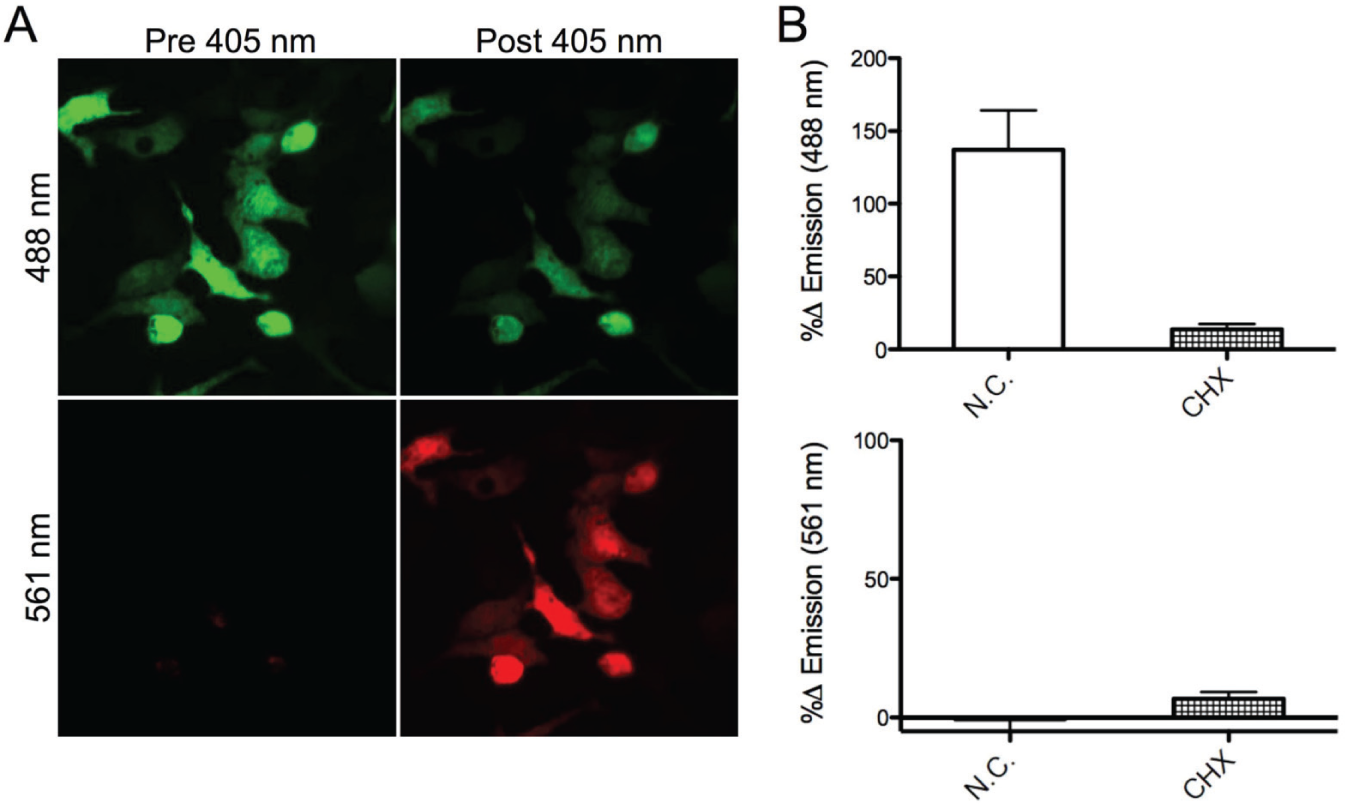
Image of Dendra2 expression in HEK cells. (
LED Photoconversion Coupled to a Fluorescence Plate Reader for HTS
Although Dendra2 production and degradation could be followed using a microscope with a programmable stage, the time needed to activate each well within a 96- or 384-microwell plate with 405 nm light and to program the coordinates for each well was deemed to be prohibitive for screening compound libraries. For example, illumination of each well of a 96-well plate would take a minimum of 60 min, and measurements would require a computer capable of storing large image files, in addition to software for data analysis. Thus, to expand this assay to a fluorescence-based 96-well plate reader format, photoconversion using a 405 nm LED flood array was investigated. It was found that illumination with this system was sufficient to convert 50% of Dendra2 from green to red emission within 60 s. This allowed for screening of multiple plates as an endpoint assay or even in kinetic mode, based on the plate reader configuration.
Figure 2
shows the time course for the photoconversion of Dendra2-expressing HEK cells in a 96-well plate. Photoconversion was observed within as little as 10 s, with 15% ± 4% of the maximum signal change. The maximum photoconversion was reached within 120 s and corresponds to a decrease in signal in the green of 69% ± 1.5%. Further exposure to the 405 nm light source did not convert the remaining fraction of Dendra2. The change in fluorescence for Dendra2 pre- and postexposure to 405 nm light is shown in
Figure 3
; as anticipated, the green emission was reduced and the red emission was increased upon photoconversion. The change in signal was similar across the plate, but some variance in signal intensity was observed at the columns toward the left and right edges of the plate, which correlated with variations in the cell number plated for each column (see
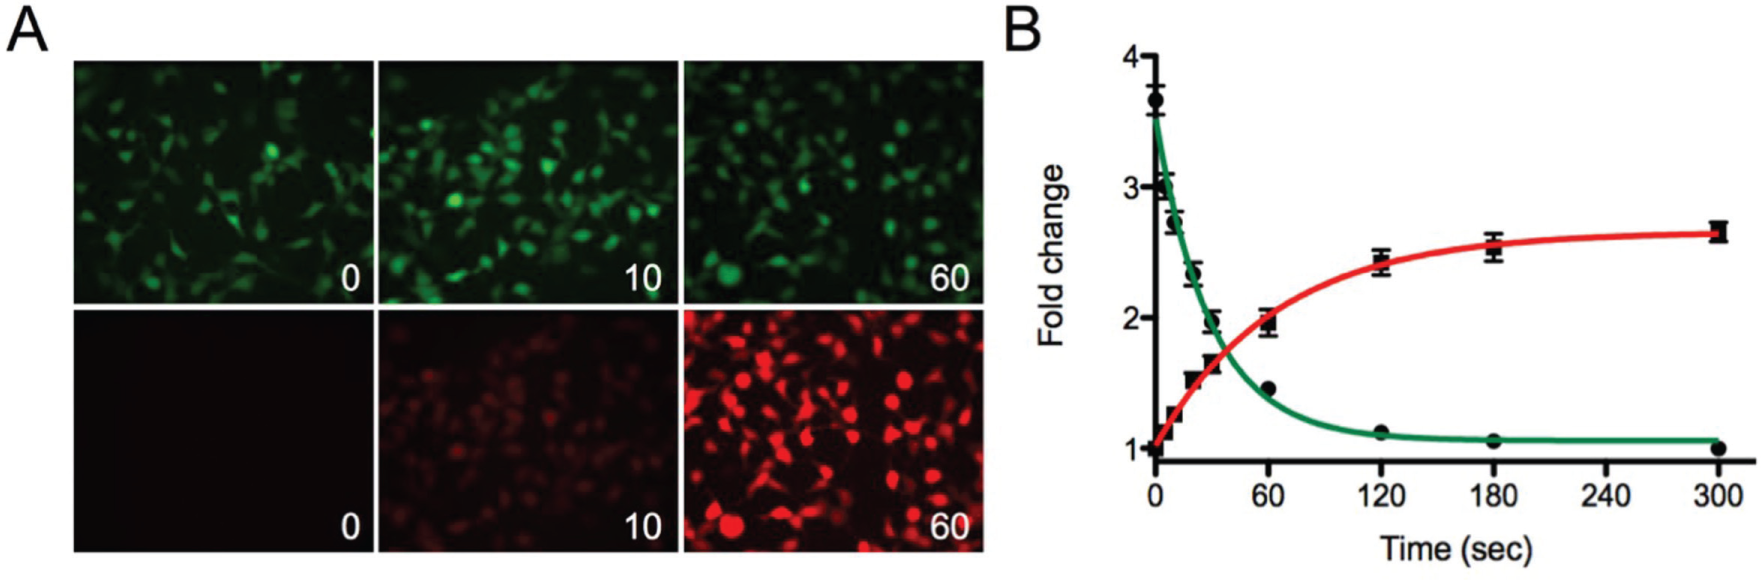
Photoconversion of Dendra2 in 96-well plates with a light-emitting diode flood array. (
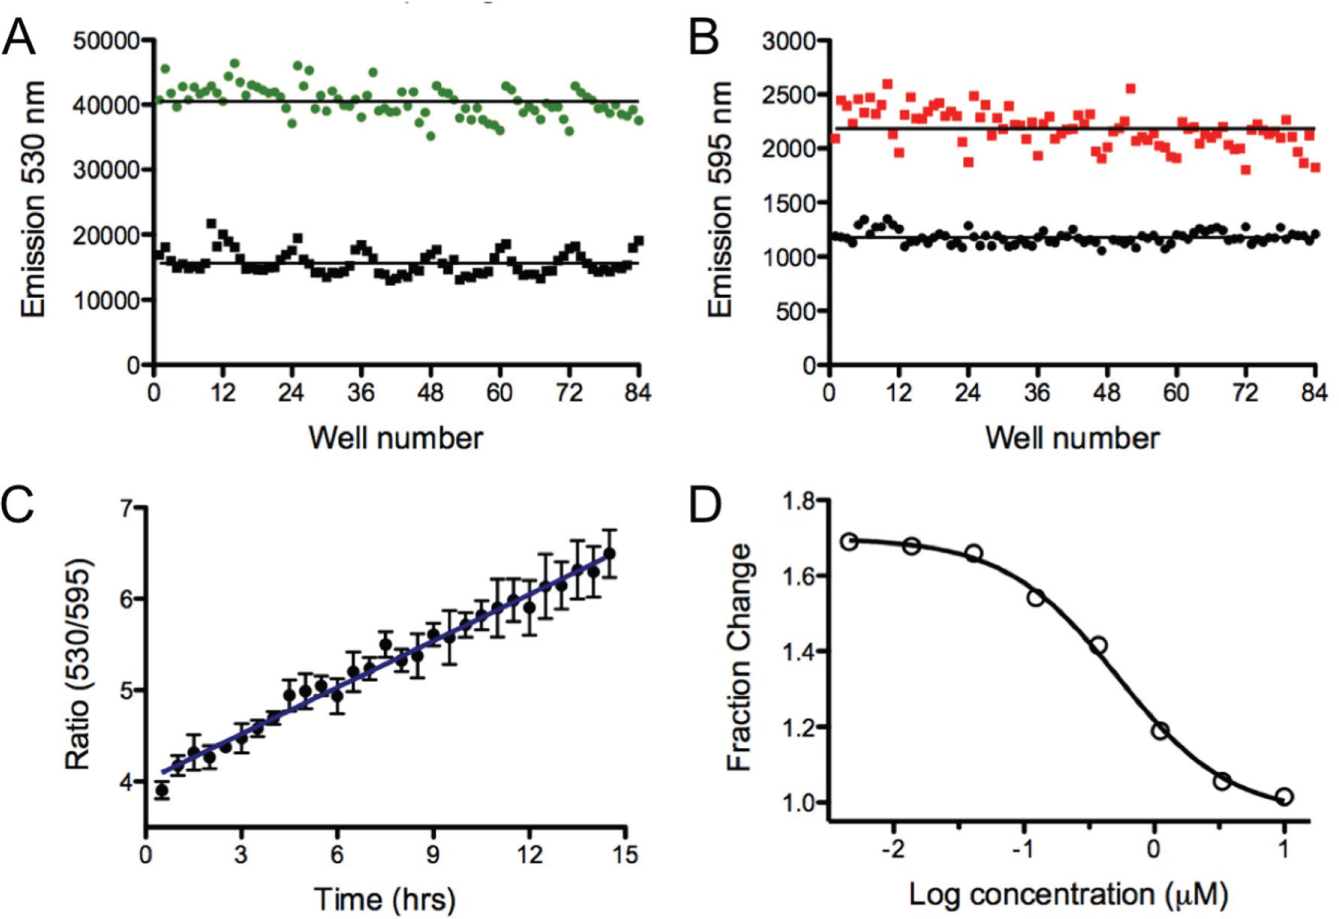
Well-to-well variability before and after Dendra2 photoconversion in a 96-well plate. (
To follow protein production in kinetic mode, Dendra2-expressing cells were photoconverted for 1 min followed by dual reading of the green and red emission every 30 min over a period of 15 h. As shown in
To validate Dendra2 as an assay for quantifying protein translation, CHX was added to the cells, and the production of newly synthesized Dendra2 was measured over time in dose response (
Fig. 3D
). After a 1 h incubation with the cells, Dendra2 was photoconverted. The data were collected both by microscopy and with a plate reader to compare both methods. As shown in
Figure 4A
Comparison of detection methods. (
IκBα-Dendra2 Fusion to Measure the Effect of Compounds on Protein Degradation
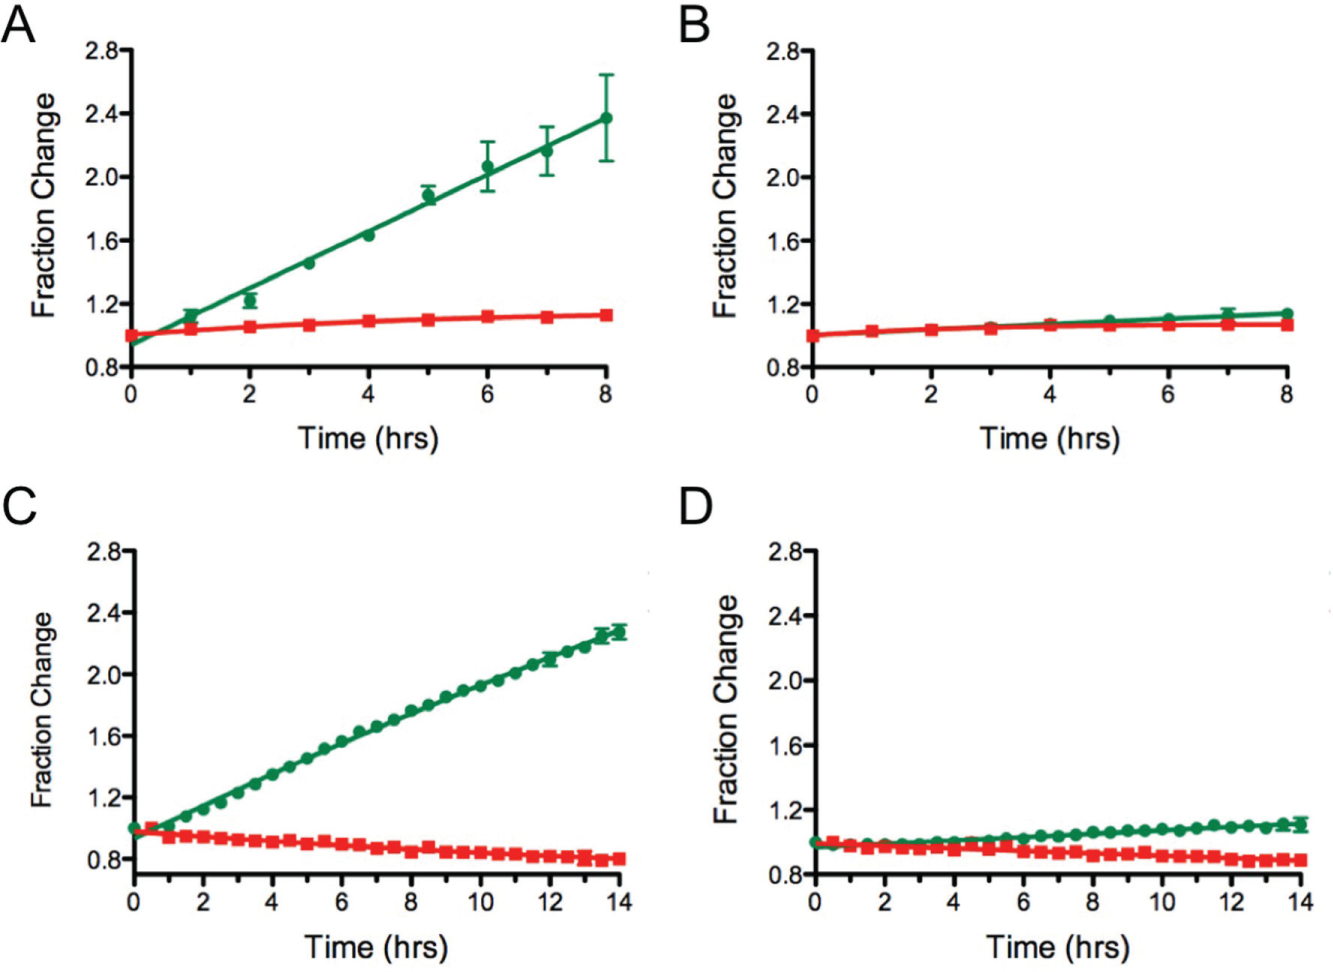
IκBα is an inhibitor of the transcription factor NF-κB. In cells, it is continuously expressed but also continuously degraded. 23 It has previously been shown that the addition of Dendra2 as a fusion to IκBα produces a fluorescent form of IκBα that recapitulates the degradation rate seen for IκBα alone. 24 Because the half-life for this protein is on the order of minutes, we explored the application of this fusion protein to follow the effect of compounds that inhibit protein degradation. The proteasome inhibitors, MG132 and Velcade, were dosed for 1 h prior to photoconversion, and the emission followed at 530 and 595 nm.
As shown in Figure 5A , the amount of new protein that can be observed reaches a plateau after 3 h in the absence of any compound. This was not surprising, as the short half-life of IκBα would result in the competitive degradation of both the newly translated, green, protein and posttranslated, photoconverted, red protein. As expected, the red emissive form of the protein continually decreased.
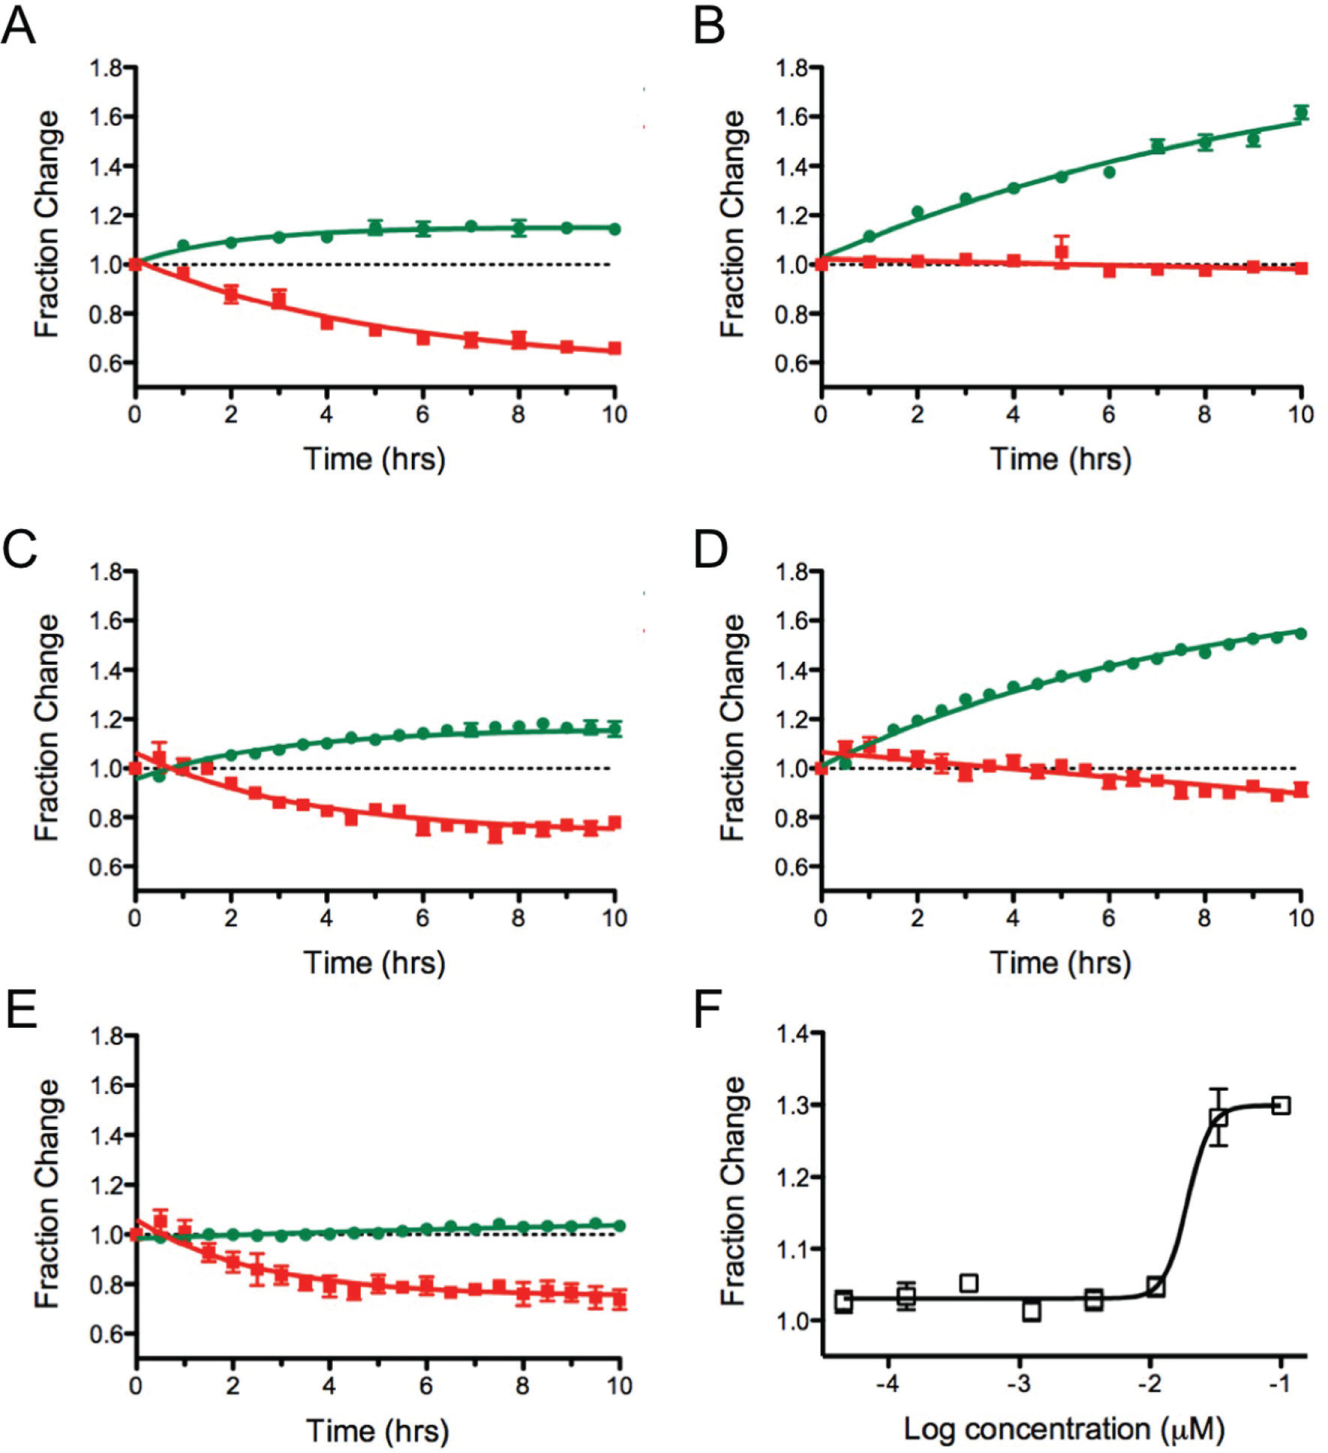
Comparison of results for IκBα-Dendra2 by live cell imaging versus a multiwell plate reader. (
In the presence of increasing concentrations of proteasome inhibitors, a block in the degradation of the red IκBα-Dendra2 was seen ( Fig. 5B ). There was an associated steady increase in the newly synthesized IκBα-Dendra2. Full inhibition of protein degradation was readily observed by microscopy. Similar results were observed in a 96-well plate format, where the emission signals for each well were measured over time ( Fig. 5C ). Data collection with the plate reader following the addition of the proteaseome inhibitor, Velcade, showed a slight decrease in the red IκBα-Dendra2 during the time course of the experiment ( Fig. 5D ). Both detection approaches showed the same fractional change in the newly translated IκBα-Dendra2 protein in the presence and absence of 0.1 µM Velcade. Translation inhibitors could also be studied in this assay, where only the green form of the IκBα-Dendra2 was affected ( Fig. 5E ).
To further extend the utility of this assay, the kinetic data were collected in dose response to determine if dose-response curves could be generated. Both CHX and Velcade were tested. As shown in
Extension of the Assays to High-Throughput Screening in 384-Well Plates
To validate the assay in a high-density format, 384-well low-volume plates were seeded with the HEK-Dendra2 cells followed by the addition of tetracycline for 18 h. A maximal signal change between wells containing tetracycline and those without was found when 12,000 cells per well were used. Photoconversion resulted in an average decrease in green emission of 1.66-fold, with an increase in red emission of 3.06-fold ( Fig. 6A ). Addition of CHX to the cells resulted in a dose-dependent decrease in the production of Dendra2; analysis of the signal change after 10 h incubation resulted in an IC50 value of 0.24 ± 0.06 µM. This value is twofold more potent than determined in 96 wells ( Fig. 6B , C ). Similar results for Velcade were seen with the IκBα-Dendra2 cell line, where an IC50 of 0.033 ± 0.001 µM was determined, compared with 0.02 µM when assayed in 96-well plates ( Fig. 6D , E ). Although the data are in good agreement, care must be taken when comparing values from 96- versus 384-well plates.
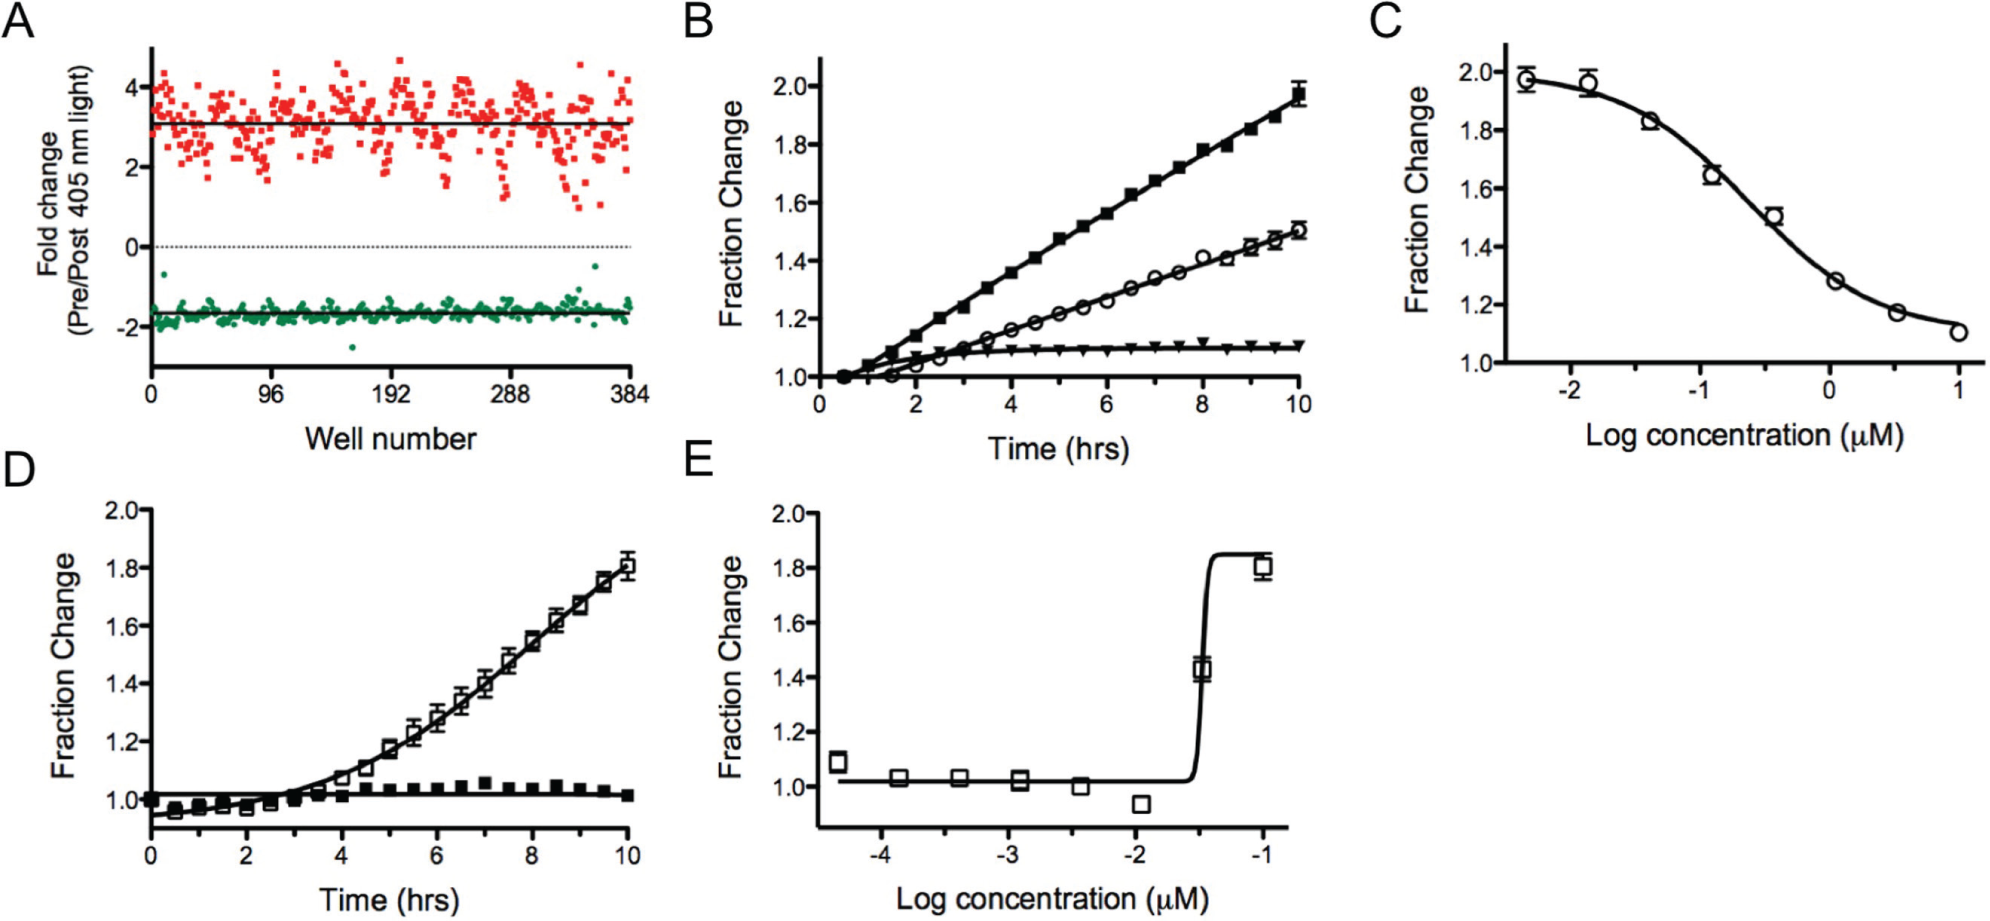
Translation and proteasome inhibition assays in 384-well format. (
Discussion
Since the discovery of photoconvertable proteins, only limited studies have sought to employ them for HTS. Rather, the development of methods using Dendra2 has focused on detection of the protein by microscopy. Expanding the utility of Dendra2 to other assay formats has been challenging because of the requirement of a 405 nm laser to induce the photoreaction of the chromophore. Although photoconversion has been shown to occur at wavelengths up to 450 nm, the length of time required to photoconvert is prohibitively long. This has limited the application of Dendra2 and other photosensitive proteins for HTS.
The use of a high-intensity LED array allows for the rapid illumination of an entire plate of any format required for screening. We used this to convert cells in a single well and up to 384-well formats. Live cells expressing the protein are then amenable to any microscopy study or protein quantification using standard plate readers. The rapid quantification of fluorescence intensity in plate readers allows for HTS of compounds that inhibit protein production or protein degradation, with data that can be generated as kinetic time courses or as an endpoint assay. This provides complementary data on large populations of cells that can be compared with the high-resolution information obtained on single cells or small collections of cells via microscopy.
One issue that is concerning with using Dendra2 to follow protein degradation is the inefficiency of multiwell plate readers to detect red emission. In the microscope, the signal intensities for the green and red emissions were equivalent. The plate reader did exhibit the same fold change, with about a 10-fold decrease in signal intensity for the red form of Dendra2. The difference in sensitivity for the plate reader for the green and red detection is evident in the Z′ values for the two different detection wavelengths. The Z′ value reflects the number of standard deviations an individual reading is from the mean reading. The Z′ is 0.51 for detection of green emission and 0.33 for the red emission; thus, the assay is in the excellent range in the green channel and marginal in the red in the plate reader, and both values are better when using the microscope. Optimized filter sets or plate readers with greater sensitivity in the red of the spectrum would allow for improved sensitivity for the red form of the Dendra2.
Although the twofold change in signal may appear limiting, the assay is actually quite robust, as a change in Dendra2 of greater than 10% can be reliably detected. The data can be used to discriminate this signal change using a three standard deviation analysis from the no-compound control.
25
Thus, changes in protein level of more than 10% can be detected with confidence, as shown in
These in-cell assays for global protein production and destruction provide important tools for the discovery of agents that target these processes. The assays also allow for detection of undesired off-target effects for compounds not anticipated to interfere with proteostasis. Furthermore, in vitro systems are available for detecting inhibition of transcription and translation (using the minimum required biological components)2,22 or direct inhibition of the proteasome, but the cellular environment is an intrinsically more complex environment, and multiple biological factors play a role in proteostasis. The combination of these new in-cell assays with existing in vitro assays may allow for validation or exclusion of specific targets in the complex machinery regulating protein levels.
Footnotes
Acknowledgements
The authors are grateful to Dr. Tom Huxford (San Diego State University) for the gift of the plasmid containing the gene for IκBα.
Supplementary material is available online with this article.
Declaration of Conflicting Interests
The authors declared no potential conflicts of interest with respect to the research, authorship, and/or publication of this article.
Funding
The authors disclosed receipt of the following financial support for the research, authorship, and/or publication of this article: This work was supported by the National Institutes of Health (1R01GM107586). A.F. was supported by am NIDA T32 Research Fellowship (NIH DA016176).
References
Supplementary Material
Please find the following supplemental material available below.
For Open Access articles published under a Creative Commons License, all supplemental material carries the same license as the article it is associated with.
For non-Open Access articles published, all supplemental material carries a non-exclusive license, and permission requests for re-use of supplemental material or any part of supplemental material shall be sent directly to the copyright owner as specified in the copyright notice associated with the article.