
Abstract
Heterogeneity is a fundamental property of biological systems at all scales that must be addressed in a wide range of biomedical applications, including basic biomedical research, drug discovery, diagnostics, and the implementation of precision medicine. There are a number of published approaches to characterizing heterogeneity in cells in vitro and in tissue sections. However, there are no generally accepted approaches for the detection and quantitation of heterogeneity that can be applied in a relatively high-throughput workflow. This review and perspective emphasizes the experimental methods that capture multiplexed cell-level data, as well as the need for standard metrics of the spatial, temporal, and population components of heterogeneity. A recommendation is made for the adoption of a set of three heterogeneity indices that can be implemented in any high-throughput workflow to optimize the decision-making process. In addition, a pairwise mutual information method is suggested as an approach to characterizing the spatial features of heterogeneity, especially in tissue-based imaging. Furthermore, metrics for temporal heterogeneity are in the early stages of development. Example studies indicate that the analysis of functional phenotypic heterogeneity can be exploited to guide decisions in the interpretation of biomedical experiments, drug discovery, diagnostics, and the design of optimal therapeutic strategies for individual patients.
Introduction: Biological Heterogeneity Is a Fundamental Property of Life
Heterogeneity is a fundamental property of biological systems that contributes to development, 1 differentiation,2,3 immune-mediated responses, 1 and many other cellular, tissue, organ, and organism functions 1 as well as diseases and disease progression.4–6 Figure 1 illustrates the different scales or levels of biological systems exhibiting heterogeneity that can be measured with the appropriate methods. This perspective will focus primarily on heterogeneity in populations of cells in vitro and in tissue sections, but much of the discussion, especially with reference to the need for standard metrics and their application to biomedical research, drug discovery, and diagnostics, can also be applied to populations at all scales.
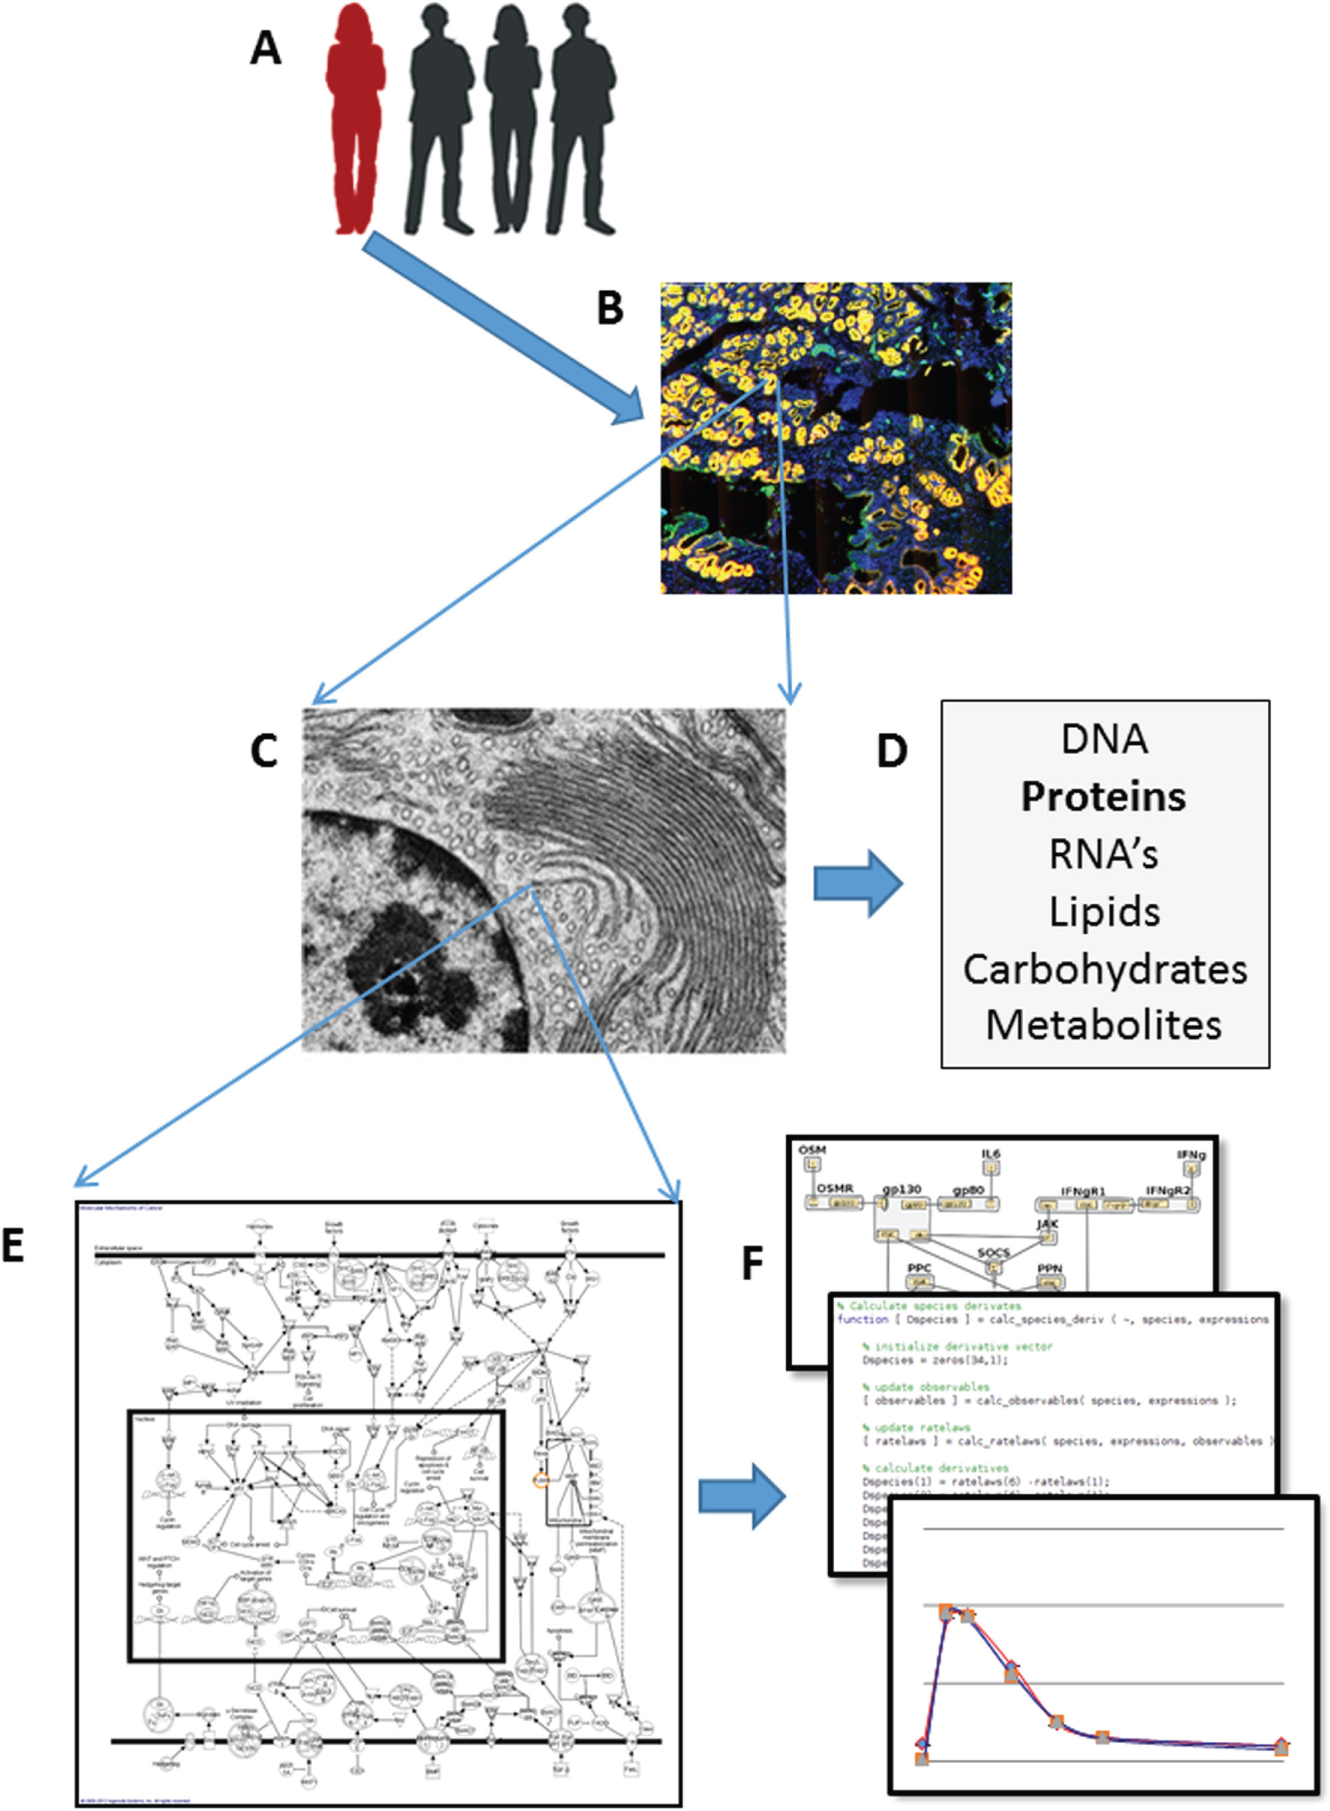
The multiple scales of biological heterogeneity detected in a population of organisms, as well as within organs, tissues, cells, molecules, pathways, and networks. (
Heterogeneity results from genetic variation, 7 nongenetic characteristics, 1 or a combination of these ( Fig. 2 ). Nongenetic heterogeneity can be driven by extrinsic factors (e.g., tissue microenvironment) and intrinsic factors (e.g., variation in protein expression). 1 Although heterogeneity is sometimes referred to as “noise” or as arising from “noise” in cellular networks, the presence of noise hinders information transfer, while the presence of heterogeneity provides information.
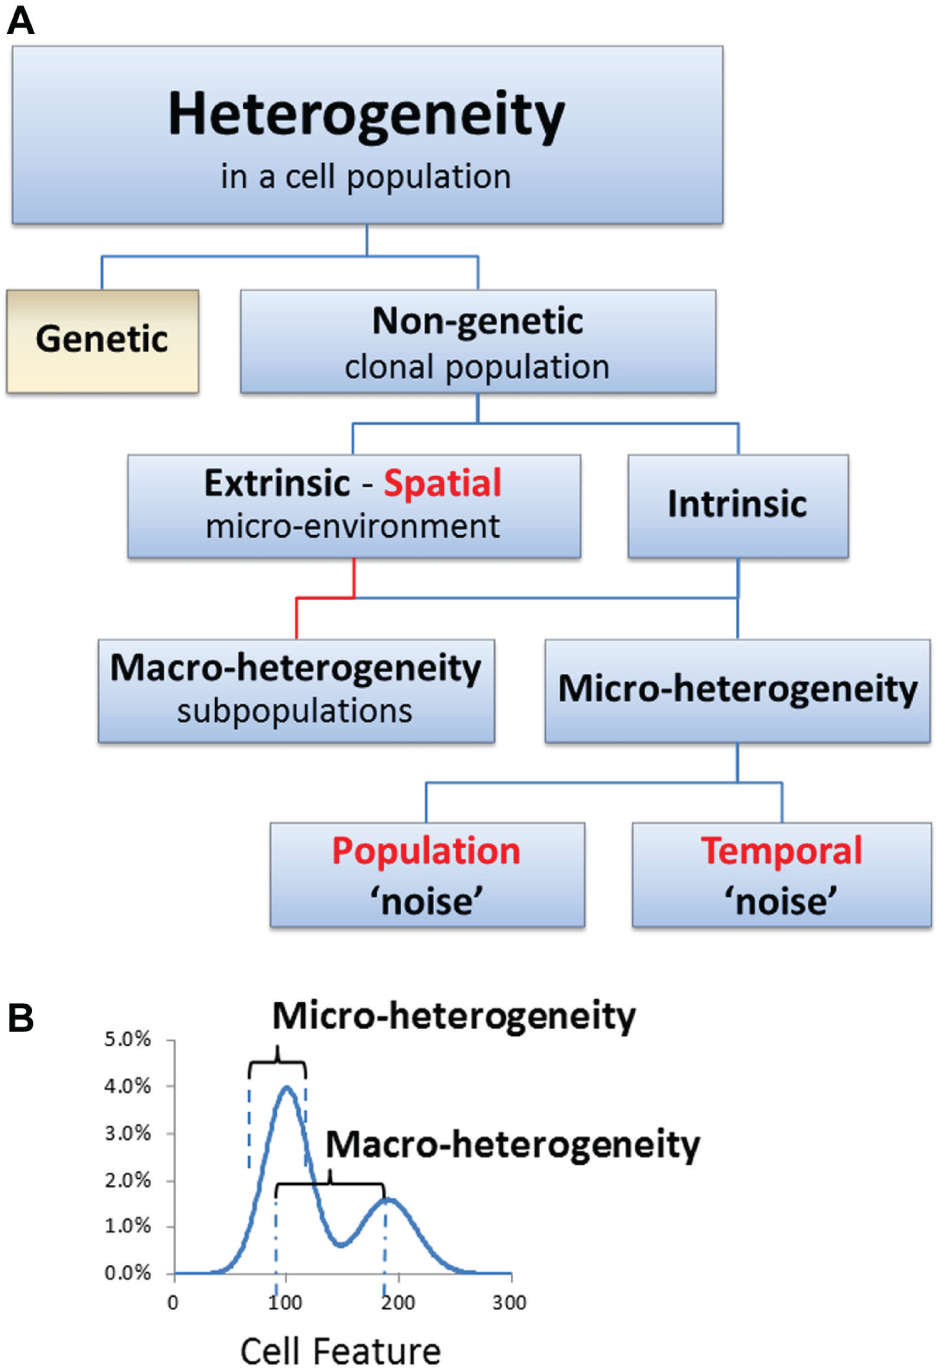
Classification of the types of heterogeneity that can be exhibited by a population of cells (adapted from Huang
1
). (
Analysis of heterogeneity is expected to inform a wide range of biological applications, from biomedical research to medical diagnostics. Whether developing an assay for drug discovery, a therapy for cancer, or optimizing a protocol for stem cell differentiation, the prevalence of heterogeneity in biological systems suggests that more can be learned through analysis of the population distribution than merely evaluating the population average. In contrast, most cell experimentation currently assumes a normal distribution of data and uses the population average for the sake of speed and simplicity. However, it is becoming clear that heterogeneity is the rule rather than the exception, such that homogeneity in population data cannot be assumed when analyzing and interpreting data.
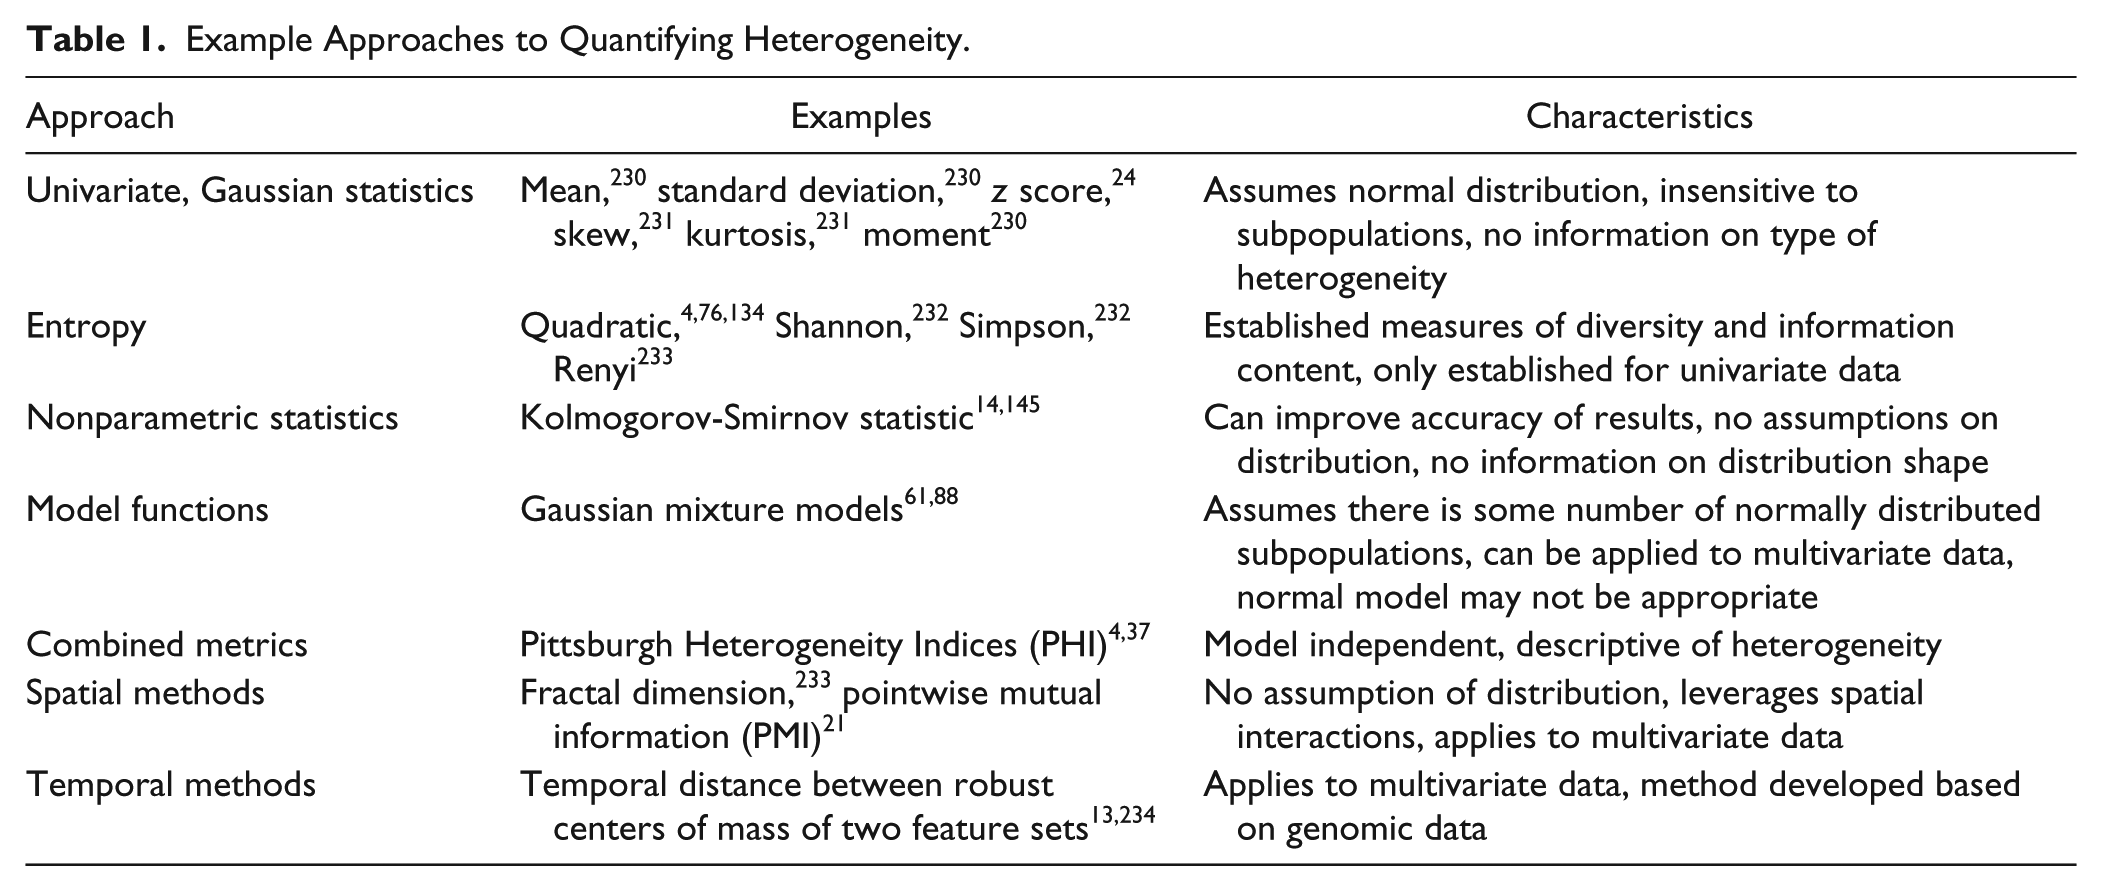
Measurement of heterogeneity most often involves methods with single-cell resolution ( Fig. 3 ), although population-based methods have also been used to detect heterogeneity. For example, experiments by Luria and Delbruck 8 on populations of bacteria demonstrated in the 1940s that bacteria spontaneously mutated, forming a heterogeneous population in which predisposed subpopulations, harboring virus-resistance mutations, were selected as a result of viral infection. More commonly, though, heterogeneity is detected through examination of the phenotypes of the individuals in the population and is characterized by quantitation of the distributions of those phenotypes. In studies where cellular heterogeneity has been characterized, the methods and metrics have varied ( Table 1 ).2,4,9–17 The lack of an accepted standard for measuring and reporting cellular heterogeneity makes it difficult to compare the degree of heterogeneity in different studies and biological systems. Therefore, at the present time, only the methods and metrics can be compared. However, we will make suggestions on the application of metrics.
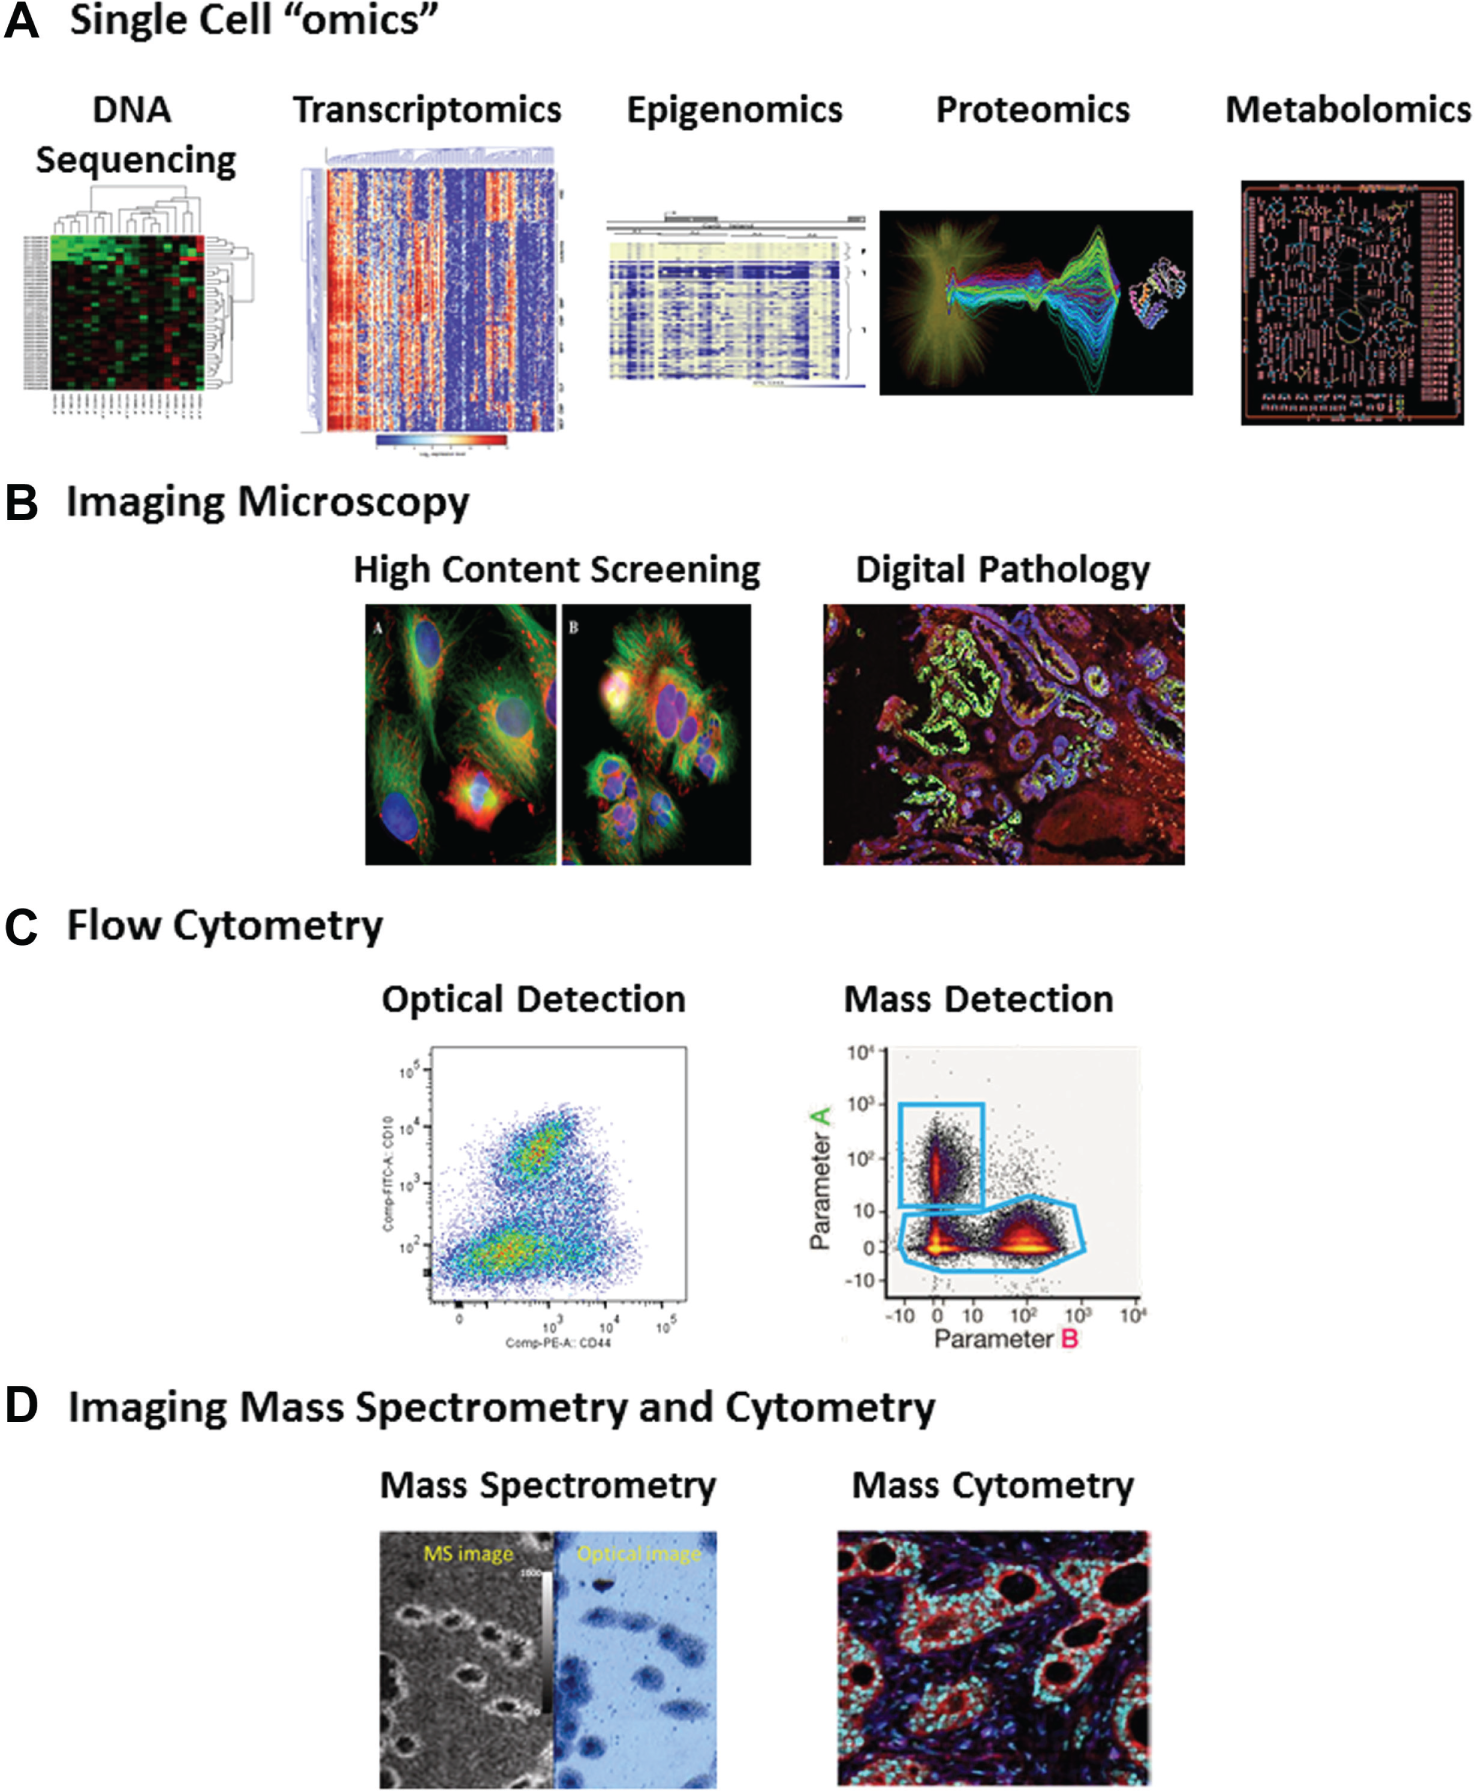
Heterogeneity in populations of cells can be quantified by a variety of methods that permit cell-by-cell measurements. (
Example Approaches to Quantifying Heterogeneity.
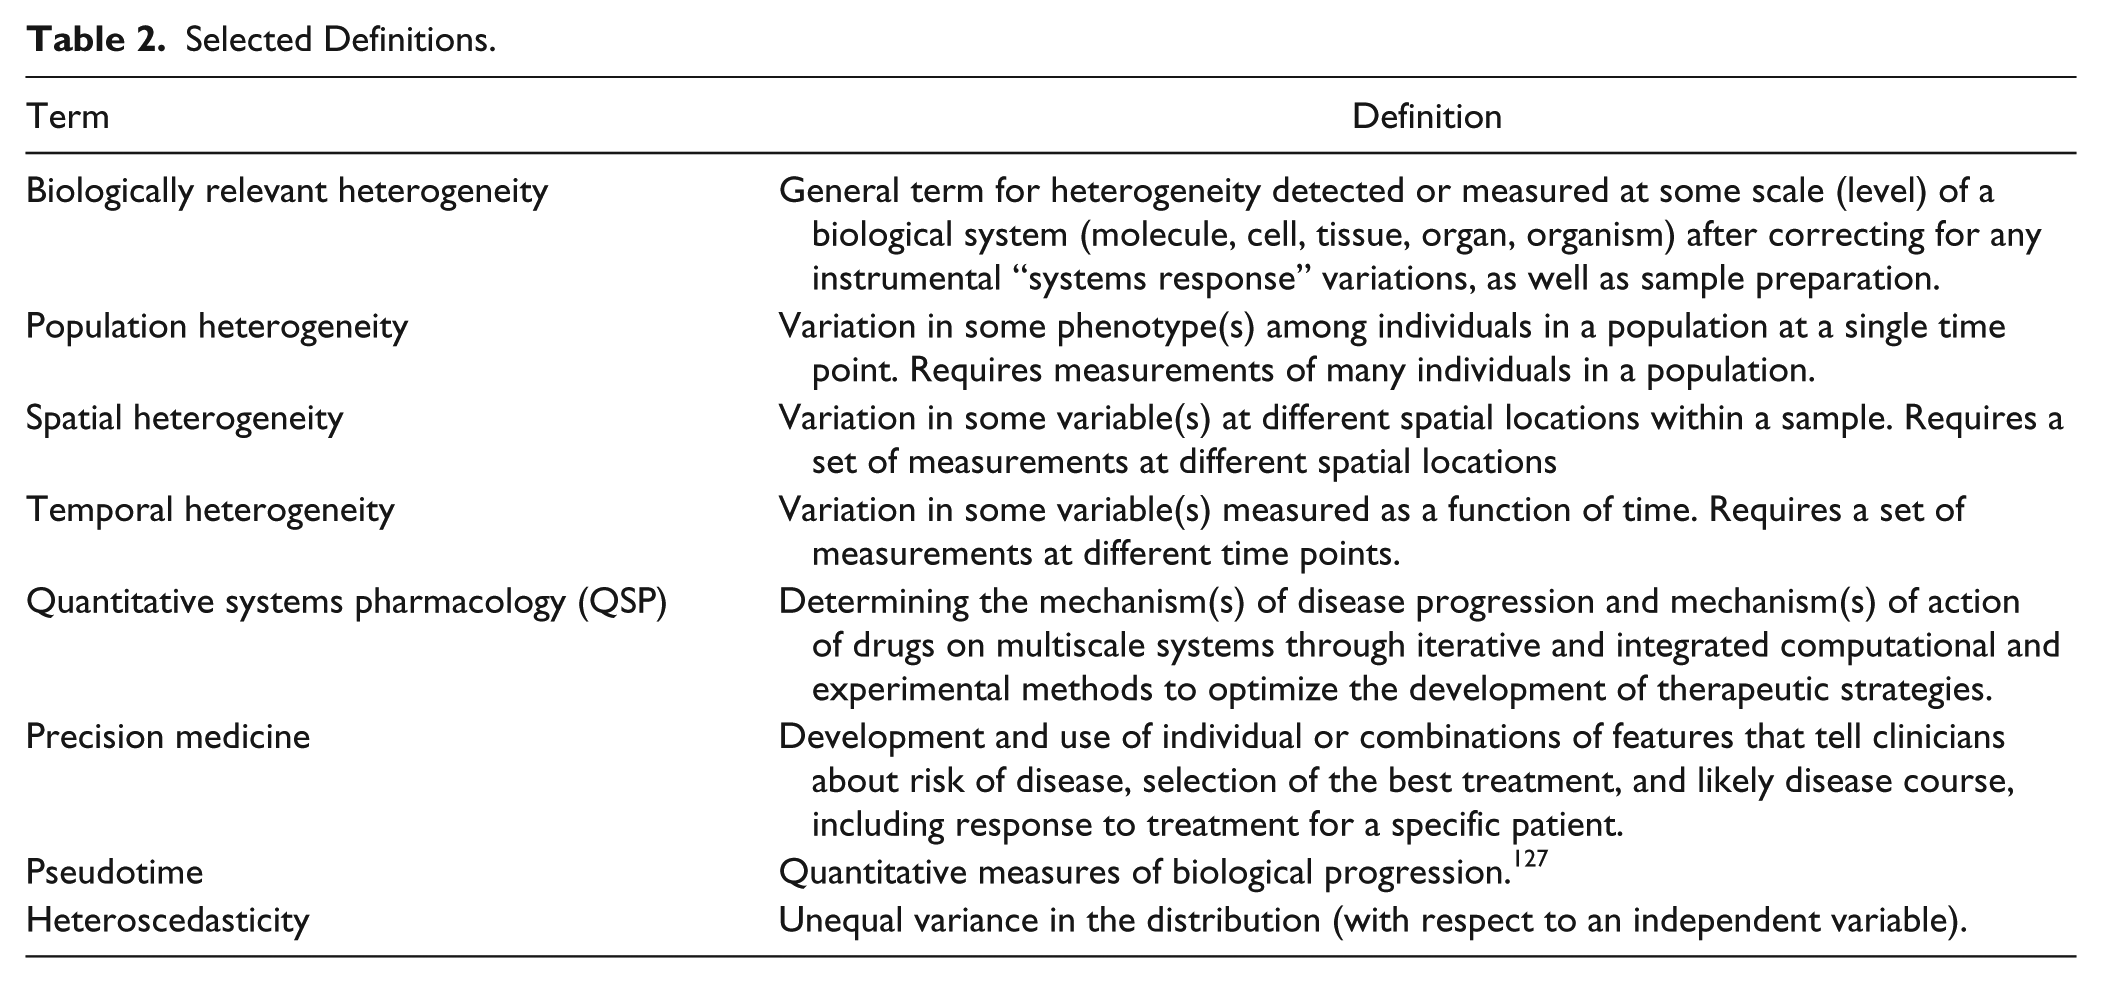
Biologically relevant heterogeneity can be divided into three categories: population heterogeneity, spatial heterogeneity, and temporal heterogeneity ( Table 2 ). In each category, the heterogeneity can be characterized as micro- or macro-heterogeneity, depending on the nature of the distribution ( Fig. 2 ). Micro-heterogeneity refers to heterogeneity within an apparently uniform population (i.e., the variance of a single bell-shaped distribution), whereas macro-heterogeneity refers to the presence of distinct populations (i.e., multimodal). 1 Establishing standardized terminology, methods, and metrics will be essential to the routine extraction and communication of insights from biological heterogeneity.
Selected Definitions.
Detection of Biologically Relevant Heterogeneity
Biologically relevant heterogeneity can be detected and quantified with a variety of methods, provided they have sufficient fidelity over the population. One of the earliest indications of biological heterogeneity was in tumors, where morphological variations were noted by pathologists who examined fixed sections of animal and human cancers. 18 However, manual cell-by-cell scoring limits the size of the regions and number of cells that can be analyzed as well as the objectivity of the analysis. Digital pathology now enables a more comprehensive and objective assessment of cellular phenotypes in tissues, allowing analysis of population and spatial heterogeneity of biomarkers and microenvironment components such as immune cells.19–23 The detection of heterogeneity is currently most advanced in isolated cell systems, where automated microscope imaging (e.g., high-content screening [HCS]) is used to extract multiple phenotypic features from many, relatively large populations of adherent cells,24–26 flow cytometry is used for bacterial27,28 and suspension cell analysis,29–32 and other single-cell methods, such as recent developments in single-cell genomics and proteomics33–36 where there has been progress toward in situ analysis ( Fig. 3 ).
Distinguishing between biologically relevant heterogeneity and “system variability” resulting from sample preparation, data acquisition, and/or data processing requires a well-founded understanding of the sources of noise in the measurements, achieved by calibration and characterization of the systems response using appropriate standards or reference measures.4,37–39 The importance of minimizing the “system variability” is critical to achieving consistent, quantitative measurements, as has been discussed in detail for high-content imaging and flow cytometry.40–42 Flow cytometry has a long history and mature process for system calibration, characterization, and standardization, including published protocols 43 and an array of reference standards.44–46 As a result, data can be generated and compared between different systems and in different labs. However, manual gating and segmentation of populations of cells can still be a source of variation in the results. 47 Recent progress on automated segmentation of cell populations shows some promise in addressing this source of variability.48–51 Establishing standard methods and metrics for the characterization of system reproducibility is a key to more reliable detection and quantitation of biological heterogeneity.
The Need for Methods/Metrics to Detect, Quantify, and Characterize Heterogeneity in Biological Systems
Historically, “population average” metrics have dominated the measurement and interpretation of cellular data. Most cellular assays rely on whole-well measurements, such as total enzyme activity or total fluorescence intensity per well, making contributions from subpopulations or extreme outliers impossible to parse from the average response. This well average approach has also extended to high-content cellular assays, where the standard methods generally assume a normal data distribution to “save time” and to “simplify analysis” by producing a single value that is easily understood, even if not fully representative of the biology. In fact, when computational models based on these assumptions are employed and fail to explain observations or give variable results, investigators will often discover biologically relevant heterogeneity in the system they are studying. 8
Population average measures are routinely used as assay readouts and to assess assay performance in chemical or biological library screens or structure-activity relationship (SAR) campaigns. Standard assay performance metrics such as the Z′ factor 52 or the strictly standardized mean difference (SSMD) 53 only measure the degree of separation of the positive and negative control wells, based on the average and standard deviation (SD) of the assay readouts. The assumptions are that there is a normal distribution of the assay readouts across wells and that the assay readout adequately represents the biology in the well. However, population average metrics do not adequately reflect the distribution of the biology within the wells, which can lead to misinterpretation of assay consistency. This was recently illustrated by Gough et al. 37 in a retrospective analysis of a high-content assay where there was heterogeneity in the interleukin-6 (IL-6) activation of STAT3. They showed that even though the Z′ prime indicated a robust assay at the well level (Z′ ≥ 0.5) across all the plates, the fundamental biology on several plates was found to be quite different. Thus, to reliably assess the biology, it is necessary to establish quality control (QC) metrics for the distribution of the cell population within each well.
Meaningful quantitation of heterogeneity requires selecting an appropriate set of metrics, while interpretation of heterogeneity requires a strategy for dissecting the inherent complexity of cellular distributions ( Fig. 2 ). In one approach, the distinction between homogeneous and heterogeneous data is defined by a measure of diversity in the sample. In a sample that exhibits heterogeneity, micro-heterogeneity is indicated by a normal distribution and macro-heterogeneity 1 by the degree of nonnormality, using a metric such as the Kolmogorov-Smirnov (KS) statistic.4,54 Macro-heterogeneity requires the use of analytics that can characterize the distribution, visually or using model functions, as consisting of a number of discrete subpopulations (sometimes referred to as modality), a continuous and potentially complex distribution, or some combination. 14
In addition to population heterogeneity, it is also important to consider spatial heterogeneity. The detection and interpretation of spatial heterogeneity, using methods such as pointwise mutual information (PMI) or computational modeling, can be used to identify patterns of phenotypic heterogeneity that may be correlated with the microenvironment or potentially the result of intrinsic factors. 21 The analysis of temporal heterogeneity is also important and presents some unique challenges, including deconvolution of cell cycle effects (which may also be a source of heterogeneity) and avoiding artifacts in monitoring cells over time. 55 However, there are examples of live-cell studies that have addressed these challenges, collecting large cell-level data sets to analyze and model the temporal changes and heterogeneity in live-cell phenotypes.55–57 A systematic approach to the detection, quantitation, and characterization of heterogeneity will make it a source of insight, rather than simply an added burden to investigators.
Even though researchers are more frequently detecting and investigating heterogeneity, additional attention must be given to the practical need for robust generally applicable tools that can be implemented in high-throughput production environments, rather than continuing to introduce custom solutions that are intrinsically too narrow in scope to support integration of data sets. Ultimately, we need commonly understood metrics for heterogeneity, just as we use statistical concepts like mean and SD for normal distributions.
Potential Insights from the Analysis of Heterogeneity in Biology and Drug Discovery
Whether heterogeneity is inherent to a population of cells, 58 induced by the microenvironment,59,60 or induced by compound or reagent treatment,4,61–63 analysis of phenotypically similar cell subpopulations, derived from the analysis of heterogeneity, is expected to improve the accuracy of cellular measurements, better support the interpretation of the data, provide insights into the regulation of cellular networks, guide the computational modeling of the networks, guide the prioritization of compounds for development in drug discovery, and optimize the development of diagnostics for precision medicine and further basic biological knowledge.
Cell-to-cell variability is believed to be the result of deterministic molecular regulatory mechanisms that remain largely uncharacterized.1,64,65 Subpopulations of cells with distinct phenotypes isolated from a macro-heterogeneous population have been demonstrated to revert to the original macro-heterogeneous phenotype distribution over time,66,67 indicating that heterogeneity is a persistent characteristic of a population, reflecting transitions among distinct metastable cell states induced by cell-autonomous and non-cell-autonomous signaling in contrast to simply noise. 66 A recent study suggesting that heterogeneity can be decomposed into groups of biomarkers that are consistent with known signaling pathways, also implies a mechanistic basis for the cell-to-cell variation. 9 In other studies, it has been shown that patterns of signaling heterogeneity can distinguish cellular subpopulations with different drug sensitivities.4,68 The differential sensitivity to drug treatment of subpopulations of cells may well provide an indication of compound mechanism(s) of action.1,5,9,64,65,68,69 Differential sensitivity measurements in vitro also provide insights into how effective a therapy might be in vivo. For example, if the half-maximal response represents all cells showing 50% inhibition, then treatment cycles in vivo may produce a different response rate than if the half maximal response is a result of 100% inhibition in half of the cells. In the latter case, a significant survivor population among the unaffected cells may result in a treatment with poor efficacy in the clinic, despite apparently good efficacy in cell assays. In addition, cells treated with drugs of similar mechanism of action exhibited similar heterogeneity. 61 Taken together, these findings suggest that there is an integral link between phenotypes, networks, drug sensitivity, and patterns of heterogeneity. The analysis of heterogeneity therefore provides a basis for the generation of hypotheses regarding regulatory networks, such as that suggested by Gascoigne and Taylor 62 that the heterogeneity induced by drugs was the result of interacting networks.
Implications of Heterogeneity for Precision Medicine
Because there is heterogeneity among individual patients, the challenges associated with improving the success rate in developing therapies may seem daunting. However, the solution may be in the development of precision therapies that address the heterogeneity exhibited in subpopulations of patients, as discussed by Stern et al. 6 in a perspective on quantitative systems pharmacology. There is growing evidence that some heterogeneity enables physiological and evolutionary adaptation.70,71 The association between cellular heterogeneity and adaptation suggests that ignoring heterogeneity in the in vitro cellular response to candidate therapeutics may lead to the selection of compounds to which cells will readily adapt, leading to a loss of efficacy.72,73 On the other hand, an understanding of interclonal interactions that can lead to disease-specific phenotypic traits could provide novel therapeutic opportunities.72,74
When heterogeneity is associated with dysregulated genetic-based and/or non-genetic-based functions, it can play a critical role in the progression of complex diseases such as cancer, 75 where intratumor heterogeneity poses a formidable challenge to the development of therapeutics,5,65 as well as diagnostics.5,21,22,76 Thus, identifying, quantifying, and characterizing heterogeneity in patient samples and disease-relevant models using validated cell-by-cell analysis methods5,21,73,75–78 addresses an important unmet need.
Methods for Single-Cell Evaluation in Cell Populations
There are many systems and methods for the evaluation of single cells in the context of a population, including high-content imaging methods such as high-content screening (HCS) and digital pathology, imaging mass spectrometry (IMS), imaging mass cytometry (IMC), flow cytometry, mass cytometry (MC), and single-cell “omics” ( Fig. 3 ). In general, each of these approaches delivers information with enough signal-to-noise at the single cell level and sufficient throughput at the population level to characterize the heterogeneity in cellular phenotypes. The metrics discussed below can be applied to all of these methods.
Optical High-Content Imaging/Digital Pathology
High-content imaging, such as HCS or digital pathology, when applied to multiple labeled targets, can provide data from large numbers of cells in large numbers of samples. HCS is commonly used to measure fixed or live cells in up to five dimensions (3D plus time and wavelength) using expressed fluorescent protein biosensors, a wide range of fluorescent probes, and transmitted light methods.24,79 Digital pathology typically uses stains for transmitted light imaging and fluorescent antibodies and nucleic acid probes to label specific biomarkers in formalin-fixed, paraffin-embedded (FFPE) tissue sections. Both applications benefit from capturing a broad range of information about the population, including spatial distributions of tissue structures and molecules within each cell, within cellular compartments, and spatial relationships between cells. Live-cell imaging also provides temporal and direct functional readouts such as cell motility and division.80–82 Light microscopic approaches range from low-magnification, large area images that contain hundreds to thousands of cells that are analyzed individually, to one-by-one serial evaluation of tens to hundreds of cells with high magnification, including super-resolution.83–85 In addition to HCS applications,37,86 a wide range of automated microscopy analyses are routinely used in research4,9,68,87,88 and digital pathology.20,21,23,69,76,89
Several light microscope imaging platforms have been developed to acquire multivariate information from images of large area tissue sections and tissue microarrays (TMAs) using DNA, RNA, and protein biomarkers.22,90,91 Although typically limited to one to six labels per cell due to spectral overlap, recent technological advances have now enabled imaging of highly multiplexed (“hyperplexed”) biomarkers (>60) in many individual cells in situ in fixed tissues, with subcellular resolution that captures the spatial arrangement of many discrete cellular phenotypes (i.e., spatial heterogeneity).73,77,92–94 It is now possible to “map” the location of specific cell types, cell activation states, and cell biomarker expression levels, as well as extracellular constituents, in tissue sections and TMAs. The determination of spatial heterogeneity at subcellular resolution is still nascent, but it promises to help elucidate the cellular networks, as well as their cell-autonomous and heterotypic signaling interactions, involved in the regulation of both normal and disease processes. The importance of understanding the dynamic regulation of cellular heterogeneity is discussed below.
IMS and IMC
The application of mass spectrometry (MS) to image analysis has enabled a higher degree of multiplexing of a wider range of analytes that can be simultaneously imaged in cell and tissue samples at the single-cell level. There are basically three approaches to imaging that use MS: a label-free method, IMS, and two epitope tagging methods (IMC and multiplex ion beam imaging [MIBI]).
IMS is a label-free method that allows the visualization of ionizable species within a given mass range while retaining spatial information. 95 The technique can measure a range of molecular species from small-molecule drugs to full-length proteins in samples ranging from whole animals to single cells.95–97 There are three basic ionization approaches for IMS: matrix-assisted laser desorption ionization (MALDI), secondary ion mass spectroscopy (SIMS), and desorption electrospray ionization (DESI). 98 Each approach has advantages in terms of types of analytes that can be measured and the spatial resolution. Lipids, peptides, and small molecules can be detected by all three, with MALDI also capable of measuring full-length proteins with a molecular mass of ~50 kDa. The spatial resolution of IMS typically ranges from 100 µm for DESI, 30 to 50 µm for MALDI, and 0.5 to 1 µm for SIMS, 95 although advances in MALDI technology have enabled subcellular resolution.97,99,100 Furthermore, IMS can report molecular distributions in 3D volumes, thereby extending the spatial environment. 101
Both IMC 93 and MIBI 102 use antibodies that are tagged with nonbiological, unique rare earth metal reporters that are easily identified in MS. Samples are ionized with a laser or ion beam, the metal tags are quantified, and then the images are computationally reconstructed based on known raster positions of the laser or ion beams.93,102,103 These approaches are still developing but have already enabled quantification of >40 parameters at the single-cell level103–105 and have been used to detect heterogeneity in breast cancer tissues.93,106
The power of IMS lies in its ability to quantitatively measure hundreds of analytes simultaneously, enabling the discernment of novel molecular species involved in specific biological contexts. IMS can be used in a targeted mode, looking at known molecular entities, or in a discovery mode, which requires no prior knowledge of the biology. This aspect has been successful in identifying intratumor heterogeneity at the molecular level in otherwise histomorphologically homogeneous tumor regions in primary gastric cancers. 11 In a more targeted approach, Mao et al. 107 used air flow–assisted ionization mass spectrometry to image the distribution of lipids in breast cancer tissues and demonstrated that various histological grades of invasive ductal carcinoma and ductal carcinoma in situ can be distinguished by the lipid profile. Other studies have reported the application of IMS to studying intratumor heterogeneity and differentiation of tumor/tissue types108,109 as well as heterogeneous distribution of drugs in tissues. 110 The ability of IMS to quantify metabolites enables a functional assessment of the biology not seen by other methods and enables a deeper understanding of the disease state as well as mechanisms of action of drugs. 96
Flow Cytometry
Flow cytometry is a standard method that rapidly evaluates many cells (up to ~10,000 cells/s) in a population one at a time. The application of flow cytometry to the analysis of heterogeneity in cellular systems is certainly not new. 27 Like the microscopy methods described above, cells can be labeled using expressed fluorescent proteins as well as with a wide range of fluorescent probes and antibodies. Highly multiplexed flow cytometry allows up to 17 fluorescent markers 111 per cell using photodetection or more than 36 mass markers per cell using mass cytometry detection. 112
In flow cytometry, individual biomarkers are most often used for binary classification of cells, using either manual or automated gating to distinguish positive from negative cells, but the data collected from the samples include the distribution of the intensity of the labels and therefore can be used to identify and characterize the heterogeneity of the cells. 113 Because cells must be suspended to be measured, flow cytometry is most often used for nonadherent cells but can be used for any cells that can be isolated and suspended in media. 30 By suspending cells in media, the spatial context of the cell is lost, as well as some of the subcellular spatial context, but the cells can be sorted based on the signal intensity from one or more markers, allowing the selection of live subpopulations of cells for further experiment. Sample preparation, especially when isolating cells from tissue, can lead to significant differences between samples and laboratories and therefore needs to be carefully controlled. 114
Single-Cell “Omics”
Multidisciplinary technological advances in experimental design and computational analysis have now made it possible to measure global gene expression in thousands of individual cells in a single experiment to infer biochemical and genetic regulatory mechanisms. 115 Single-cell RNA-seq (scRNAseq)116,117 and its complementary single-cell-based platforms for epigenome (i.e., bisulfite sequencing118,119 and DNAse I hypersensitivity120–122), proteome,93,104,123 and metabolome 124 analyses have begun to provide an unprecedented view of cellular heterogeneity. 115 The power of defining the spatial and temporal relationships among distinct subpopulations of cells circumvents the limitations of averaged readouts intrinsic to bulk analyses, 125 enabling the determination of the dynamics and regulation of cellular processes such as differentiation, tissue homeostasis, and complex disease progression. 115 However, the single-cell measurements are often quite variable, requiring that novel normalization strategies be introduced into the experimental design to distinguish technical variability from genuine biological variability. 126 Furthermore, while variation in measurements (i.e., gene expression) linked to the cell cycle can provide important biological insights, this variation could also obscure more physiologically important differences among cells. 36 To address the potential confounding effects of cell cycle asynchrony and more generally discriminate among different sources of biological heterogeneity, single-cell latent variable models have been introduced. 36 This computational approach for analyzing cell-to-cell heterogeneity has enabled the identification of otherwise undetectable subpopulations of cells that, for example, have provided insights into the differentiation of naive T cells into T-helper cells. 36 Normalized single-cell data for which sources of heterogeneity have been addressed can be processed using unsupervised clustering algorithms to identify cell types, define stable states, and reconstruct transition paths (i.e., trajectories) between these stable states. 115 Quantitative measures of biological progression (i.e., pseudotime; Table 2 ) through complex processes such as differentiation and oncogenic transformation can be generated using these algorithms that in turn provide valuable mechanistic insights. 127 For instance, Monocle has been designed to work with scRNAseq and, by analogy, Wanderlust 104 with high dimensional cytometry for proteomic measures of pseudotime. We expect, for example, that the mechanistic insights gained from comprehensive network-based single-cell analysis of heterogeneity will be applied to circulating tumor cells for the early detection of rare resistant subpopulations to inform precision therapeutic strategies.59,128
Need for a Standard Set of Heterogeneity Metrics
There have been many methods and metrics applied to the analysis of heterogeneity. Table 1 lists some of the major classes of metrics with their key characteristics. Most of the metrics are focused on characterization of population heterogeneity, while relatively few methods address the important spatial aspect of heterogeneity, and temporal heterogeneity56,57 remains to be addressed.
Value in Establishing a Standard Set of Metrics
Although a single set of standard metrics for heterogeneity may not be optimal in all situations, it would provide a number of advantages. First, it would encourage integration into software packages like Spotfire (Tibco Software, Boston, MA), R 129 and HCS, and flow cytometry analysis packages. Second, it would facilitate communication and enable comparison of heterogeneity between systems and assays. Third, only after a method has been established through a peer-reviewed, transparent approach can it be routinely used in a scope beyond the focus of the investigator who developed it. As the formal quantification and analysis of heterogeneity becomes more common, there is a need both for tools that can be applied efficiently, but also tools that provide some insights into the system under study.
The most important characteristics of an optimal set of heterogeneity metrics are to facilitate interpretation of the biology and to produce clear communication of the results of the analysis. Heterogeneity measures need to describe the shape of the population distribution and should be as simple and clear as describing a normal (unimodal) distribution by the “mean,” “median,” “mode,” and “standard deviation.” A second key aspect of optimal metrics is a clear understanding of where they can be applied and why they are appropriate for a particular situation. Optimal metrics for heterogeneity, as they gain acceptance, will have more general or more specific applications.
Comparison of Published Metrics for Heterogeneity
Several types of metrics have been applied to the identification of heterogeneity in cell populations. Generally, the metrics characterize three aspects of the distribution: the overall extent or diversity, the shape or modality, and the tails. As a first pass, graphical methods, including histograms and the Q-Q plot, can be useful for visualization and detection of modality. 14 Nonparametric statistics, such as interquartile range (IQR), 130 percent outliers, 131 the KS statistic, 54 Shannon index, 132 Simpson index, 133 and quadratic entropy, 134 have been used to describe the distribution of a population. Extent measures include the IQR and entropy measures. The IQR, defined to be the first quartile subtracted from the third quartile, is a measure of statistical dispersion 130 that can be applied to any distribution, but half the data falls outside the range and therefore the IQR is only sensitive to the central portion of the distribution. The Shannon entropy and Simpson indices have been used to describe the diversity of species in the ecological sciences. The disadvantage of both Shannon and Simpson indices is that they ignore the magnitude of the difference between species. The quadratic entropy incorporates a distance matrix to create a more robust measure of diversity by including the magnitude of the differences. Quadratic entropy has been applied to describe the diversity in cell populations.4,37,76,134 Shape measures often use a normal distribution as a reference and make a qualitative or quantitative comparison with the data.
The KS statistic is a well-known method for quantifying the difference between two distributions. This can be used, for example, as a normality test when a sample distribution is compared to a normal distribution4,14,37 or as a QC test to track the shape of the distribution in controls. Other statistical tests of normality, such as Anderson-Darling, also compare a sample distribution to a normal distribution, returning a numerical measure of the goodness of fit. 135 In selecting a test, it is important to consider the sample size, as some tests of normality work best for small sample sizes of 10 to 1000. Cellular assays may contain data from hundreds to many thousands of cells, and such tests may be too sensitive for these large populations and thus may overestimate the significance of small differences in heterogeneity. Finally, the tail of the distribution can be characterized by the outliers. The percent outliers in the population4,37 can indicate whether the population has a normal or more heavy-tailed distribution. 131
A simple pair of metrics to indicate a nonhomogeneous response is the measure of maximum effect (efficacy, Emax) and the Hill slope (HS), which can be observed even in population averaged measurements but only in a dose-response format. Maximal effects that plateau below 100% could be indicative of differential response to treatment by subpopulations that should be investigated further. In a study looking at the response of a panel of breast cancer cell lines to various anticancer compounds with different mechanisms of action, Fallahi-Sichani et al. 136 suggest that during drug development where the aim is to understand variability in patient response, Emax and HS are more informative than simply looking at potency. A shallow HS in the concentration-response curve was shown to be correlated with high cell-to-cell variability in target inhibition. This variability could be the result of fluctuations of target amount, activity, or other interactions of the target in different cells. Interestingly, in that study, it was noted that inhibitors of the mTOR pathway, which is subject to complex feedback regulation and potentially a high degree of heterogeneity, had the lowest HS values. While Emax and HS may be useful as indicators of heterogeneity, alone they provide no specific information about the nature of the heterogeneity.
Another common approach to characterizing heterogeneity is the use of principal components analysis (PCA) to reduce the dimensionality of multiparameter data followed by segmentation of the population using a Gaussian mixture model (GMM).61,68,88 When there are clear subpopulations, GMM can be a powerful approach to quantifying the relative size of subpopulations and the movement of cells between subpopulations in response to treatment. However, this approach is not conducive to automated, high-throughput applications.
An alternative is the direct analysis of the shape of the distributions of cellular phenotypes, without assuming some number of discrete subpopulations. In this method, the distributions are characterized and compared using three indices that describe the diversity, normality, and percent outliers in the distribution. Together, referred to as the Pittsburgh heterogeneity indices (PHI), the quadratic entropy, the norm-KS test, and the percent outliers can be used to quantify heterogeneity.4,37 This approach is broadly applicable, can be used to compare data between laboratories and methods, can be incorporated in existing cell analysis software packages, and is able to identify differential sensitivity of individual cells to compound exposure. The University of Pittsburgh is presently working with one of the suppliers of data analysis packages to incorporate the PHI as a standard approach to the quantitation of population heterogeneity and will also provide an R-script to calculate the PHI on the University of Pittsburgh Drug Discovery Institute website. 137
QC Metrics for Characterizing the Reproducibility of Population Distributions
An important question in the analysis of heterogeneity is reproducibility from day to day, week to week, or even month to month. Analysis of heterogeneity in large-scale biology and drug discovery projects requires methods for validation of consistent cell-to-cell variability4,37–39 and establishment of a quality control procedure to monitor reproducibility. 37 It is important to note that metrics such as the Z′ factor or the SSMD give no information about the consistency of the distributions in the wells. 37 Figure 4 illustrates a workflow for heterogeneity analysis that addresses the need for metrics and quality control. The suggested procedure follows the same principles used for quality control in screening and therefore integrates well with a standard screening protocol. The procedure adopts a new metric, the QC-KS ( Fig. 4 , steps 2 and 3) that uses the KS statistic to compare the distributions in the control wells on each plate to a set of reference distributions established during validation. 37 The QC-KS metric ensures that the shape of the control distributions is consistent throughout the project.
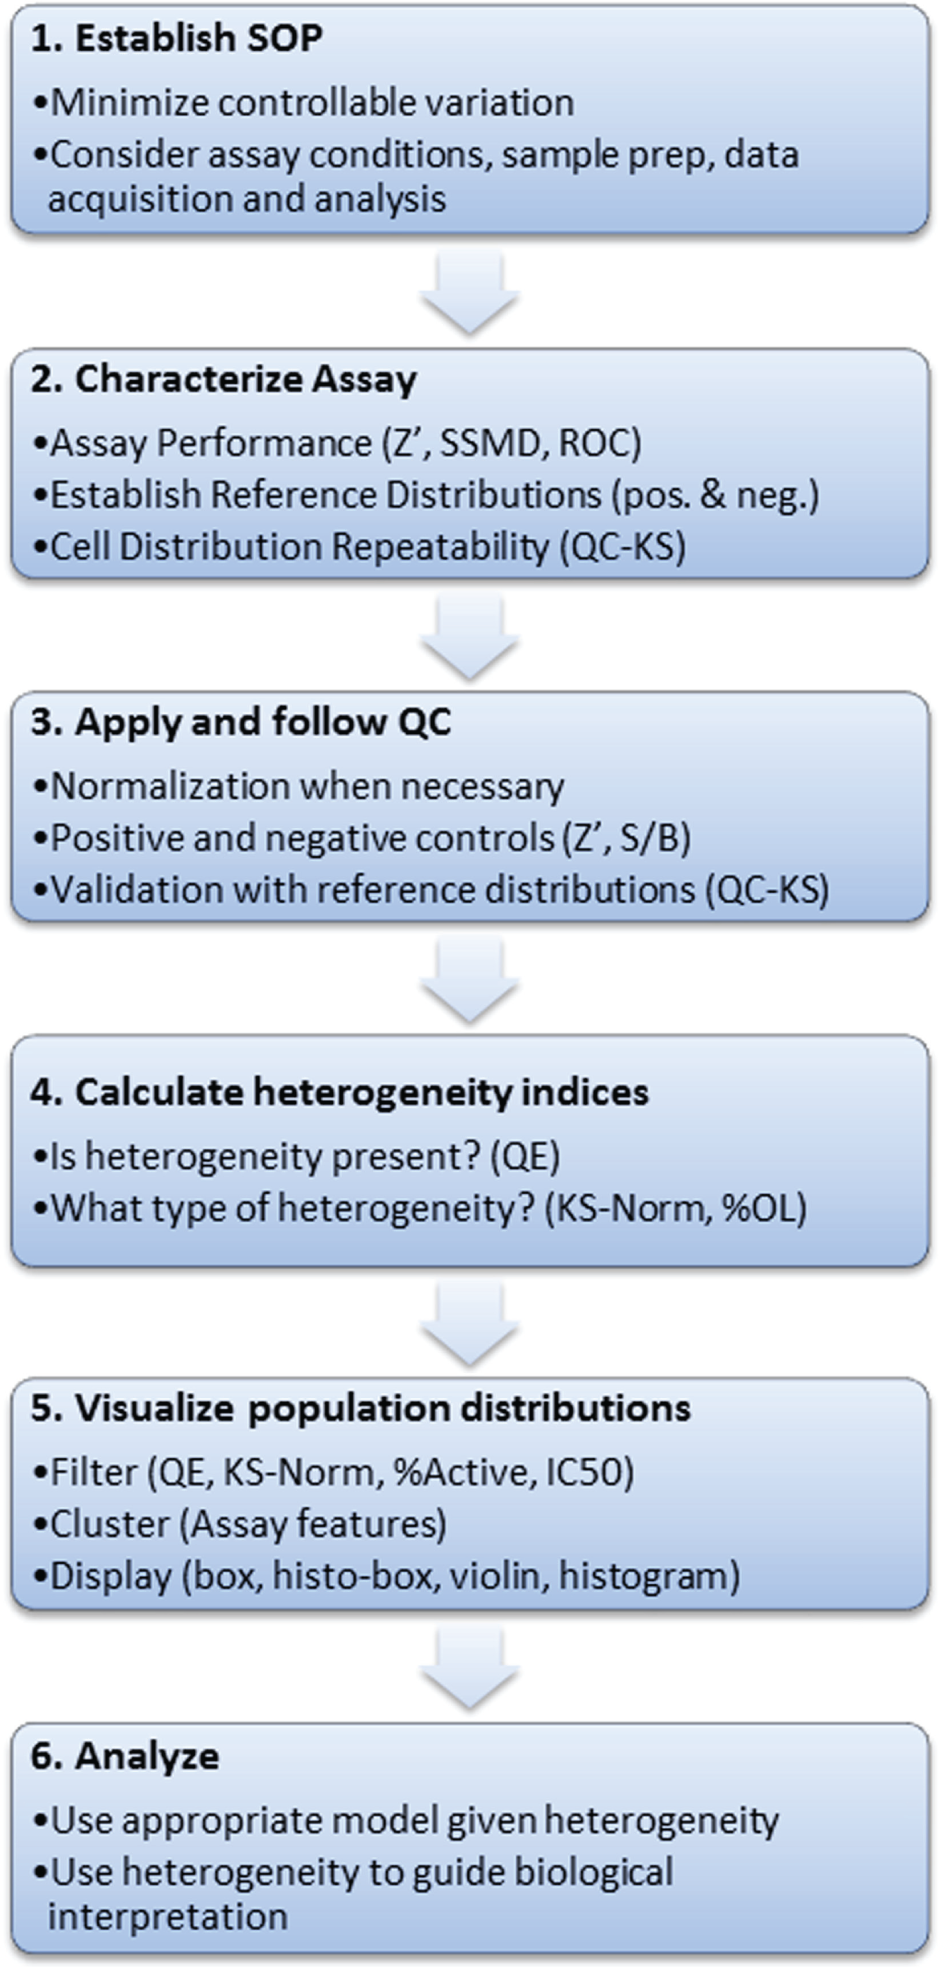
A workflow for quantitation of heterogeneity. The quantitative analysis of biological heterogeneity requires assay validation and quality control similar to a screen but with the addition of quality control methods and metrics for ensuring the reproducibility of the population distributions. After establishing the assay SOP (1), one approach is to establish a reference distribution while characterizing assay performance (2). The reference distribution is used throughout the project (3) to track the population distributions in the control wells. Once the consistency of the assay has been established, heterogeneity metrics can be applied to dissect the heterogeneity (4) and interactive analysis and visualization tools used to examine filtered or clustered distributions (5). Selected distributions can then be analyzed with various models and used to guide interpretations or drive the next experiments (6). KS, Kolmogorov-Smirnov; QE, quadratic entropy; QC, quality control; S/B, signal to background; SOP, standard operating procedure.
Informatics Tools for Evaluating, Visualizing, and Comparing Population Distributions in Biological Data
The analysis of heterogeneity presents a major opportunity to enhance our understanding of biological systems. Extracting insights from the heterogeneity in cell-based experiments requires informatics tools to support visualization and analysis of population distributions. Visualization of the distribution of data is most often the initial evidence of heterogeneity in a set of measurements. However, the application of heterogeneity metrics is expected to be a more reliable, quantitative, and objective indication of heterogeneity. Selection of the optimal visualization tools often depends on the type of data or the data distribution. For example, histograms are useful for univariate data while scatterplot matrices or density plots are more useful for multivariate data. 138 Visualization not only provides some immediate understanding of the nature of the variation in phenotypes but guides the selection of analysis approaches. Informatics tools for heterogeneity analysis can be categorized as interactive visualization tools for “drilling down” into distributions; modeling tools for clustering, classification, and pathway modeling; general-purpose tools that combine visualization and modeling; and application-specific tools that are customized to the specific data source.
Drilling Down into the Distributions
Whatever the initial method for detecting heterogeneity, there is a need for data exploration tools that provide general mathematical and statistical functions along with interactive visualization. Optimally, these tools would also provide a means to incorporate heterogeneity metrics. Figure 5 illustrates how six different patterns of heterogeneity for a single phenotype might appear in some standard visualizations. Figure 5A illustrates the six patterns as they might appear in an image, where color saturation or pseudocolor could be used to indicate variations in the phenotype and where a few outlier cells (depicted as stars) might exhibit a more extreme phenotype. While heterogeneity can be directly observed in images, it is difficult to assess and compare the extent of the heterogeneity or the presence or absence of outliers, except perhaps for a few extremes. As an initial evaluation of a distribution, a histogram like the ones in Figure 5B might be used. However, although the overall shape of the distributions is clear, and it is fairly easy to see whether the distribution is uni- or multimodal and whether it is reasonably normal (micro-heterogeneous) or more complex (macro-heterogeneous), the presence and distribution of outliers are not easy to see. Figure 5C , D illustrates two plot types, the histo-box plot 4 and the violin plot, 139 respectively, that combine the features of a histogram with a display of outliers similar to a box plot ( Fig. 5E ). Combining the histogram with the distribution of outliers provides a more detailed view of the heterogeneity in the sample data. Note that in the images and standard box plot, it is generally not possible to distinguish between micro- and macro-heterogeneity. Multidimensional scatterplots or density plots are also commonly used to visualize heterogeneity. It is relatively easy to visually pick out a cluster that represents a subpopulation in a scatterplot. Software tools for detailed analysis of distributions are available in a wide range of statistical and data visualization packages, including commercial and open-source packages described below.
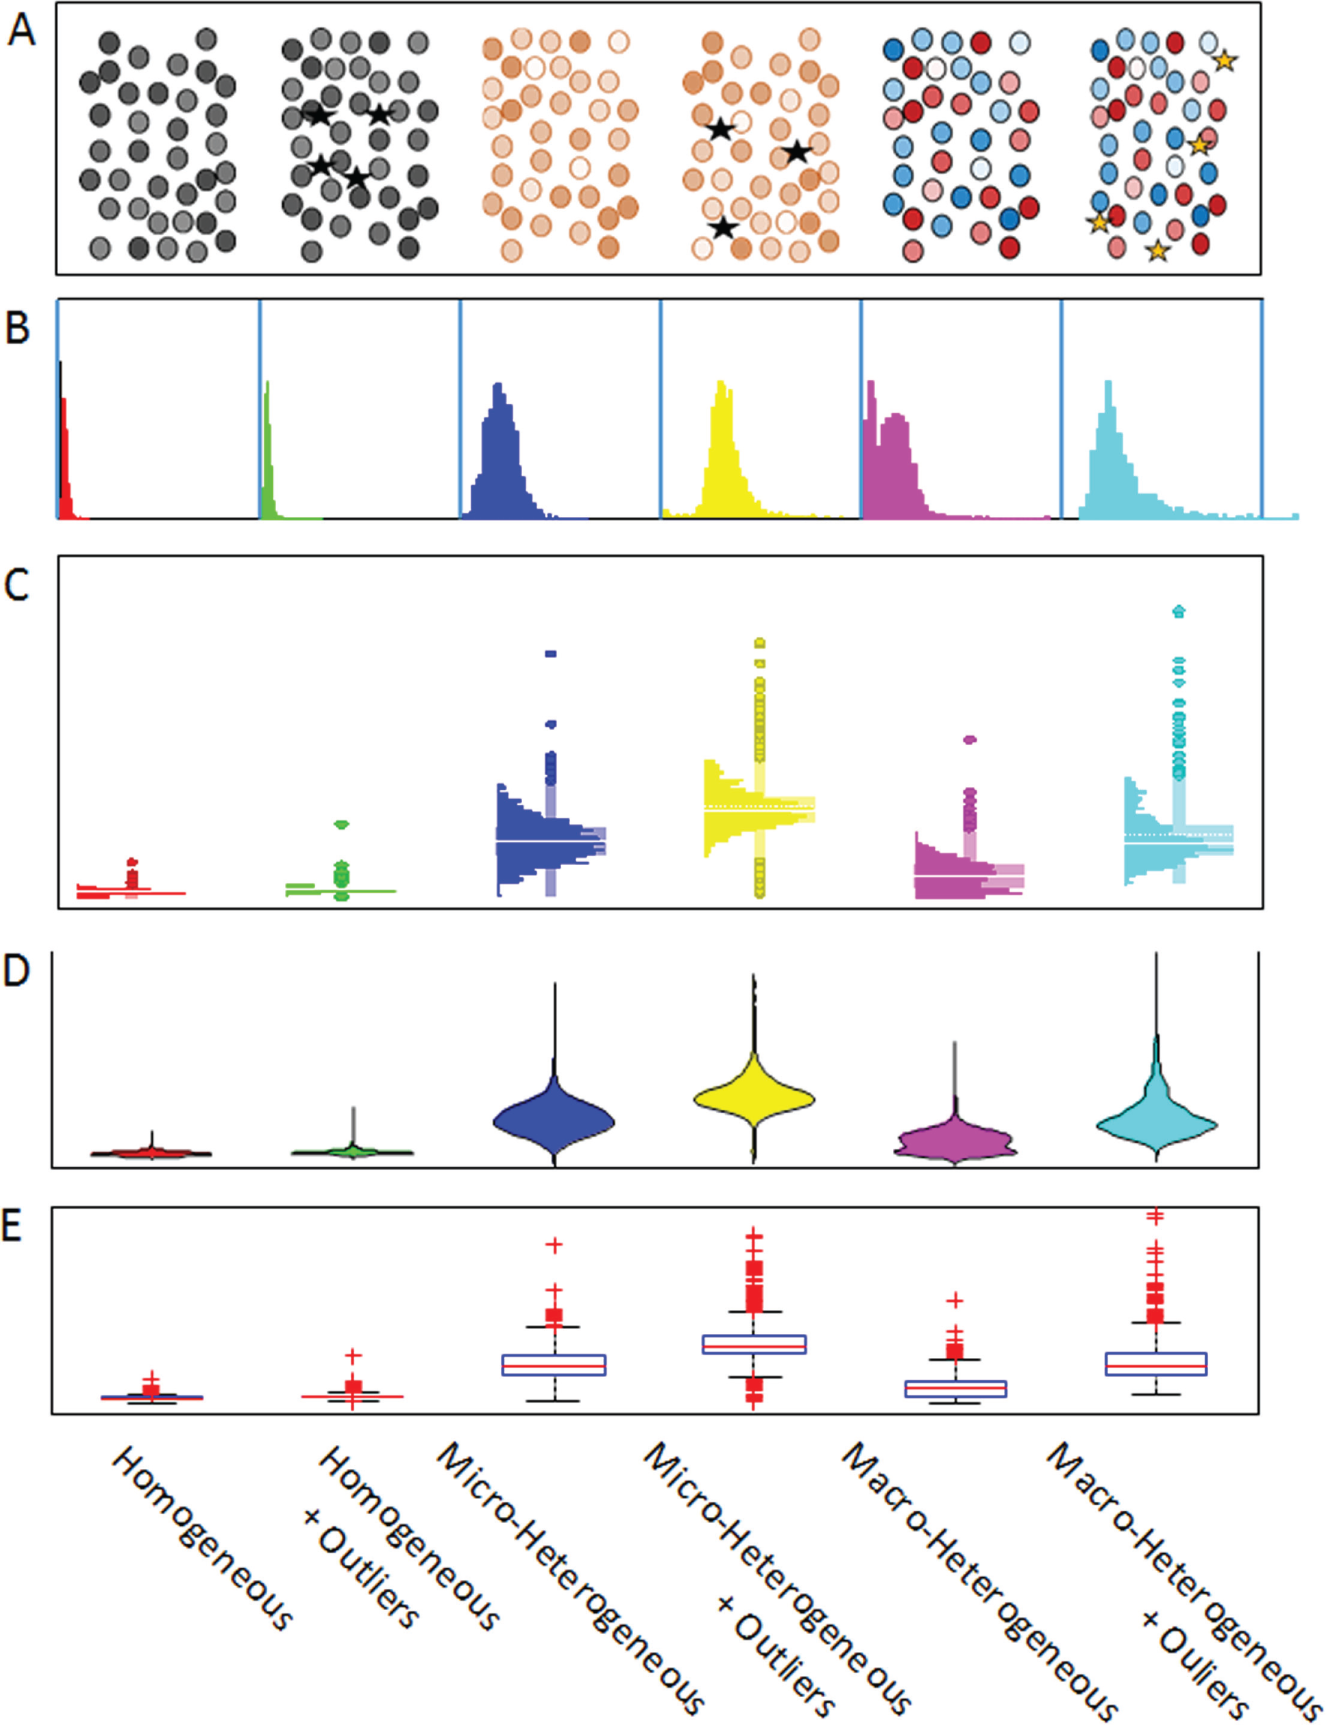
Visualization of patterns of heterogeneity in population samples. Patterns are described based on six general classes of heterogeneity on the horizontal axis. (
General-Purpose Informatics Tools
Currently, many general-purpose data analysis tools can be used to implement metrics and visualizations for heterogeneity analysis. Commercial software like Matlab (Mathworks, Natick, MA) and open-source software like R are programmable and provide large archives of user-contributed functions. In addition, some commercial programs like Spotfire (Tibco Software), primarily a data visualization tool with some statistical analysis functions, provide an interface for incorporating R or Matlab scripts into the analysis.4,37 Commercial statistical analysis packages such as SAS/JMP (SAS Institute, Cary, NC), SPSS (SPSS, Inc., an IBM Company, Chicago, IL), and Minitab (Minitab, State College, PA) all have many functions to characterize and visualize distributions of data.
Defining the development of tools for assessing heterogeneity is based on two needs. The first is that the resources described above are very powerful and flexible but generally require some training before using them. This makes for a high cost to adopt (in terms of effort required to analyze data), therefore limiting acceptance and general use by researchers. Second, they also become highly individualized solutions, resulting in numerous methods for quantifying heterogeneity, making comparisons across systems or studies difficult. In this regard, some universal definitions of heterogeneity and standard practices, such as the workflow in Figure 4 , will help develop a general appreciation of and consensus on when heterogeneity analysis is suggested or even required for interpreting an experiment.
Machine Learning: Clustering Data and Classifying Subpopulations
Although implicit in much of the discussion above, it becomes important at this point to recognize that heterogeneity results from multiple signaling or metabolic effects. 140 Generally, these may be measured at the same time, thus providing some opportunity to explore the complex influence of heterogeneity and interactions between networks and signals. In this regard, combining multiparameter experimental and computational methods with detailed analysis of heterogeneity is necessary to understand the highly dynamic mechanisms that control cell plasticity and fate. 141 Much of the work in this area incorporates methods for clustering and classifying multiparametric flow cytometry, HCS and transcriptional profiling data, and general methods for machine learning derived from ecology, business intelligence, and other fields. 142
Statistical measures such as KS distance can be used to quantitatively compare distributions of a single biomarker, for example, with respect to a reference distribution.143–145 Although each cell can be simply described using the levels of one or more biomolecules, the abundance of data collected from phenotyping experiments allows much more detailed descriptions. Often biomarker levels are transformed into derived features, thereby amplifying the separation between distinct subpopulations that are identified using machine learning approaches. Image data allow calculating higher moments (variance, skewness, etc.) of intracellular biomarker levels, as well as morphological features, including shapes of cellular compartments or standard texture features such as Haralick or Zernike features. 146 A cell that is imaged using three-channel immunofluorescence (IF) can easily be described as a vector of hundreds of derived features,61,68,147 and this space can be reduced using PCA, t-distributed stochastic neighbor embedding (T-SNE), or other methods.61,147–149 Subpopulations within the selected feature space can be identified by clustering using standard methods like K-means 150 or hierarchical agglomerative144,151 clustering or by fitting the data to distributions of known form, such as GMMs.61,88 Quantitatively defined cellular phenotypes are useful for training classifiers 15 and represent the first step toward constructing mechanistic models to explore the biochemical origins of heterogeneity.152–154
Application-Specific Tools
Many data acquisition systems such as flow cytometry, mass cytometry, and HCS come with advanced but proprietary tools for visualization and analysis of the data. In some applications, third parties provide additional commercial and open-source software tools. The establishment of standard metrics for heterogeneity would encourage manufacturers to incorporate those metrics into their proprietary software tools, facilitating the analysis. Meanwhile, open-source software presents the most immediate opportunity for integration of heterogeneity metrics. For flow cytometry, open-source data analysis tools include the BioConductor 155 packages iFlow 156 and OpenCyto, 157 as well as FlowCytometryTools, 158 a python package. For HCS data analysis, open-source options include Cell Profiler Analyst, 159 HCS-Analyzer, 160 KNIME, 161 and OMERO. 162 High dimensional data, such as that produced by mass cytometry and hyperplexed fluorescence imaging, present some unique challenges for visualization and heterogeneity analysis, for which tools are being developed, including viSNE, 163 which has been integrated into a workflow for discovery and characterization of cell subsets. 164
Current Application of Heterogeneity Analysis in Drug Discovery
Drug Discovery and Development
The development of disease-relevant models and assays begins with the analysis of disease and normal patient samples to identify suitable biomarkers and assay readouts, as well as to characterize the organization and heterogeneity profiles of the selected biomarkers. Physiologically relevant models of the disease state, such as 3D tissue models and organs-on-chips, should recapitulate the architecture of the normal and disease tissues, including multiple cell types, which optimally will also recapitulate the tissue heterogeneity. 6
In a screening campaign to identify compounds for drug development, heterogeneity indices (HIs) would then be reported alongside the compound potency and assay performance statistics, including a heterogeneity QC metric, flagging compound concentrations that exceed thresholds established during assay development, indicating significant heterogeneity in the response. In drug development, compounds exhibiting macro-heterogeneity would need to be further studied, perhaps starting with histo-box plots for the dose series. Compounds exhibiting heterogeneity within a defined population (e.g., subpopulation of cells targeted for therapy development) present two options: (1) deprioritize in favor of compounds that modulate the cell population more uniformly or (2) select the compounds with complementary efficacy in subpopulations for use in a combination therapy strategy. The objective of monitoring heterogeneity in secondary assays should be to make more informed decisions in selecting compounds to advance through drug development by identifying potential differences in mechanism of action (MOA) among lead compounds. To the latter point, the distribution of cell responses affects the interpretation of drug activity.
The objective of phenotypic drug discovery is to identify compounds that can revert the disease phenotype to the normal phenotype. These clinical phenotypes are represented in the assay by the negative and positive control samples, respectively. Profiling the changes in the distributions with compound treatment in a screen provides insight into the MOA. This is illustrated in Figure 6A , B , where the concentration response profiles for the inhibition of STAT3 activation by pyridone-6 (a pan kinase inhibitor) and Stattic (an SH2 binding domain inhibitor) are different, consistent with their different MOA.
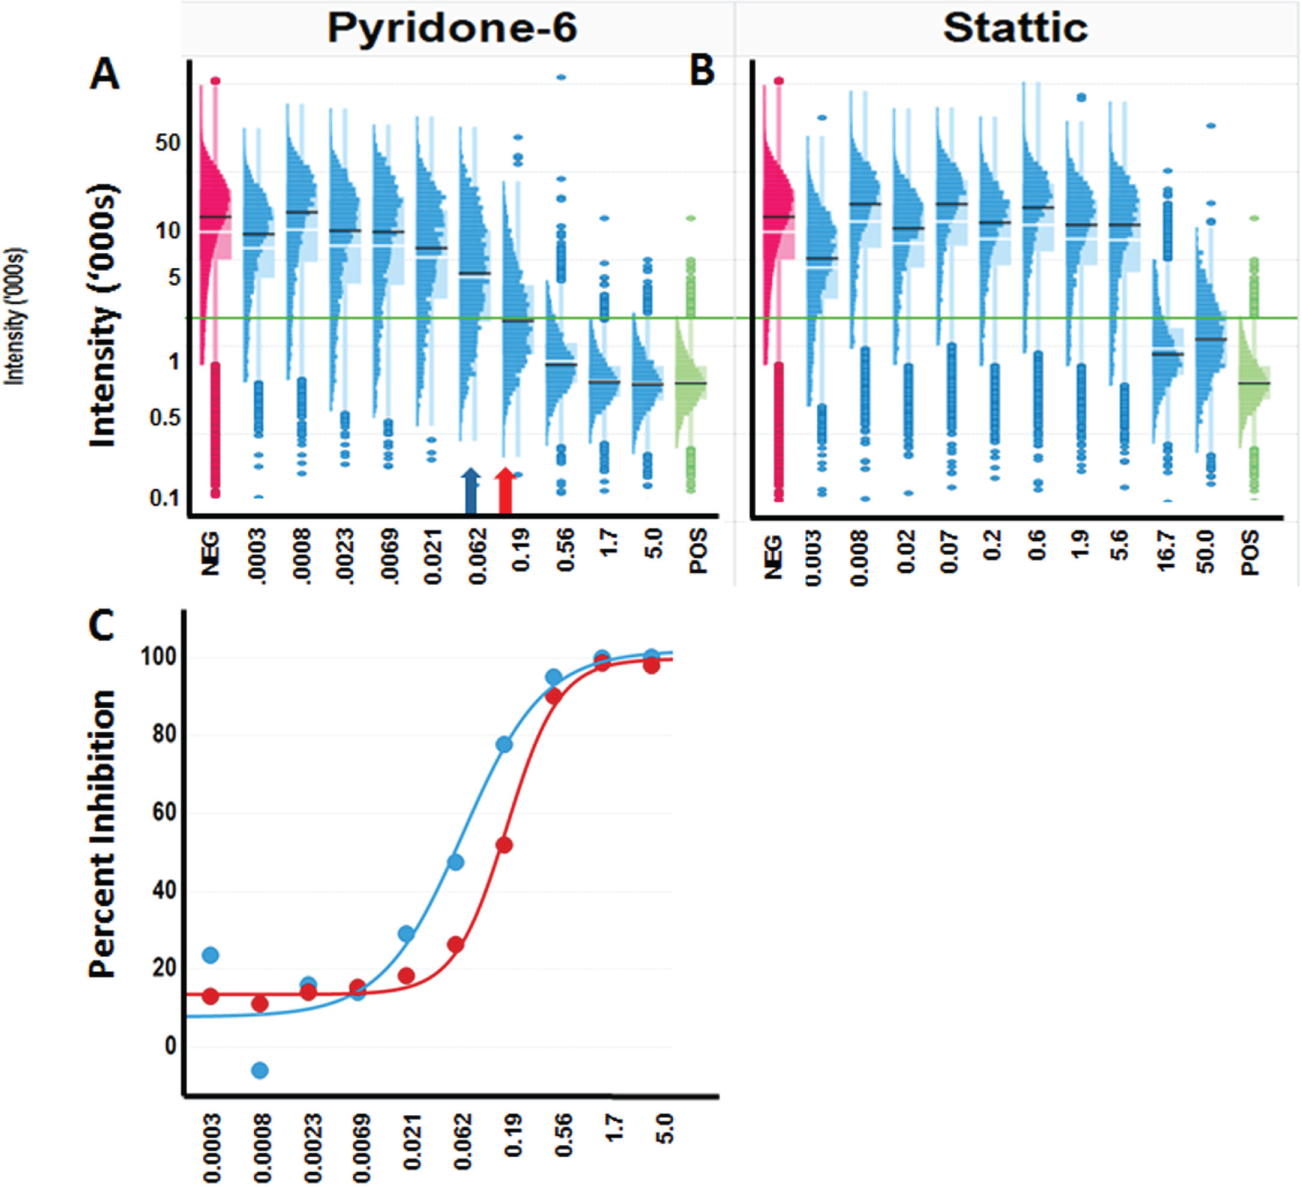
The shape of a dose-response curve can be influenced by the underlying distributions of measurements at each dose. The distinctive transitions in the populations may indicate different biological processes. (
Analysis of the distributions in response is also important in establishing an optimal assessment of compound activity. If the goal of the screen is to identify compounds that bring the population to a state equivalent to the positive control, then the distribution of the positive control should be used to establish relevant criteria for identifying cells that have reached that state. For example, cells within 3 SDs of the mean positive control response could be classified as positive. It is usually assumed that the IC50 derived from the population average measures indicates the concentration at which the population has been induced (or inhibited) halfway to the positive control state. IC50s calculated on well-averaged data represent the point at which the signal drops 50% between the negative and positive controls. This calculation does not indicate if the signal in all of the cells was reduced by 50% (which would be a homogeneous response) or, for example, if all of the signal in only half of the cells was reduced (which would be a heterogeneous response). Cell-level analysis allows for the detection of heterogeneity and an assessment of when 50% of the cells have reverted to the positive control state (such as within 3 SD of the positive control population). The blue arrow in Figure 6A indicates the IC50 calculated using the well-averaged signal, and the red arrow indicates the point at which 50% of the cells have reached the positive control state. This calculation considers heterogeneity in cell response. As shown in Figure 6C , analysis of the pyridone-6 dose dependence of the distribution of cells revealed that the concentration required to induce half of the cells into the positive control state (red curve), which may be a more relevant measure of the IC50, is 2- to 10-fold higher than the population-averaged IC50 (blue curve). Furthermore, the degree of rightward shift from the population-averaged IC50 can vary depending on the complexity of the transition profile. In the case of Stattic, the steep dose response leads to similar results for the average and the percent inhibited, while shallower curves result in a significantly greater differential.
Finally, it is important to follow the heterogeneity profile while investigating the SAR in the lead optimization stage to ensure that changes in the compound structure do not introduce additional or undesirable heterogeneity in the response, implying altered mechanisms of action. Furthermore, the heterogeneity profile can provide a more sensitive determination of changes in compound potency and therefore be used in combination with traditional measures of potency to help drive the SAR of a lead series toward a “normal” profile. 4
Insights from Heterogeneity Analysis on Basic Biomedical Research and Drug Discovery
Cellular heterogeneity arises from biological networks and therefore provides insights into the network connectivity that can be used to guide selection of biomarkers.9,165 Observations of individual cell behavior also provide information about the role of heterogeneity in cell differentiation, an essential component of tumor evolution, 166 as well as the transition from normal to disease cellular states.88,166 Neglecting cell heterogeneity can lead to errors in disease classification. 166 When combined with computational models, the analysis of cell heterogeneity can be used to predict the responses of subpopulations of cells to drugs (e.g., cancer therapies).9,61,65,167 For example, Johnston et al. 168 demonstrated using HCS that patient-specific and cell type–specific differences in the response of primary breast epithelial cell subpopulations to ionizing radiation were correlated with gene function. Furthermore, an analysis of fluctuations in the disease proteome, together with targeting of the proteins that contributed the most to the heterogeneity within a population, has been used to design combination therapy strategies. 169 These and other insights gained from heterogeneity analysis are expected to lead to a better understanding of the biology of disease and the design of more effective therapies.
Current Applications of Heterogeneity Analysis for Computational Pathology
Digital Pathology Enables Quantitative Analysis of Heterogeneity
Digital pathology typically uses transmitted light and/or fluorescence imaging for a comprehensive assessment of heterogeneity in tissues at the cellular and subcellular levels.20,21,91 Recently, however, there has been increasing application of IMS to imaging tissue sections.98,107,110 Subcellular resolution permits the identification of the activation state of specific biomarkers, such as translocation of transcription factors into the nucleus. 5 In one study, quadratic entropy was used as a measure of diversity, called the HetMap, based on the pathologist’s scoring of individual cells in regions of interest in the tissue. 76 The HetMap was shown to be correlated with discordant scoring between pathologists and therefore useful to identify more complex tissues that required more detailed analysis. However, the dependence on manual cell scoring limited the extent of the regions that could be analyzed and the objectivity of the analysis. Digital pathology enables a more objective and comprehensive assessment of heterogeneity in the tissues 20 and has been used to identify population and spatial heterogeneity in the overall abundance or activation of biomarkers, 170 as well as various microenvironment components, including immune cells. 19
Importance of the Spatial Aspect of Heterogeneity in Tissue
For many malignancies, molecular and cellular heterogeneity is a prominent feature among tumors from different patients, between different sites of neoplasia in a single patient and within a single tumor. 171 Intratumor heterogeneity involves phenotypically distinct clonal cell subpopulations and distinct cell types that comprise the tumor microenvironment (TME) or “tumor tissue system,” including local and bone marrow–derived stromal stem and progenitor cells, subclasses of immune inflammatory cells that are either tumor promoting or tumor killing, cancer-associated fibroblasts, endothelial cells, and pericytes.4,22,172,173 The TME can be viewed as an evolving ecosystem where cancer cells engage in heterotypic interactions with these other cell types and use available resources to proliferate and survive.72,74 Consistent with this perspective, the spatial relationships among the cell types within the TME (i.e., spatial heterogeneity) appear to be one of the main drivers of disease progression and therapy resistance.73,75,174 Thus, it is imperative to define the spatial heterogeneity within the TME to properly diagnose the specific disease subtype and identify the optimal course of therapy for individual patients.
Intratumor heterogeneity has been explored using three major approaches. The first approach is to take multiple core samples from specific regions of tumors and measure population heterogeneity within each core and spatial heterogeneity among the cores. The specific analyses include whole-exome sequencing,175–179 epigenetics, 180 proteomics,11,181 and metabolomics. 11 The second approach involves “single-cell analyses” using the above methods,182,183 RNASeq, 33 microscope imaging, 57 or flow cytometry 184 following separation of the cells from the tissue. The third approach uses the spatial resolution of light microscope imaging or IMS, coupled with molecular-specific labels, to capture the spatial context of biomarkers in the cells.21,22,185,186
Heterogeneity and Application of Image Statistics
A major challenge in digital pathology is to develop algorithms that quantify key spatial relationships (interactions or lack thereof) within the TME, based on images of panels of biomarkers. Figure 7A illustrates the spatial heterogeneity of cancer cells and stromal cells, including the migratory immune cells, within a tumor. Indeed, the spatial organization of cancer and noncancer cells in the TME has been hypothesized to be an important diagnostic 187 in addition to the expression level of the selected biomarkers.
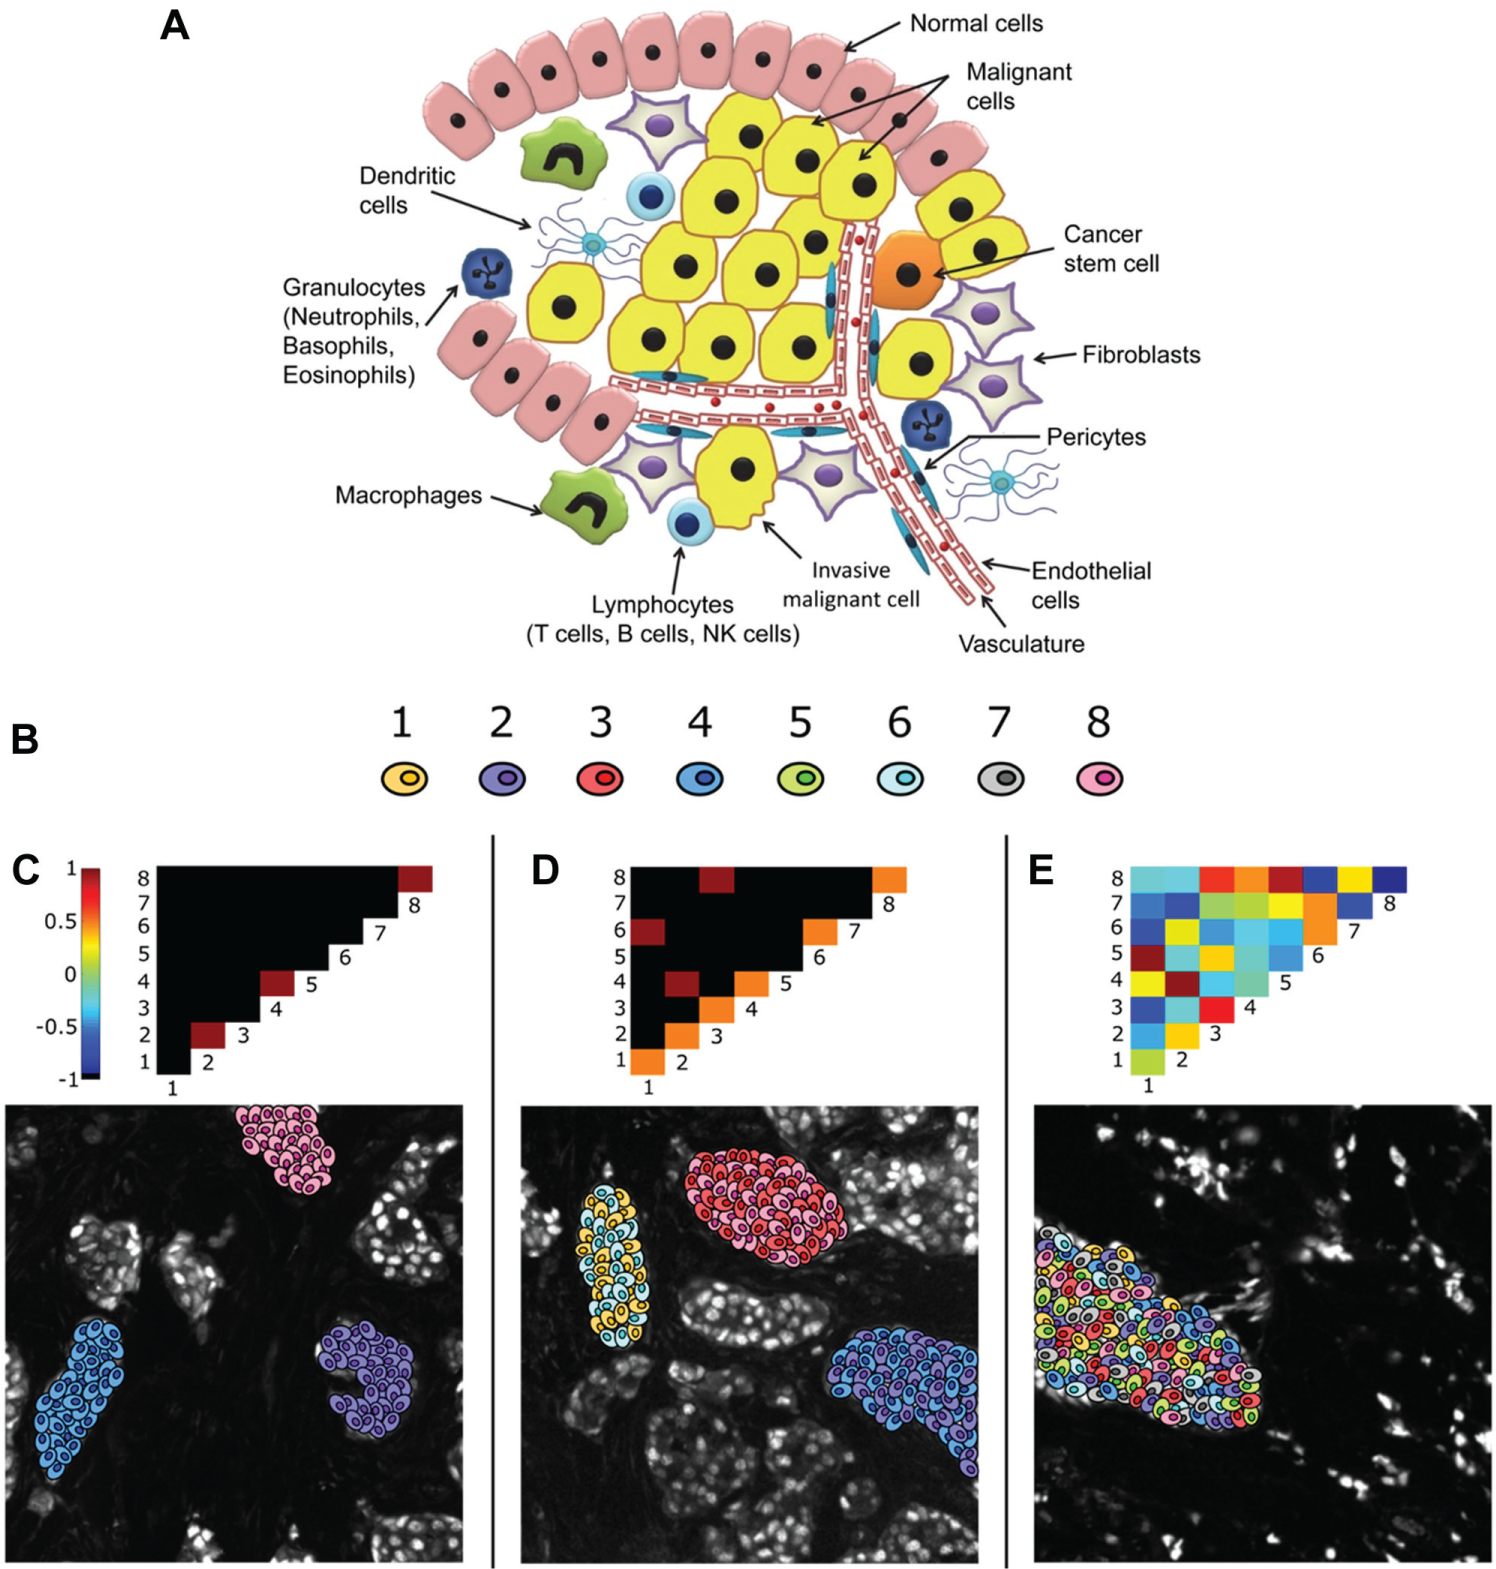
Canonical pointwise mutual information (PMI) maps depicting various forms of spatial intratumor heterogeneity. (
To address this challenge, a method was developed to quantify intratumor spatial heterogeneity ( Fig. 7B–E ) of a single biomarker, as well as multiplexed or hyperplexed biomarkers. The method learns a set of dominant biomarker intensity patterns and maps the spatial distribution of the patterns with a network. The pairwise association statistics for the patterns are described using PMI188,189 and visually represented as a 2D heat map. PMI is generalizable to spatial data from other in situ methods such as FISSEQ 190 and CyTOF 93 that sample multiple markers within the TME.
Other methods applied to the characterization of heterogeneity in tumors have used region of interest sampling but without a network-based approach or taking advantage of multiplexed data, 76 have characterized multiplexed cell phenotype associations within the tumor but not the underlying spatial organization, 9 or have analyzed linear relationships between biomarkers in multiplexed/hyperplexed IF data without considering nonlinear associations or spatial information. 191 The PMI method uses both the expression and spatial information of an entire tumor tissue section and/or spot in a TMA to characterize spatial associations of both major and minor subpopulations as a 2D heterogeneity map. The characterization of intratumor spatial heterogeneity by the PMI is expected to become an important diagnostic biomarker for cancer progression, proliferation, and response to therapy and to uncover key interactions in the TME that contribute to disease proliferation and progression. 21
Insights from Spatial Heterogeneity Analysis in Pathology Samples
Non-cell-autonomous interactions often govern cell fate decisions and consequently play a major role in complex biological processes.72,74 Spatial heterogeneity reflects these heterotypic signaling and extracellular matrix reorganization networks. Given the role that TME interactions have in tumorigenesis and metastasis, it may well be expected that spatial genetic heterogeneity can be correlated with poor long-term patient outcome, as exemplified in HER-2–positive breast cancer. 73 Several groups have developed computational strategies to infer spatial reconstruction of single-cell RNAseq data from dissociated cells by integrating single-cell expression data with in situ RNA patterns in developing mouse and zebrafish embryos.192–194 By integrating these computational strategies with combinatorial fluorescence in situ hybridization approaches such as SeqFISH and MERFISH,195,196 it may be possible to spatially reconstruct single-cell data derived from tissues such as tumors where, in contrast to embryos, there is no guarantee of reproducible spatial patterning.
Despite the valuable information that can be generated from these powerful approaches focused on single-cell analysis, they cannot account for perturbation of the signaling state of an individual cell or a biased recovery of specific cell types during single-cell dissociation from bulk tissue. In addition, analysis of cell lysates precludes resolution of subcellular spatial heterogeneity of RNAs and proteins and their associated complexes and networks. Platforms that integrate optical or mass spectrometry imaging with subcellular resolution have great potential to connect spatial and population heterogeneity with cell state, function, and communication.77,92,93,197 These in situ approaches are compatible with FFPE biopsies and represent transformative computational pathology platforms aimed at optimizing diagnosis and treatment for individual patients.
Outlook for Heterogeneity Analysis in Biomedical Research
Basic Biology
The presence of heterogeneity in biological systems has been demonstrated and discussed in many publications, but the functional roles for heterogeneity are just beginning to be elucidated. As an example, recent technological advances in lineage tracing and specific subpopulation ablation, using inducible genetic labeling198,199 in conjunction with in vivo imaging, 200 have provided evidence for the role of dynamic cell population heterogeneity in the regulation of cell fate decisions intrinsic to processes, including differentiation, proliferation, and tumorigenesis.3,17,71,72 Hyperplexed measurements with single-cell resolution using flow cytometry (e.g., transcriptome profiling, mass cytometry 201 ) coupled with machine learning algorithms have been used to circumvent averaging artifacts of bulk population measurements (i.e., Simpson’s paradox 125 ), enable the reconstruction of complex cellular hierarchies of differentiation, reveal rare cell states, and identify novel regulators.113,127
Pluripotent stem cells are a platform with tremendous potential for the development of patient-specific disease models, for modeling biological development, and for regenerative medicine. However, stem cells exhibit heterogeneity on several levels: in the functional capacity to differentiate, in messenger RNA (mRNA) expression profiles, and in epigenetic and genetic states. 202 Studies of differentiating stem cells have found that heterogeneity reflects the presence of an evolving mixture of phenotypically distinct subpopulations, consistent with a hypothesis that differentiating cells transit through multiple robust and discrete phenotypic states.66,88,203 Improved understanding and manipulation of the differentiation of stem cells require tools to reliably characterize and monitor the evolution of these subpopulations and their associated phenotypes.
The maintenance and repair of cycling adult tissues usually rely on the turnover of a small population of adult stem cells that possess the ability to self-renew, giving rise to differentiated progeny while maintaining their number.3,204,205 Tissue homeostasis can be achieved only when the rates of stem cell proliferation and differentiation are balanced. Fate asymmetry can occur at the level of a single stem cell involving asymmetric segregation of fate determinants during cell division, leading one cell to follow a differentiation pathway and the other to stay in the stem cell compartment.3,204 Alternatively, fate asymmetry can be achieved at the population level where differentiation of one stem cell is compensated for by the symmetric division of a neighboring stem cell.3,204 In this case, it is only the population that persists, whereas the life span of any individual stem cell is not defined. Although either of these alternative models can be induced by intrinsic and extrinsic factors, each nevertheless suggests distinct regulatory mechanisms and therefore a need to identify and monitor these subpopulations of cells.3,205
Recent studies of intestinal maintenance, 206 mammalian spermatogenesis, 207 and hair follicle cycling 208 employing genetic lineage tracing and in vivo imaging suggest a more flexible organization in which long-term self-renewal potential, fate, and proliferative activity may be modulated by location within specific microenvironments (e.g., stem cell niche) and by dynamic changes in transcriptional activity that are often induced epigenetically.3,198,205,209,210 In this model, stem cells form a dynamically heterogeneous pool in which cells may transfer reversibly among states of variable survival and fate potential.3,205 In addition, progenitors that are normally committed to differentiation may reacquire (through dedifferentiation) long-term self-renewal potential following exposure to niche factors. Such flexibility may strengthen the resilience of tissues to crisis and injury, enabling the population of differentiating progeny to function as a stem cell reserve.3,205 Thus, the heterotypic signaling between stem cells and the niche, likely to be symbiotic, 204 indicates the important regulatory role of spatial heterogeneity in tissue homeostasis. 205 Several studies also suggest a reversible transfer of stem cells between an active and quiescent state. 3 This manifestation of dynamic heterogeneity may provide a robust mechanism to maintain a stem cell pool such that the overall turnover rate of the tissue is steady but slow, particularly in the context of aging. 3 Perhaps equally important, a dormant state within a cycling tissue may provide an insurance mechanism to protect the wider population from the stressful demands of active cell cycling, ensuring the long-term integrity of the tissue. 3 Such behavior would mirror the strategy of phenotypic switching observed in bacterial populations. 211
Study of Cell Signaling Networks/Pathways
Throughout this perspective, a recurring theme has been that heterogeneity both reflects and influences cellular networks and therefore encodes a wealth of basic biological information that can be extracted with systems modeling techniques. Only recently has there been a definitive push to understand phenotypic heterogeneity through systems modeling, revealing the role of “noise” and cell-to-cell variability in cellular systems organization.212,213 Mechanistic models 214 that represent the chemical underpinnings of the cell are easy to interpret in terms of basic molecular principles, but the trade-off for these insights is the effort required to assemble and parameterize them.215,216 Simply identifying the correct network topology poses a challenge, as network topology may vary by cell type 217 and inconsistencies exist among curated databases of molecular interactions. 218
Computational modeling studies have shown that phenotypic heterogeneity in apoptosis is more dependent on extrinsic factors, rather than from intrinsic differences in cells.213,219,220 Modeling also suggests that spatial heterogeneity influences tumor aggression. Heterogeneous environments may provide safe havens within which resistant tumors can flourish, 221 and spatial heterogeneity promotes immunosuppressive signaling in the TME. 222 Incorporating heterogeneity into models of cell signaling networks will be a key to understanding the details of how specific pathway activity drives cellular heterogeneity and how heterogeneity affects the regulation of the network.
Drug Discovery—Example of Cancer
Darwinian-like clonal evolution in tumors significantly contributes to the observed phenotypic diversity,7,75,173 as do epigenetic changes7,75,153 and heterotypic signaling in the TME.173,223 This diversity and plasticity present a major challenge to the development of therapeutic regimens, as the targeting of a predominant tumor subpopulation often only provides transient benefit that will inevitably result in the emergence of resistant populations and relapse. 224 However, recent studies suggest that knowledge of the tumor composition and the response of heterogeneous subpopulations to single drugs, in conjunction with computational and experimental modeling, can identify drug combinations that minimize the outgrowth of resistant subpopulations in tumors while enhancing tumor-free survival in mice.225,226 Importantly, the experimentally validated simulations demonstrated that the prediction of the optimal drug combination required the analysis of multiple tumor subpopulations, not just a particular subpopulation. Over time, the role of these models in developing treatments will increase, and the “one target one drug” paradigm will be replaced by strategies driven by quantitative systems pharmacology (QSP), where development is focused on rationally designed drug combinations.6,227
Precision Medicine—Example of Cancer
Intratumor genetic heterogeneity 171 and its region-specific diversity,175,179 reflecting genetic instability as an acquired hallmark of cancer, 173 have been well studied. Darwinian forces of evolution, however, act on heritable phenotypes and not genotypes per se. 72 Although historically challenging to study in patients, recent studies employing genetic models and novel in situ single-cell imaging methods have begun to shed light on phenotypic heterogeneity that arises from environmental selection pressures in the tumor.73,75 Positive interactions among distinct clonal subpopulations have been observed and can be thought of as one of the major drivers of persistent intratumor heterogeneity.74,228 These types of collaborative interactions support the possibility that instead of a clonal population accumulating all the necessary mutations that enable it to acquire the hallmarks of cancer, a time-consuming and inefficient process, several cooperating partially transformed subclones may circumvent full transformation and thus accelerate tumor progression.72,229 In situ single-cell analysis of primary tumors of HER-2–positive breast cancer patients receiving neoadjuvant chemotherapy indicated a therapy-induced spatial heterogeneity among clones that was associated with shorter disease-free survival following adjuvant therapy with trastuzumab. 73 In contrast, no such association was evident when the fraction of cells harboring resistance-conferring mutations (i.e., PIK3CA) or the overall cellular diversity changes before and after neoadjuvant treatment was considered. 73 Because long-term survival is largely defined by progression to metastatic disease, these results imply a potential role for spatial heterogeneity in the TME in selecting treatment-resistant cancer cells capable of migration and metastatic dissemination. 73
The results of the above study suggest that neoadjuvant chemotherapy prior to HER-2 targeted therapy may be contraindicated as it might promote treatment resistance. Furthermore, this study suggests the potential benefit of implementing in situ single-cell hyperplexing technologies with subcellular resolution77,92,93 in conjunction with machine learning algorithms as a powerful diagnostic platform to identify targetable tumor dependencies resulting from heterotypic signaling networks (e.g., positively cooperating subclonal populations). 73 Thus, knowledge of functional phenotypic heterogeneity, in contrast to simply genetic heterogeneity, could be exploited to guide the design of precision therapeutic strategies.
Footnotes
Acknowledgements
We acknowledge the discussions with members of their laboratories, as well as other colleagues who influenced our thinking about heterogeneity.
Declaration of Conflicting Interests
The authors declared no potential conflicts of interest with respect to the research, authorship, and/or publication of this article.
Funding
The authors disclosed receipt of the following financial support for the research, authorship, and/or publication of this article: This work was supported in part by funding from the University of Pittsburgh Cancer Institute (2P30 CA047904), the State of Pennsylvania (4100068731), and the National Institutes of Health (5UH3TR000503).