
Abstract
SnO2 is a wide-band gap N-type semiconductor material with a higher electron transfer rate than TiO2. Therefore, SnO2 has broad application prospects in the photoanode composite materials of dye-sensitized solar cells (DSSC). In this study, SnO2–TiO2 composite nanofibers with different molar ratios (5%, 10%, 15%, and 20%) were prepared by double-needle electrospinning technology, and the nanofibers were characterized after adjusting the solution composition. Different molar ratios of TiO2 and SnO2–TiO2 composite nanofiber photoanodes were fabricated by spin-coating, and the adsorption behavior of dyes on the photoanodes was investigated. Moreover, the electrochemical impedance of the photoanodes and DSSC and their photoelectric performance were also tested. The experimental results showed that SnO2–TiO2 composite nanofibers with a molar ratio of 10% exhibited excellent properties, including a peak specific surface area of 93.01 m2/g, strong dye adsorption capacity, small interfacial resistance, and fast electron transfer rate. These outstanding properties significantly promoted the generation of photoelectrons and improved the photoelectric conversion efficiency of DSSC. Compared with single-component TiO2, the photoelectric conversion efficiency of SnO2–TiO2 nanofiber photoanode composite material improved by 85.65%.
Keywords
Introduction
As scientific and technological advancements continue to propel the growth of portable electronics, there is an increasing demand for more portable, energy-efficient, and environmentally friendly energy solutions. 1 Solar energy, with its characteristics of renewability and environmental friendliness, has emerged as a viable alternative to traditional energy sources. In 1991, the introduction of dye-sensitized solar cells (DSSC) marked a significant step forward. 2 Owing to their straightforward fabrication process, accessibility of raw materials, long lifespan, unique flexible structure, and excellent deformability, DSSC not only satisfy the requirements of general electronic devices but also offer superior energy solutions for specific electronics. 3 The energy conversion efficiency and stability during operation are key determinants of a solar cell’s performance. Consequently, researchers are incessantly striving to enhance these aspects of DSSC, with a particular focus on improvements to the electrode, 4 sensitizing dye, 5 photoanode, 6 and electrolyte. 7
Being a novel type of thin-film cell, DSSC offers ease of production and cost-effectiveness. Numerous studies have been conducted to optimize their components. Given that photoanodes host dye molecules and facilitate electron transport, enhancing the photoanode material could potentially augment the photoelectric conversion efficiency of DSSC.8,9 Titanium dioxide (TiO2) is frequently employed in the fabrication of photovoltaic electrodes due to its negligible toxicity, chemical stability, and large specific surface area, which allows superior contact with an elevated quantity of dye molecules.10–14 Owing to its band gap value of 3.20–3.22 eV, TiO2 exhibits an enhanced electron injection rate and reduced charge recombination, thereby directly impacting the photoelectrochemical properties of DSSC. 15 TiO2’s properties can be modified via three primary strategies: band gap narrowing, oxygen vacancies for recrystallization, or the incorporation of impurity energy levels.16–19 Typically, this is achieved through either size-controlled synthesis or doping with TiO2 lattice dopants, including metallic and non-metallic ions. For instance, Kumaravel et al. 20 demonstrated that doping Mo6+ ions into TiO2 induces the formation of oxygen vacancies, resulting in the reduction of Ti4+ and Mo6+ ions and the introduction of additional energy levels in the band gap, thereby enhancing photocatalytic activity. Likewise, Bramhankar et al. 21 prepared TiO2 co-doped with Ni2+ and Zn2+ ions and optimized their concentrations to boost the electron injection efficiency by narrowing the energy band gap and lowering the CB edge. It is apparent that judicious bandgap engineering can effectuate significant changes in DSSC’s operation mechanisms. A study by Chang et al. 22 indicated that ZnO and TiO2 composites exhibit superior photoelectric conversion efficiency than TiO2 alone. Moreover, SnO2 (a broad-bandgap N-type semiconductor material) has been identified for its large bandgap and higher electron transfer rate than TiO2.23–26
Applications of SnO2 and TiO2 in photoanodes have been extensively researched, employing a variety of methodologies.27–32 In 2017, Abdalla et al. 33 demonstrated enhanced light harvesting and reduced interfacial electron recombination by treating SnO2-based photoanodes with TiCl4. The fabricated DSSC shows increased short-circuit current density (JSC) and open-circuit voltage (VOC), yielding a higher power conversion efficiency (PCE) than that of DSSC based solely on SnO2. In 2019, Wang et al. 34 crafted sea urchin-like SnO2/TiO2 composite microspheres with a dual hollow structure. A DSSC consisting of SnO2@Air@TiO2 microspheres (SATS) and P25 exhibited a higher photoconversion efficiency of 6.77%. The enhanced photovoltaic performance of SATS-based DSSC primarily results from the synergistic effect of the unique sea urchin-like dual hollow microstructure and the SnO2/TiO2 composite.
Loryuenyong et al. 35 prepared SnO2-doped TiO2 composite films augmented with reduced graphene oxide (RGO) using a hydrothermal method. The integration of RGO with SnO2 can lower the band gap, prevent agglomeration, and improve SnO2 dispersion. Efficiency tests of the resulting photoanodes demonstrated that even a small amount of RGO can significantly influence DSSC performance. Javed et al. 36 fabricated TiO2 nano-hexagonal arrays (TNHAs) using the anodizing method. Soaking these structures in a potassium stannate (K2SnO3) solution deposits SnO2 nanoparticles onto the TiO2 surface. The PCE of the DSSC based on SnO2/TNHAs is 6.43%, marking a 1.34-fold increase over the PCE of pure TNHAs. Bakr et al. 37 synthesized SnO2–TiO2 composite nanofibers by electrospinning and annealing a polymer solution containing picomolar concentrations of tin chloride and titanyl precursors. These nanofibers exhibit higher conduction energy than SnO2 and superior conductivity to TiO2, suggesting advantageous properties for their use as DSSC photoanodes. Xie et al. 38 synthesized SnO2/TiO2 composite hollow microspheres with a hierarchical structure via a one-step hydrothermal method. The resulting microspheres, having a large specific surface area, are used as the scattering layer of a DSSC to yield a high photoelectric conversion efficiency of 8.7%, a figure 28.1% higher than that of a bare nanocrystalline TiO2 base (6.79%). Nurrisma Puspitasari et al. 39 synthesized TiO2 particles via the coprecipitation method, concurrently incorporating SnO2 nanoparticles to act on the photoanode. The PCEs of the TiO2-based photoanode and the SnO2-based photoanode are 0.05% and 0.022%, respectively.
Considering current research trends both domestically and internationally on the amalgamation of SnO2 and TiO2,40–44 utilizing hydrothermal methods and electrospinning techniques to prepare microsphere and shell structures is a promising strategy for synthesizing SnO2–TiO2 composites. In this study, we prepare SnO2–TiO2 side-by-side composite nanofibers by double-needle electrostatic spinning technique. This approach allowed us to exploit the fast transfer characteristic of SnO2 and the heterojunction interface of SnO2/TiO2 concurrently, and to explore the influence of the two components’ ratio on DSSC performance.
In this article, SnO2–TiO2 side-by-side composite nanofibers with different molar ratios are prepared using a dual-needle electrostatic spinning technique. By testing different components of SnO2–TiO2 composite nanofibers, the group with the best photovoltaic conversion efficiency is found to be used as a photoanode to assemble flexible dye-sensitized solar cells. The solar smart garment is simulated using Marvelous Designer software to integrate the solar cells into the smart garment to provide the required energy for the heart rate detector, heating pads, USB interface, and other energy-consuming components in the smart garment through a series of boosting and regulating modules.
Experimental Section
Materials
Ethanol (C2H6O) and N,N-dimethylformamide (DMF) were sourced from Tianjin Fengchaun Chemical Reagent Co. Ltd. Lithium perchlorate (LiClO4) was procured from Aladdin Reagent (Shanghai) Co. Ltd. Polyvinylpyrrolidone (PVP, average molecular weight 1 300 000), tetra butyl titanate (C16H36O4Ti), glacial acetic acid (C2H4O2), nano-titanium dioxide (TiO2), iodine (I2), acetonitrile (C2H3N), N719 dye (C58H84N8O8RuS2), tin tetrachloride pentahydrate (SnCl4·5H2O), and titanium tetrachloride (TiCl4) were purchased from Shanghai Macklin Biochemical Co. Ltd. FTO conductive glass (square resistance of 6–8 Ω) and heat sealing film were obtained from Liaoning Yingkou Optima New Energy Technology Co. Ltd. All reagents used in the experiments did not require further purification.
Preparation of Fiber
Preparation of Homogeneous Spinning Solution
Polyvinylpyrrolidone (PVP, 1.016 g) was mixed with ethanol (6 mL) and stirred for 1 h to obtain Solution 1. In another vessel, ethanol (3 mL), glacial acetic acid (3 mL), and tetrabutyl titanate (1.5 mL) were mixed and stirred for 15 min to obtain Solution 2. Solution 1 and Solution 2 were then combined and stirred for 4 h to obtain a homogeneous PVP spinning solution containing tetrabutyl titanate. 45 Then, a 7 wt% monolithic PVP solution and ethanol (6 mL) were mixed and stirred for 1 h until completely blended to obtain Solution 3. In another mixture, ethanol (3 mL), N,N-dimethylformamide (DMF, 3 mL), and tin tetrachloroferric acid pentahydrate (SnCl4–5H2O, 1.55 g) were stirred for 15 min to obtain Solution 4. Then, Solution 3 and Solution 4 were mixed and stirred for 2 h to obtain a homogeneous PVP spinning solution containing SnCl4–5H2O. The spinning solution preparation process is shown in Figure 1(a). These solutions were used to configure nanofiber spinning solutions with 0%, 5%, 10%, 15%, and 20% molar percentages of SnO2 in SnO2–TiO2, labeled F-TiO2, F-5%, F-10%, F-15%, and F-20%, respectively, and designed for a PVP content of 7 wt%.
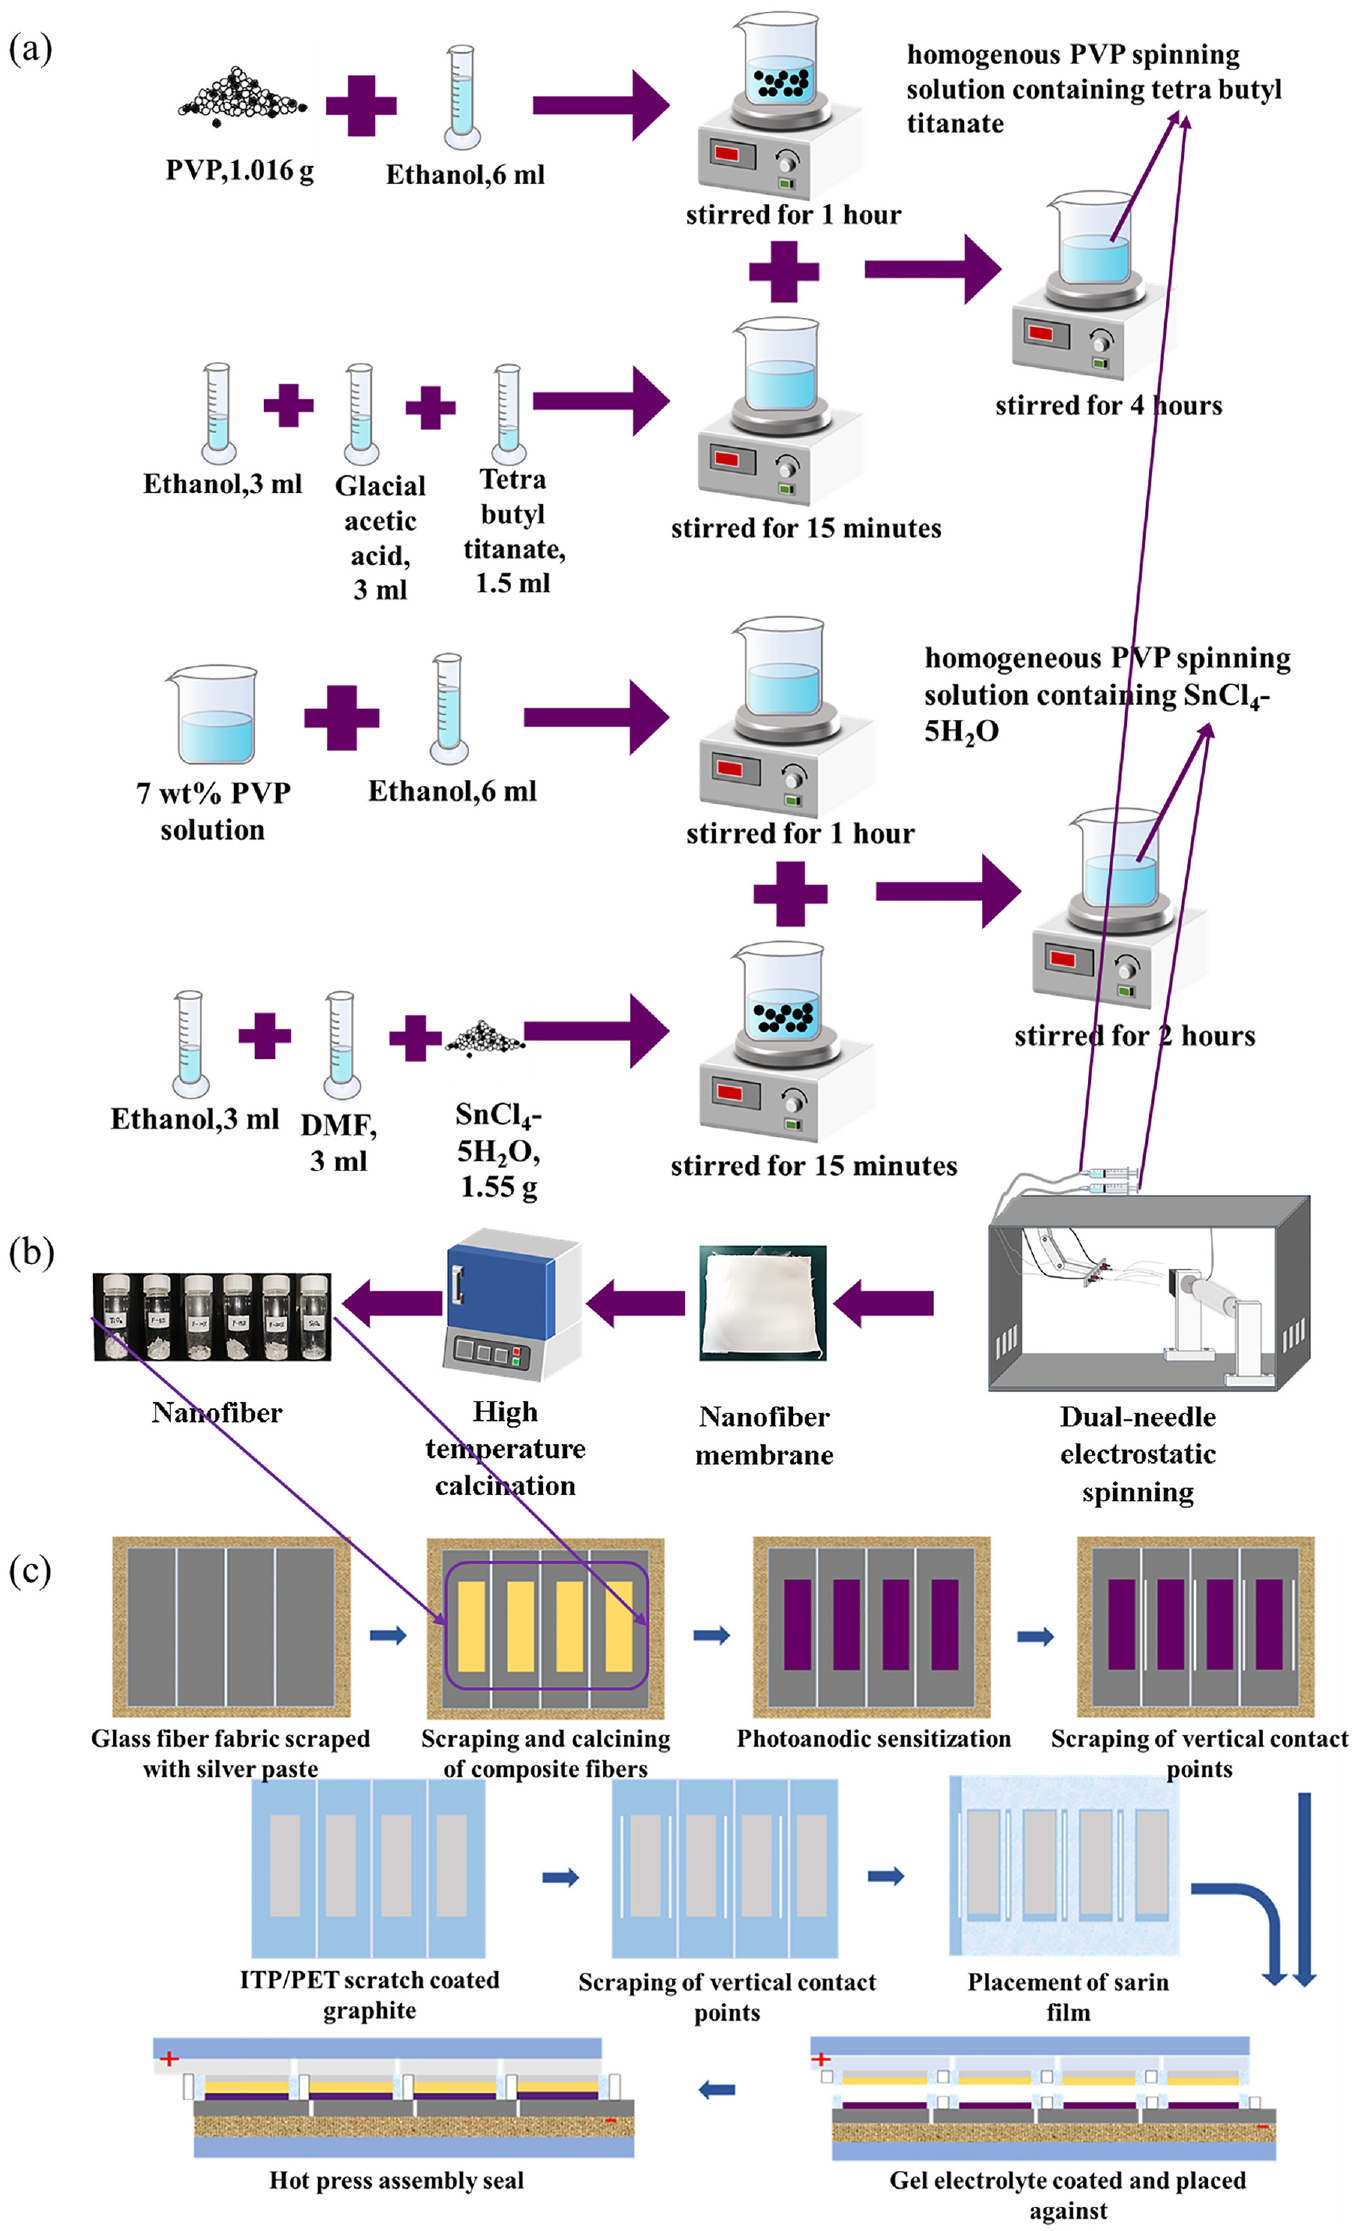
Use of SnO2–TiO2 composite nanofibers as photoanodes for DSSC by a dual-needle electrostatic spinning technique: (a) preparation of nanofiber spinning solution; (b) dual-needle electrostatic spinning nanofiber; and (c) preparation of DSSC using composite nanofibers as photoanodes.
Preparation of Nanofibers
The spinning solution was placed into two 20-mL syringes as shown in Figure 1(b). Using the dual-needle electrostatic spinning technique, 39 the solution was shaped into a stable Taylor cone and uniformly deposited over time to obtain an electrostatically spun fibrous membrane with a thickness of 0.02 ± 0.003 mm. The electrostatic spinning parameters were as follows: propulsion speed, high voltage, and reception distance are set to 0.8 mL/h, 15 kV, and 15 cm, respectively. The fibrous membrane was pre-oxidized at 80°C for 4 h, and then placed in a muffle furnace and heated to 500°C at 2°C/min, held for 2 h, and naturally cooled to room temperature to obtain the nanofiber samples.
Assembly of DSSC
The DSSC fabrication process is shown schematically in Figure 1(c). The photoanode substrate was made of FTO conductive glass, which was first ultrasonically cleaned with acetone, ethanol, and deionized water. Following this, 600 mg of sieved nanofibers was mixed with 5 mL of ethanol and 2.05 g of terpineol. Ethyl cellulose (0.25 g) was slowly introduced into the mixture with ethanol, and the two solutions were stirred together for 5 h to create the photoanode pastes. These pastes were repeatedly applied onto the FTO with a scraper in an 8 mm × 8 mm work area. The coated FTO was placed in a tube furnace at 500°C for 2 h and then cooled naturally. Next, the N719 dye (29.675 mg) was stirred in a beaker containing 100 mL of ethanol for 5 h, resulting in a 0.25 mmol/L N719 dye solution. The cooled photoanode was immersed in the dye solution, kept away from light for 24 h, then finished with ethanol and allowed to dry naturally in a light-free environment to obtain the sensitized photoanode. A perforated heat seal film was placed on the surface of the photoanode’s conductive glass, exposing the photoanode. The perforated platinum electrode 46 and photoanode were alternately clamped, then heated at 120°C for 5 min to melt the heat seal film and seal the DSSC. An iodine-based electrolyte was injected into the opening of the counter electrode using a syringe. This electrolyte solution was prepared by dissolving 0.134 g of lithium iodide, 1.065 g of lithium perchlorate, and 0.0254 g of iodine in 50 mL of acetonitrile. After filling the sandwich structure, the openings were sealed with quick-drying glue to finalize the assembly.
Characterization
The fiber morphology and elemental characteristics were determined using an S4800 cold field emission scanning electron microscope (SEM) and energy dispersive spectrometer (EDS). The crystallinity of the fibers was measured with a D8 DISCOVER XRD. The specific surface area and pore size of fibers were measured using the BSE-PS(M) specific surface area and pore size analyzer. The electrochemical impedance spectroscopy (EIS) and photovoltaic characteristics of the DSSC were examined using a CHI660E electrochemical workstation and a solar simulator (100 mW/cm2, AM1.5 G). For each type of test, a minimum of five sample groups were used.
Test and Results
Scanning Electron Microscope Test and Analysis
Figure 2 shows the SEM images and histograms of the mean diameter distribution of TiO2 nanofibers prepared by electrostatic spinning and peroxide treatment (a), TiO2 nanofibers after high-temperature calcination (b), and SnO2–TiO2 composite nanofibers with molar ratios of 5% (c), 10% (d), 15% (e), and 20% (f) prepared using the dual-needle electrostatic spinning technique. The fibers overall exhibit a random orientation distribution, smooth surfaces, and high-quality fiber morphology. The fiber diameter distribution chart shows that the diameter length of TiO2 precursor nanofibers primarily ranged from 400 nm to 600 nm, with an average fiber diameter of 449 nm. Calcined TiO2 nanofibers, designated as F-TiO2, show a diameter length primarily distributed in the 200–600 nm range, with an average fiber diameter of 295 nm. This diameter is 34% smaller than the average diameter of the TiO2 precursor nanofibers.
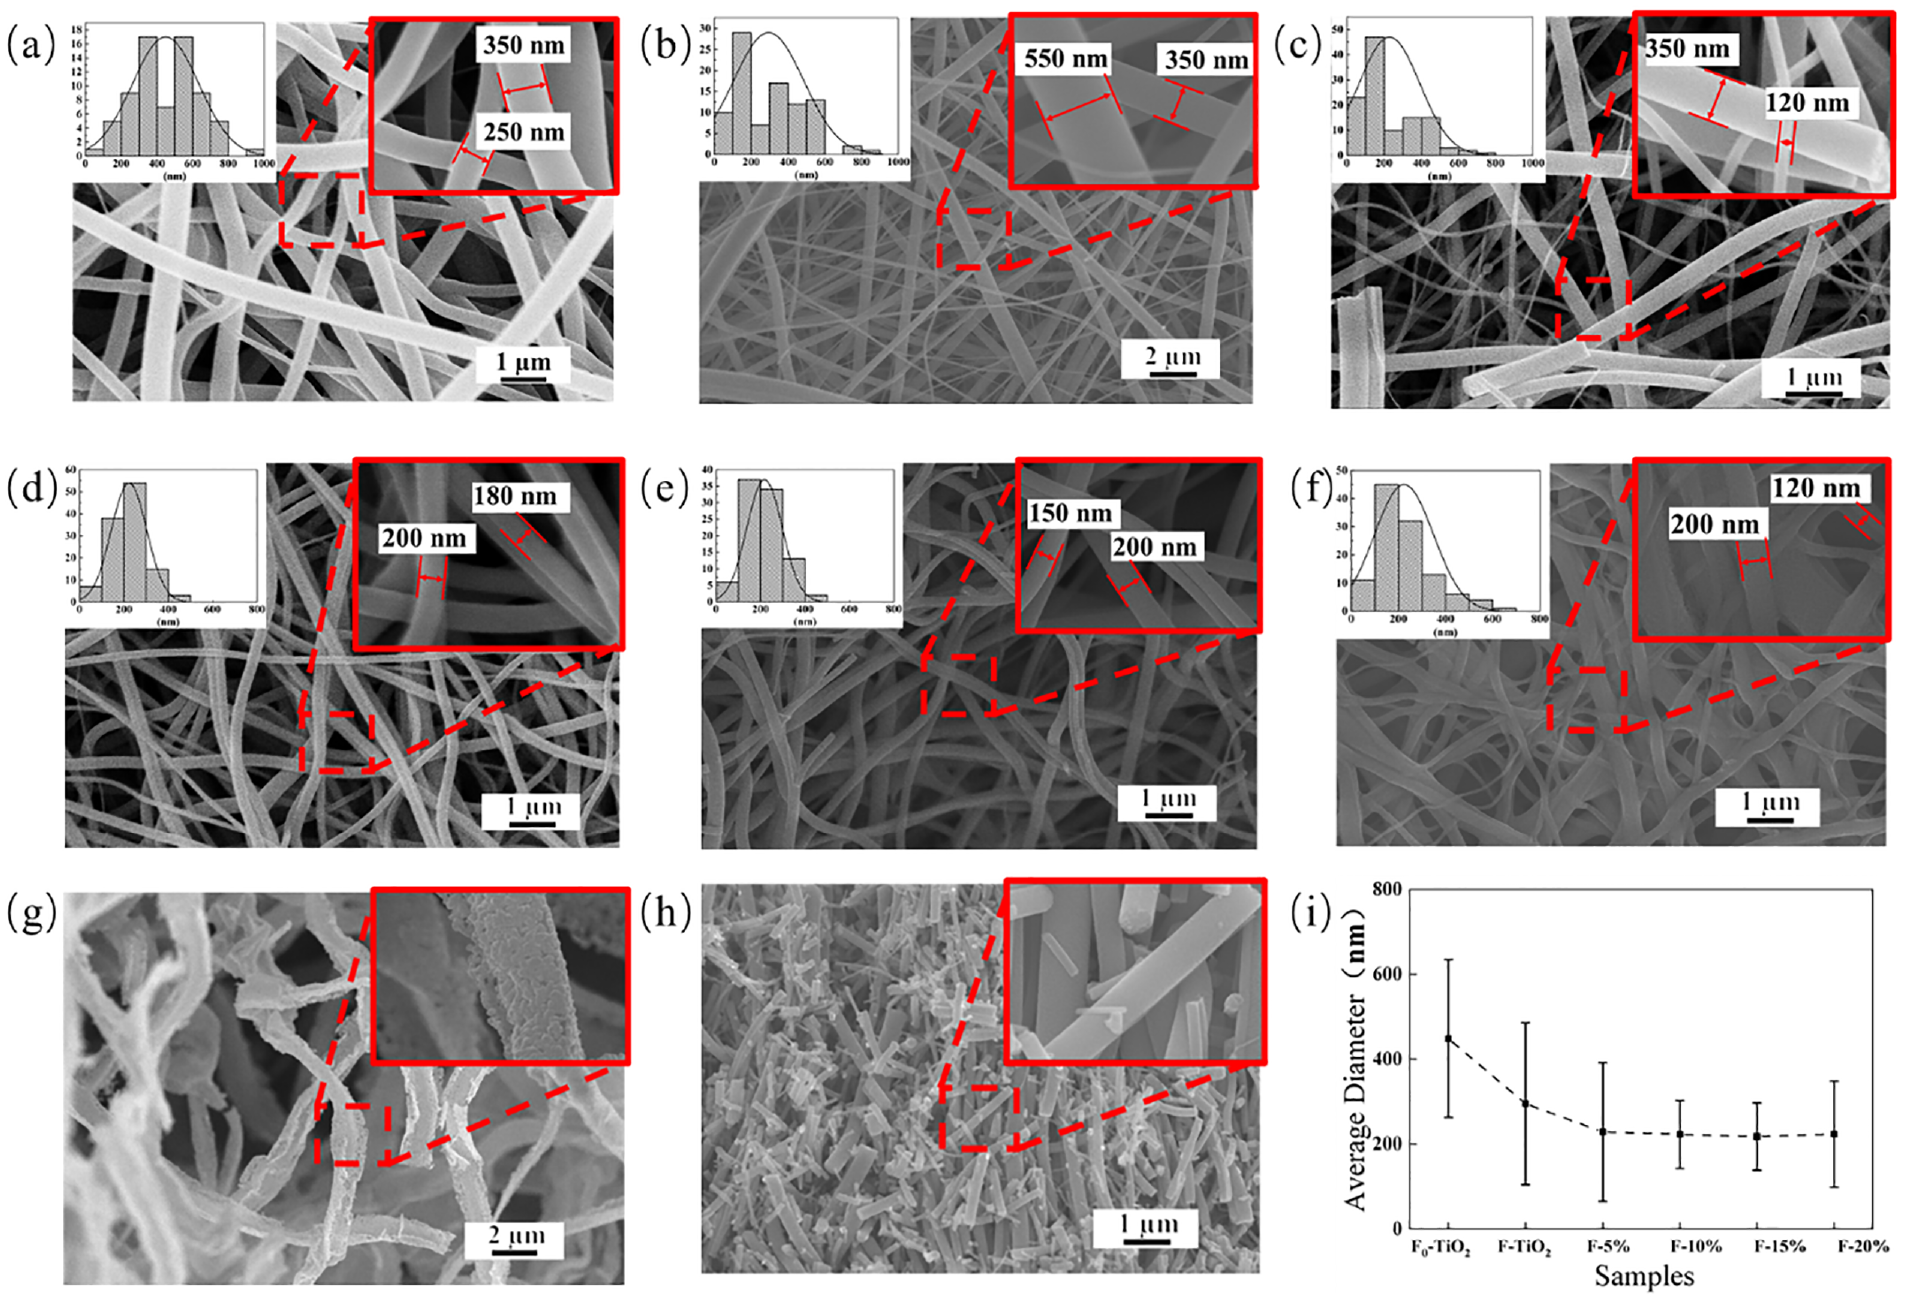
SEM and diameter distribution of nanofiber materials prepared by double-needle electrostatic spinning method: (a) electrospun TiO2 nanofibers; (b) TiO2 nanofibers post-high-temperature calcination; SEM images and fiber diameter distribution curves for SnO2–TiO2 composite nanofibers with molar ratios of (c) 5%; (d) 10%; (e) 15%; (f) 20%; (g) SEM images of SnO2 nanofibers; (h) SEM image of photoanode paste; and (i) fiber average diameter trend graph.
Figure 2(c) shows the SnO2–TiO2 composite nanofibers with a molar ratio of 5%, referred to as F-5%. This sample exhibits some very fine fibers and instances of fiber breakage. However, the fiber surface is smooth, and the orientation is randomly distributed. Considering Figure 2(g), it is evident that the fiber diameter distribution of F-5% lies between 200 nm and 500 nm, showing the largest standard deviation, which indicates the broadest distribution range and the most uneven distribution among the fiber samples. Figure 2(d) shows the SnO2–TiO2 composite nanofibers, referred to as F-10%, with a molar ratio of 10%. The orientation of the F-10% fibers is randomly distributed, the surface is smooth, and the thickness is uniform. Post-high-temperature calcination, the overall fiber shape is slightly curled with a few fibers arranged side by side. The diameter distribution of the F-10% fibers is in the 200–300 nm range, with a small standard deviation, suggesting a relatively uniform fiber diameter distribution. Figure 2(e) shows the SnO2–TiO2 composite nanofibers with a molar ratio of 15%, abbreviated as F-15%. The fibers of F-15% have a uniform distribution, and there’s a clear side-by-side distribution of fibers. Post-high-temperature calcination, the fibers show some bifurcation and breakage, with very few ultrafine fibers. As seen from Figure 2(g), the diameter distribution of F-15% fibers is in the 200–300 nm range, with an average diameter of 217 nm. The standard deviation is the smallest, and the fiber diameter distribution is the most uniform among all sample fibers. Figure 2(f) shows the SnO2–TiO2 composite nanofibers, referred to as F-20%, with a molar ratio of 20%. In contrast to the other fibers, the F-20% fibers also display a random orientation distribution but are relatively compactly arranged, with some agglomeration and a rough surface, accompanied by some curling of ultrafine fibers. The diameter distribution of F-20% fibers ranges from 200–400 nm, with an average fiber diameter of 223 nm. Figure 2(g) shows the trend of the average fiber diameter. With different molar ratios, the distribution of fiber diameter has a specific pattern. The standard deviations of F0–TiO2, F-TiO2, and F-5% fibers are large, indicating that the fiber diameter distribution of these fibers is not uniform. However, the average diameter of the fibers shows a gradual decrease. The average diameter of SnO2–TiO2 composite nanofibers is smaller than that of F-TiO2 fibers, and the molar ratio of the SnO2–TiO2 composite nanofibers remains roughly the same, at about 220 nm. The standard deviation of the F-5% fibers is the largest, followed by the F-20% fibers, indicating less uniform fiber diameter distribution. However, F-10% and F-15% fibers have smaller standard deviations, suggesting a more uniform distribution of fiber diameters.
Figure 2(g) displays the SEM images of SnO2 nanofibers. These fibers have a random and uniform orientation, with evident curling. The fiber diameter length distribution ranges from 0 to 1800 nm, with a main distribution range of 800–1400 nm, and an average diameter of 1001 nm. Upon 50,000-fold magnification, a distinct uneven structure of SnO2 nanofibers is observed, which is considerably rougher compared to TiO2 fibers. Figure 2(h) shows the electron microscopic images of the photoanode paste. The nanofibers appear as short rods, with a uniform distribution of orientation and uneven fiber length, potentially due to insufficient grinding. The fiber diameter is also uneven, but the short rods are uniformly arranged on the photoanode paste surface. Figure 2(h) indicates that the photoanode paste consists of stacked short rod-like fibers, with very fine fibers adhering to the surface of the short rod-like fibers.
X-ray Diffraction Test and Analysis
Figure 3(a) exhibits the XRD patterns of TiO2 nanofibers, and SnO2–TiO2 composite nanofibers with molar ratios of 5%, 10%, 15%, and 20%. For TiO2 nanofibers, the anatase phase and rutile phase TiO2 are obtained after electrospinning and high-temperature treatment at 500°C. The anatase phase TiO2 (JCPDS Nos: 21-1272) corresponds to crystal planes (101), (004), (200), (105), (211), (204), (116), (220), (215) at 25.28°, 37.8°, 48.04°, 53.89°, 55.06°, 62.68°, 68.76°, 70.31°, 75.03°, while the rutile phase TiO2 (JCPDS No. 21-1276) corresponds to (211), (002), (301), (112) crystal planes at 54.32°, 62.74°, 69.00°, 69.79°. Anatase phase TiO2 is notable for its superior physical and chemical properties, excellent light scattering performance, and stability, but rutile phase TiO2 exhibits low conductivity.
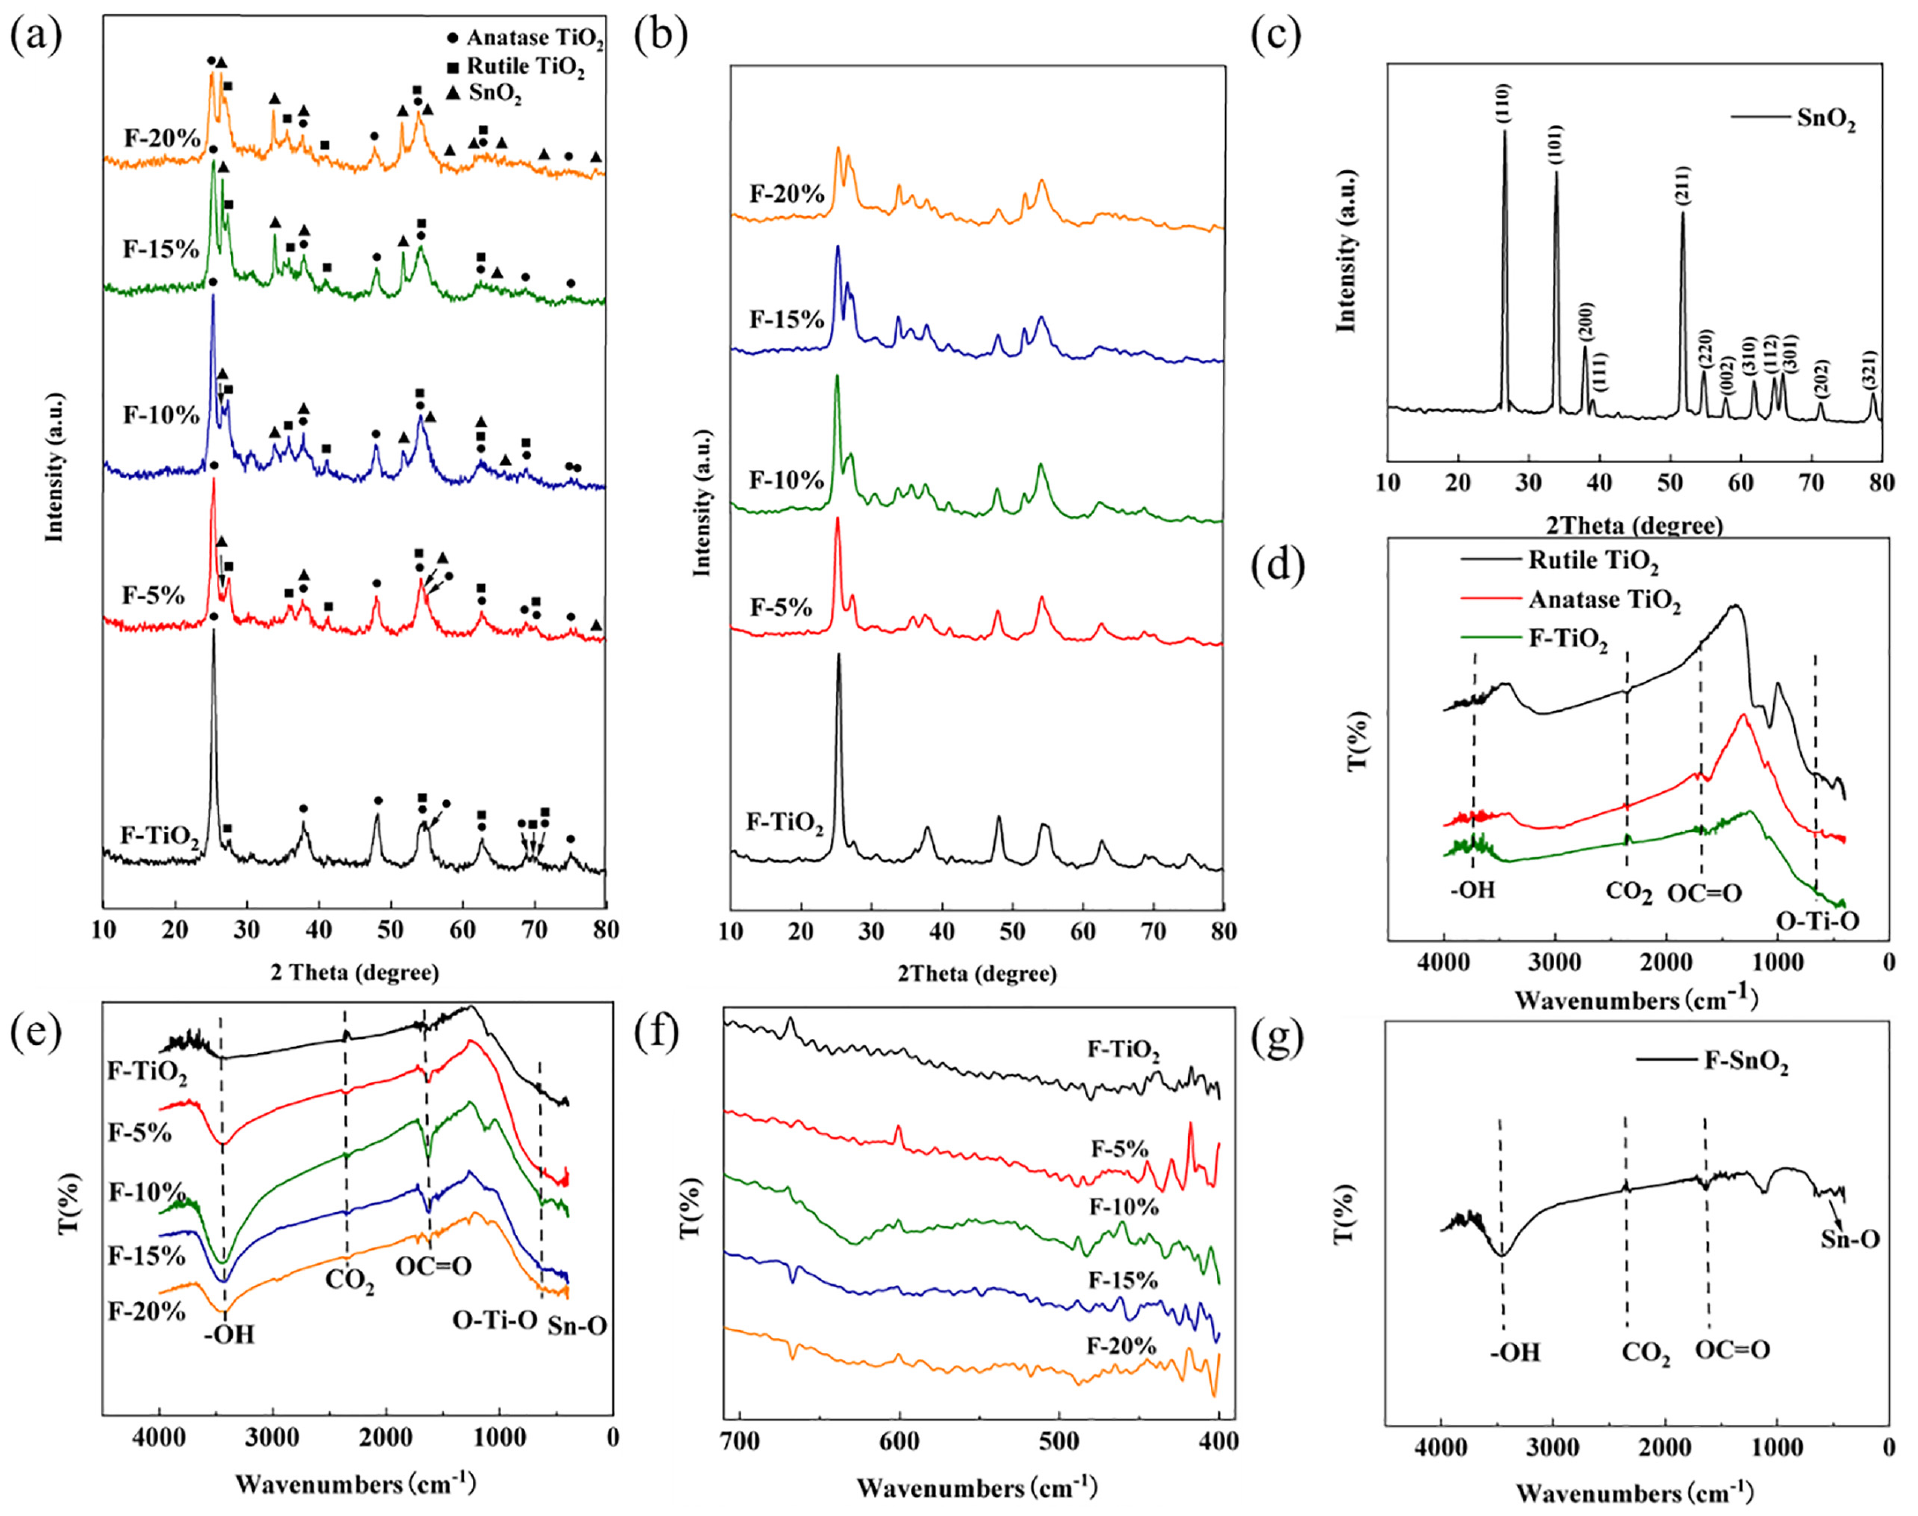
XRD and FTIR of nanofiber materials prepared by double-needle electrostatic spinning method: (a) XRD patterns of SnO2–TiO2 composite nanofibers at different molar ratios; (b) Local enlargement; (c) XRD patterns of SnO2 nanofibers; (d) IR spectra of TiO2 nanofibers; (e) comparative IR spectra of TiO2 nanofibers and SnO2–TiO2 composite nanofibers at varying molar ratios; (f) Local enlargement; and (g) IR spectra of SnO2 nanofibers.
SnO2–TiO2 composite nanofibers, as shown in Figure 3(a), comprise anatase and rutile phase TiO2 as well as SnO2 crystals, each denoted by different markers, validating successful composite formation. The composite fiber predominantly exhibits anatase phase TiO2, with an infusion of rutile phase TiO2. Moreover, the SnO2–TiO2 nanofibers display a more pronounced diffraction peak of rutile phase TiO2 compared to pure TiO2 nanofibers. Additional diffraction peaks at 36.08° and 41.22° are observed, corresponding to the (101) and (111) crystal planes of rutile TiO2, which are not present in TiO2 nanofibers. This could be due to SnO2 promoting the transformation of TiO2 from anatase to rutile phase, given the similar tetrahedral crystalline structure of both. 47 (According to JCPDS no. 21-1276, rutile TiO2 cell =4.5933×2.9592, according to JCPDS no. 41-1445, SnO2 cell =4.7382 × 3.1871).
As presented in Figure 3(b), at a 5% molar ratio, the SnO2 diffraction peak is not prominent, potentially due to Sn4+ intercalation into TiO2. 37 As the molar ratio increases, the SnO2 diffraction peak sharpens and the (101) crystal plane of anatase phase TiO2 gradually broadens. Sharp diffraction peaks at 26.61°, 33.89°, 37.95°, 51.78°, 54.76°, 57.82°, 61.87°, 64.72°, 65.94°, 71.28°, and 78.71°, corresponding to the (110), (101), (200), (211), (220), (002), (310), (112), (301), (202), and (321) planes of SnO2 (JCPDS No. 41-1445), verify the crystallization of SnO2 in SnO2–TiO2 nanofibers. Moreover, using Scherrer’s formula, an increase in the SnO2 molar ratio leads to a decrease in the particle size of the anatase phase from 10.4 to 7.7 nm, and the rutile phase from 39.5 to 6.9 nm. This trend indicates that the introduction of SnO2 leads to the grain refinement of TiO2. 48
The XRD pattern of the SnO2 nanofibers, as presented in Figure 3(c), exhibits remarkably sharp diffraction peaks. This distinct clarity suggests a successful acquisition of highly crystalline SnO2 nanofibers, devoid of any extraneous impurity phases, achieved through the process of electrospinning and subsequent high-temperature calcination. Specific 2θ angles, namely, 26.61°, 33.89°, 37.95°, 38.97°, 51.78°, 54.76°, 57.82°, 61.87°, 64.72°, 65.94°, 71.28°, and 78.71°, correspond to the crystal planes of SnO2 (JCPDS No. 41-1445), including (110), (101), (200), (111), (211), (220), (002), (310), (112), (301), (202), and (321). As determined by Scherrer’s formula, the grain size is calculated to be 32.8 ± 2.3 nm.
Fourier Infrared Spectroscopy Test and Analysis
Figure 3(d) shows the IR spectra for rutile TiO2, anatase TiO2, and TiO2 nanofibers. The three curves show consistent trends and their diffraction peaks’ locations are nearly identical. The stretching vibration absorption peak of the hydroxyl group, the interference of CO2 in the sample, and the carboxyl group from incomplete functional group decomposition are attributed to wave numbers of 3735, 2350, and 1704 cm−1, respectively. After undergoing high-temperature calcination, the TiO2 nanofibers exhibit evident absorption bands in the fingerprint region, with 674 cm−1 corresponding to O–Ti–O in TiO2, confirming the successful preparation of TiO2 nanofibers via high-temperature calcination. Figure 3(e) shows a comparative IR spectrum of TiO2 nanofibers and SnO2–TiO2 composite nanofibers with 5%, 10%, 15%, and 20% molar ratios. All curves exhibit a uniform trend, and peaks for hydroxyl, CO2, and carboxyl groups are identified at 3411, 2343, and 1623 cm−1, respectively. The O–Ti–O bond is present at 645 cm−1. The SnO2–TiO2 composite fibers have an intensified absorption peak between 400 and 700 cm−1, indicative of the vibration band of the Sn–O bond. Figure 3(g) shows the IR spectrum of SnO2 nanofibers, with peaks for hydroxyl, CO2, and carboxyl groups at 3447, 2316, and 1616 cm−1, respectively. In the fingerprint region, Sn-O in SnO2 is found at 618 cm−1. To summarize, the successful preparation of TiO2 nanofibers, SnO2–TiO2 composite nanofibers, and SnO2 nanofibers is confirmed.
Specific Surface Area and Aperture Test and Analysis
Figure 4 shows the N2 adsorption and desorption isotherms of TiO2 nanofibers and SnO2–TiO2 composite nanofibers at different molar ratios (5%, 10%, 15%, and 20%). This figure also includes the BJH method differential integral pore size distribution curves (adsorption). The fiber-specific surface area, computed via the BET multi-point method, as well as the pore volume and average pore diameter, calculated by the BJH method, are provided in Table 1.
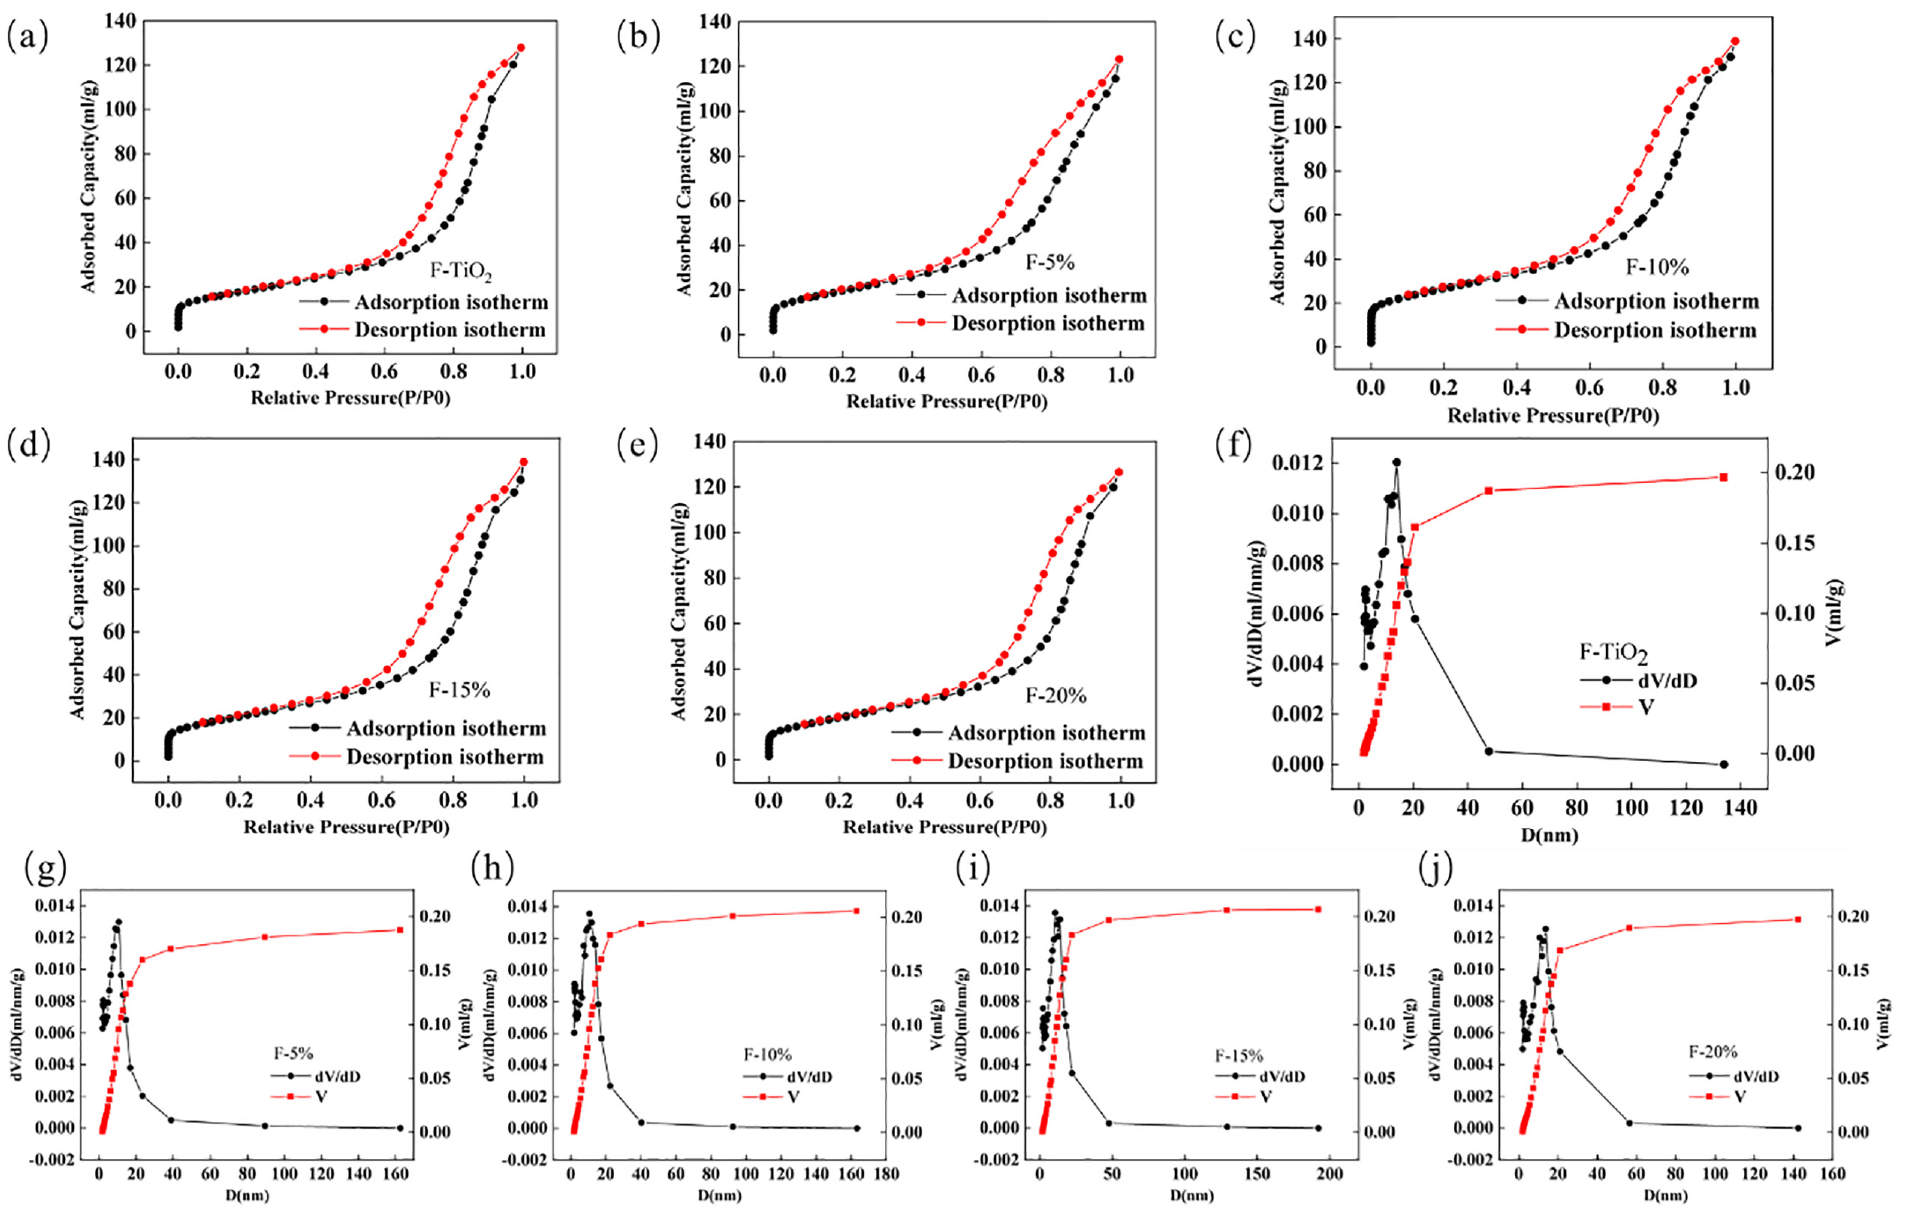
Nitrogen adsorption/desorption isotherms and pore distribution curves of nanofiber materials prepared by double-needle electrostatic spinning: (a) TiO2 nanofibers; (b)–(e) nitrogen adsorption/desorption isotherms for composite nanofibers at varying molar ratios; (f) TiO2 nanofibers; and (g)–(j) pore distribution curves for composite nanofibers at varying molar ratios.
Specific surface area and pore size parameters of TiO2 nanofibers and SnO2–TiO2 composite nanofibers at varying molar ratios.
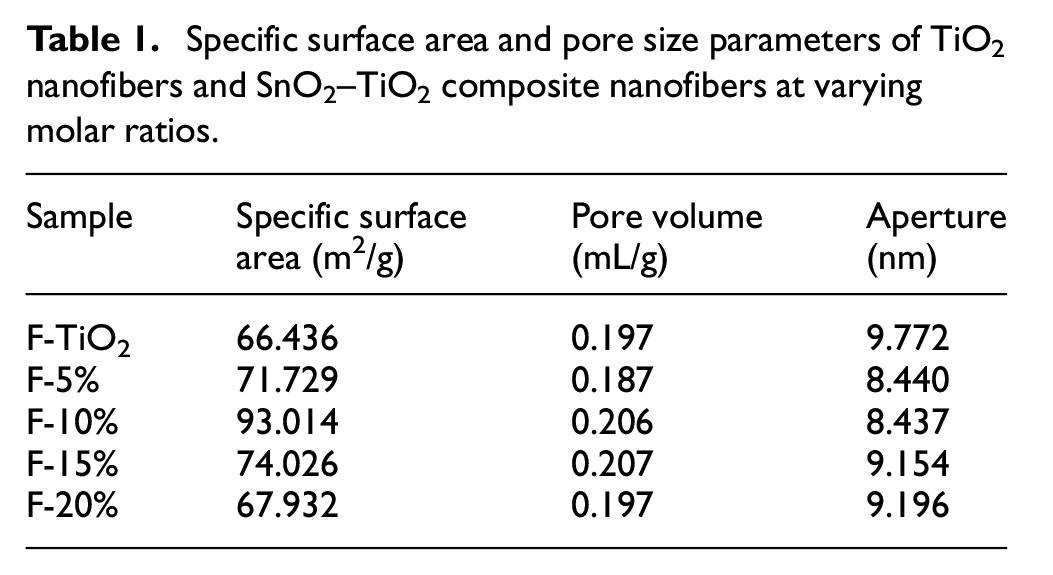
The N2 adsorption and desorption isotherms of both the TiO2 nanofibers and the SnO2–TiO2 composite nanofibers, regardless of the molar ratio, exhibit a similar pattern. Initially, the adsorption is challenging, followed by the appearance of adsorption hysteresis during the intermediate phase, indicative of a capillary condensation system. This consequently produces a type IV isotherm characteristic of a mesoporous structure. The specific surface area of the TiO2 nanofibers is 66.436 m2/g. However, the specific surface area of the composite fibers varies with the molar ratio of SnO2, showing a variation trend of first rising and then declining, with the maximum observed at F-10% (93.014 m2/g). The specific surface areas for F-5%, F-15%, and F-20% are 71.729 m2/g, 74.026 m2/g, and 67.932 m2/g, respectively. It is worth mentioning that the dye adsorption capacity has a positive correlation with the sample’s specific surface area. A larger surface area exposes more catalytic active sites. The pore size distribution curve revealed that the pore volume of the composite nanofibers fluctuated with the molar ratio of SnO2, initially increasing and then decreasing. In tandem, the average pore diameter reduced before rising again, with F-10% recording the smallest average pore diameter at 8.437 nm.
Moreover, the spread of the pore diameter distribution curve correspondingly decreased and then increased with escalating molar ratios of SnO2. The size range for F-TiO2 is approximately 10–25 nm. Most pores in F-5% and F-10% distributed within 5–10 nm, while the line widths of F-15% and F-20% significantly expanded, indicating a wider distribution in larger pore sizes. Large porosity may decrease the electron diffusion coefficient, while smaller pore sizes could enhance inter-particle connectivity, thereby improving the charge transfer rate. The application of a semiconductor photoanode in DSSC necessitates extensive porosity and surface area to adsorb a substantial quantity of dye molecules, facilitating photon absorption and the production of free electrons. Therefore, F-10%, with its considerable specific surface area and porosity, exhibits distinct advantages.
Electrochemical AC Impedance Test and Analysis
Figure 5(a)–(f) shows the Nyquist curve, Bode phase-frequency chart, and Bode phase-impedance-frequency chart of photoanodes composed of TiO2 nanofibers and SnO2–TiO2 composite nanofibers with molar ratios of 5%, 10%, 15%, and 20%. In the Nyquist diagram, the first resistance observed is the series resistance (Rs) between FTO and TiO2, which is the initial measured value. The first semi-circle is R1, incorporating resistance from electron transmission and double-layer capacitance from the counter electrode. The second semi-circle signifies R2, the combined impedance of the photoanode material/dye/electrolyte interface. Z-view software is used to derive the Rs, R1, and R2 values, as shown in Table 2.
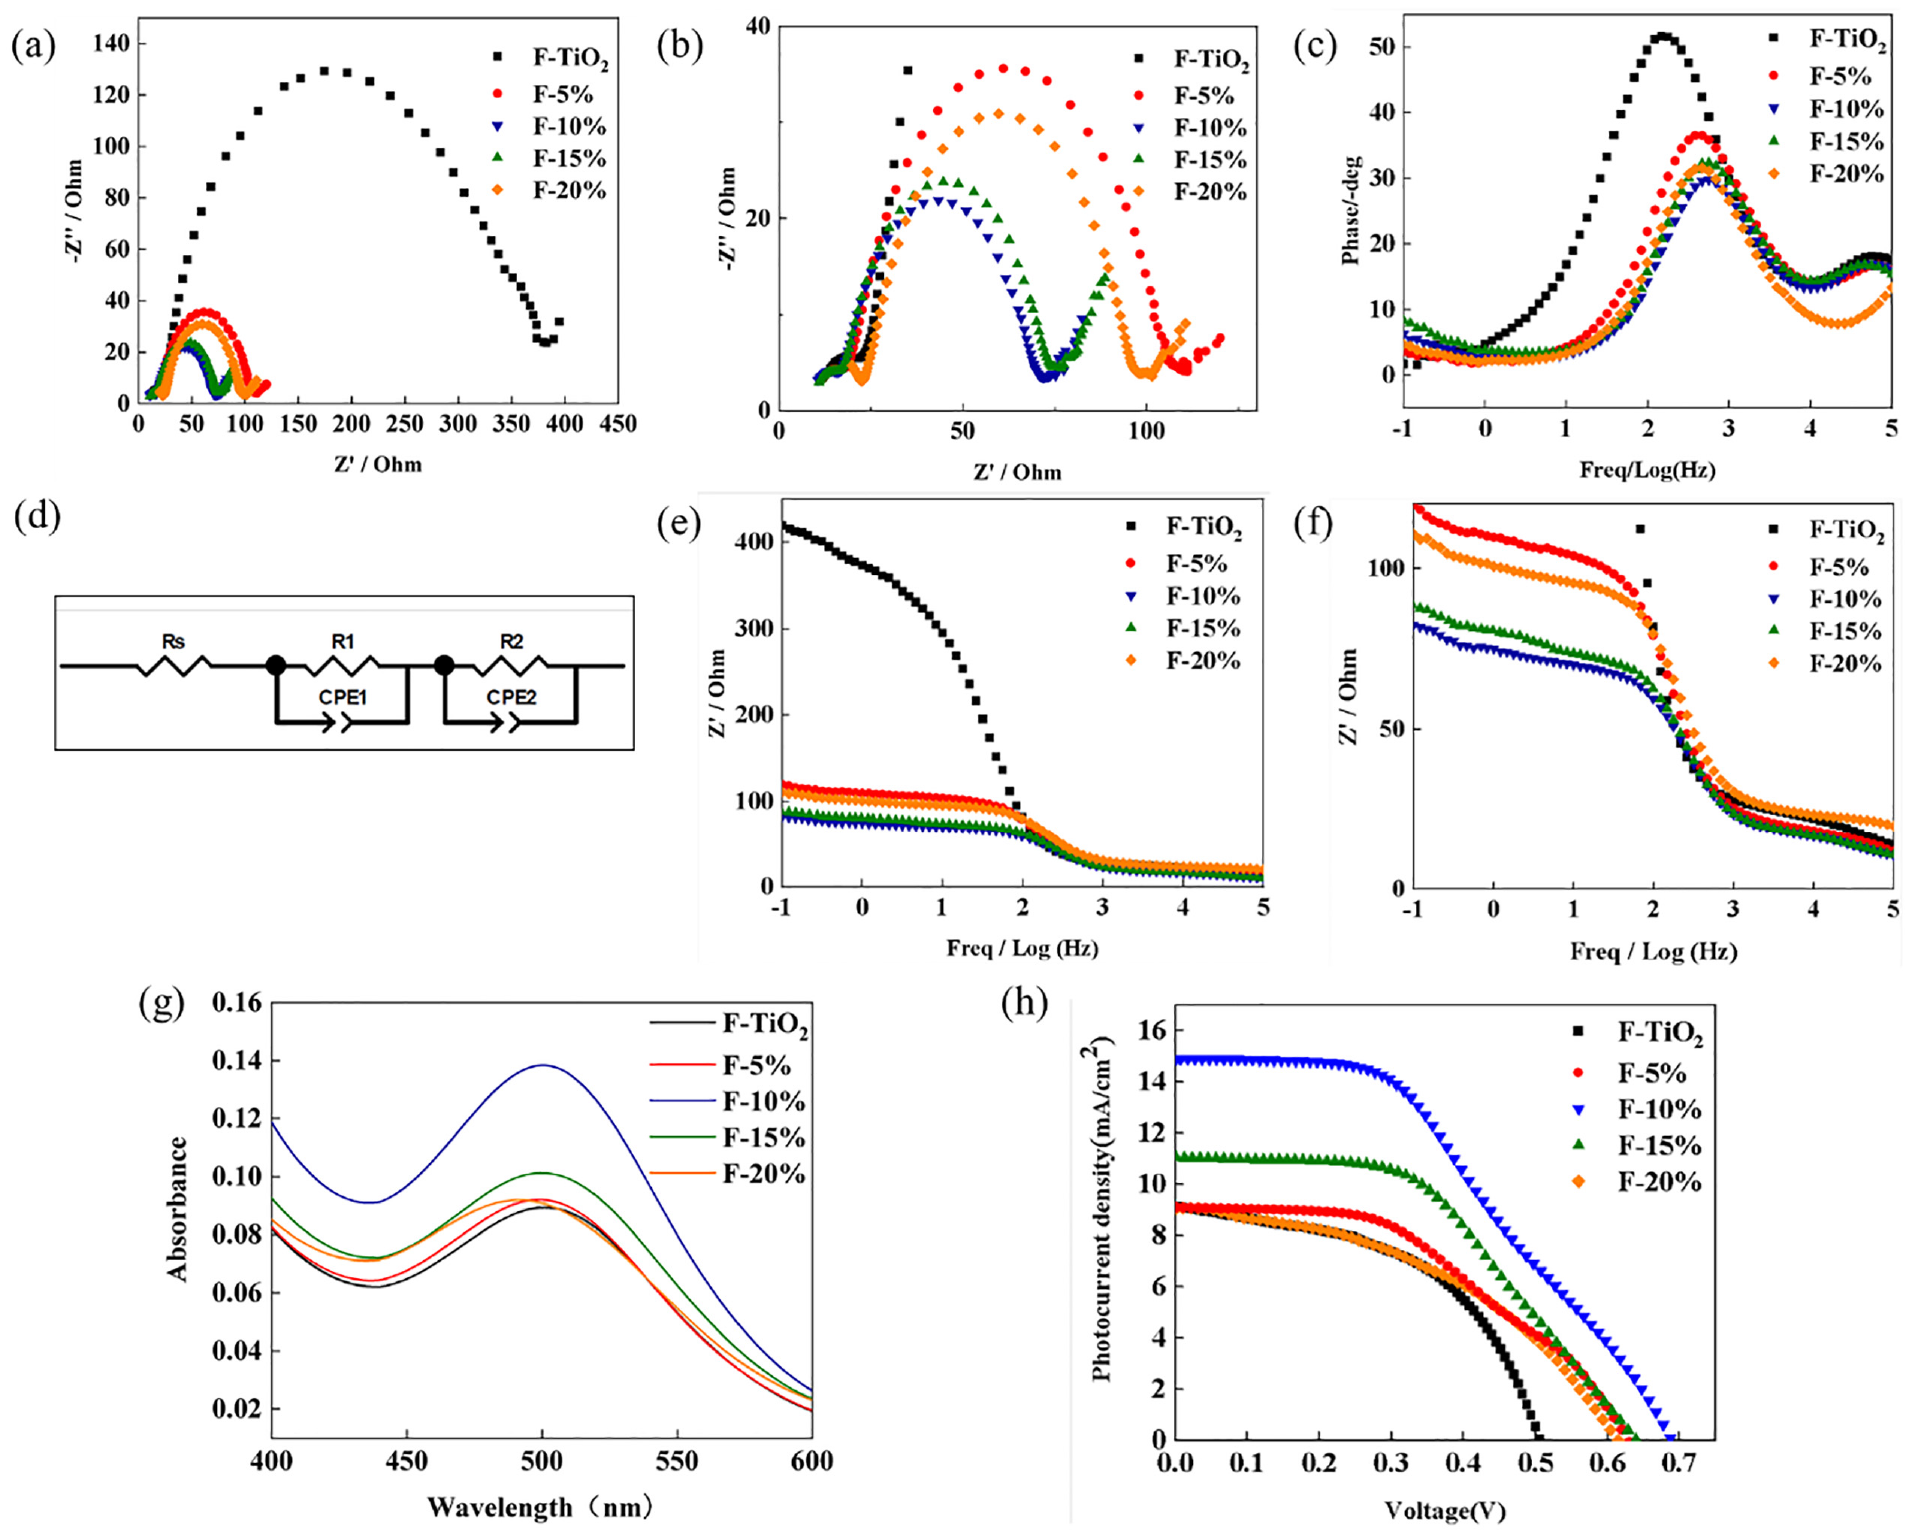
Characterization curve of photoanode material properties: (a) Nyquist curves and (b) Local magnification of TiO2 nanofibers andSnO2–TiO2 composite nanofiber wick DSSC with different molar ratios; (c) phase-frequency plot of Bode curves; (d) equivalent circuit diagram; (e) impedance-frequency plot; (f) Local magnification of Bode curves; (g) UV-anodic desorption of N719 dye prepared from different materials visible absorption spectra plots; and (h) J–V curves of TiO2 nanofibers and SnO2–TiO2 composite nanofibers Wicker DSSC.
Impedance parameters of DSSC using TiO2 nanofibers and SnO2–TiO2 composite nanofibers with various molar ratios.
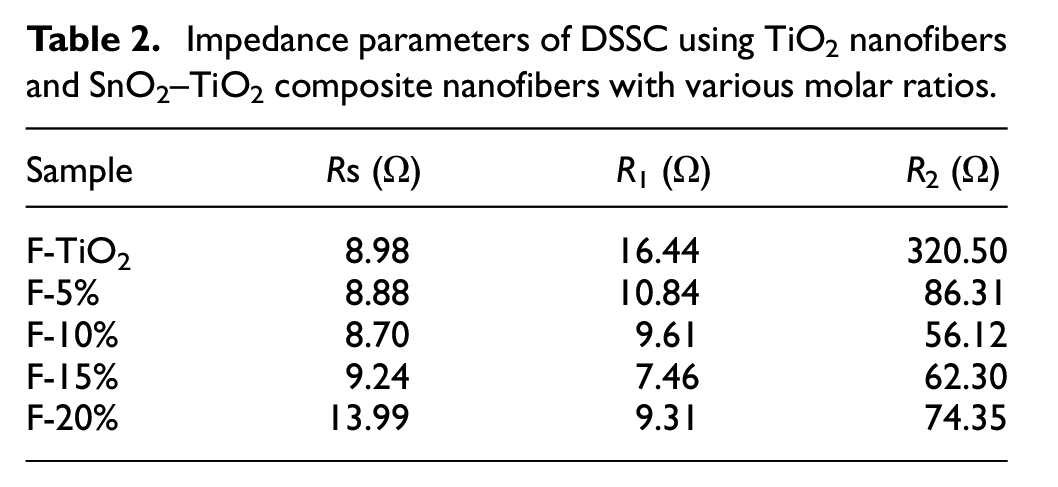
The Rs values of all samples show marginal differences, suggesting that the photoanode material has good contact with the conductive glass. The span of the real component of the intermediate frequency domain’s semi-circle correlates with R2, initially decreases, and then increases with a rising molar ratio of SnO2. The minimum interface resistance, 56.12Ω, is shown by F-10%, indicative of rapid electron transmission and transfer. These findings suggest that an optimal molar ratio of SnO2 and TiO2 in the composite can enhance DSSC’s electron transport rate, while an excessive composite might result in a contrary effect. The phase-frequency diagram of the Bode curve shows a decrease in phase value from F-TiO2 to F-5%, then to F-10%. When the molar ratio of SnO2–TiO2 is 10%, the phase value reaches a minimum, followed by an upward trend.
Furthermore, F-20% exhibits a forward phenomenon, with the peak phase value migrating to the lower-frequency region. As observed from the Bode curve impedance–frequency diagram, the interface impedance of the photoanode material/electrolyte decreases with increasing frequency. As the molar ratio of SnO2 increases, the interface impedance initially decreases, then increases, hitting the minimum value when the SnO2–TiO2 molar ratio is 10%.
Ultraviolet–visible Spectrum Test and Analysis
To assess the dye-absorbing capability of the photoanode, dye-desorption tests are performed on TiO2 nanofibers and photoanodes made from SnO2–TiO2 composite nanofibers with molar ratios of 5%, 10%, 15%, and 20%, using a UV-visible spectrum test. The results are presented in Figure 5(g). The graph reveals a prominent absorption peak in the wavelength range of 450–550 nm. The TiO2 nanofibers show the lowest adsorption curve, indicating they absorb the least amount of dye. With an increase in the SnO2 molar ratio, the absorbance initially increases and subsequently decreases. The dye adsorption capacity is directly linked to the surface area and pore size of specific nanofibers. Considering the BET test results, it’s evident that F-10%’s maximum specific surface area is the key contributor to its maximum dye adsorption capacity. The absorbed N719 dye can enhance visible light absorption and further improve photoelectric conversion efficiency.
Photoelectric Performance Test and Analysis
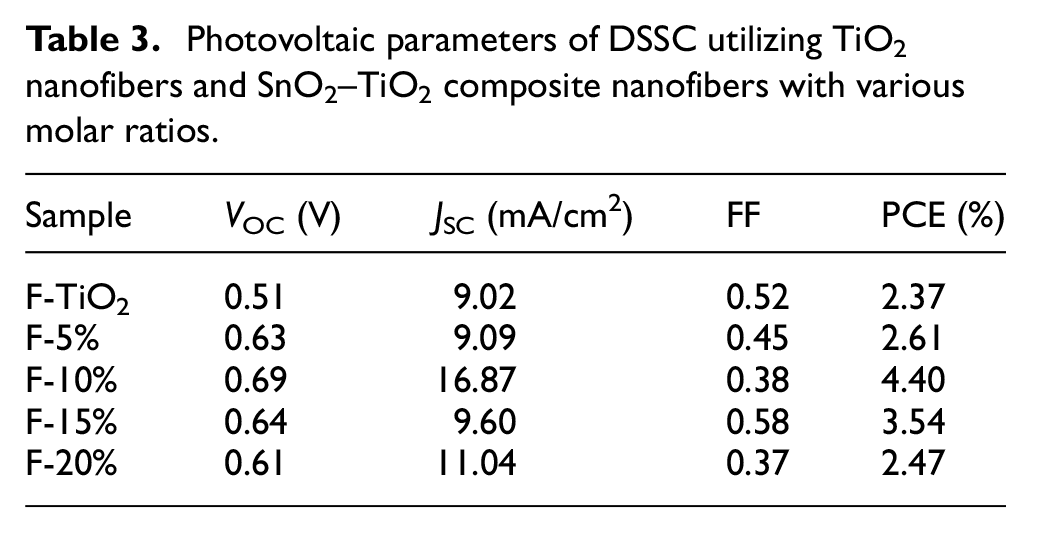
Figure 5(h) shows the J–V curve for TiO2 nanofibers and SnO2–TiO2 composite nanofiber DSSC with molar ratios of 5%, 10%, 15%, and 20%. The detailed photovoltaic parameters are shown in Table 3. The conversion efficiency of all composite nanofiber-made DSSC surpasses that of TiO2 nanofiber DSSC. The addition of SnO2 enhances the DSSC’s conversion efficiency, likely due to SnO2’s high electron mobility and broadband gap, thereby speeding up electron migration, effectively reducing dye decay rate, and improving stability. The DSSC’s photoelectric conversion efficiency initially rises and then falls with an increase in the SnO2 molar ratio. At a SnO2–TiO2 molar ratio of 10%, the DSSC achieves a peak PCE of 4.40%, an open-circuit voltage of 0.69 V, a short-circuit current density of 16.87 mA/cm2, and a fill factor (FF) of 0.38. While the open-circuit voltage and short-circuit current density have improved, the overall photoelectric conversion efficiency remains suboptimal, possibly due to the DSSC’s low filling factor. Numerous factors can affect the filling factor, such as improper control of the photoanode’s thickness, excessively large effective area, and others. Nonetheless, compared with F-TiO2, the PCEs of F-5%, F-10%, F-15%, and F-20% have increased by 10.13%, 85.65%, 49.37%, and 4.21%, respectively.
Photovoltaic parameters of DSSC utilizing TiO2 nanofibers and SnO2–TiO2 composite nanofibers with various molar ratios.
Garment Simulation Based on Flexible DSSC Module
In this article, DSSC modules are expected to be applied to smart garments. To explore the application of flexible DSSC modules in smart garments, this article implements a solar smart digital jacket by the Marvelous Designer software.
The drawing of the plate structure in the 2D panel is performed using the character model from the Marvelous Designer software’s internal setting. In the 3D panel, manually adjust the position of the panels drawn in the 2D panel so that the panels correspond to the position of the human body. Select the stitching tool to stitch the fabrics to each other’s edges in the 2D panel and observe the stitching effect in the 3D panel. Combine smart wearable devices such as ECG monitoring devices, heating pads, and GPS positioning with LED light strips with the garment. After sewing the lining and fabric of the smart solar garment together, adjust the color, transparency of the fabric, color, texture, strength, power, and other attributes of the fabric, so that the fabric can be adapted to the attributes of casual jackets, with waterproof, windproof and warmth-retaining properties. Flexible solar panels are installed on the back of the garment, and the circuit component connections and simulation effects of the smart solar garment are shown in Figure 6.
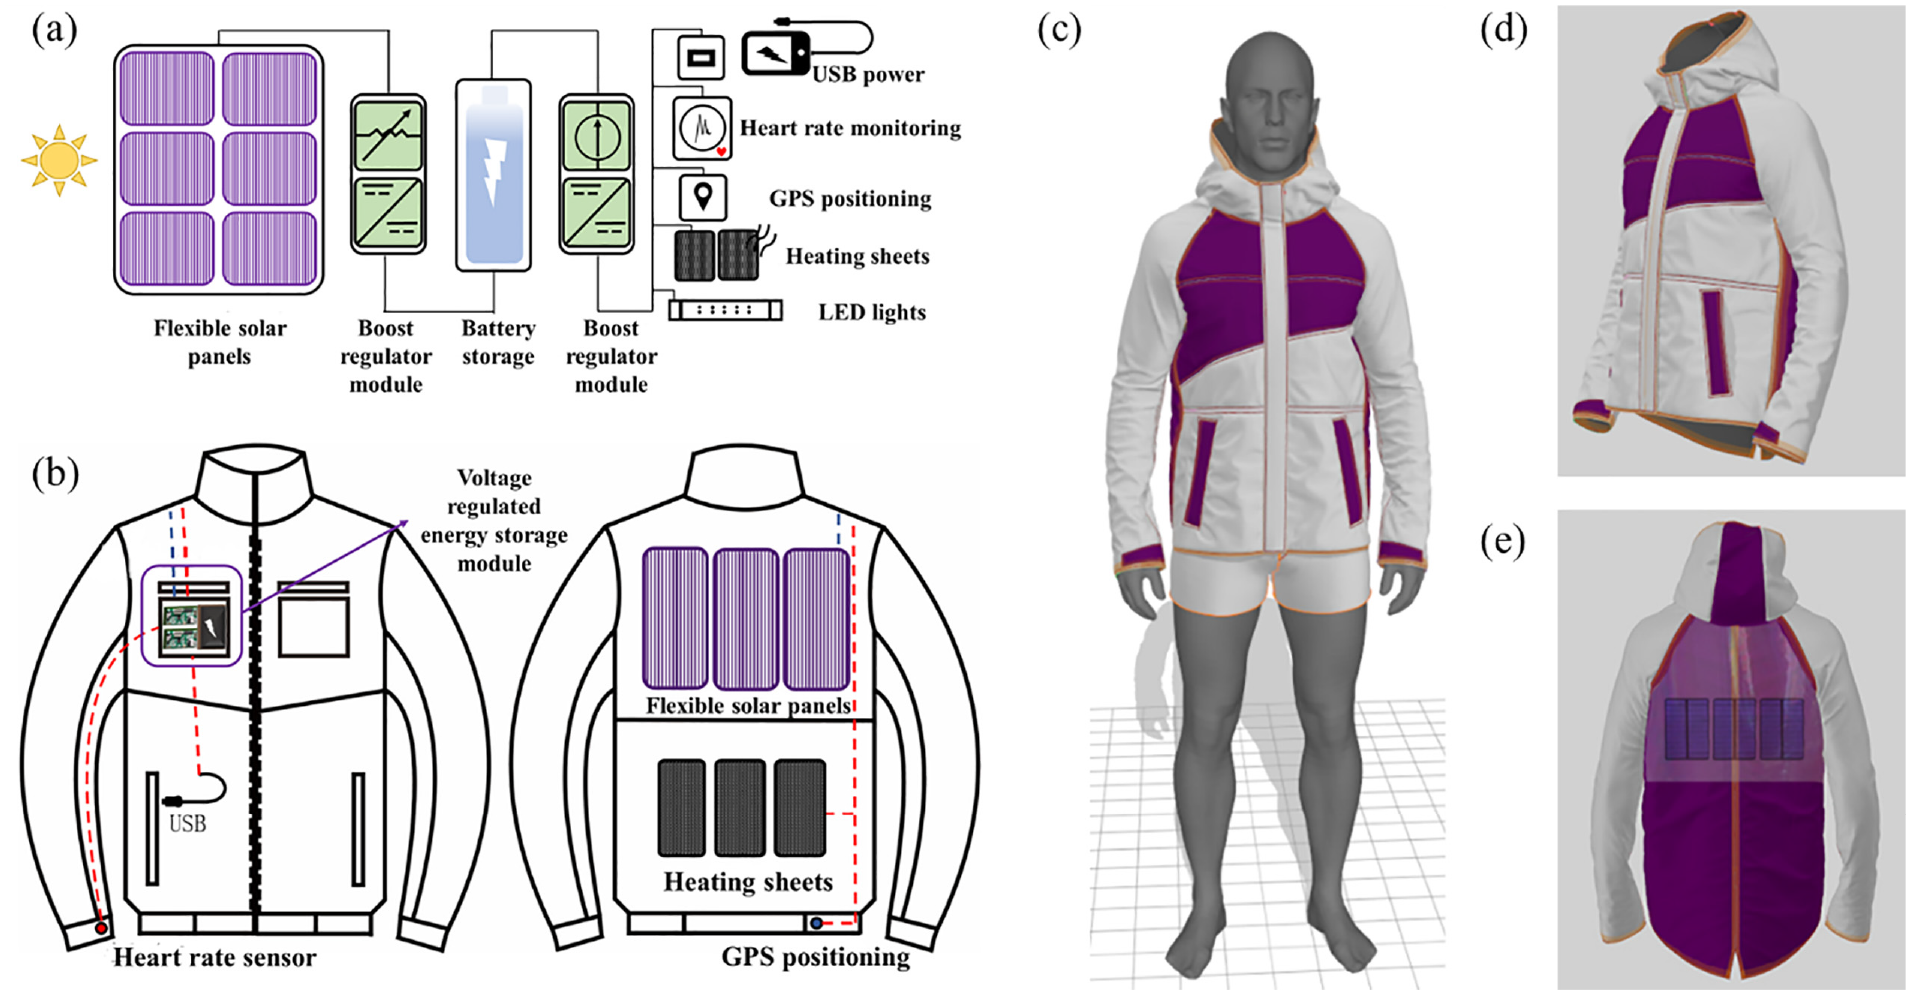
Schematic diagram of a smart solar system integrated causal jacket: (a) model diagram of circuit components; (b) schematic diagram of circuit connections; (c) simulated effect diagram of a model wearing on the front; (d) simulated effect diagram of the side; and (e) simulated effect diagram of the back.
Conclusion
This study utilized the dual-needle electrostatic spinning technology to design composite nanofiber materials of TiO2 and SnO2 with various molar ratios to fabricate dye-sensitized solar cells (DSSC), using the composite nanofiber materials as photoanodes. The morphology, crystal structure, pore size, and overall structure of the nanofiber films are characterized via scanning electron microscopy, X–ray diffraction, Fourier infrared spectroscopy, and specific surface area and pore size tests. UV–visible spectroscopy is employed to assess dye adsorption on the photoanodes, along with electrochemical AC impedance tests to study the photoanode’s electrical properties and the photoelectric properties of the DSSC. It is determined that at a SnO2–TiO2 molar ratio of 10%, the maximum specific surface area reached 93.01 m2/g, absorb the most dye, exhibit the smallest interface resistance of 56.12 Ω, and have the quickest electron transport and transfer rate. These properties are the most conducive for photogenerated electron production, thereby enhancing the photoelectric conversion efficiency. The photoelectric conversion efficiency of 4.4% achieved with the composite as a photoanode is 85.65% higher than the 2.37% efficiency attained using TiO2 as the photoanode. To explore the application of flexible DSSCs modules in smart garments, this article uses Marvelous Designer software to simulate and demonstrate a smart solar system integrated causal jacket.
In summary, this research optimizes the photoelectric conversion efficiency of DSSC by SnO2–TiO2 composite nanofibers up to 4.4% which is 85.65% higher than that of TiO2 nanofibers at 2.37% and shows promising potential for their application in self-powered devices in the field of smart wearable technology.
Footnotes
Declaration of conflicting interests
The author(s) declared no potential conflicts of interest with respect to the research, authorship, and/or publication of this article.
Funding
The author(s) received no financial support for the research, authorship, and/or publication of this article.