
Abstract
To investigate the fabric performance of tight tops and the influence of clothing pressure on the relative slip between clothing and the human body, a simulation model based on finite element analysis is proposed. This model simulates the relative slip distance under dynamic conditions. Initially, a three-dimensional model for numerical simulation was established through reverse engineering. Subsequently, material properties and boundary conditions were defined. Finally, the model was analyzed using ANSYS Workbench, and the obtained results were compared with the stretch ratio of the skin on the human back. The results indicate that, under constant conditions, the Young’s modulus of the fabric has a greater influence on the slip and shows a significant positive correlation, with correlation coefficients (R) all exceeding 0.99. The impact of clothing pressure on sliding is relatively small, and the sliding distance decreases with an increase in clothing pressure. In addition, it has been demonstrated that there is a significant correlation (p < 0.05) between the relative sliding distance of clothing and the stretch ratio of the skin. The study could provide a helpful guideline for the design of smart clothing, and it can provide valuable insights for various applications, such as sportswear and medical apparel.
Introduction
With the rapid development of intelligent wearable technology, smart clothing has become a focal point in the field of apparel research. In the realm of smart clothing, researchers are primarily focused on intelligent textile materials, flexible sensors, and so on, with relatively fewer studies on the integration of rigid sensors with clothing.1,2 Currently, mature products in the market often combine rigid sensors with clothing, such as in smart T-shirts and wearable electrocardiogram monitoring devices, where sensors are commonly either directly adhered or sewn onto the garments.3,4 During the dynamic contact between the human body and clothing, the clothing will slip relative to the human body, which can adversely affect the measurement stability of the sensors. 5
The factors influencing the slippage of clothing on the human body primarily include fabric material properties, clothing pressure, and various other elements. 6 Therefore, in-depth research into these influencing factors holds significant academic and practical value for understanding the patterns and mechanisms of slippage phenomena. Clothing, made of flexible fabric, undergoes noticeable deformation with changes in body posture when worn, forming a complex contact state with the human skin. This complexity makes it challenging to rely solely on experimental methods to observe and analyze slippage behavior. With the continuous development of computer technology, numerical simulation has gradually become an effective tool for studying the relationship between the human body and clothing. Wang et al. 7 proposed a 3D finite element mechanical contact model for the human body and clothing based on the Mindlin–Reissner shell theory. They defined mathematical formulas for the finite element model to describe the strain–stress performance of the 3D human body and clothing system, yielding accurate simulation results. Sun et al. 8 and others analyzed the interaction process between breasts and bras using a newly developed finite element model for contact analysis, with simulated contact pressure showing an error within 6.8% of experimental results. Naqvi and Lewis 9 established a finite element model capable of predicting pressure distribution and transmission underneath blood pressure measurement cuffs. In summary, existing numerical-simulation-based studies on clothing–human body contact mostly focus on pressure simulation, with limited literature reporting research results on clothing slippage. Therefore, the purpose of this study is to employ numerical simulation methods to explore the influence of the fabric properties of tights and clothing pressure on the relative slippage between clothing and the human body. This research aims to provide guidance for the design of smart clothing.
3D Modeling
To obtain an accurate representation of the human body surface, the model is constructed using reverse engineering techniques. Reverse engineering involves processing point cloud data to transform it into the desired 3D solid model. 10 Typically, point cloud data are acquired using a 3D scanner. However, considering the complexity of the human body surface and the practical challenges of scanning areas, such as the armpits, it is often difficult to obtain precise point cloud data. Therefore, this study chooses the human body model within the 3D clothing design software Marvelous Designer as the original point cloud. Marvelous Designer provides editable parameterized human body models, which are generated based on measured actual parameters and exported in .obj format. Subsequently, CloudCompare 11 is used to convert the .obj format to .txt format, thus obtaining accurate human body point cloud data. Finally, the point cloud data are imported into Geomagic Wrap, and through steps such as trimming, wrapping, and surfacing, the 3D model of the upper body torso is obtained. 12 The specific process is illustrated in Figure 1. The modeling of the clothing follows the same method. After the human body and clothing models are completed, UG software is employed for the assembly of the human body and clothing models, and the assembled structure is imported into ANSYS Workbench for finite element analysis.
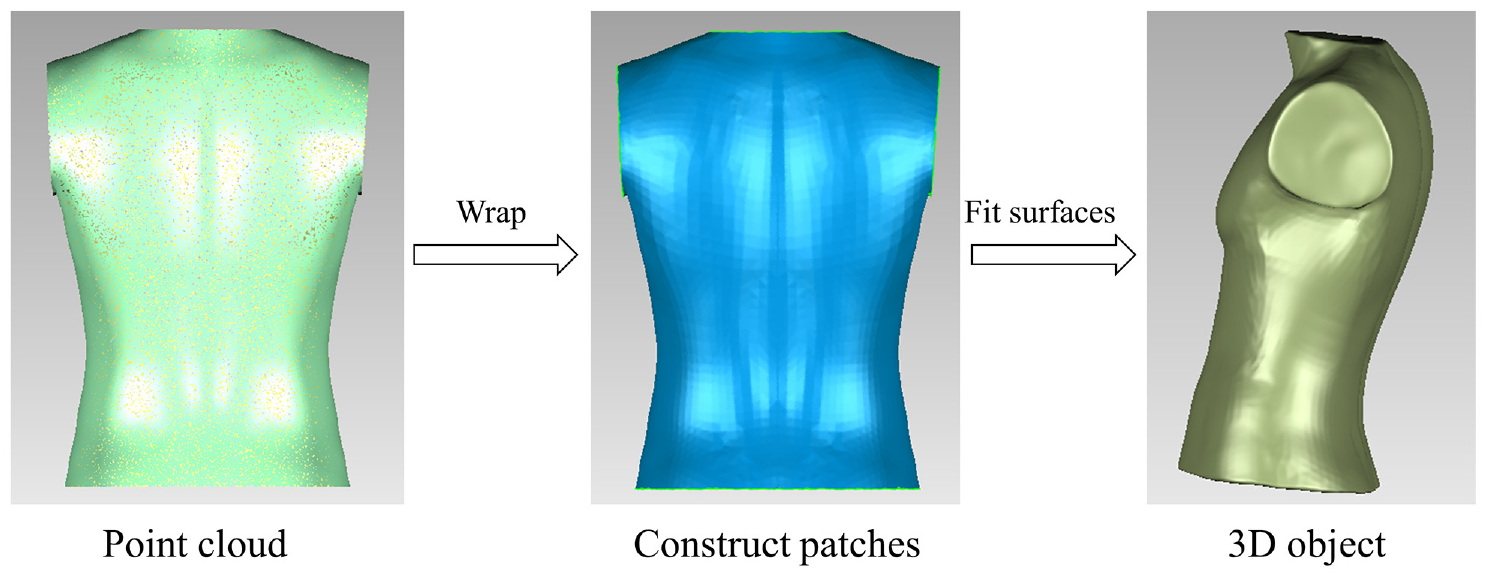
Reverse modeling process.
Finite Element Analysis Parameters
Boundary Conditions
Initial Stress State
When tight-fitting clothing envelops the surface of the human body, the fabric undergoes deformation to adapt to the changes brought about by the curvature of the body and its movements. An infinitesimal element of clothing in contact with the human body is illustrated in Figure 2. During clothing deformation, the internal stresses generated include stretching, shearing, and bending, among others. These stresses manifest macroscopically as pressure along the normal direction of the contact surface with the human body. Currently, theoretical prediction methods play a crucial role in studying the distribution of clothing pressure. Cheng et al. 13 applied the Laplace formula to calculate clothing pressure, with this becoming one of the commonly used theoretical prediction methods for clothing pressure. Hasegawa and Ishikawa 14 proposed a formula for calculating the clothing pressure of elastic clothing. Barhoumi et al. 15 and others introduced additional parameters to modify the Laplace formula, significantly improving the calculation accuracy. The modified formula obtained is shown in equation (1):
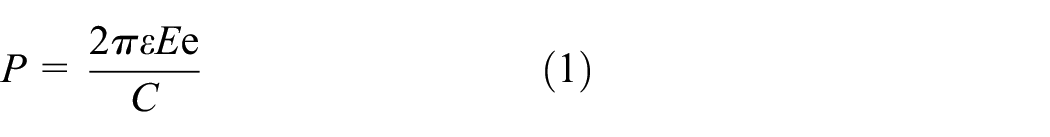
where P is the clothing pressure (Pa), ε is the fabric strain, E is the Young’s modulus of the fabric (MPa), e is the fabric thickness (mm), and C is the body circumference (mm).
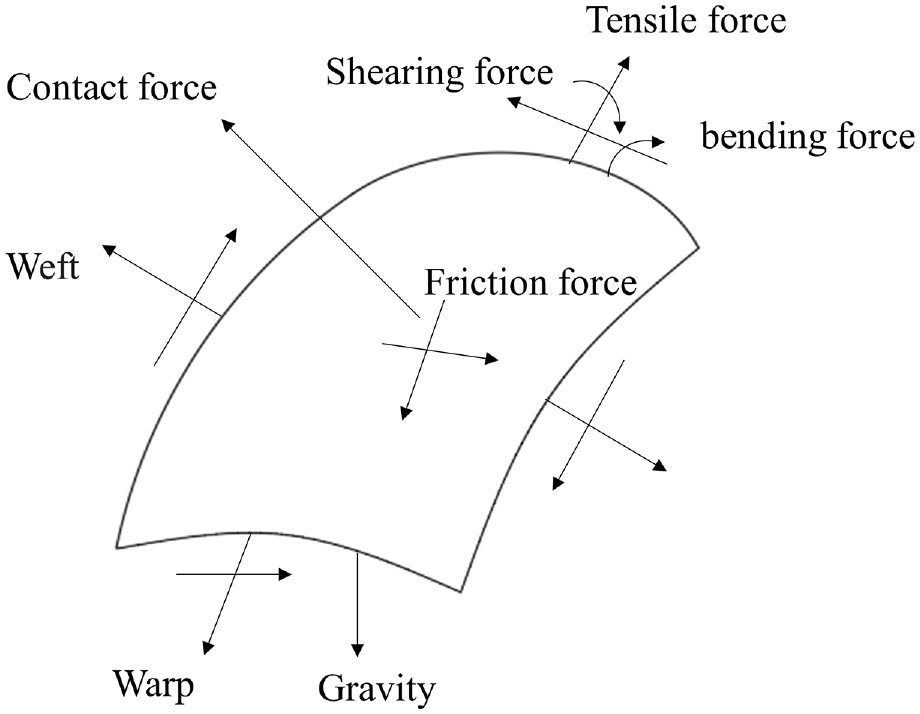
Infinitesimal model of clothing.
During the numerical simulation process, clothing pressure can be used to describe the initial stress state in the dressed condition. Clothing pressure is influenced by various factors, such as the physiological structure of the human body, clothing size, and fabric properties. Therefore, the clothing pressure on different parts of the human body for the same garment may not be identical. In addition, factors such as gender, body shape, and body regions can lead to different ranges of comfortable clothing pressure. Generally, the comfortable clothing pressure range on the male back is between 0.3 and 3.4 kPa. 16 For ease of calculation, this study adopts the assumption that clothing pressure is the same at all locations in the finite element analysis. Gradually, six values—1.0, 1.5, 2.0, 2.5, 3.0, and 3.5 kPa—are set as input parameters for the finite element analysis.
The Mechanical Conditions of Spinal Axial Rotation Movement
The human body surface is composed of complex curves, and the mechanical characteristics of various body parts are influenced by multiple factors when performing different actions. Therefore, it cannot be accurately described by a single numerical value. This study selects spinal axial rotation movement as the main research focus 17 and considers the mechanical description of this movement as one of the boundary conditions for finite element analysis. During spinal axial rotation movement, it is required that the upper arms are raised in front of the chest, the lower limbs are stationary, and the trunk undergoes rotational movement. At this point, the spinal rotation can be simplified into a rotational problem of a rigid body, where the trunk undergoes rotation under the action of a rotational torque, as described by equation (2):
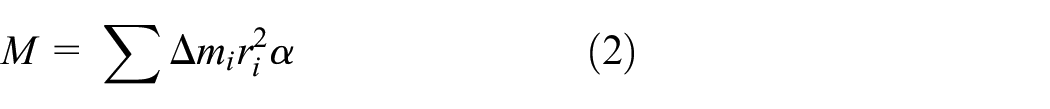
where M is the external force moment (N·mm), ΔM is the mass unit (kg), R is the distance from the mass element to the fixed axis (mm), and α is the angular acceleration (rad/s 2 ).
According to GB/T 17245-2004 “Inertial Parameters of the Adult Human Body,” the rotational inertia of the trunk around the vertical axis is approximately 1.0–2.5 kg·m2, and the angular acceleration during walking or slow running is around 0.1–0.2 rad/s 2 . To describe the rotational torque of the human body under extreme movements, the maximum values for rotational inertia and angular acceleration are considered, resulting in a numerical value for M taken as 500 N·mm.
Material Properties
The human body and clothing are both nonlinear materials, and there is currently no theory that accurately describes their changing relationship. In the field of numerical simulation of the human body and clothing, researchers often consider both as isotropic linear elastic materials, 18 and this assumption is also adopted in this study. The constitutive relationship can be described using the generalized Hooke’s law, as expressed in equation (3):
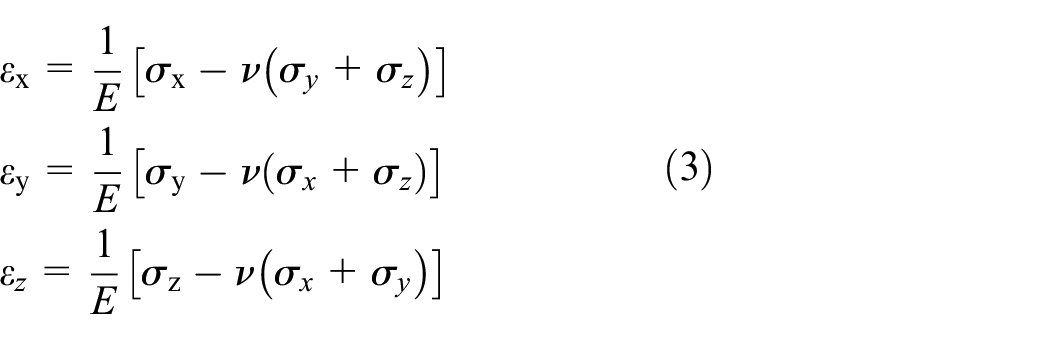
where ε is the strain, ν is the Poisson’s ratio, σ is the stress (MPa), and E is the elastic modulus (MPa).
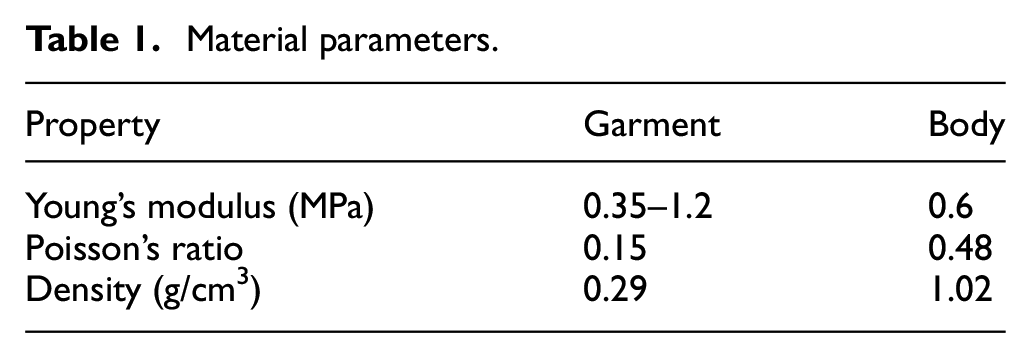
The Young’s modulus of the fabric is measured through a tensile test. A 100% constant elongation tensile test is conducted using the ZQ-990 universal testing machine. The collected data are plotted as a stress–strain curve, and the Young’s modulus (E) of the fabric is obtained by curve fitting, as shown in Figure 3. The fitted stress–strain curves for six common elastic fabrics on the market yield an elastic modulus range of 0.38–1.16 MPa. To ensure a broader coverage of numerical simulation results, values of 0.35, 0.50, 0.60, 0.80, 1.0, and 1.2 MPa are chosen incrementally as input parameters for finite element analysis. The remaining parameters are obtained from the work by Zhou et al., 19 and the specific material properties are shown in Table 1.
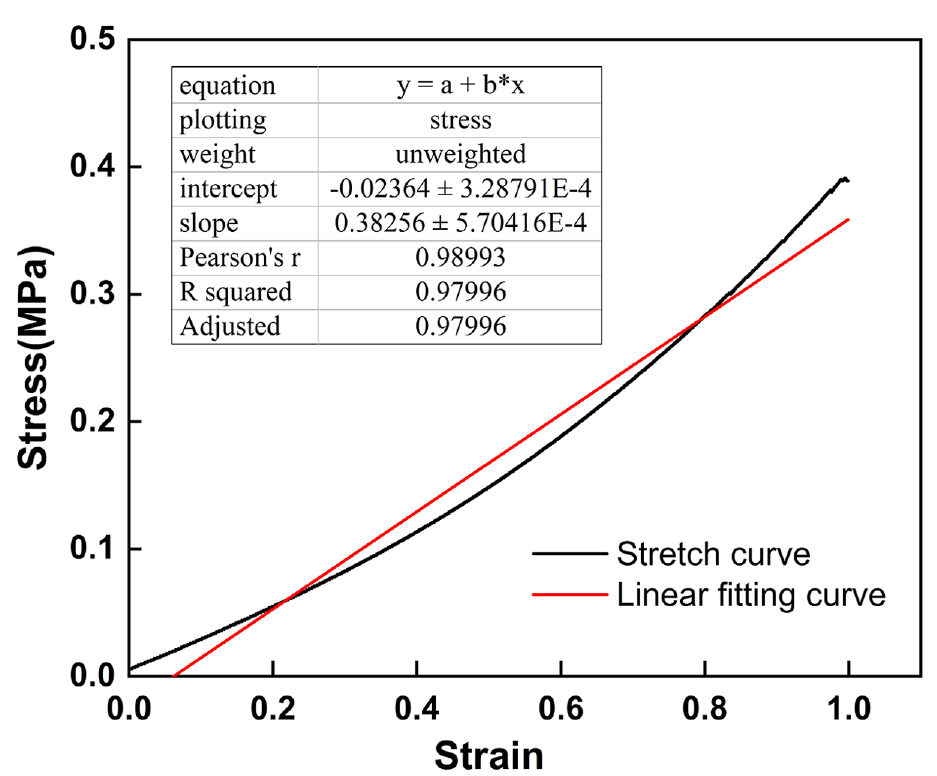
The stress–strain tensile fitting curve.
Material parameters.
Results and Discussion
The numerical simulation is divided into two parts. The first part aims to obtain the slippage behavior under different fabric properties, with the fabric’s Young’s modulus as a variable input. In this case, the initial clothing pressure is set at 1.5 kPa, and the rotational torque is 500 N·mm, while keeping other conditions constant. The second part aims to obtain the slippage behavior under different initial clothing pressures, with the clothing pressure as a variable input. In this case, the fabric’s Young’s modulus is set at 0.60 MPa, and the rotational torque is 500 N·mm, while keeping other conditions constant.
Simulation Results for Different Fabrics
Through the computational analysis using Workbench, the relative sliding distances of tight-fitting garment made from fabrics with different Young’s moduli under the same boundary conditions were obtained. The results are illustrated in Figure 4. From the figure, it can be observed that during the right rotation movement of the human spine, the location where the tight-fitting garment has the maximum relative sliding distance from the body is at the left scapula. This is because, during the right rotation movement, the arm exerts a certain stretching force on the scapula, causing the maximum skin deformation rate at this location. As a result, the tight-fitting garment at the scapula undergoes significant deformation and sliding to adapt to this change. Overall, the sliding distance gradually decreases from top to bottom, and the relative slip at the waist and abdomen is minimal or almost nonexistent.
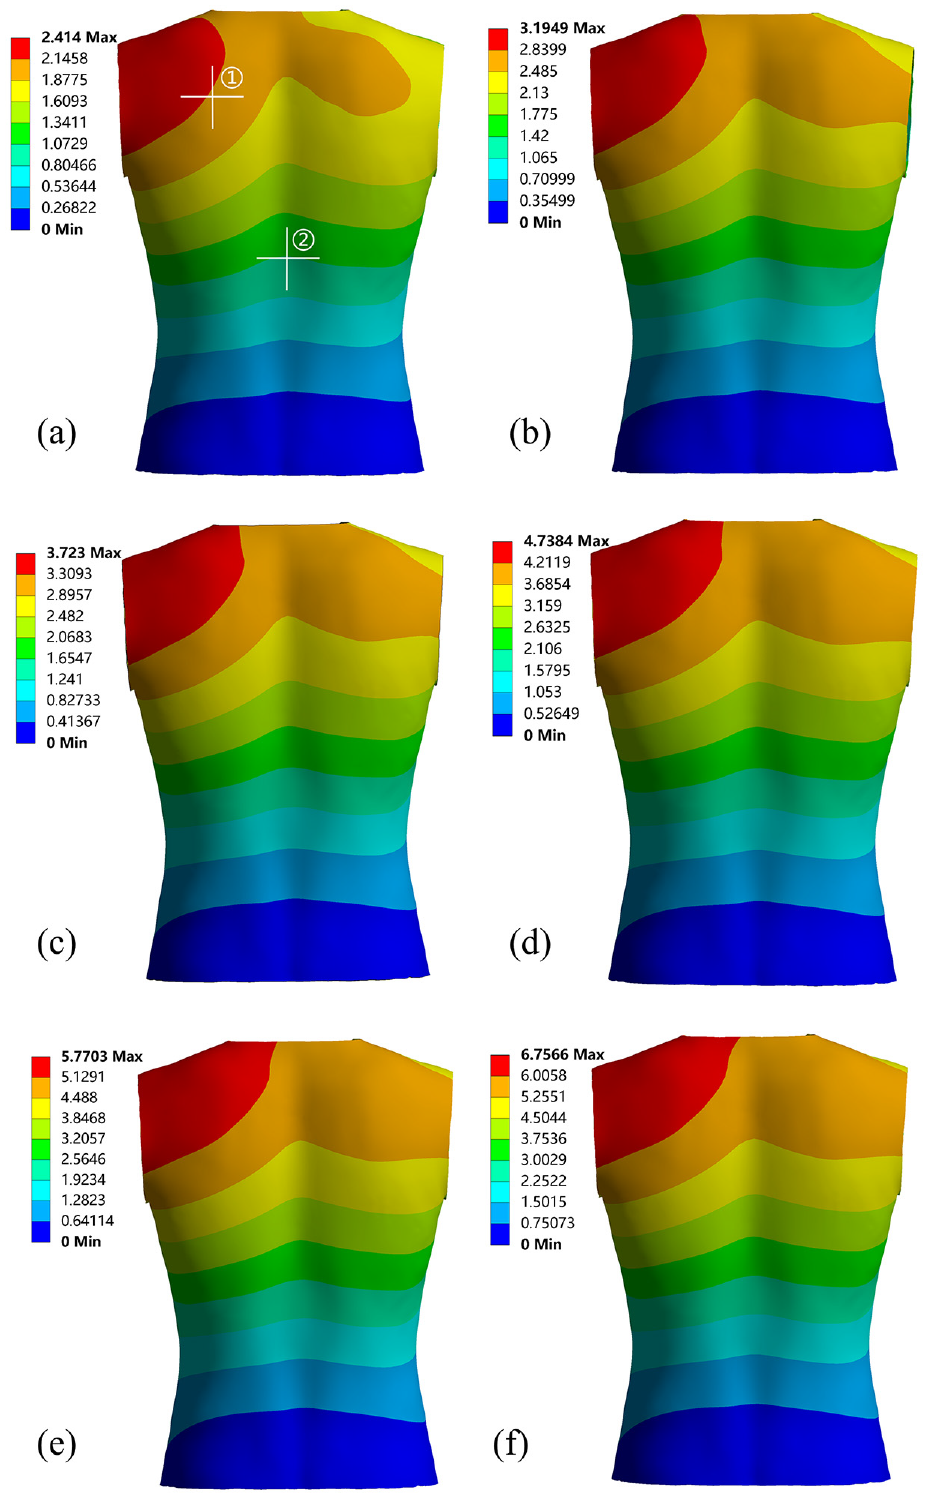
Simulation results for different fabrics: (a) 0.35 MPa, (b) 0.50 MPa, (c) 0.60 MPa, (d) 0.80 MPa, (e) 1.0 MPa, and (f) 1.2 MPa.
Two monitoring points on the back of the human body, labeled as 1 and 2 in Figure 4(a), were selected. The probe tool in Workbench was used to read the values at these monitoring points. The results indicate that when the fabric’s Young’s modulus ranges from 0.35 to 1.2 MPa, the sliding distance at monitoring point 1 is between 2.13 and 6.11 mm, while the sliding distance at monitoring point 2 ranges from 1.06 to 3.30 mm. Figure 5 illustrates the variation in sliding distances at monitoring points 1 and 2 for different Young’s modulus fabrics. It is evident from the figure that there is a significant linear positive correlation between the sliding distance and the fabric’s Young’s modulus. Using the least squares method for linear fitting, the correlation coefficients are all above 0.99, and the obtained linear equation is represented by equations (4) and (5):


where y is the slip distance and x is the fabric’s Young’s modulus.
Sliding distance for different fabrics.
Under the same initial stress conditions, the relative sliding distance between the tight-fitting garment and the human body increases with the increase in fabric’s Young’s modulus. This indicates that, under otherwise similar conditions, fabrics with higher Young’s modulus require greater tensile force during movement due to fabric stretching. As a result, the garment is more inclined to slide rather than undergo fabric deformation.
Simulation Results for Different Initial Stresses
For the same fabric and under identical boundary conditions, the different initial stress states of the garment also have a certain impact on the relative sliding distance between the human body and the tight-fitting garment. Figure 6 presents the simulation results under different initial stress conditions. From the figure, it can be observed that as the garment pressure increases, the relative sliding distance between the tight-fitting garment and the human body gradually decreases. This is because a higher clothing pressure indicates greater surface pressure on the human body, and under the same friction conditions, the friction force during relative slip increases. This leads to a preference for garment deformation rather than sliding during movement.
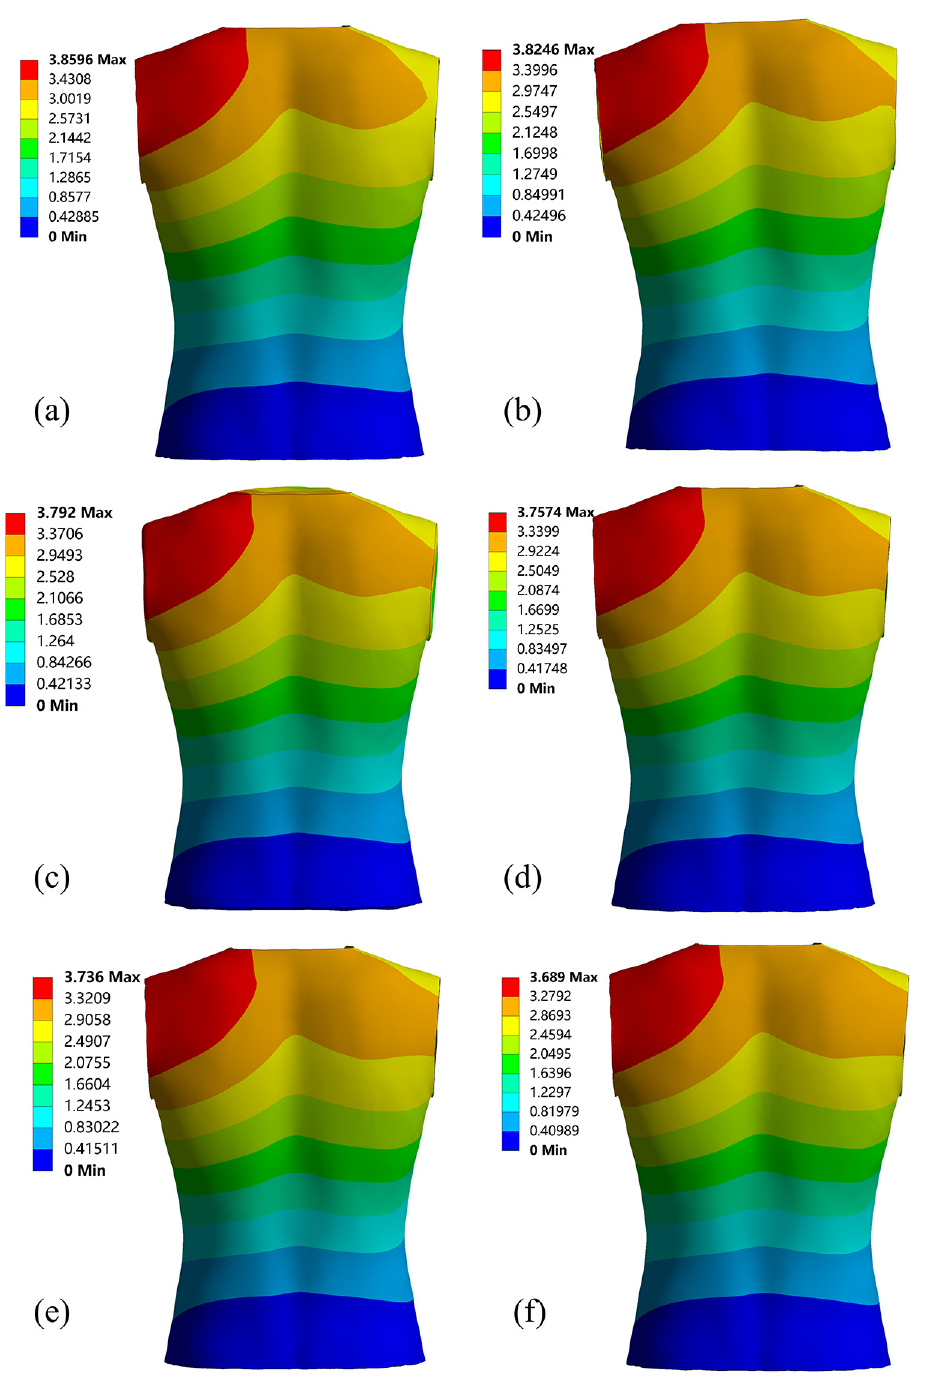
Simulation results for different initial stresses: (a) 1.0 kPa, (b) 1.5 kPa, (c) 2.0 kPa, (d) 2.5 kPa, (e) 3.0 kPa, and (f) 3.5 kPa.
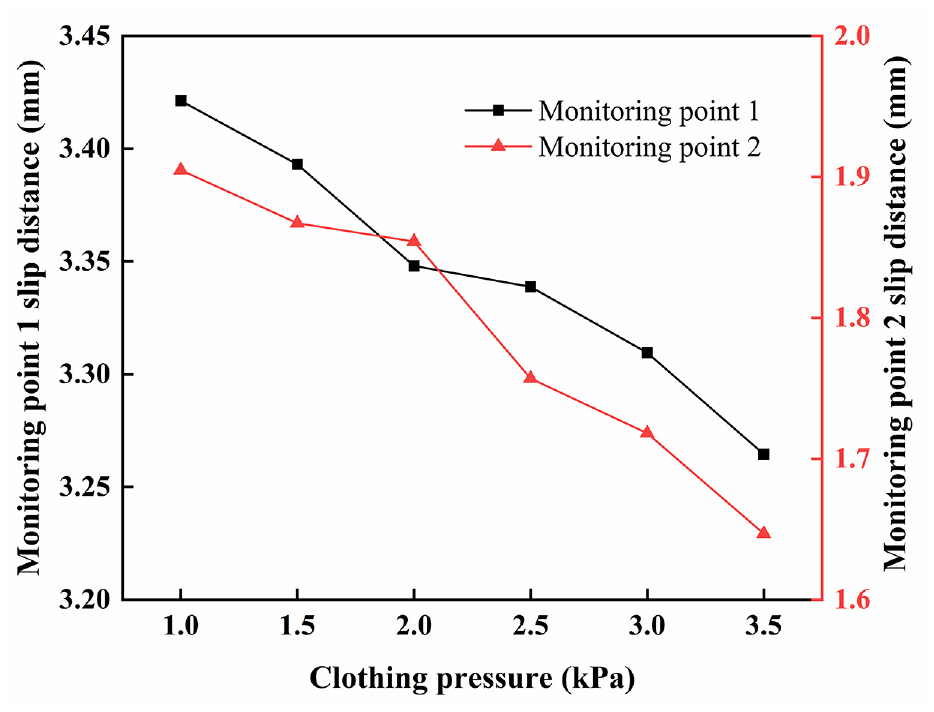
The same method was applied to collect and analyze sliding data for monitoring points 1 and 2, and the specific results are shown in Figure 7. When the initial clothing pressure of the tight-fitting garment is between 1.0 and 3.5 kPa, the sliding distance at monitoring point 1 ranges from 3.26 to 3.42 mm, and at monitoring point 2, the sliding distance ranges from 1.65 to 1.90 mm. Overall, within the analyzed range of clothing pressure, the variation in sliding distance does not exceed 5% of the maximum sliding distance. Therefore, under similar conditions, the impact of initial garment pressure on sliding is relatively small within a certain range.
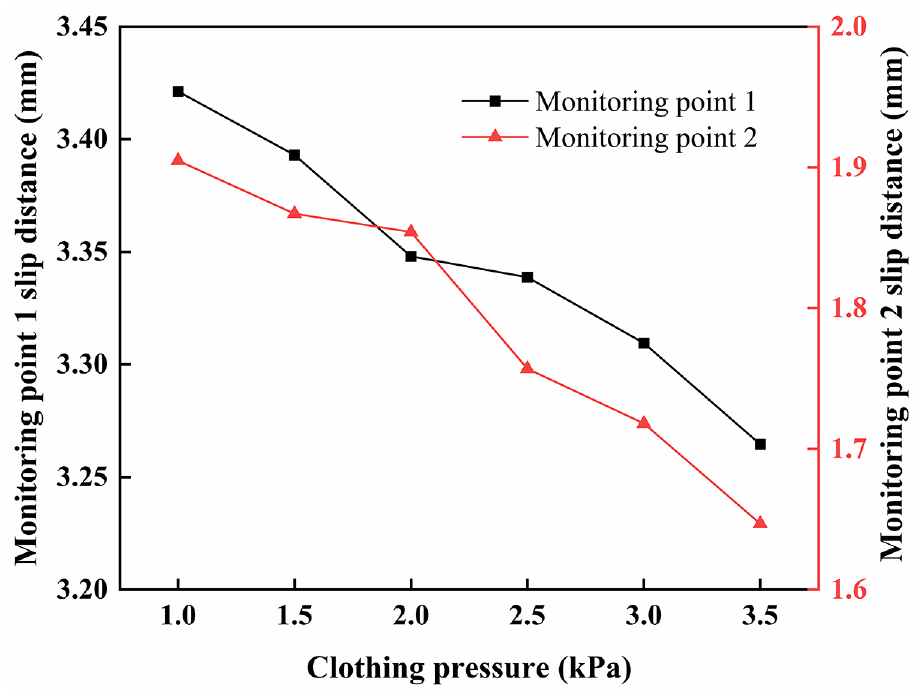
Slip distance for different initial stresses.
Skin Stretching Experiment
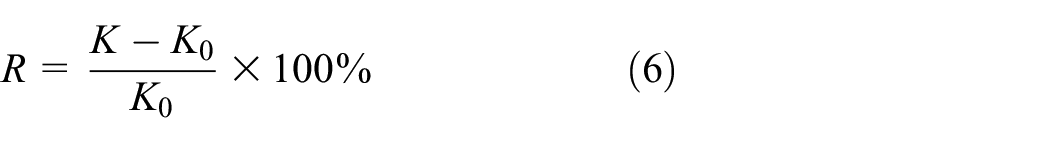
During the human body’s movement, the skin undergoes non-uniform stretching in different areas. To investigate the stretching of the skin on the back during body movement, quantitative analysis can be conducted using the surface marking method. In addition, the correlation between this stretching and the relative slip of clothing can be explored. First, as illustrated in Figure 8, longitudinal and transverse reference lines are drawn on the back. Then, a flexible ruler is used to measure and record the length (K0) of the reference lines in a static standing position. Finally, when the spinal axial rotation movement reaches its maximum angle, the length of the reference lines (K) is recorded. This measurement is repeated three times, and the average is taken as the final result. The skin stretch ratio (R) can be calculated using equation (6):
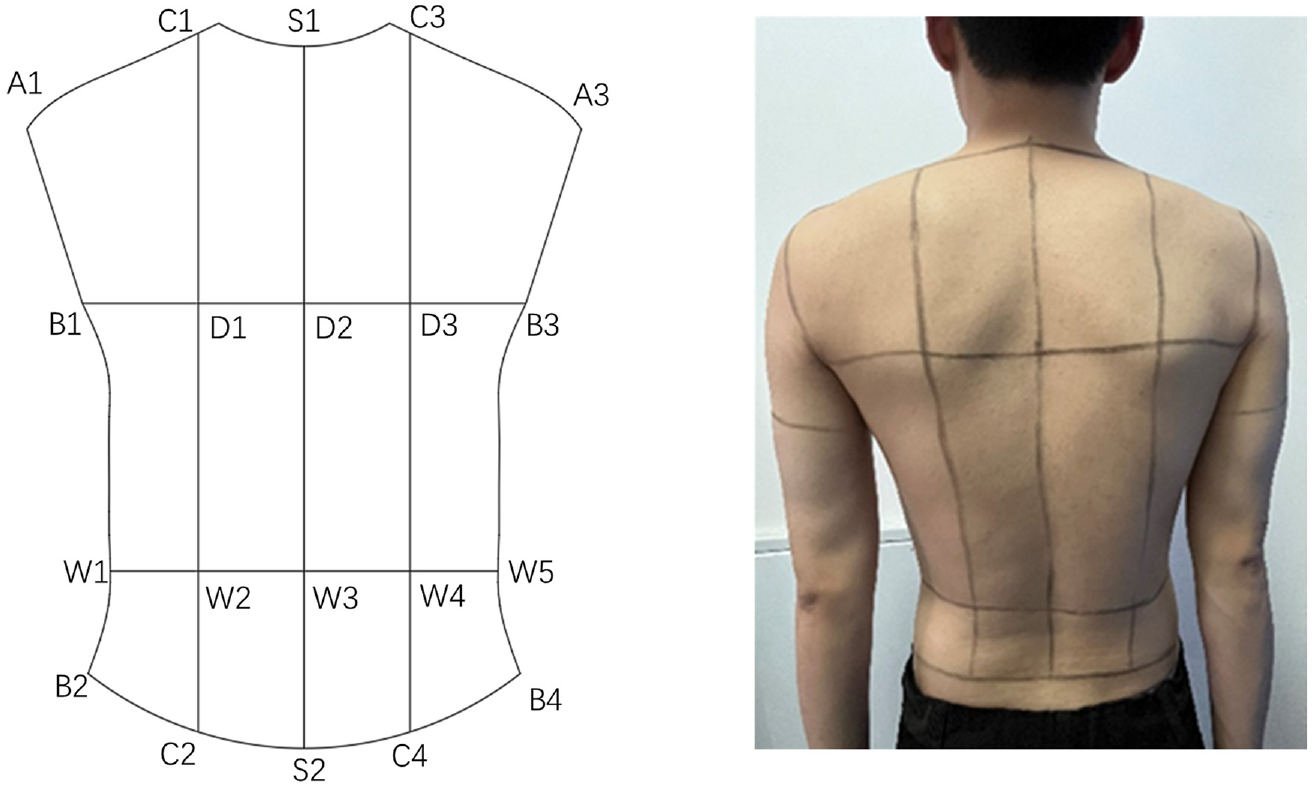
Marking lines on the human body.
Through preliminary experiments, it was found that the horizontal skin stretch rate exhibits significant changes during movement. Therefore, the lines marked as A1S1, A3S1, B1D2, B3D2, W1W5, and B2B4 were selected for comparative analysis with relative slip data. The relative slip data are based on the results obtained from the section “Simulation Results for Different Fabrics” when the Young’s modulus is 0.60 MPa and the initial clothing pressure is 1.5 kPa. The values at the midpoint of each marked line were obtained using a probe tool and recorded as the slippage value at that marked line, as shown in Figure 9.
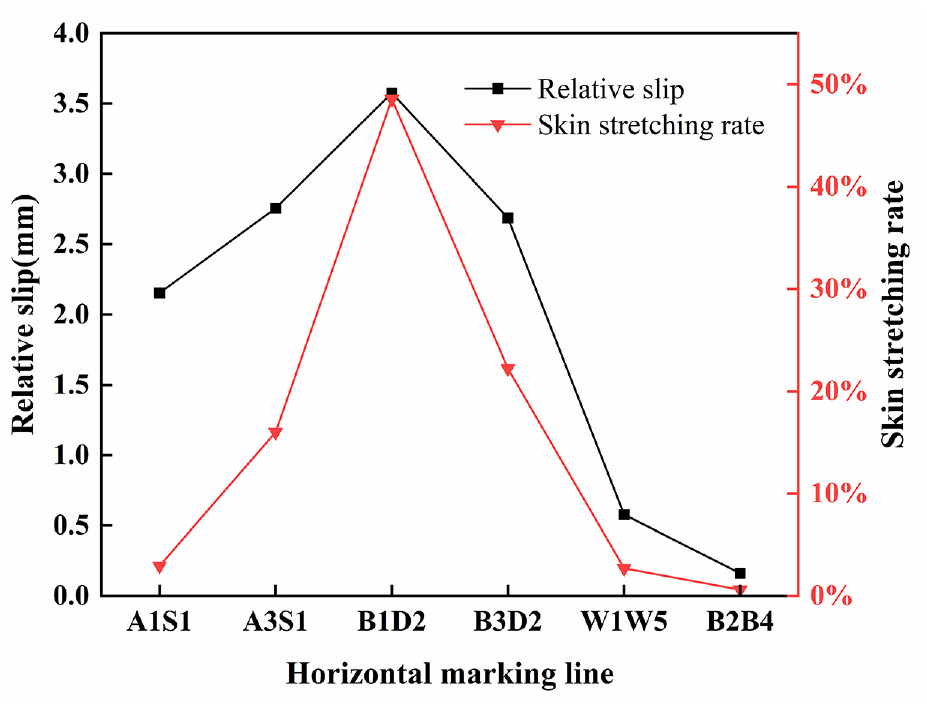
Comparison of skin stretching rate and relative slip.
During the right rotation of the spine, the maximum skin stretchability on the human back is 48.5%, occurring at the B1D1 marked line, while the minimum skin stretchability is 0.2%, observed at the B2B4 marked line. The numerical simulation results indicate that the maximum slippage occurs at the left scapula, and the minimum slippage occurs at the lower back. This suggests that the overall trends in relative slip between clothing and the human body align with the changes in skin stretchability, demonstrating a strong correlation between the two. To further validate this correlation, Pearson’s correlation analysis was conducted between transverse skin stretchability and relative slip, 20 with the results presented in Table 2.
Correlation analysis results.
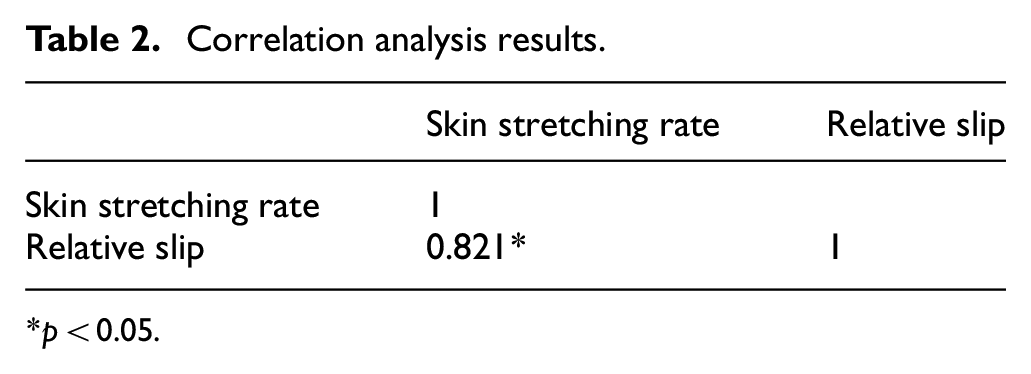
p < 0.05.
As indicated in the above table, the correlation coefficient between skin stretchability and relative slip is 0.821, showing significance at the 0.05 level. This implies a significant correlation between skin stretchability and relative sliding distance. It suggests that when there is considerable stretching in the skin at a particular location during movement, there is a corresponding significant slippage between the clothing and the human body at that specific location.
Conclusion
This study established a 3D model of the upper body torso and tight-fitting clothing through reverse engineering. Based on this model, numerical simulation methods were employed to investigate the influence of clothing pressure and fabric’s Young’s modulus on relative sliding. The key conclusions of the study are summarized as follows:
The relative sliding distance between tight-fitting clothing and the human body increases with the increase in the fabric’s Young’s modulus. When the Young’s modulus of the fabric is between 0.35 and 1.2 MPa, the sliding distance at monitoring point 1 ranges from 2.13 to 6.11 mm, and at monitoring point 2, it ranges from 1.06 to 3.30 mm.
With identical fabric, a higher initial clothing pressure results in a smaller relative sliding distance. When the initial clothing pressure is between 1.0 and 3.5 kPa, the sliding distance at monitoring point 1 ranges from 3.26 to 3.42 mm, and at monitoring point 2, it ranges from 1.65 to 1.90 mm.
There is a significant correlation (p < 0.05) between the relative sliding distance of clothing and the skin stretching ratio.
The results indicate that finite element analysis has achieved favorable outcomes in exploring the issue of relative sliding between the human body and clothing. In future research, it is advisable to consider incorporating additional influencing factors, such as material anisotropy and different body movements, to obtain more comprehensive results.
Footnotes
Declaration of conflicting interests
The author(s) declared no potential conflicts of interest with respect to the research, authorship, and/or publication of this article.
Funding
The author(s) received no financial support for the research, authorship, and/or publication of this article.