
Abstract
Natural dye was extracted from the petals of orange-colored marigold flowers in aqueous medium, and extraction process parameters were optimized based on the color yield (optical density) of an aqueous extract of marigold petals. The extracted natural colorant was used to dye jute fabric and characterized by ultraviolet–visible spectroscopy. Extracts from gallnut and natural alum (fitkiri) were applied as mordants onto the bleached jute fabric by padding method followed by drying in air. The fabrics were treated with the mordants separately before dyeing, and then, both mordants were applied in sequence. Jute was premordanted first with gallnut followed by alum. Jute fibers were mordanted prior to dyeing with either gallnut or alum or both mordants (gallnut followed by alum treatment). Premordanted jute fabric was dyed with the natural dye extracted from marigold petals, and process conditions were standardized. The dual-mordanting process was found more effective to produce better color yield than the single mordanting process. Standardization of the process conditions was also examined statistically by the Box–Behnken design method after choosing the significant variables by the Plackett–Burman design method. The standardized dyeing process conditions were found to be dyeing temperature: 90°C; material to liquor ratio: 1:40; dyeing time: 60 min; dye concentration: 30% o.w.f.; and pH: 11.
Introduction
Natural dye has in recent time attained global attention owing to increased public debate on ecological safety. Natural dyes are biodegradable, less hazardous to the human body and environment, and capable of producing textiles colors that are soothing to the eye.1,2 However, all natural dyes are not to be considered as toxicity-free or nonhazardous without analysis of their components and their effect on human/aquatic life. Some of the natural dyes are reported to have medicinal value and have antimicrobial or ultraviolet (UV)-resistant effects too. Marigold petal is used for holy festivals and prayers by many people and is still not reported to have any adverse effect on human life though some reported toxicity of lutein/carotenoids has been reported.3–5
Jute is an important natural fiber grown in South Asia (mainly the eastern part of India and Bangladesh) for numerous industrial applications. It is the second most frequently grown plant-based fiber next to cotton worldwide. Jute is a multicellular natural fiber, chemically ligno-cellulosic in nature having about 60–64% cellulose, 20–24% hemicelluloses, and 12–14% lignin. The high numbers of hydroxyl groups of cellulose and hemicelluloses besides glucuronic acid groups of hemicelluloses having both –COOH and –CHO groups in it and a number of phenolic hydroxyl groups and the –C=C unsaturation present in lignin make jute fiber highly dye-absorptive for different classes of dyes including natural dyes with or without suitable mordants. The objective of this work is, therefore, to minimize the requirement of a minimum amount of metallic mordant for optimum color strength (K/S values) in a more eco-friendly and less polluting process. Though it is mostly used for bulk packaging, that is, sacking, nowadays its application in home furnishing and decorative items is on the rise. 6 Jute, having its major constituents as cellulose, hemicellulose, and lignin can be dyed with a wide range of dyes. 7 The dyeing properties of jute are different from those of other cellulosic fibers like cotton owing to the differences in their chemical compositions and fine structure of fibers. There is also a demand for naturally dyed jute materials. Barring a few discerning works8,9,there is a dearth of research articles analyzing the dyeing characteristics of jute dyed with natural dyes detailing the exact chemistry of color components of natural dyes, the optimized extraction method of dyes, standardized dyeing parameters, the physical chemistry of dyeing, and fastness properties.
The dyeing of textiles with a natural dye generally requires a chemical assistant named a mordant. Most mordants used in practice are metallic salts, some of which are hazardous pollutants. Application of bio-mordants has several advantages such as ecological sustainability, biodegradability, and being no/less harmful to living beings.10,11 Bio-mordants in general have tannins/flavonoid components which have in their molecules mordanting capacity polyphenols/carboxylic acid groups. Though works on the use of bio-mordants in natural dyeing are available in the literature, there is almost no such critical work on studies of dyeing properties for the application of bio-mordants and metallic salts in a dual-mordanting method.
Gallnut (Quercus infectoria L) has been chosen as a bio-mordant in the present work. Gallnut has poly-phenolic structures containing gallic acid, ellagic acid, and so on as shown in Figure 1. 12 These poly-phenolic compounds render gallnut a good mordant, but it is not considered as a good dye as it produces light yellow color with poor fastness. Natural alum, a widely used substance with no reported harmful effects, is used as the other mordant with gallnut to produce a more synergistic effect.
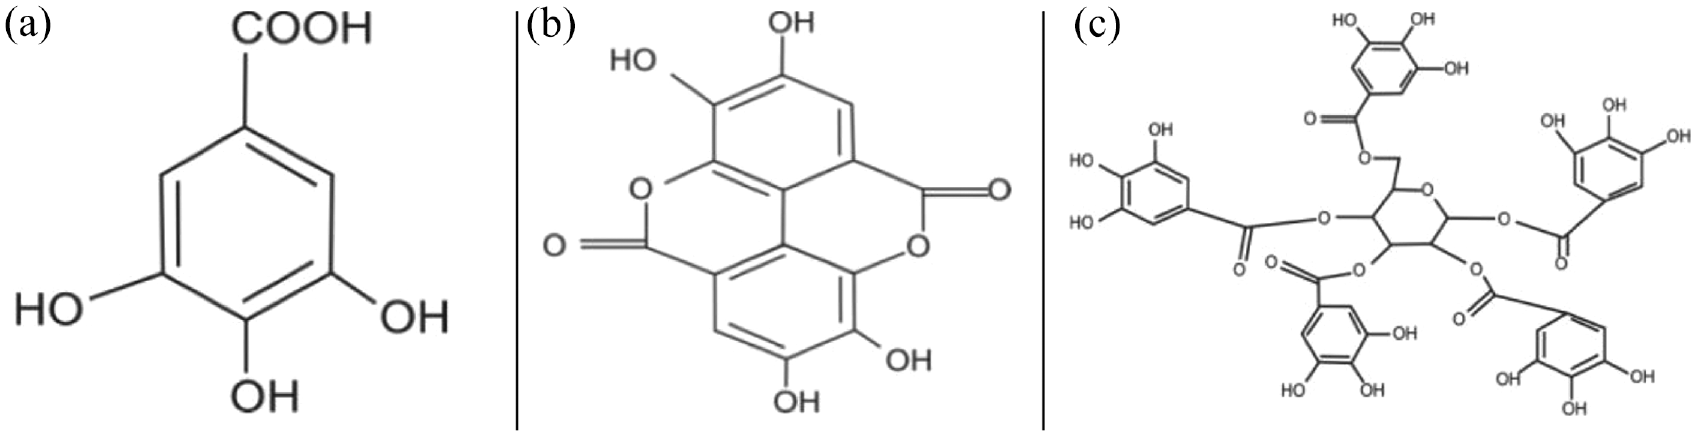
Structure of polyphenols present in gallnut: (a) gallic acid; (b) ellagic acid; and (c) gallotannins (hydrolyzable).
One of the most abundantly used flowers in world is marigold. It has potential to yield significant amount of natural colorant. It is widely used in rituals and functions, and then is consigned as wastage. Hence, natural dyeing using marigold petals can be a value addition to this waste flower as an environmentally cleaner disposal method.13–15 The main coloring component of the marigold petal is lutein (C40H56O2), a carotenoid compound whose structure is shown in Figure 2. 16 Lutein, a carotenoid, naturally occurs in acetylated form and lutein esters in marigold flower vary from 4 to 760 µg/g. 17 There is no literature available to examine the usage of marigold petals as natural dye on jute.
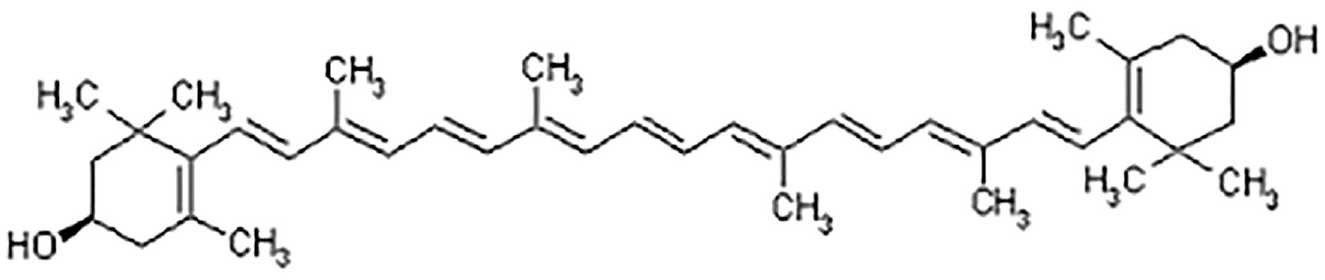
Chemical structure of lutein presents in marigold petals.
Keeping all the information in mind, the present work envisages dyeing jute fabric with the extract of marigold petals after mordanting the fabric with gallnut (bio-mordant) and alum. Jute fiber being dyed with a natural resource after mordanting in a binary system is something not reported earlier. Hence, the whole process performance from starting with the standardization of extraction variables of dye from marigold flower petals to assessment of mordanting and finally standardization of the dyeing process conditions has been studied in this present article.
Experimental
Materials
Fabric: Bleached jute fabric of 47 ends/dm (warp count: 7.65 lb/spy) and 42 picks/dm (weft count: 8.23 lb/spy), 260 g/m2 area density was used.
Natural dye (orange-colored marigold flower): Petals of orange-colored marigold flowers (Botanical name: Tegetus erecta; local name in Bangla: gnaada phul, and in Hindi: genda phul) were procured from local market in Kolkata.
Bio-mordant (gallnut): Gallnut is the fruit of the plant Quercus infectoria L. Gallnuts were procured from a local shop in Kolkata.
Inorganic mordant (alum): Natural alum (aluminum potassium sulfate, [KAl(SO4)2.12H2O]; local name: fitkiri in Bangla) was procured from a local shop in Kolkata.
Auxiliary chemicals: Laboratory reagent grade acetic acid and sodium carbonate (for adjustment of pH), methanol, and neutral detergent were procured from M/s Ma Kali Chemicals, Kolkata. Distilled water was prepared at laboratory.
Methods
UV-Vis Spectral Analysis
Spectral scans of the aqueous extract of marigold flower petals in the wavelength range of 400–700 nm were carried out using an absorbance spectrophotometer (make: Shimadzu, Japan, Model: UV-1800). The spectral scan is shown in Figure 3. The peak of maximum absorbance was found both at 410 nm having absorbance value 2.3 and also at 422 nm having absorbance value 2.29. Between the two peaks, the peak at 422 nm was chosen for experimental purpose as the absorbance value is almost the same as the peak at 410 nm. So, the maximum absorption peak was considered at 422 nm (corresponding to λmax). Similarly, colorant was extracted from marigold petal by aqua-methanolic (water:methanol:: 50:50) extraction method.
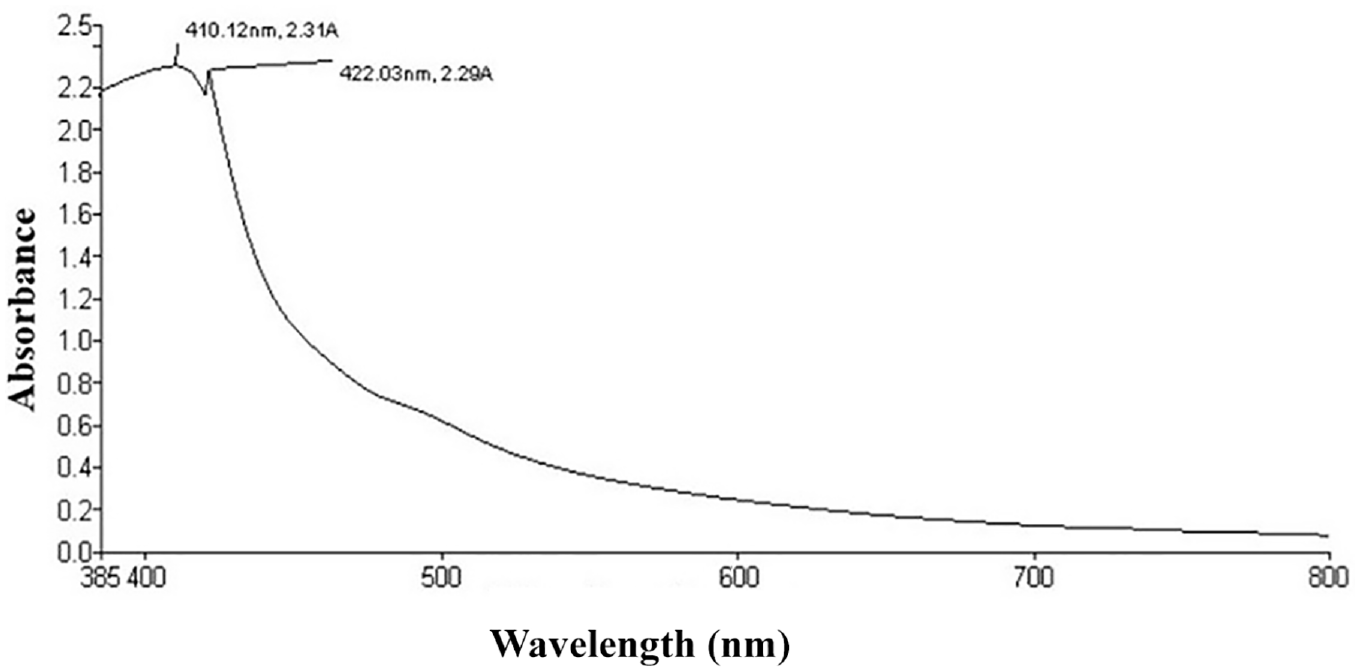
Visible spectra of aqueous-based solution of natural dye from marigold petals.
The principle of measuring the optical density (OD)/absorbance of the dilute liquid extract (dilution at the level of 0.1% extract) of natural colorant was measured as per the Beer–Lambert law as follows using Shimadzu, Japan, Model: UV-1800 absorbance spectrophotometer.

where I0 = intensity of the incident light; It = intensity of the transmitted light; c = the concentration of absorbing substance/solute in the solution, b = the path length/the distance the light is passing through the absorbing solution, and ε = proportionality constant dependent upon the absorbing substance, the wavelength of light used, and the units used to specify c and b.
The maximum absorbency value at corresponding wavelength (λmax at 422 nm) for the filtered aqueous-based extract of the marigold petals natural dye was measured following the Beer–Lambert law using a Shimadzu UV-Vis 1800 double-beam absorbance-type spectrophotometer.
Extraction of Natural Dye From Marigold Flower Petals
The petals of marigold flowers were cut into small pieces, dried in the sun, and then pulverized to a powder in a mechanical grinder. Dried powder of petals was subjected to an aqueous medium under varying conditions, namely temperature of extraction liquor: 30°C – 100°C, time of extraction: 30 – 60 min, material-to-liquor ratio (MLR): 1:20 to 1:30, and pH of the dye liquor: 3 – 13 for optimizing the process variables for extraction of color components. The aqueous extract of marigold petals has been filtered in each case.
Bio-Mordanting of Jute Fabric With Gallnut
Gallnut powder was heated at 80°C for 45 min at pH 11 in an aqueous medium having an MLR of 1:10. This is the optimized condition for extraction of tannins from gallnut. 18 Bleached jute fabric was premordanted (mordanting done before dyeing) with various concentrations of gallnut extract so that different add-ons of the gallnut onto the fabric can be achieved. The mordanting process was carried out by dipping the fabric into gallnut extract and then squeezing using a padding mangle and finally dried in air without washing.
Mordanting With Alum
Bleached jute fabric before dyeing was mordanted with aqueous solution of natural alum with varying concentrations of alum so that different add-ons of alum can be obtained on the jute fabric. Like with gallnut, the mordanting process with alum was carried out by dipping the fabric into aqueous solution of alum followed by squeezing through a padding mangle and then dried in air without washing.
Dyeing With Aqueous Extract of Petals of Marigold Flower
For experimental purpose, jute fabrics premordanted with only gallnut; jute fabrics premordanted with only alum; and jute fabrics premordanted with gallnut followed by mordanting treatment with alum were dyed with the optimized dye extract of marigold flower petals under different process variables (namely dye concentrations, pH, MLR, time of mordanting, and temperature of liquor). To vary one process parameter, the other parameters remained constant, and with fixed concentration of the dye (10% dye solution made of powder of marigold petal). After completion of dyeing, the fabric was rinsed in cold water followed by soaping using 2 g/L nonionic detergent dissolved in water at 1:50 MLR at 60°C for 15 min, and then, it was again rinsed in cold water and dried in air.
Characterization of Dyed Fabric
American Society for Testing and Materials (ASTM) D5035:2006 method was followed for measuring tenacity of the dyed jute fabric in the warp and weft direction in strip test method. Color strength (K/S at λmax) and other color-related parameters such as ΔE, ΔL, Δa, Δb, ΔC, ΔH, metameric index (MI), and brightness index (BI) of the dyed jute fabrics were measured using a reflectance spectrophotometer (Make: Premier Colorscan; Model: S-5100A) using the Kubelka–Munk equation and Commission internationale de l’éclairage (CIE)-laboratory equations, 1976. 8 However, K/S is the measure of color strength of a dyed material through reflectance spectrophotometer using the Kubelka–Munk theory. Among the different color parameters, the dye concentration versus K/S values are linear and additive. Hence, the prediction of K/S values for the corresponding variation in dyeing process variables is easier to calculate for linear and additive relationships. Hence, this color parameter was chosen as major output response variable for dyed products for any variation in dyeing process variables.
Colorfastness to wash and colorfastness to rubbing of the dyed jute fabrics were measured using test standards IS: 764:1984 and IS: 766:1984, respectively. Lightfastness of the dyed jute fabrics was measured using IS: 2454–1984. Jute fabrics were cut into small pieces and mixed with spectral analysis grade KBr to make pellets of the samples by grinding with a mortar.
Fourier transform infrared (FTIR) spectra of dye powder and fabric samples were scanned by a FTIR spectrometer (make: Shimadzu, Model: IRPrestige-21 using an IR Tracer-100 beam splitter with germanium-coated KBr plate for middle IR and with germanium crystals). A FTIR spectral scan of each spectrum was recorded in the 4000–500 cm−1 range with a resolution of 4 cm−1.
The breaking strength of the fabric samples were measured following the IS: 1969–1968 method.
Statistical Optimization
Screening of Dyeing Process Variables Using Plackett–Burman Design
Plackett–Burman design (PBD) is an effective statistical tool for selecting the significant factors having maximum impact on the process outcome (16). Six independent input factors namely (1) mordant concentration, (2) dye concentration, (3) pH, (4) temperature, (5) time, and (6) MLR were varied (ranges of variation of each parameter are mentioned in Table 1), and their effect on color yield (in terms of color strength, i.e. (K/S) value as major output parameter) was examined at 95% confidence level in a single replicate with 12 experimental runs to choose the three most significant factors (process variables) that influence the output factor, that is, color strength (K/S) of the dyed jute fabric. 19 Every input variable was examined at the lowest (−) and highest (+) levels (Table 1).
Values of input process variables (factors) for PBD.
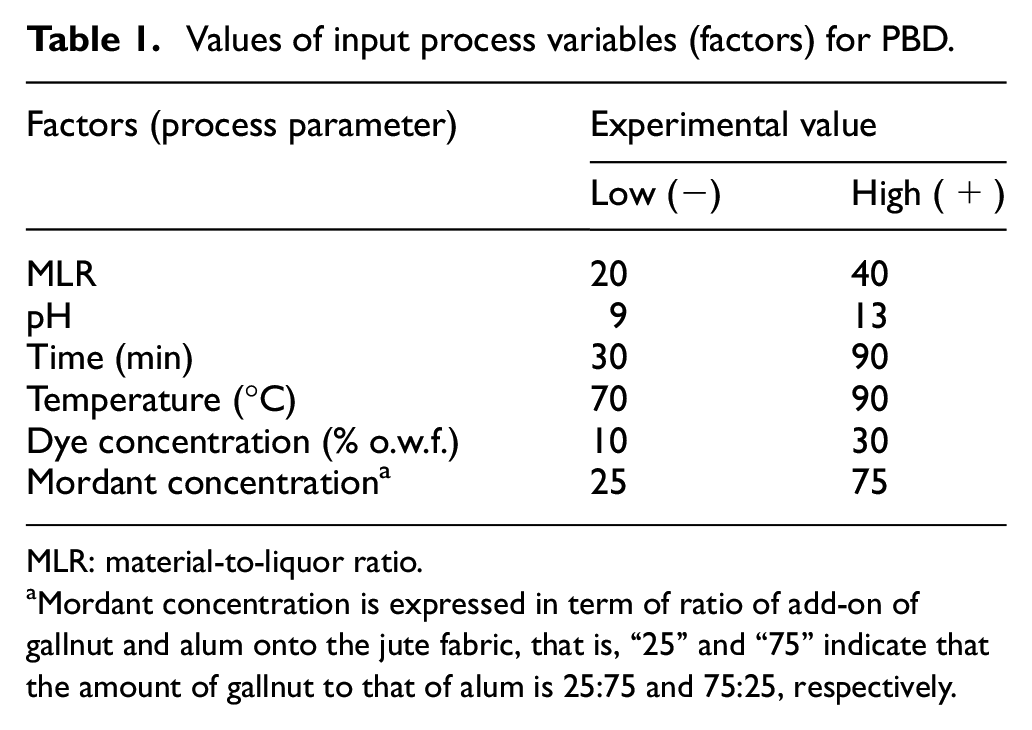
MLR: material-to-liquor ratio.
Mordant concentration is expressed in term of ratio of add-on of gallnut and alum onto the jute fabric, that is, “25” and “75” indicate that the amount of gallnut to that of alum is 25:75 and 75:25, respectively.
Minitab Statistical Software (version 21.1), Pennsylvania, USA, was used for the statistical analysis of the above experimental data.
Assessment of Process Variables by Regression Analysis Using Response Surface Methodology With Box–Behnken Design
The three most significant input factors of the dyeing process were chosen with the help of PBD. Then, the selected three factors were analyzed by analysis of variance (ANOVA) and regression analysis by response surface methodology (RSM) with Box–Behnken design (BBD) to analyze the interactive effect of those factors on the response factor, that is, K/S. Each factor was assessed at three levels: center points (−1, 0, and +1). 20 All the data of process conditions were fitted into the second-order regression equation 21 (18). Minitab Statistical Software (version 21.1), Pennsylvania, USA, was also used here for the statistical analysis of BBD of the above experimental data.
Results and Discussion
Characterization of Extracted Colorant From Marigold Petals
There was no specific difference in peaks in the visible zone of spectral graph found in the aqueous extraction and by aqua-methanolic (water:methanol:: 50:50) extraction of the dye powder of marigold petals, though they varied in the peaks in the UV zone, indicating that no other colorant than lutein is extractable in both aqueous and aqua-methanolic extraction, but there are some extractable UV-resistible components for addition of methanol. For confirmation of extracted colorant material as lutein or not, the aqueous extract of lutein was subjected to soxhleting for 10 cycles for 2 h and the remaining purified extracted dye powder was subjected to a FTIR spectroscopic scan and the observed FTIR spectroscopic scan confirmed that it was lutein.
The FTIR spectroscopic scan of extracted colorant from marigold petals is shown in Figure 4.
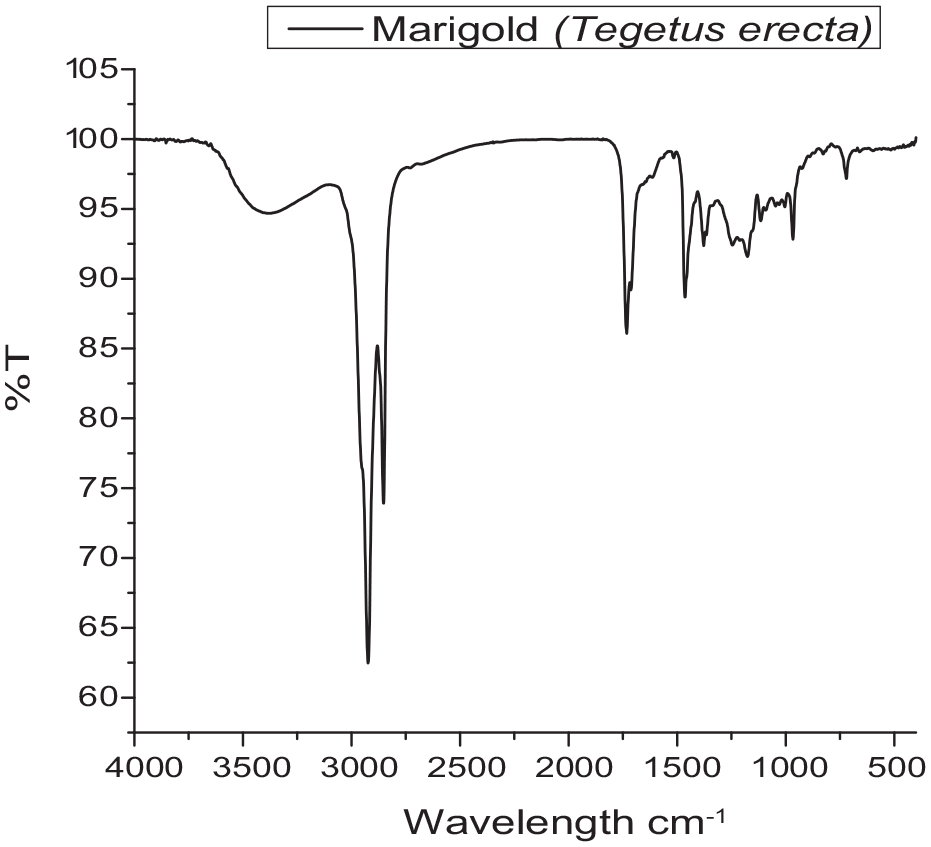
Fourier transform infrared spectral scan of colorant extracted from marigold petals.
Optimization for Aqueous Extraction of Color Components from Petals of Marigold Flower
The optical densities of the natural dye extracted from the petals of marigold flowers in different process parameters are given in Table 2. It is found that dye extract gives the highest color yield (i.e. the highest OD) at the following process variables, that is, pH: 11, MLR: 1:25, time: 45 min, and temperature: 90°C. Extraction of color components from marigold petals is best suited at 1:25 MLR, as an MLR greater than 1:25 creates a dilution effect and minimizes the color yield. The dilution effect means that the volume of the medium of extraction used (here, it is distilled water), is increased while keeping the mass of the substrate the same, thus causing the concentration of the dye present in that medium to get reduced and hence causeing a lower strike rate/less dye diffusion and hence the shade becomes lighter. Alkaline pH increases the accessibility of the solvent/media of extraction used to release the color components present in the marigold petal by higher swelling of marigold petal at alkaline pH. The duration of the extraction process does not show any significant impact on color yield. However, it achieves maximum OD within 45 min. Extraction of color components from marigold rises up with the increase in temperature until 90°C, and thereafter, extraction starts declining for breakdown of major hydrolyzable compounds above 90°C temperature. 22
Effect of extraction variables on OD of extracted dye liquor of marigold petals.
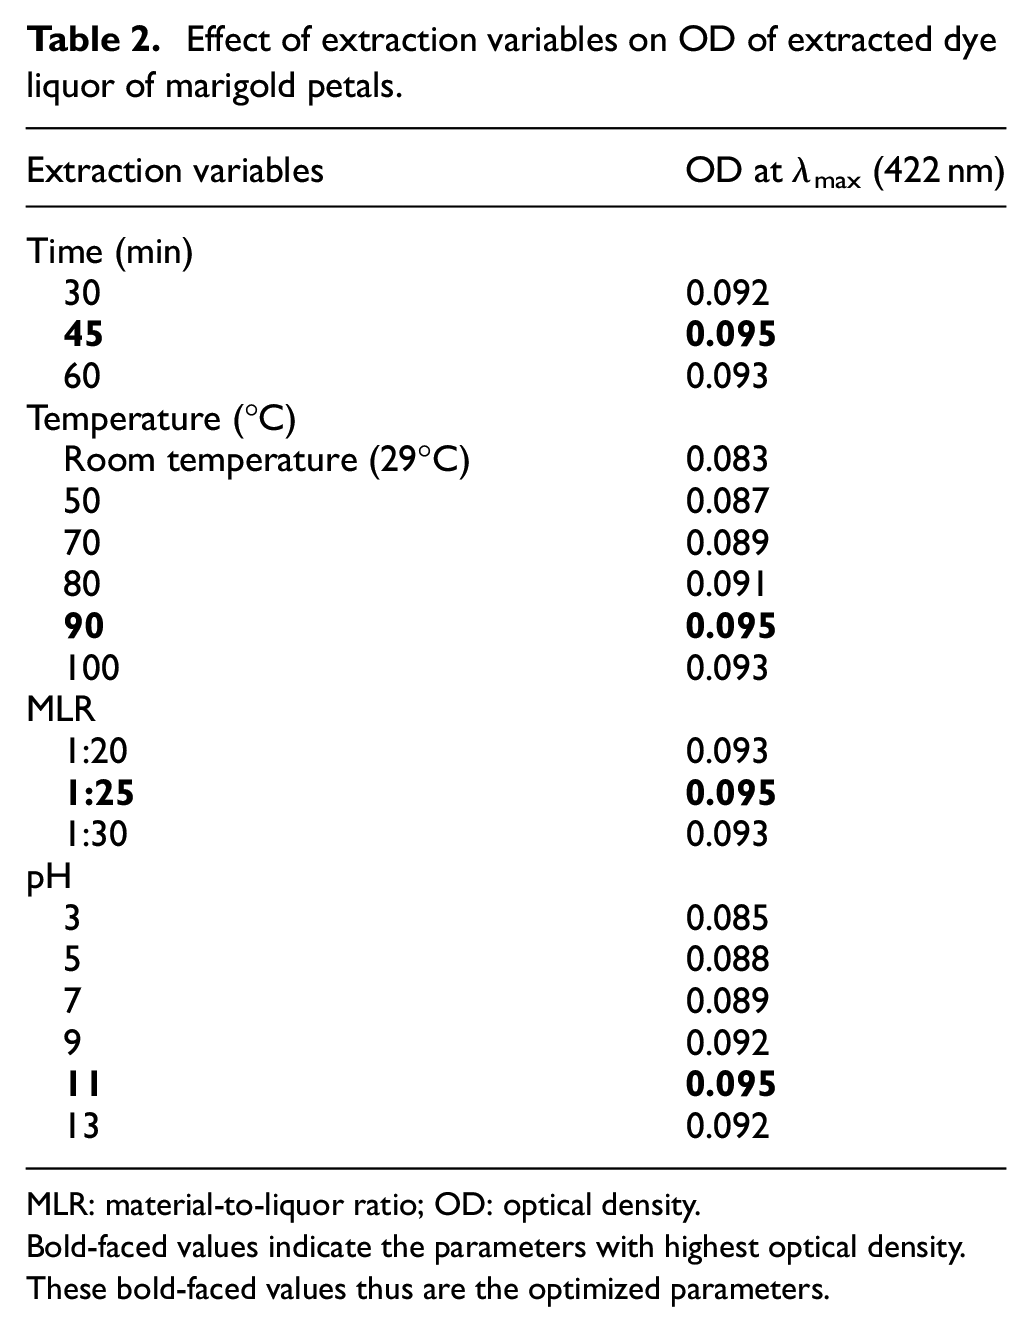
MLR: material-to-liquor ratio; OD: optical density.
Bold-faced values indicate the parameters with highest optical density. These bold-faced values thus are the optimized parameters.
Standardization of Process Variables for Single Mordanting
Two mordants namely gallnut (bio-mordant) and natural alum (inorganic salt as mordant) have been applied separately to the jute fabric in varying concentrations prior to its dyeing. Gallnut has been applied onto the jute fabric through the padding method in varying mordant concentrations (10%, 15%, 20%, and 25% add-on on the weight of dry fabric) followed by drying of the fabric in air. As shown in Table 3, the color strength (K/S) of the gallnut-mordanted dyed fabrics has increased with the increase in the add-on of gallnut on the fabric. The highest color strength (K/S—3.55) has been achieved at 20% add-on of gallnut and then it starts reducing, due to agglomeration of gallotannins on the fabric surface. 18 The tensile strength of the gallnut-mordanted jute fabric has reduced significantly.
Strength and color values of premordanted dyed jute fabric.
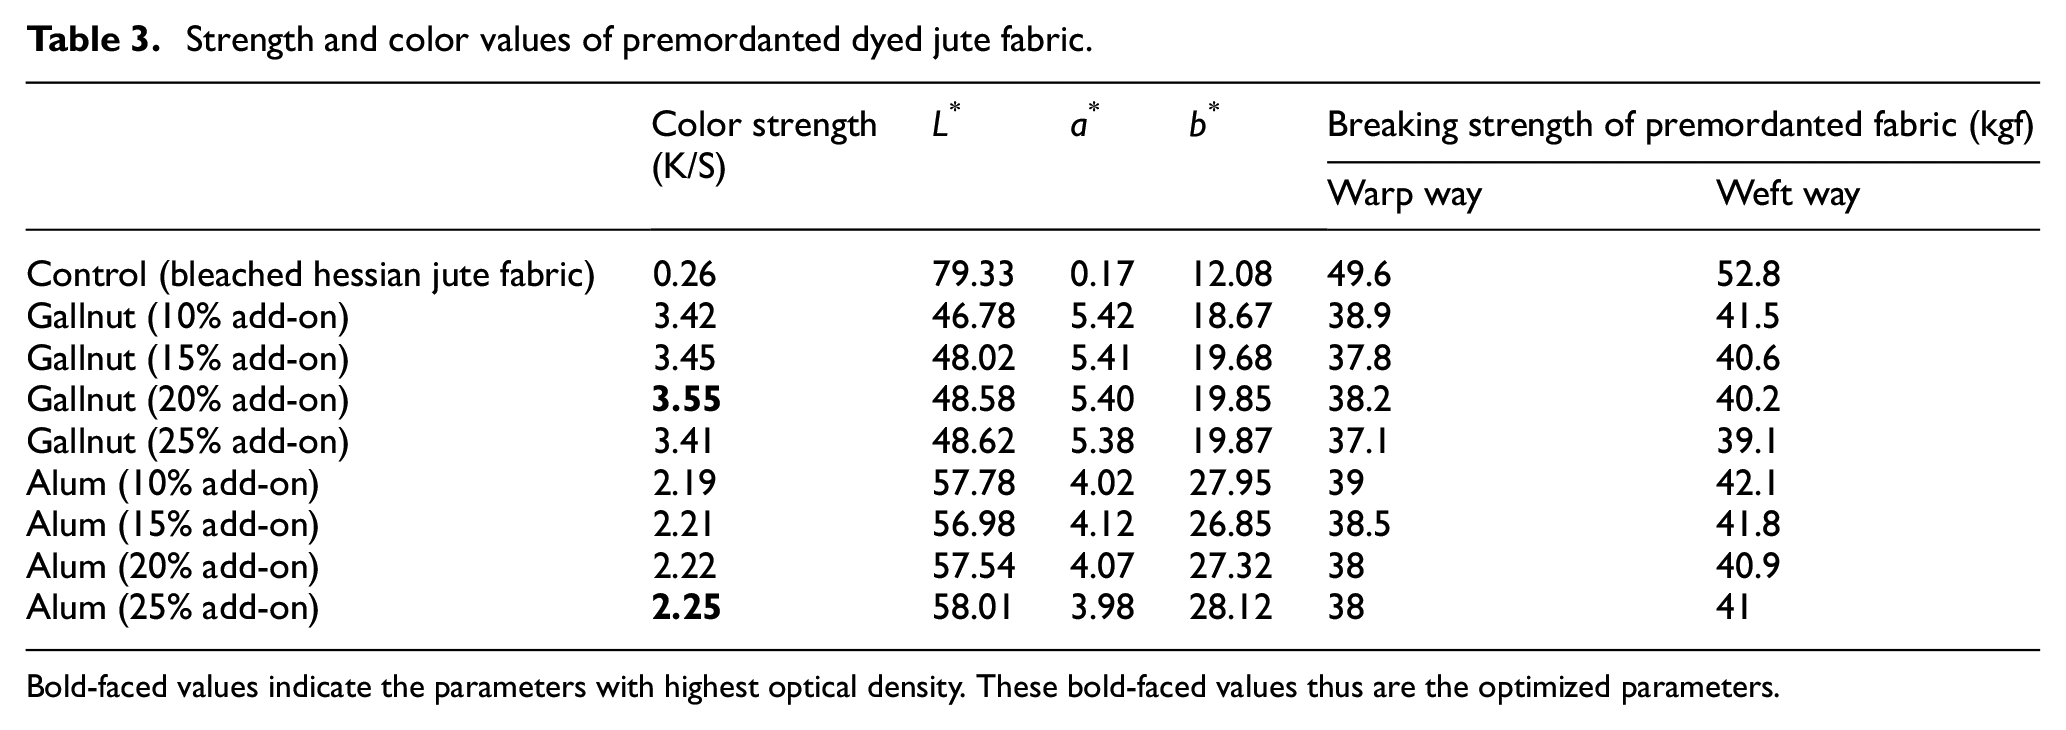
Bold-faced values indicate the parameters with highest optical density. These bold-faced values thus are the optimized parameters.
Alum on its application on the fabric prior to its dyeing has shown a similar trend to that of gallnut. With increasing concentration of alum, color strength has risen. The maximum color strength (K/S—2.25) of the alum-mordanted dyed jute fabric has been achieved at 25% add-on of alum application. Here, also fabric strength has fallen on application of mordant.
Optimization of Mordant Concentrations in Dual-Mordanting Process
To optimize the outcomes of dual premordanting process, gallnut has been applied onto the jute fabric first, followed with the application of alum in such a way that 20% total add-on on the weight of dry fabric can be achieved. Ratios of mordant concentrations (gallnut:alum) are kept as (0:100), (25:75), (50:50), (25:75), and (100:0). Table 4 shows that the dual-mordanting process gives higher color strength than what is achieved through the application of single mordant (20% add-on of gallnut or 20% add-on of alum on the fabric), that is possible due to synergistic effect of a bio-mordant with a metallic salt to create large complex molecule to hold the dye molecules on the fabric strongly. Among the dual applications, the highest color strength has been achieved when the add-on of gallnut and alum is 15% and 5% (i.e. 75:25 ratio), respectively, on the fabric. Fabric strength has reduced with the application of mordants, but no clear trend is evident to say whether the impact of any particular mordant in successive applications is more prominent on fabric strength loss.
Strength and color values of premordanted dyed jute fabric in a mixed mordanting system.
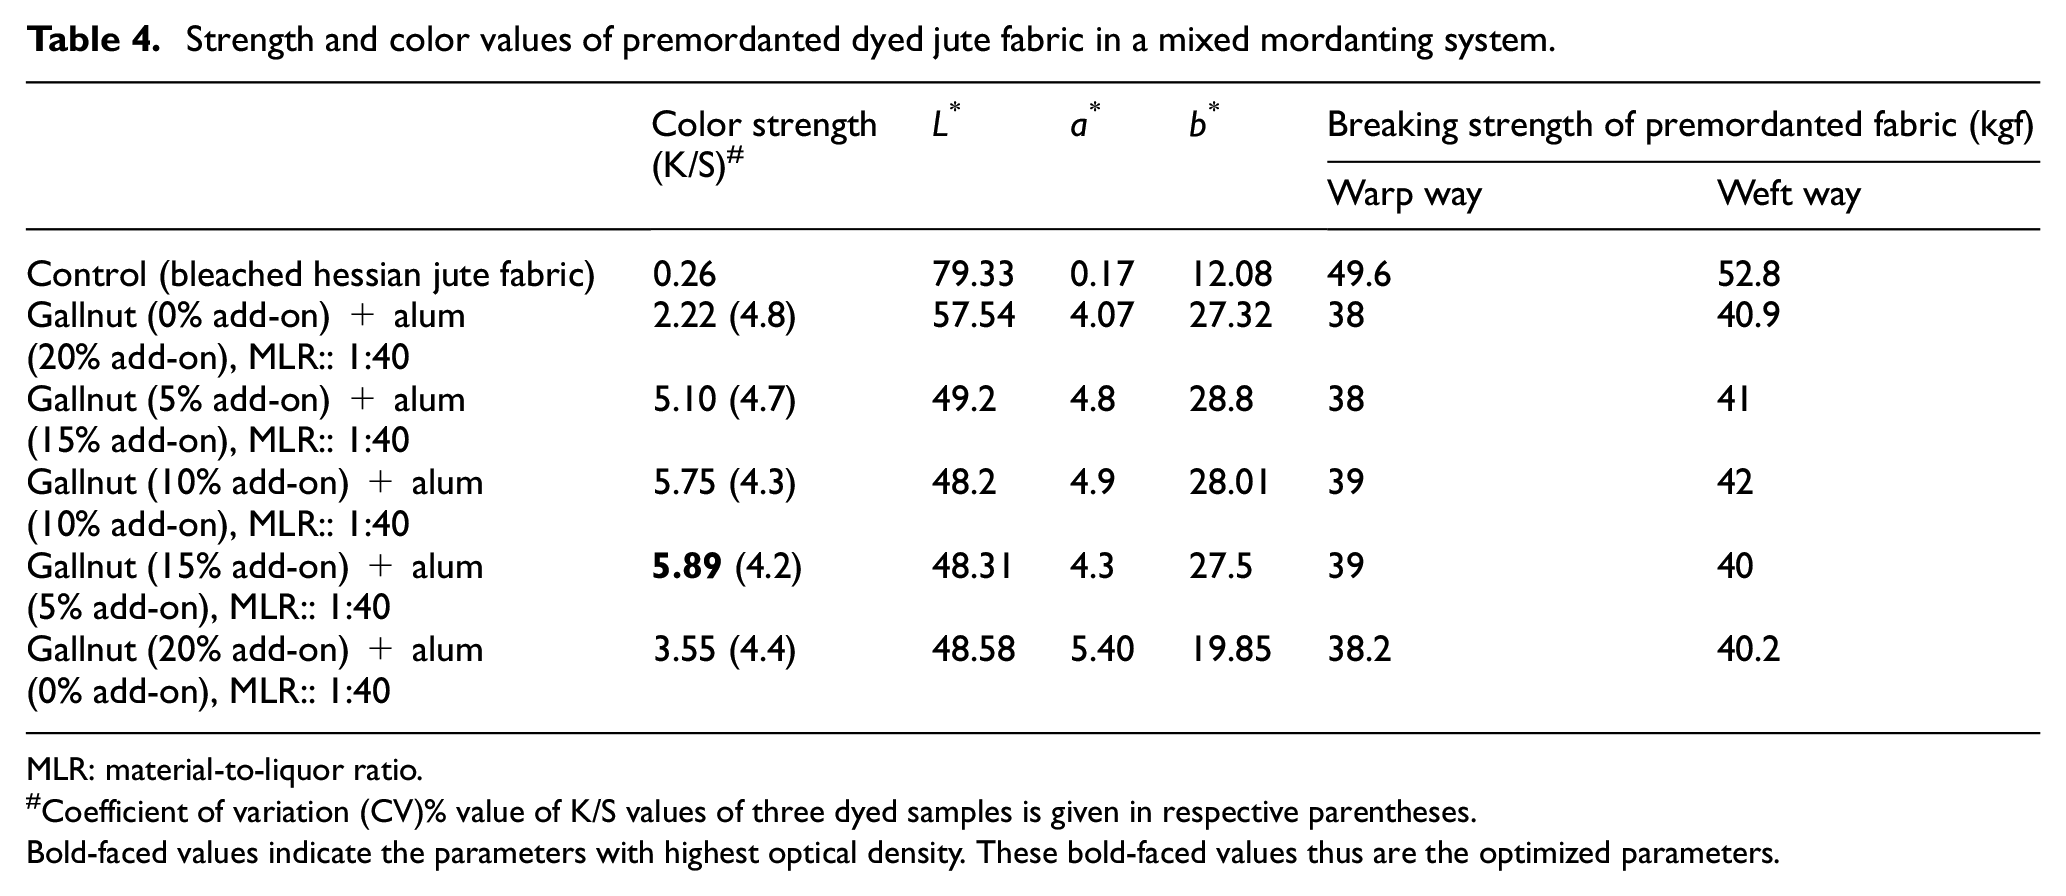
MLR: material-to-liquor ratio.
Coefficient of variation (CV)% value of K/S values of three dyed samples is given in respective parentheses.
Bold-faced values indicate the parameters with highest optical density. These bold-faced values thus are the optimized parameters.
To have a greater understanding of how dye molecules (mainly lutein molecules) of marigold have interacted with the premordanted jute fabric, FTIR spectra of (1) bleached jute fabric; (2) dual-mordanted jute fabric; and (3) jute fabric dyed with marigold petals after premordanting were analyzed. All of the FTIR spectra (Figure 5(a)–(c)) are similar with minor differences in some functional interactions. Analysis of the FTIR spectral scan of bleached jute (Figure 5(a)) shows a broad single peak at 3530 cm−1 which is assigned to –OH stretching of the –OH group of cellulose, a single peak at 2930 cm−1 which is assigned to –CH stretching of the carbonyl aldehyde in lignin, a peak at 1750 cm−1 which is due to C=O vibration of aldehyde group, and a peak at 1620 cm−1 indicating C=O vibration of –COO (ester group). 23 FTIR of dual-mordanted jute (Figure 5(b)) shows a shift of the peak at 3525 cm−1 with a smaller peak area, probably due to interaction for addition of –OH stretching and –COOH stretching of gallic or elagaic acid of gallnut and –OH of polyphenols of catechin present in gallnut. 15 Functionality of Al+ coming from potash alum mordant incorporated in the cellulose of jute as shown in Figure 5(b) forming a complex molecule between aluminum ion and cellulose is evident by enlargement of peak area at 652 cm−1, and this may also be caused by the interaction of metallic impurities attached temporarily to glucuronic acid present in jute. The FTIR spectrum of jute as shown in Figure 5(c) dyed with marigold petals after dual mordanting with gallnut and alum shows these two peaks for further addition of phenolic–OH stretching of the lutein structure of marigold dye molecule. For dyed jute, this Al+ became [Al–O]– forming a giant complex between fiber, mordant, and the dye molecule (lutein) of marigold petals, hence the prominence of the [Al–O]– band is further indicated by the increase in the height of peak at 656 cm−1.
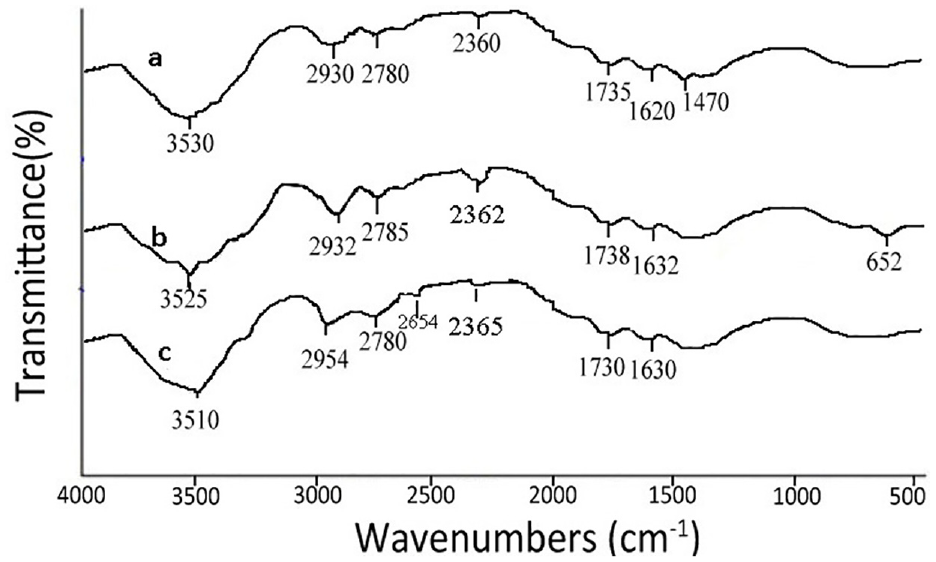
Fourier transform infrared scan of (a) scoured and bleached jute fabric (control fabric); (b) scoured and bleached jute fabric treated with gallnut extract and alum (premordanted fabric); and (c) dual-mordanted jute fabric dyed with aqueous-based extract of marigold petals under standardized process conditions (dyed fabric).
The FTIR spectrum of bleached jute shows a very small singlet at 2360 cm−1 for –CH stretching of polysaccharide chain of cellulose. The spectra of both mordanted and dyed jute show this duplet to be merged and partly disappeared by the formation of a sharp trough of 2362 cm−1 showing –C=NH vibration (2310–2390 cm−1) indicating the attachment of gallotannin containing protein/amine and amino acid present in gallnut. A small hump in 2654 cm−1 in spectra of dye jute is ascribed by the aromatic methyl group array with conjugation of lutein present in marigold used as a dye molecule. This confirms the attachment of the dye with jute either by forming a complex of fiber-mordant dye as said above or simply by H-bonding. There are two –OH groups on two sides in the lutein (Figure 5) and jute cellulose and hemicelluloses have numerous –OH groups as well as the bio-mordant gallnut used having a lot of phenolic –OH in it. Hence, there are many possible chances of formation of H-bonding among these three substances (lutein, jute cellulose, and gallnut) besides complexing with alum as the natural metallic mordant used. A possible depiction of molecular interaction between lutein dye molecule, two mordants, and cellulose of jute fibers is shown in Figure 6.
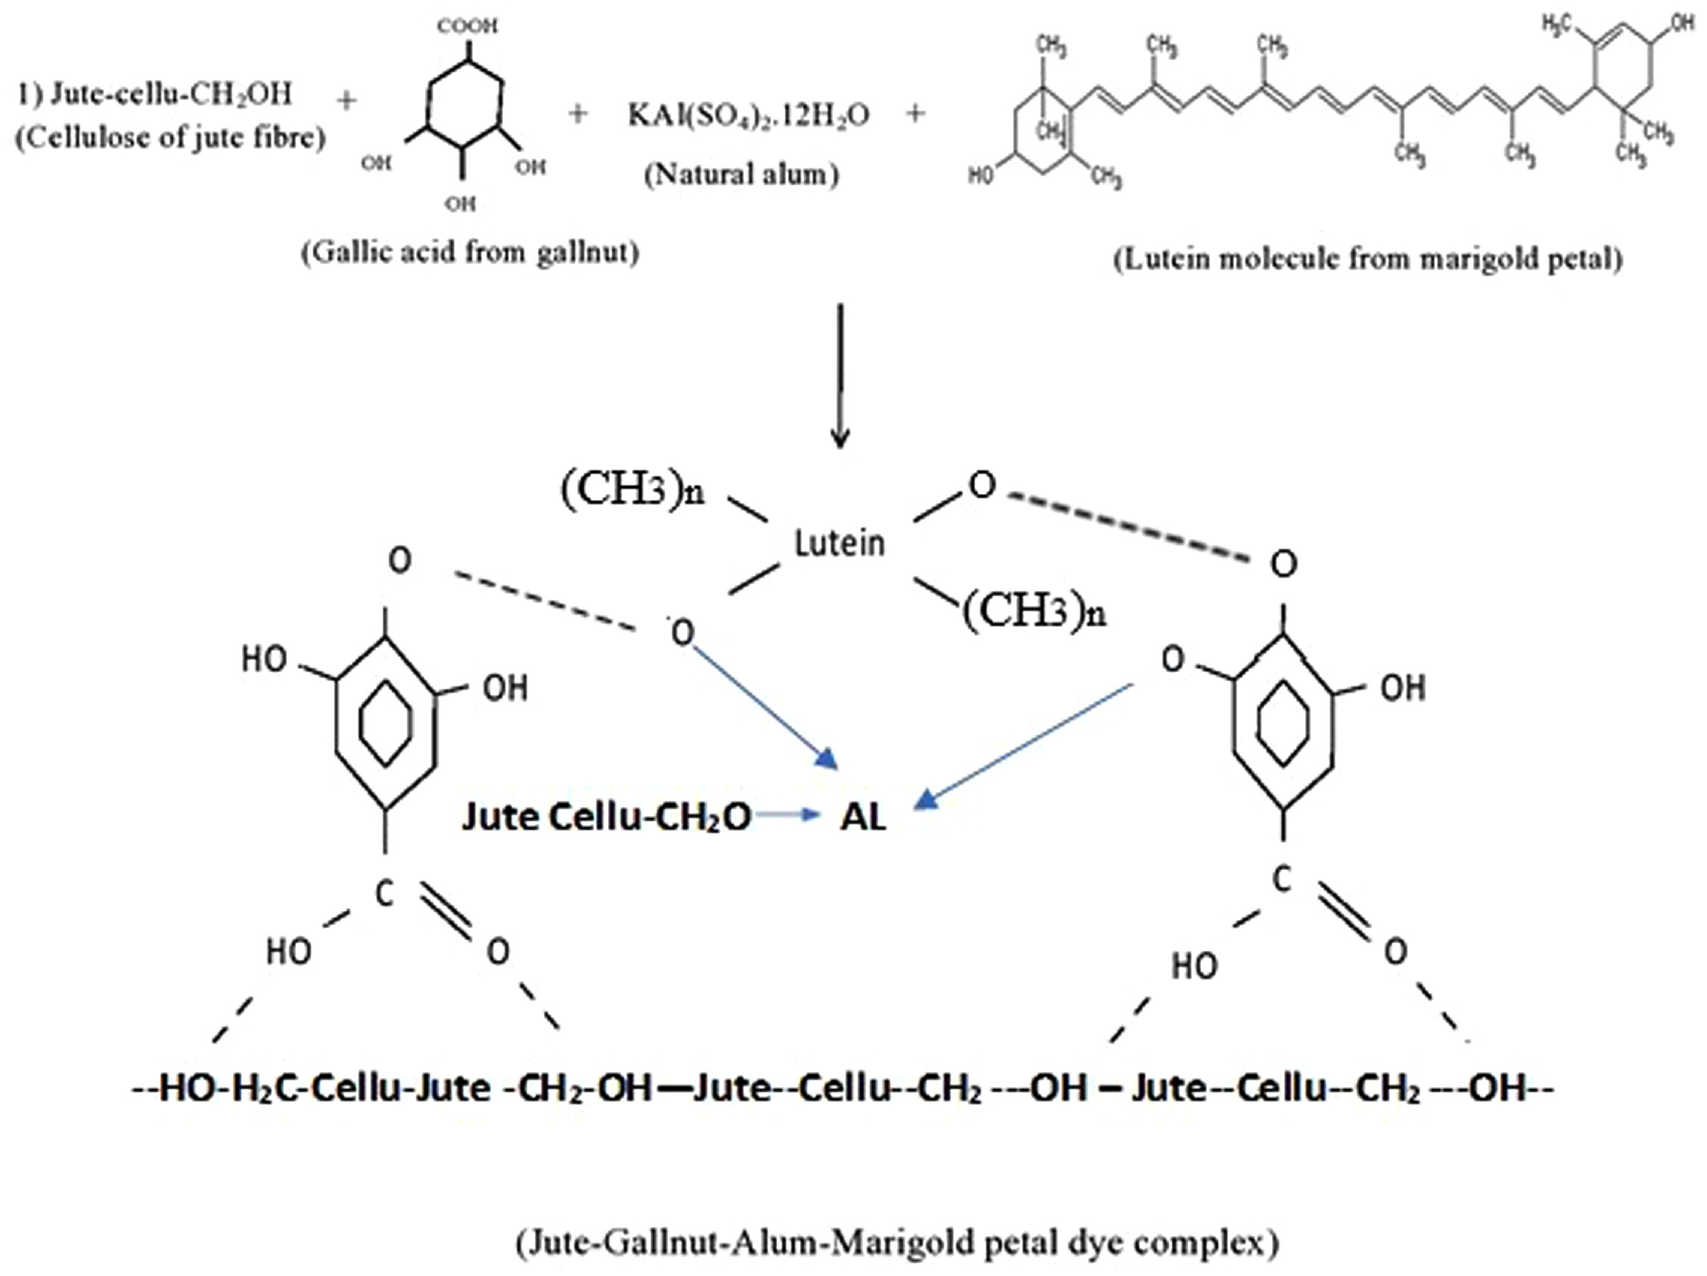
Possible interaction between lutein of marigold petals and jute cellulose.
Standardization of the Dyeing Process of Dual Premordanted Jute Fabric
Application of two different mordants applied onto the jute fabric successively exhibits better color yield than the application of a single mordant. So, now both mordants in their optimized ratio (gallnut:alum = 75:25) have been applied in sequence on the bleached jute fabric for the optimization of process conditions for natural dyeing with marigold flower petals. The effects of various dyeing conditions on the different color-related parameters, of jute fabric premordanted with 20% o.w.f. of total mordant and later dyed with marigold petals are depicted in Table 5 and in Figures 7–11.
Color-related indices of jute fabric premordanted with gallnut and alum, subsequently dyed with marigold petal with different process variables.
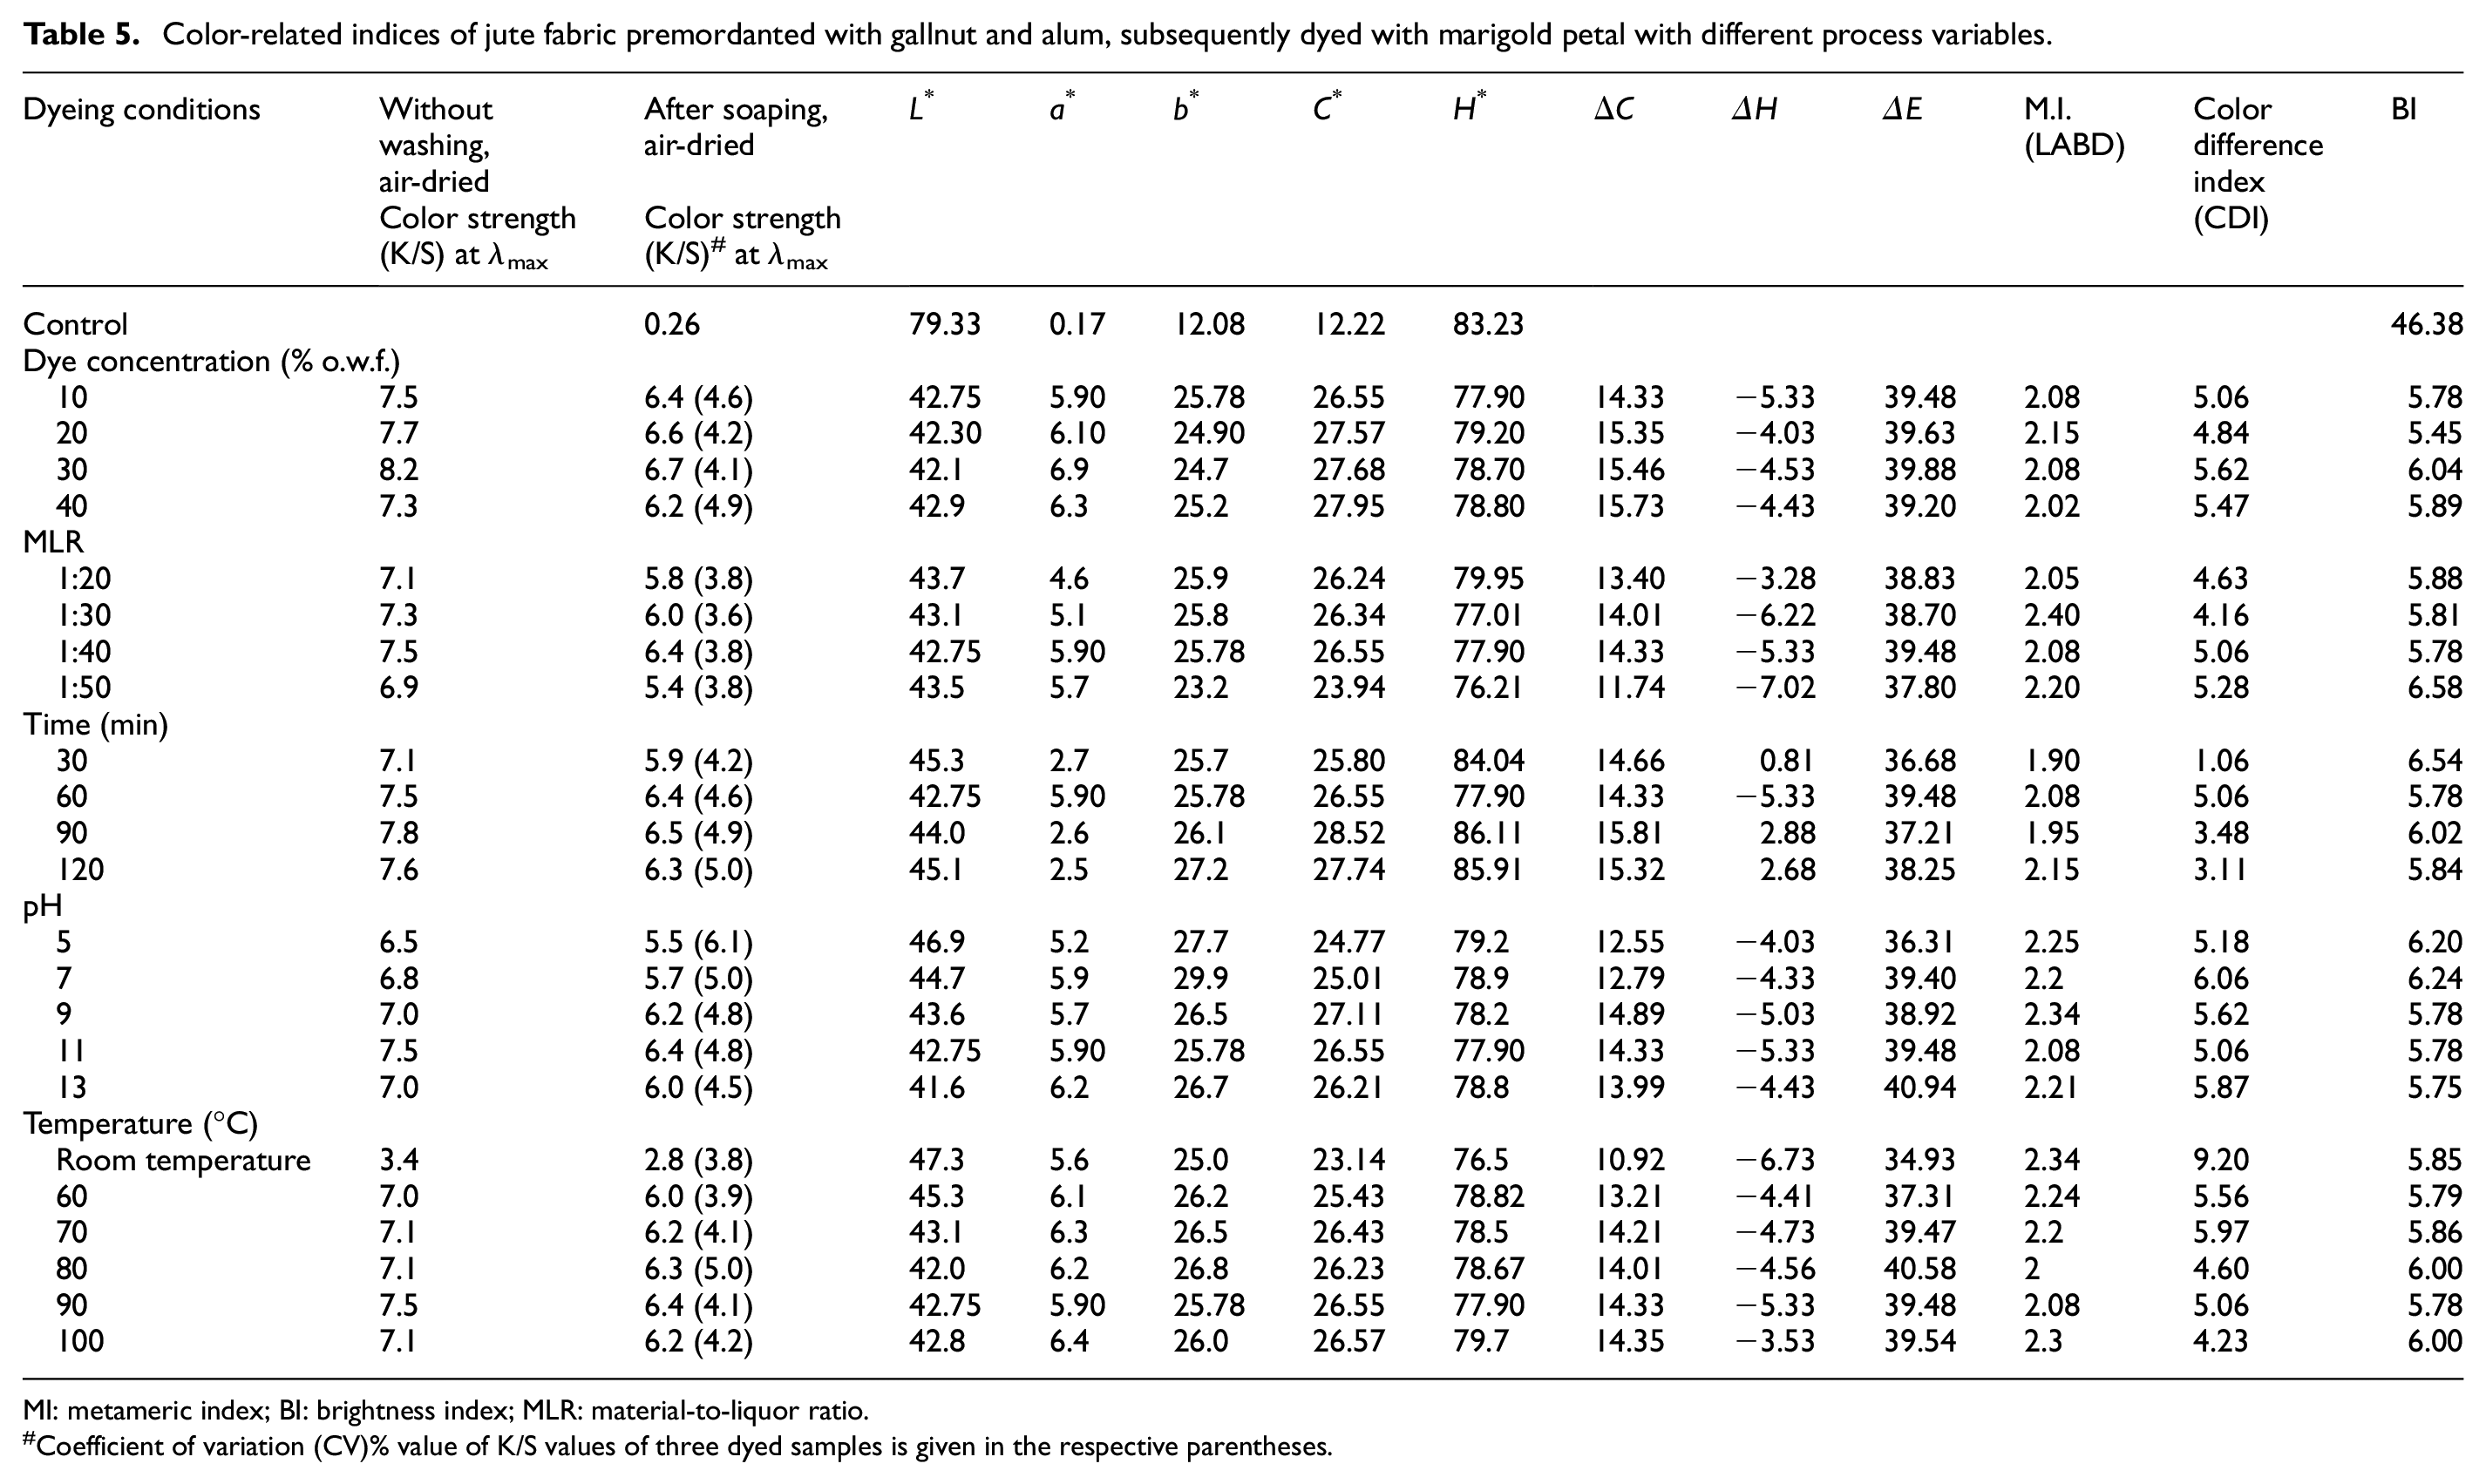
MI: metameric index; BI: brightness index; MLR: material-to-liquor ratio.
Coefficient of variation (CV)% value of K/S values of three dyed samples is given in the respective parentheses.
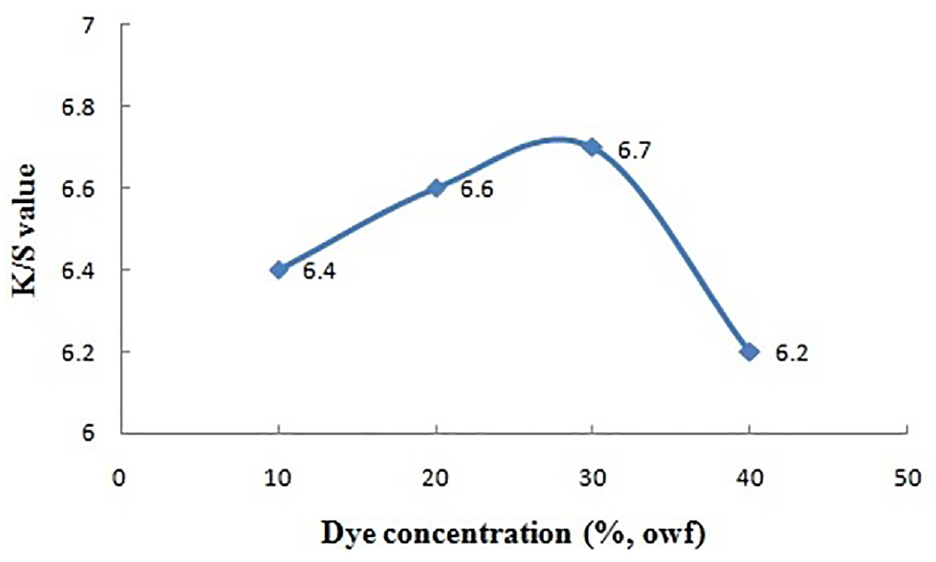
Dye concentration versus color strength.
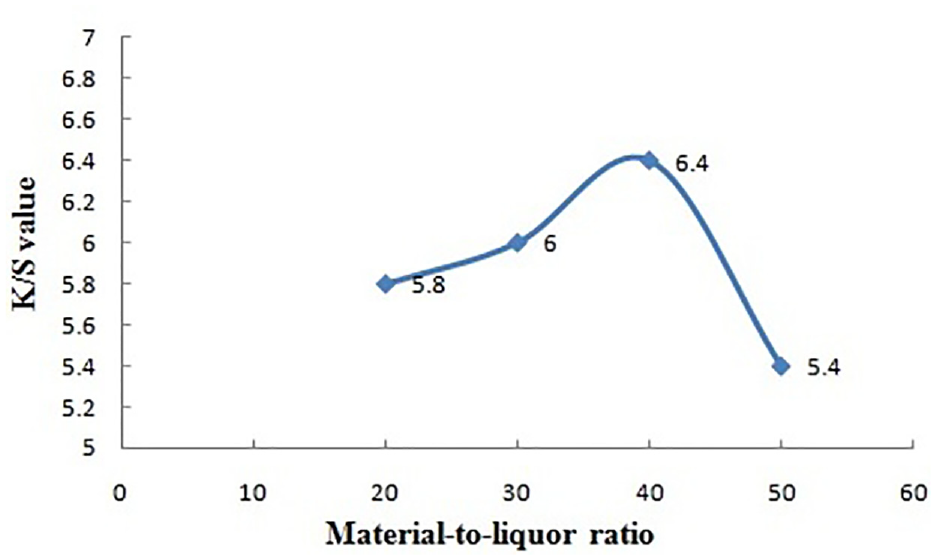
Material-to-liquor ratio versus color strength.
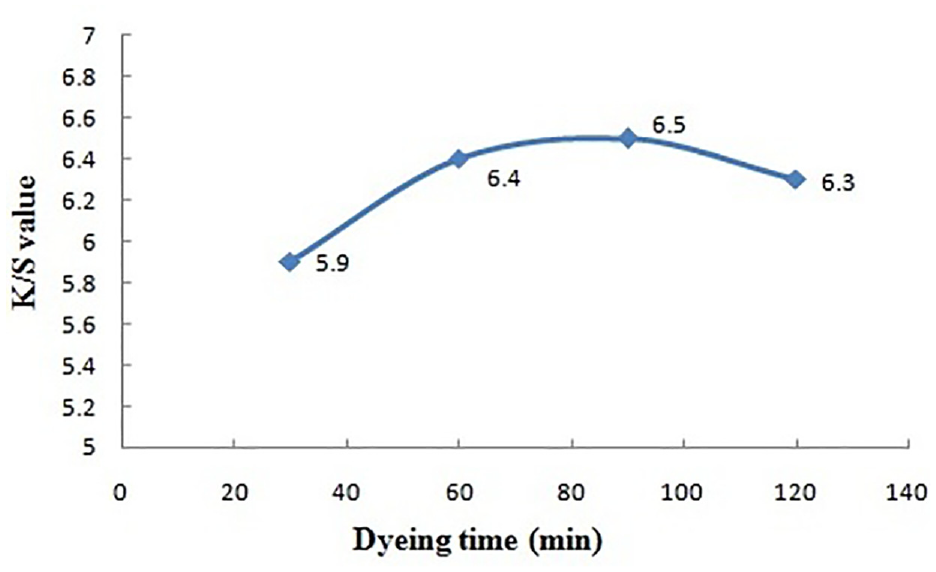
Dyeing time versus color strength.
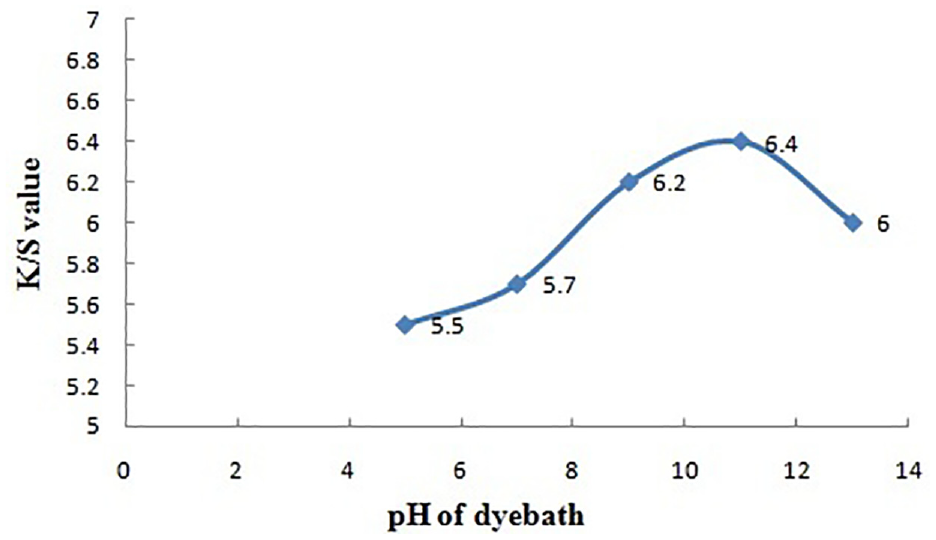
pH of dye bath versus color strength.
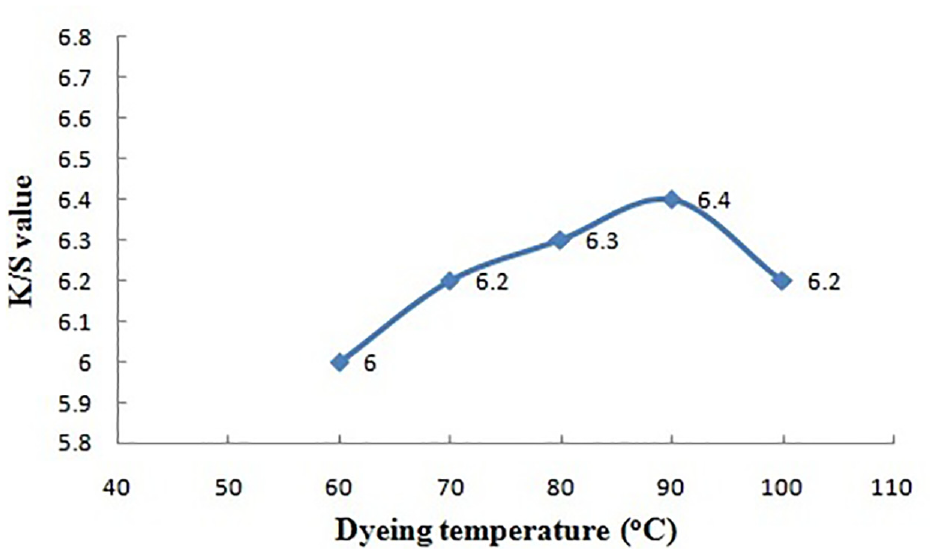
Dyeing temperature versus color strength.
Effect of Dye Concentration (Aqueous Extract of Marigold Petals)
Color yield on the dyed fabric surface (K/S) rises up with increase in dye concentration in bath. It rises up from 6.4 to 6.7 (for rinsed fabric) with dye concentration from 10% to 30% (on weight of the dried marigold petal powder). But as the concentration increases above 30%, the shade depth starts reducing. This finding may be the result of process equilibrium due to agglomeration of dye particles. 22 This may slow down the diffusion of dye molecules into fiber structure.
Effect of MLR of the Dye Bath
Color yield on the dyed jute fabric (K/S) increases with the increase in MLR from 1:10 to 1:40 where it achieves the maximum value (6.4), and it starts decreasing with MLR. Though high MLR makes the dye bath diluted with respect to the fabric weight with reduced color yield, every mordant dye needs a certain stoichiometric ratio to form the dye-mordant-fiber complex. This complex formation has been possible at 1:40 MLR. So, 1:40 MLR is standardized for this case.
Effect of Dyeing Time
Color yield on the dyed jute fabric (K/S) initially goes on an increasing slope with rising dyeing time and achieves the highest values (6.5) at 90 min. This may be viewed as an effect of hydrolysis of hydrolyzable gallotannins (imparted onto fiber from gallnut) at higher dyeing time. So, a dyeing time of 90 min has been standardized in this natural dyeing process.
Effect of pH of the Dye Bath
Color yield on the dyed jute fabric (K/S) increases with the increase in pH from 5 to 11 resulting in the maximum value of 6.4 at pH 11. At higher alkaline concentration of the dyebath, the leaching action (wash-down effect) of loosely held colorant and impurities is higher, and hence, the color yield is lower at higher pH.
Effect of Dyeing Temperature
The color yield on the dyed jute fabric (K/S) continuously increases with dyeing temperature and attains the maximum (6.4) at 90°C. Higher dyeing temperature provides the dye molecules with more energy for their mobility thus resulting in higher dye sorption onto the fiber and diffusion into the fiber. Moreover, at higher temperature, the swelling of fibrous structure facilitates the penetration of dye molecules into the fibers. Thus, the standardized dyeing temperature for this dyeing process is 90°C.
Effect of Dyeing Process Parameters on Colorfastness Properties
The colorfastness values to washing and rubbing of the dyed jute fabrics are shown in Table 6. The dry rubbing fastness of the dyed jute fabrics is in the range of 4 and 4–5 while wet rubbing fastness lies between 2 and 2–3. Good dry rubbing fastness is the outcome of low amount of loosely adhered dye molecules on the surface of dyed fabric. Moderate wet rubbing fastness is the result of the leaching of some hydrolyzable tannin attached with dye molecules. The change-in-color values for wash fastness ranging between 2–3 and 3 indicate moderate to good wash fastness and may be the result of the washing-out of some dye molecules which are loosely attached to the fabric and also indicate that the dye molecules may attach with the dual-mordanted jute through bond. The hydrolysis of hydrolyzable tannins present in dyed jute may be another reason for the poor wash fastness. The observed lower wet rubbing fastness of marigold-dyed jute fabrics may be viewed as a result of some remaining amount of unfixed dye molecules which in the presence of water and on rubbing, get washed out during wet rubbing tests. This effect is considered to have been aggravated due to the higher coefficient of friction of jute substrate. It would have been a better-expected result if it had been washed with 5 g/L soap/detergent with 2 g/L soda for 30 min at 60oC (IS-3 test method) instead of using 2 g/L of soap only (without soda) for 15 min at 60oC. However, considering the main usages of dyed jute as curtains and wall decorative coverings, and so on, the lower wet rubbing fastness is not an important criterion for such usages.
Colorfastness values of premordanted dyed jute fabric.
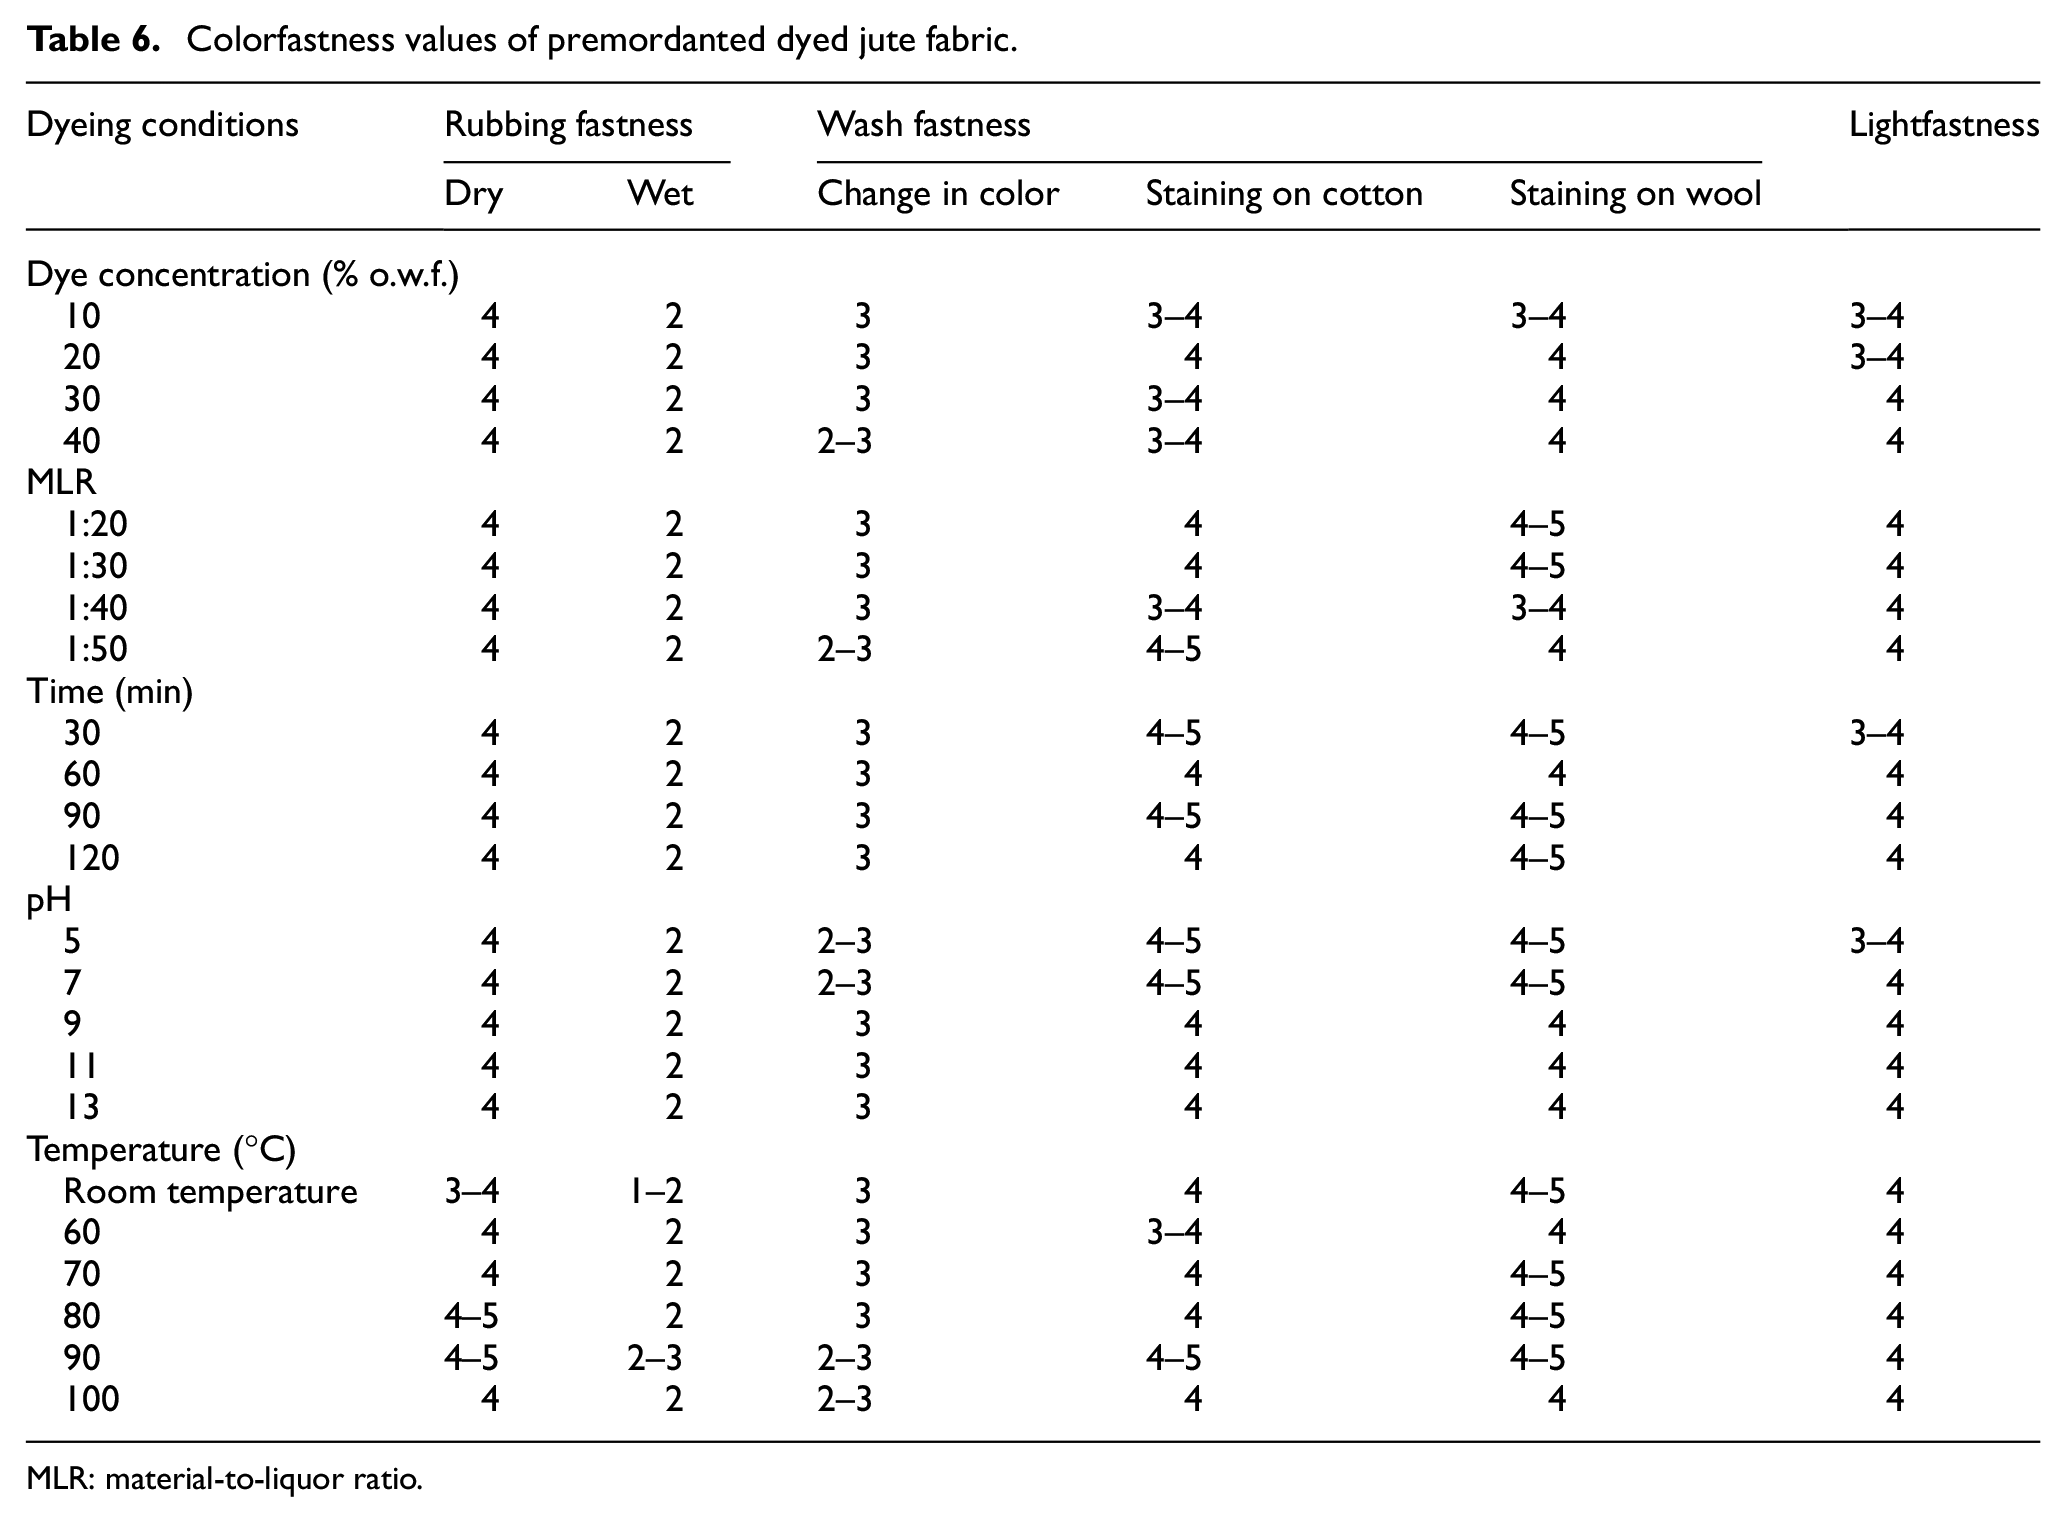
MLR: material-to-liquor ratio.
The moderate lightfastness values (3–4 to 4) of the dyed jute fabrics may be attributed to the attachment to jute of gallic acid, gallotannins, elagaic acid which have UV-absorption capacity, otherwise jute products tend to have poor lightfastness due to their inherent photo-fading property. 24
Statistical Analysis of Impact of Process Parameters
Selection of Factors Having Significant Effect on Color Strength Using PBD
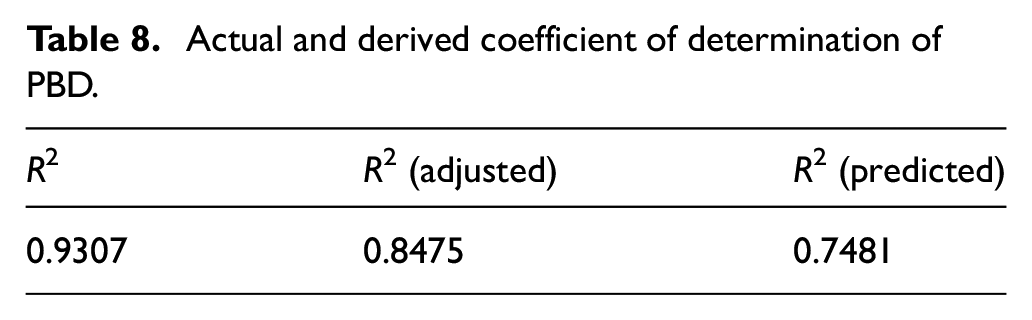
PBD is a two-level fractional factorial design used to identify the significant factors from a large number of input factors affecting an outcome factor.25,26 To find out the most significant factors, 12 combinations of factors have been given by the BBD and the dyeing process has been carried out following each combination of factors. The results of color strength of all 12 combinations are shown in Table 7. The highest actual K/S value (5.91) is obtained at trial 6 where MLR is 1:40, pH is 13, dyeing time is 90 min, dyeing temperature is 70°C, dye concentration is 30% o.w.f., and the mordant concentration ratio is 75:25 (gallnut:alum) whereas its predicted value is 5.83. The lowest K/S value (4.62) is obtained at trial 12 where the MLR is 1:20, the pH is 9, the dyeing time is 70 min, the dyeing temperature is 70°C, the dye concentration is 10% o.w.f., and the mordant concentration ratio is 25:75 (gallnut:alum) whereas its predicted value is 4.63. The table clearly shows that the predicted values of K/S as computed by the Minitab software are very close to the respective actual values. This only implies the precision of the natural dyeing process. This is even further bolstered by the finding of the result of the coefficient of determination (R2) as 0.9307 (Table 8) which means that 93.07% of variability of these six process parameters can be explained by this PBD model. Moreover, the adjusted R2 is 0.8475 which is close to actual R2 implying the significance of the natural dyeing model.
Results of experimental design of factors using PBD.
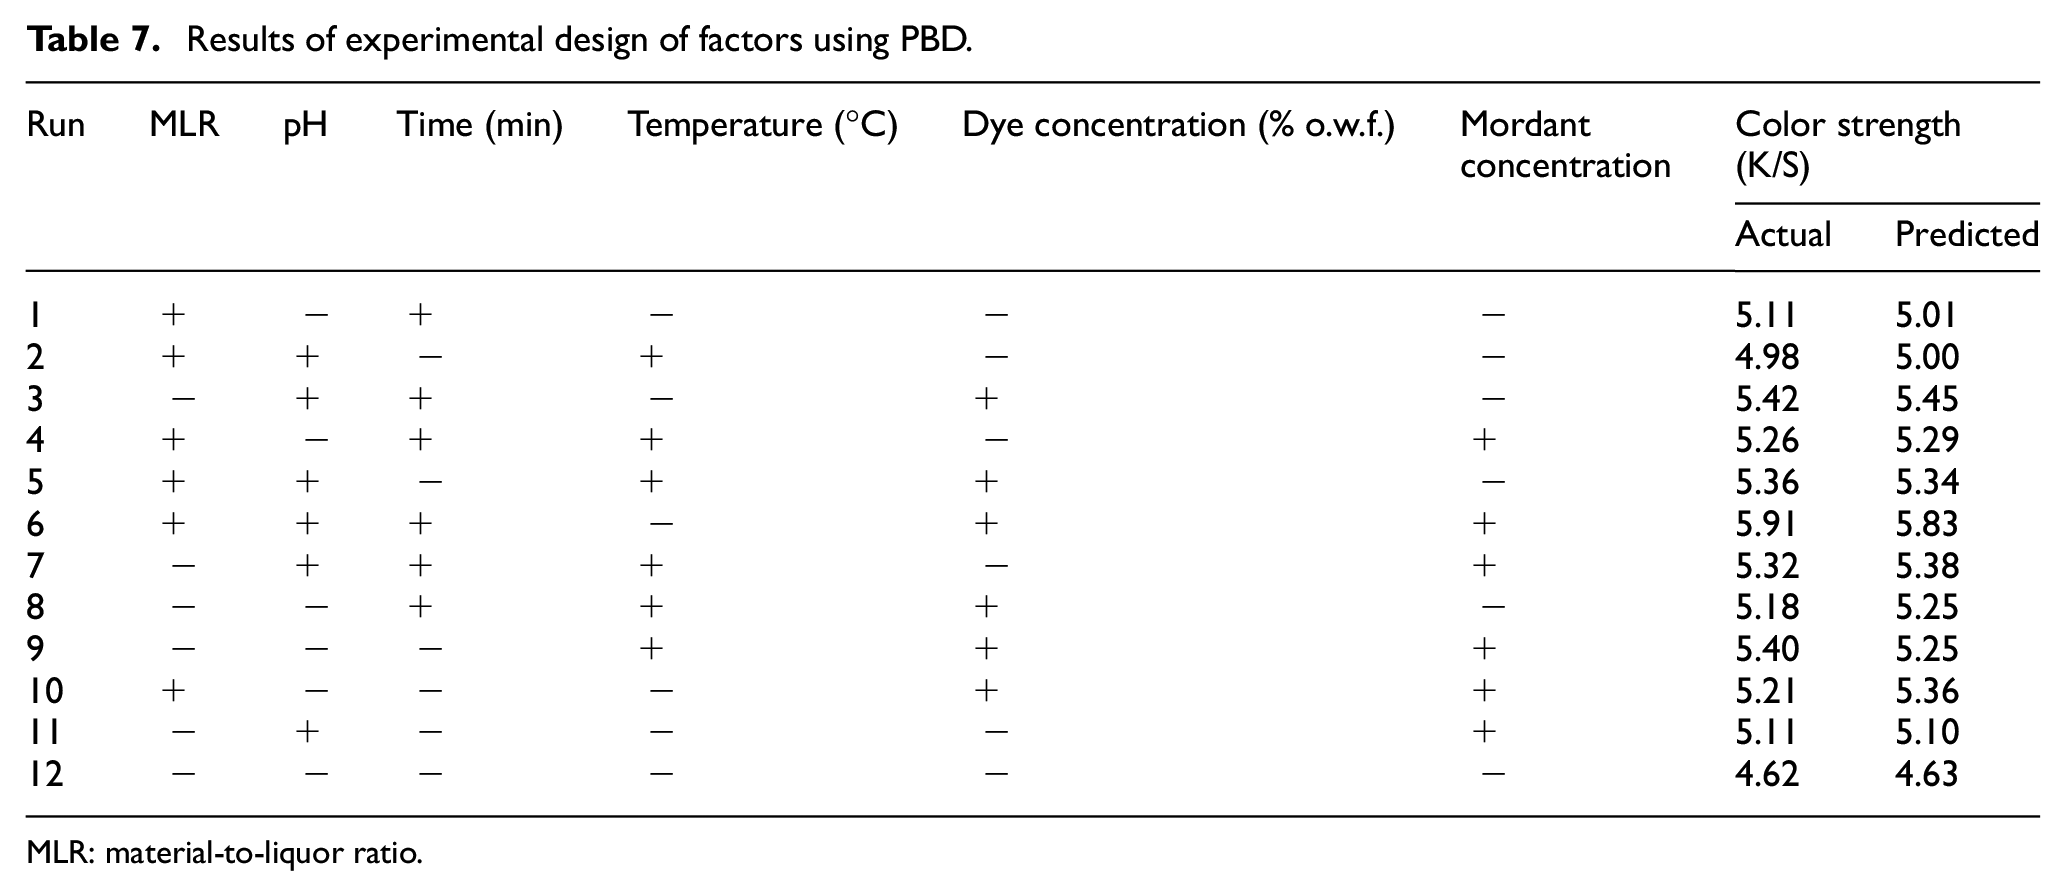
MLR: material-to-liquor ratio.
Actual and derived coefficient of determination of PBD.
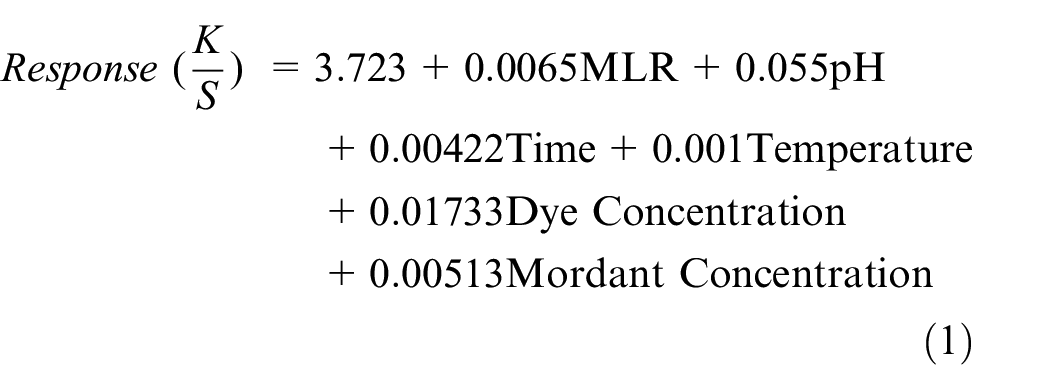
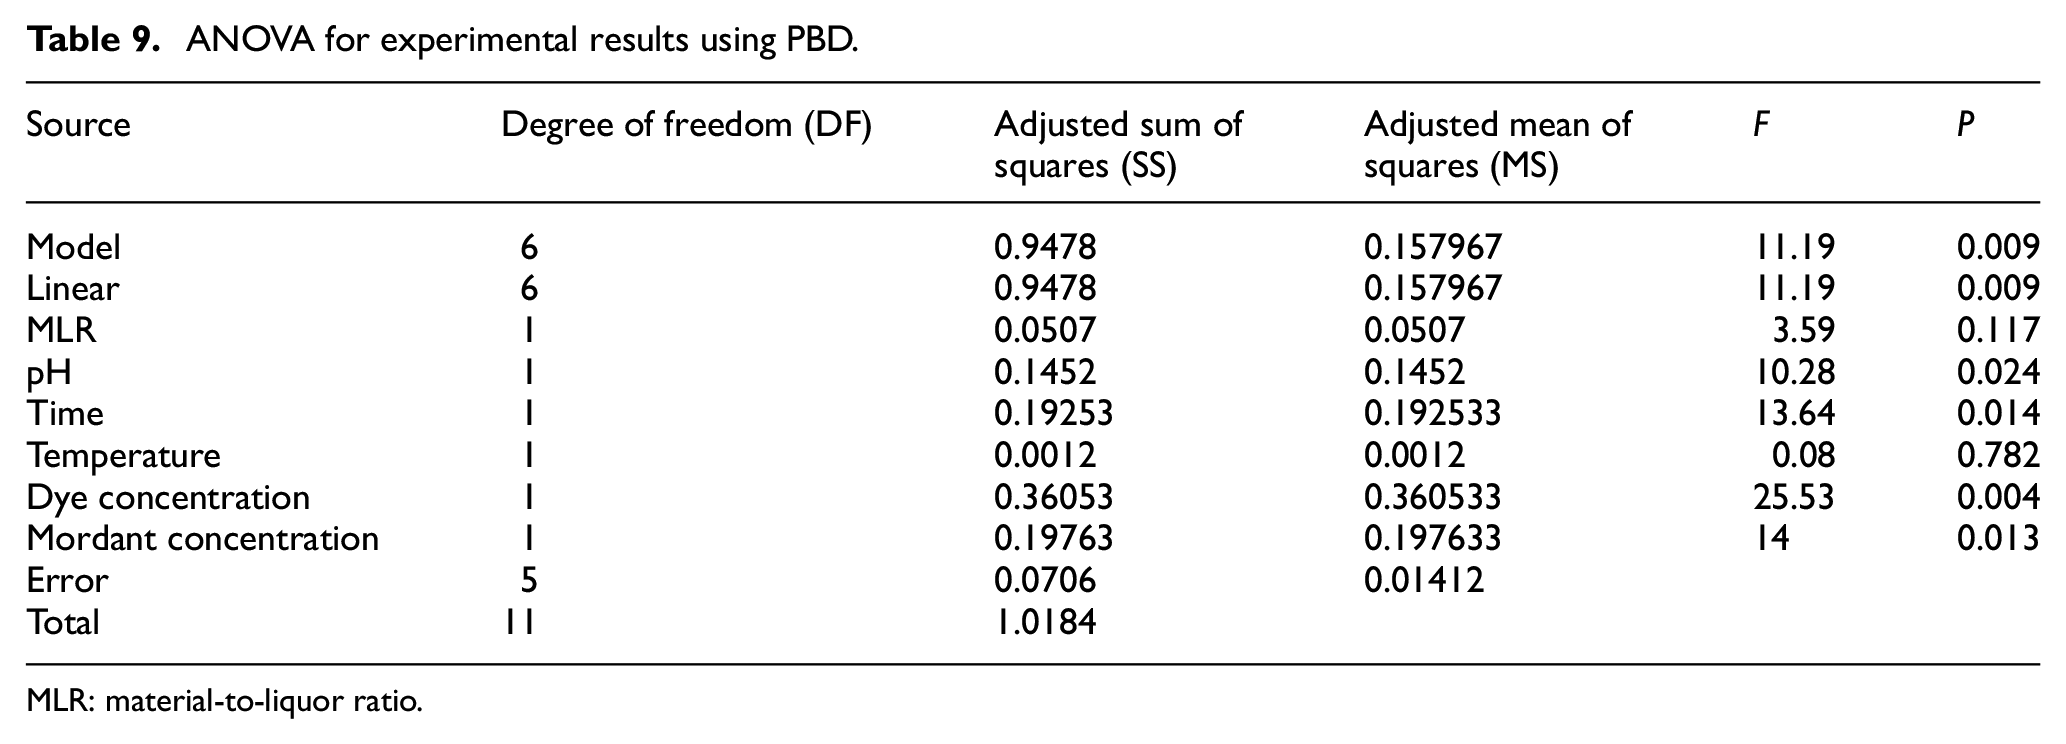
To find out the most significant factors among these six, the ANOVA is examined. The result is shown in Table 9 which depicts the P values of all the six process variables. The process variables having P < 0.05 (confidence levels > 95%) are considered to be significant. Here, three factors with the lowest P values are selected for further assessment using RSM with BBD for their impact on color strength. Three process variables namely (1) dye concentration, (2) mordant concentration, and (3) dyeing time are found to have the lowest P values and thus are considered as most significant among the six process variables having adequate impact on the process outcome. The regression equation of the analysis is given below.
ANOVA for experimental results using PBD.
MLR: material-to-liquor ratio.
Statistical Optimization of Process Parameters Using BBD
Three input factors selected from the PBD namely (1) dyeing time, (2) dye concentration, and (3) mordant concentration are further statistically examined to find out individual impact on the output factor, that is, color strength of the dyed jute fabric using the three-level (−1, 0, and +1) BBD in a single replicate. The three levels of the factors for BBD experiments are set in accordance with the previous PBD. Table 10 displays the values for three levels for each of the factor. The lowest (−1) and the highest (+1) values of coded levels of the factors are same as with the PBD. The actual and predicted values of the output factor are depicted in Table 11. The predicted values of the color strength computed by the Minitab software are very close to the actual values of color strength for respective dyeing process.
Design of experiment with significant factors using BBD.
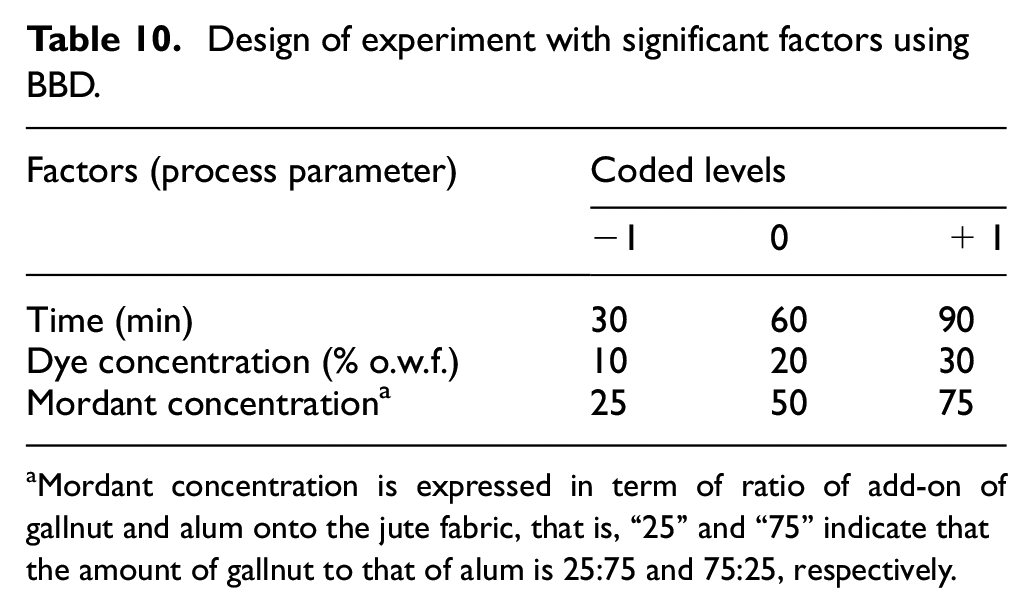
Mordant concentration is expressed in term of ratio of add-on of gallnut and alum onto the jute fabric, that is, “25” and “75” indicate that the amount of gallnut to that of alum is 25:75 and 75:25, respectively.
Results of experimental design of factors of BBD.
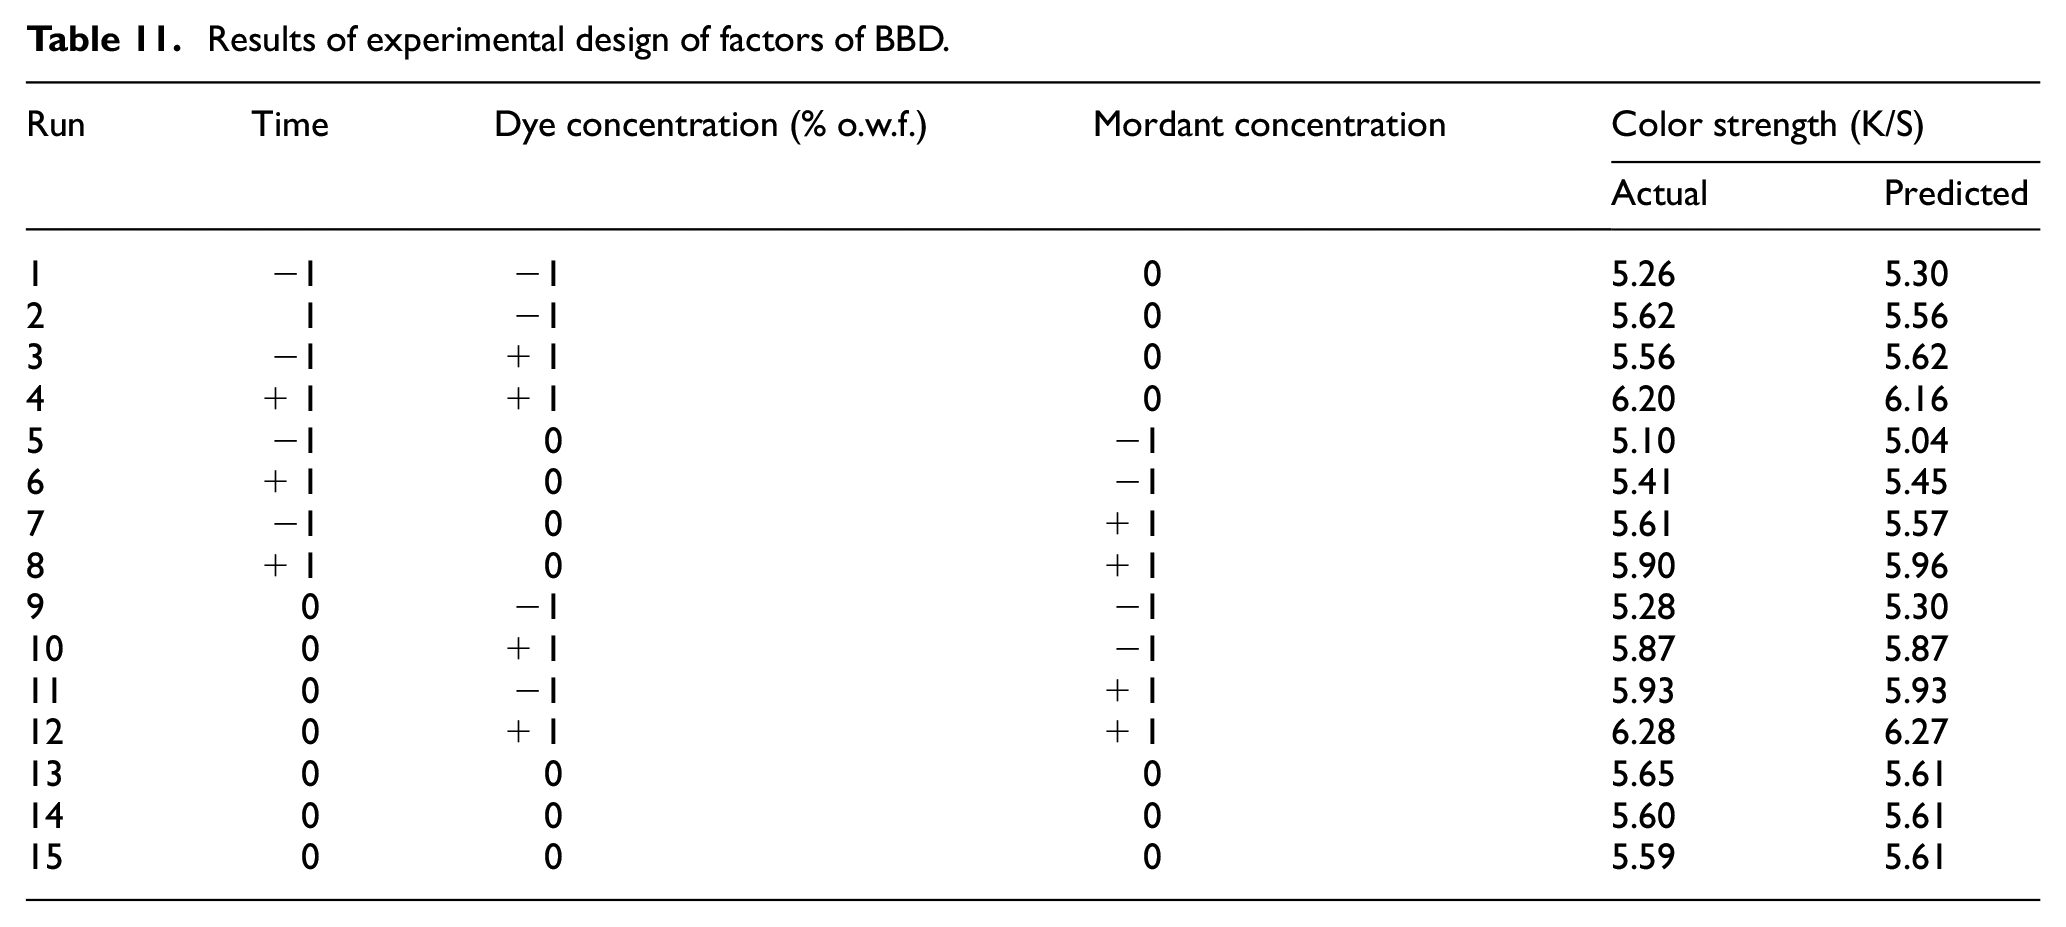
Among these 15 trials, the highest color strength (6.28) has been achieved at the twelfth trial with process conditions as dyeing time: 60 min, dye concentration: 30% o.w.f., and mordant concentration: 25:75 (gallnut:alum). In this particular case, the predicted color strength (6.27) is almost the same as the actual value. The lowest color strength (5.26) has been achieved at the first trial with process conditions as dyeing time: 30 min, dye concentration: 10% o.w.f., and mordant concentration: 50:50 (gallnut:alum). Here, the predicted value is 5.30. This closeness of actual and predicted values of color strength is further established with the ANOVA of this BBD.
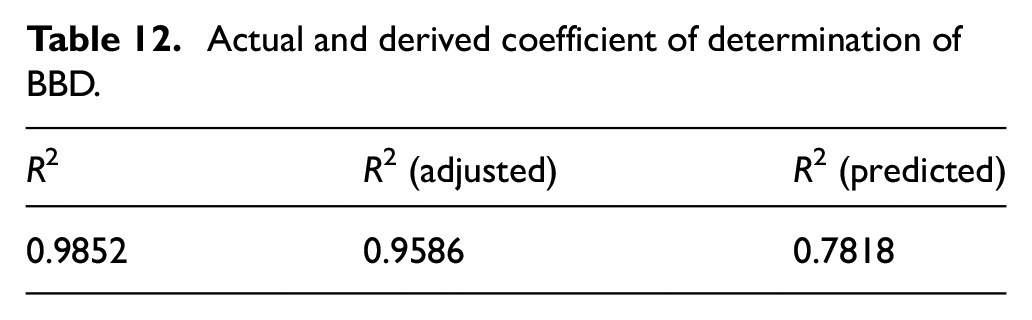
An ANOVA of this said BBD of natural dyeing of jute fabric with marigold petals produces a regression coefficient which denotes the viability of the model. In this case, the said coefficient (R2) has been found to be 0.9852 (Table 12) that means that 98.52% of the variability of these three process parameters influencing the outcome factor of color strength can be explained by this BBD model. It is mentioned in literature that an R2 of more than 0.90 possesses a high correlation for a BBD. The adjusted R2 is 0.9586 which is very close to experimental R2. This implies the significance and robustness of the present BBD of the natural dyeing process.
Actual and derived coefficient of determination of BBD.
The regression equation in uncoded units derived through the BBD of three input factors of this natural dyeing process is given below.
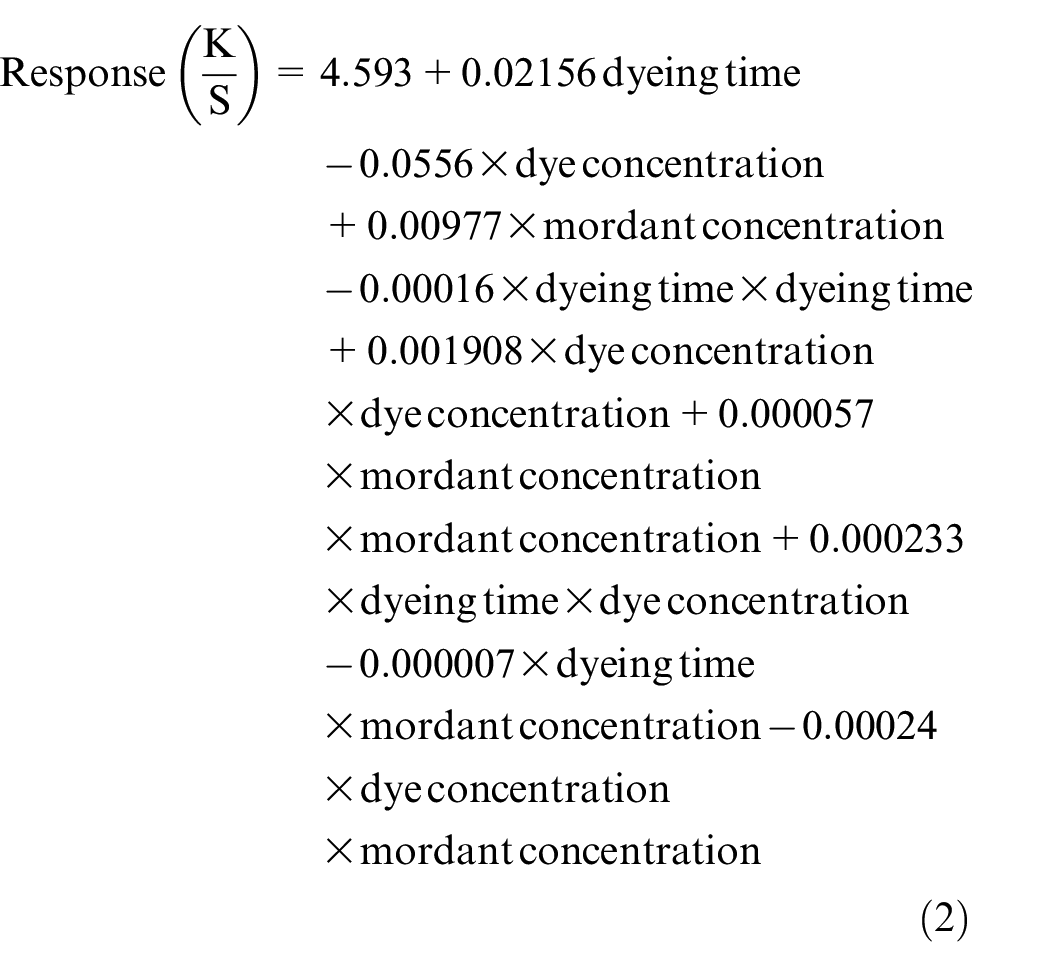
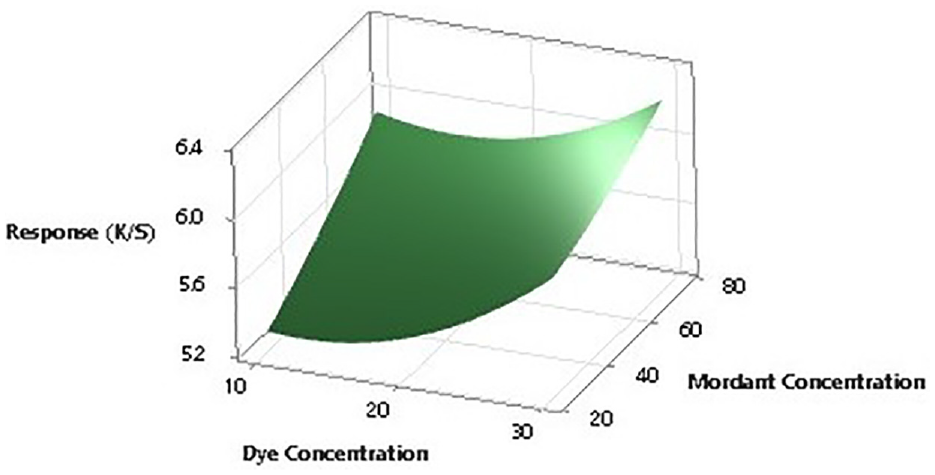
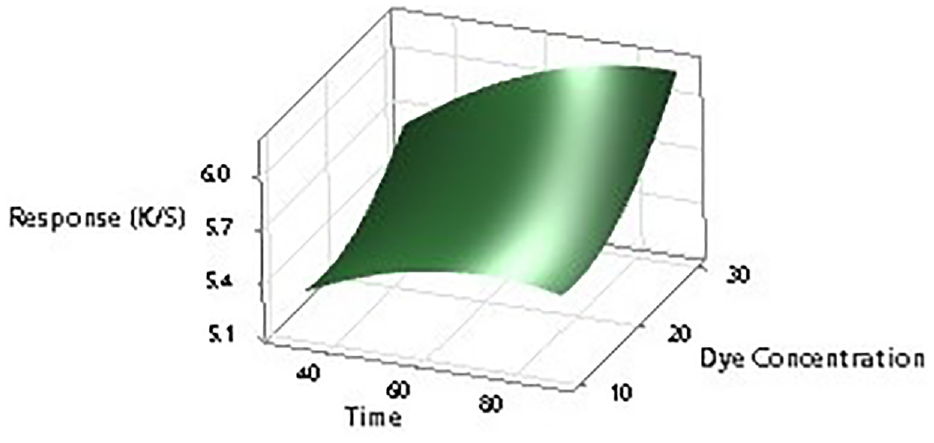
To further establish the impact of input factors on the color strength, two-dimensional (2D) contour ploys and three-dimensional surface plots are drawn with the Minitab software. Figures 7–12 show the contour plots and the surface plots. Each contour plot (Figures 10–12) shows a clear peak almost in the center position which indicates that the optimal value lies within the boundary level of experiments (Figures 13–17).
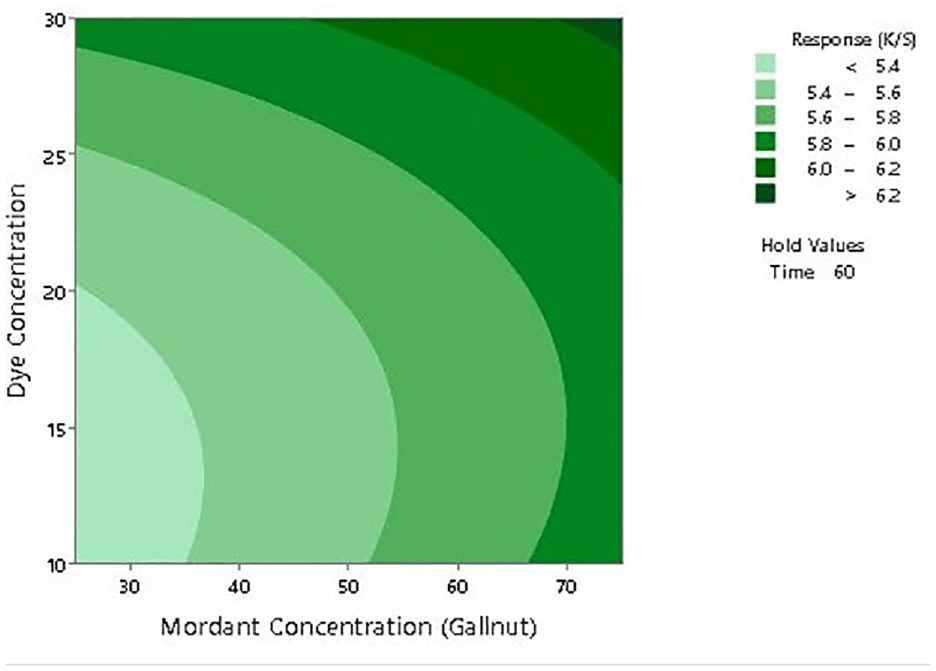
Two-dimensional surface plot of K/S versus dye concentration and mordant concentration.
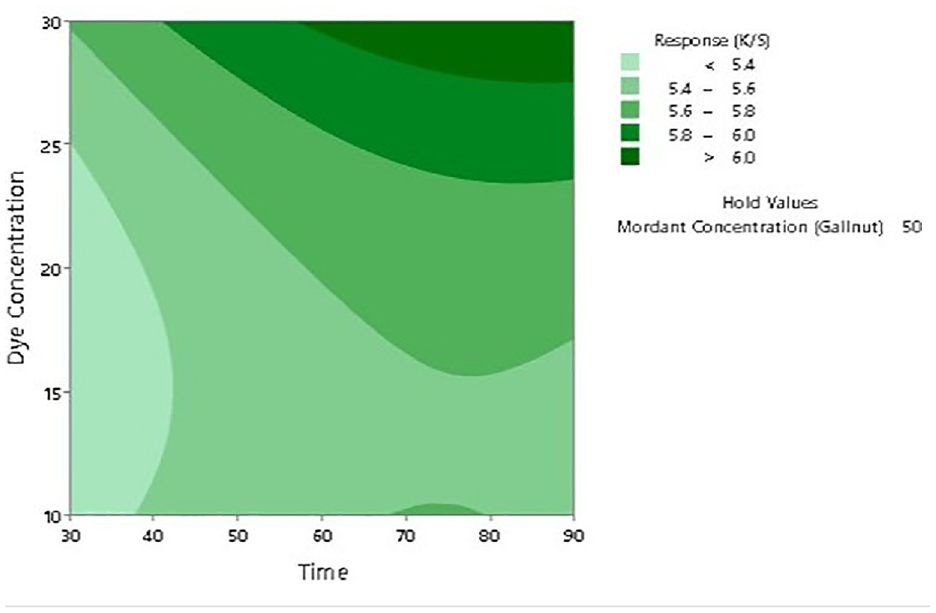
Two-dimensional surface plot of K/S versus dye concentration and dyeing time.
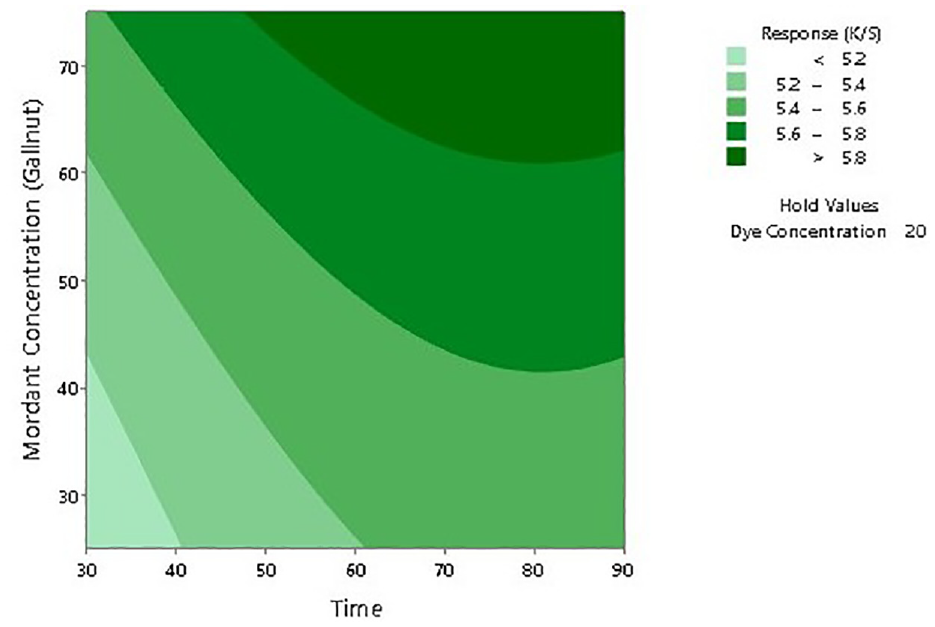
Two-dimensional surface plot of K/S versus mordant concentration and dyeing time.
Contour plot of K/S versus mordant concentration and dyeing time.
Contour plot of K/S versus dye concentration and dyeing time.

Contour plot of K/S versus mordant concentration and dyeing time.
Conclusion
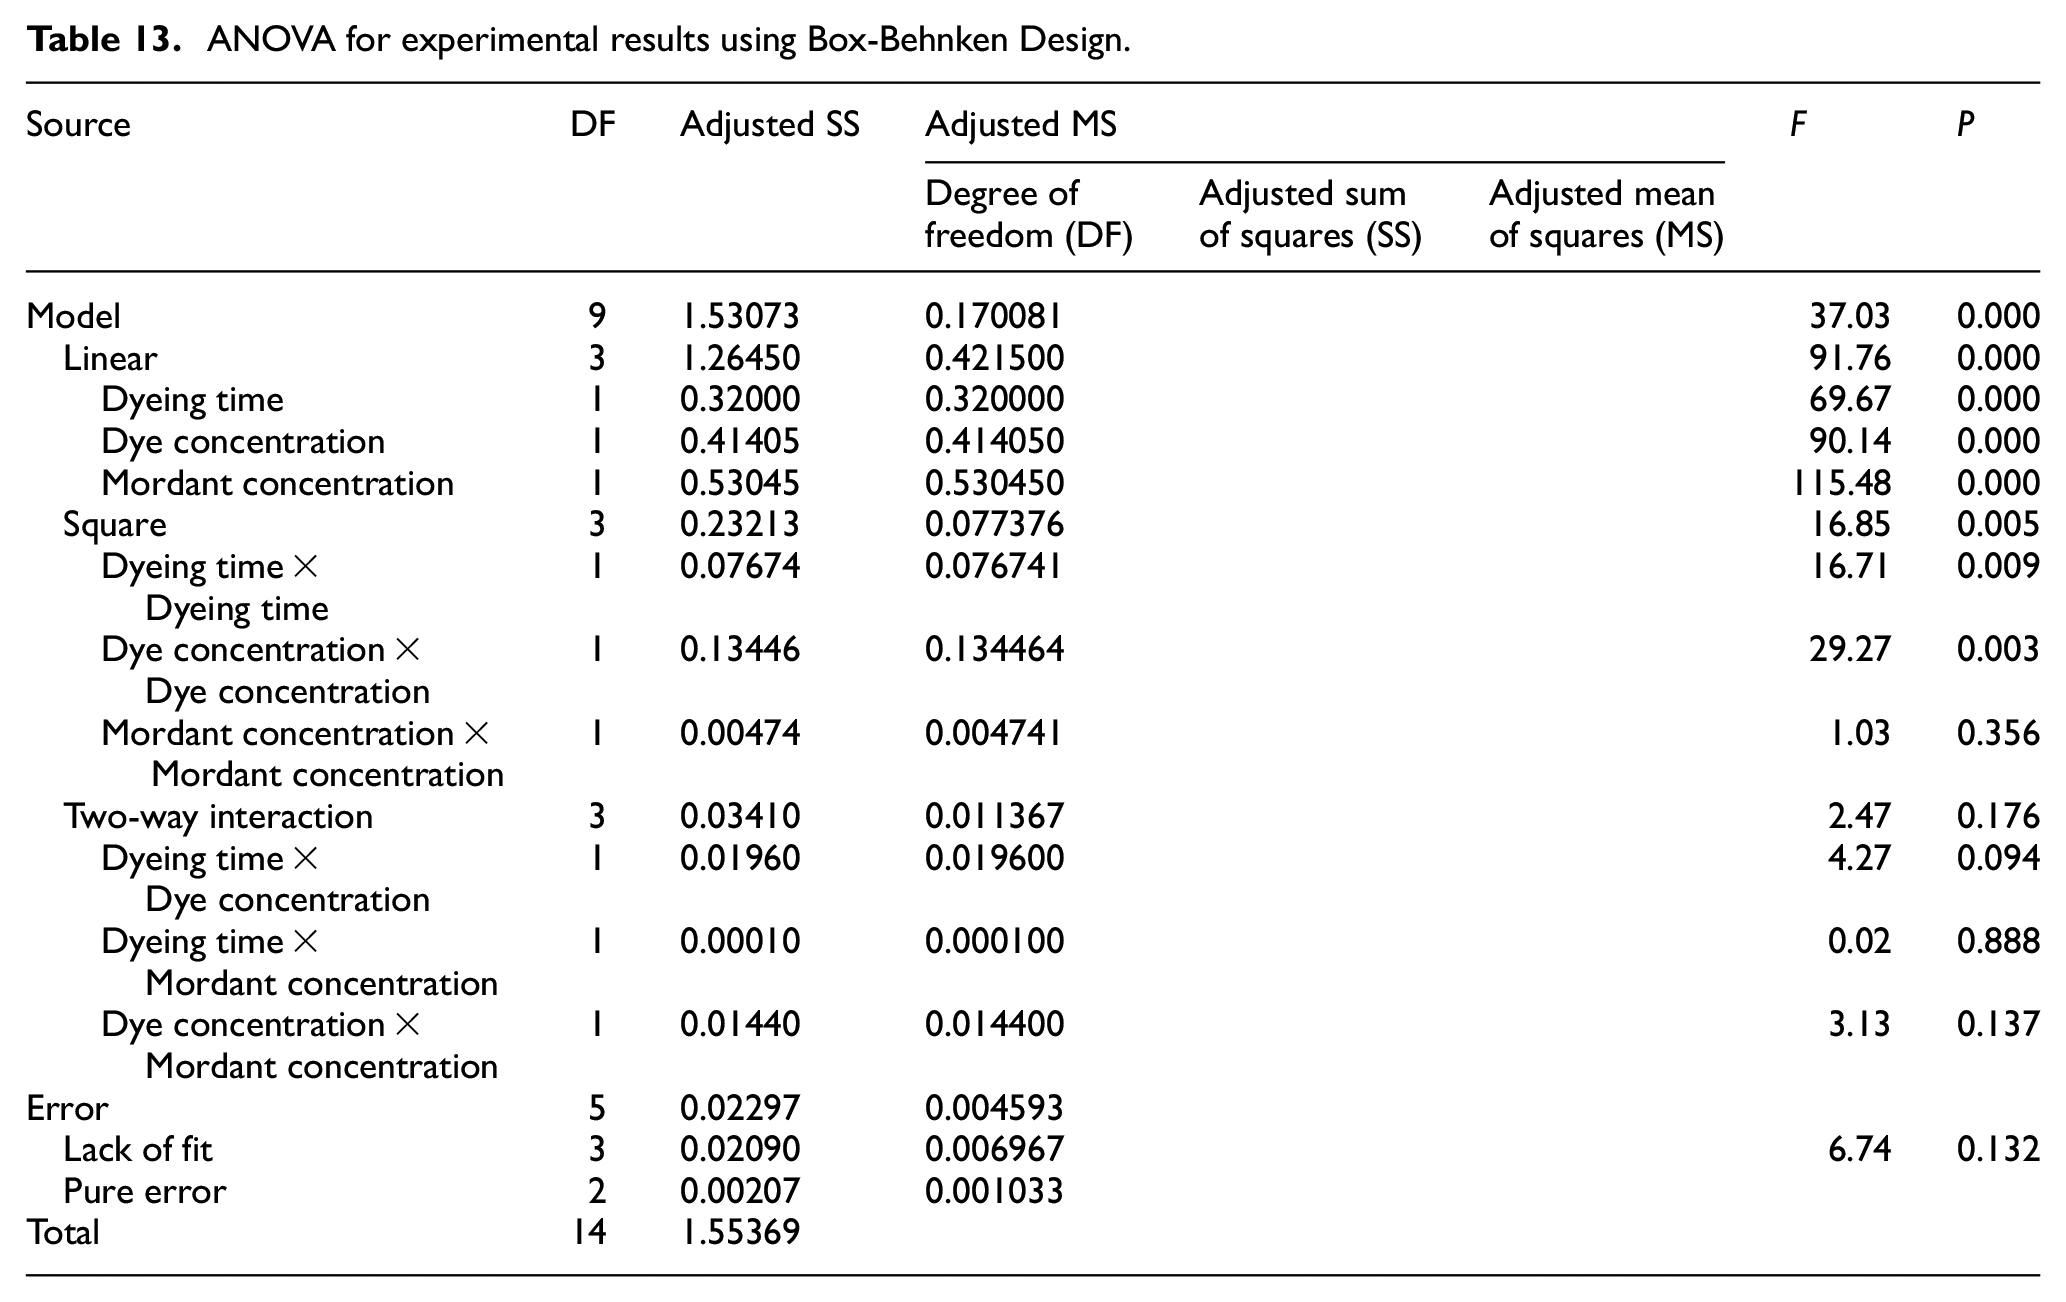
Natural dye was extracted from the petals of marigold flowers through aqueous extraction method. The highest color yield (i.e. the highest OD of the dye extract) for the extraction process was achieved at pH: 11, MLR: 1:25, extraction time: 45 min, and extraction temperature: 90°C. The extracted natural dye was applied on to the jute fabric with the application of two different mordants namely gallnut and natural alum. It was found that application of both mordants in successive stages brought about much higher color strength than the application of a single mordant. The dyeing process of jute fabric with the natural dye extracted from the marigold flower petals using the dual-mordanting method was standardized. The highest color strength of the dyed jute fabric was obtained at pH: 11, MLR: 1:40, dyeing time: 60 min, dyeing temperature: 90°C, and dye concentration of 30% o.w.f. The said standardization was also assessed through two statistical methods, first selection of process condition having the highest significant impact through PBD, followed by ANOVA and regression analysis through BBD. The process variables namely dye concentration, mordant concentration, and time of dyeing were found to be more significant having P values of 0.004, 0.013, and 0.014, respectively, in the PBD. The said design has an R2 value of 0.9307 implying the robustness of the experiment of design. The actual output results of K/S values were very close to the predicted values in the BBD resulting in a very high R2 value (0.9852). This implies the good correlation of the process variables on the color strength. The fastness properties of the dyed jute fabric were found to be moderate under optimal process conditions. This work has established a standardized dyeing method of jute with marigold flower petals using a bio-mordant and inorganic salt (Table 13).
ANOVA for experimental results using Box-Behnken Design.
Footnotes
Acknowledgements
The authors are grateful to the Head, Department of Jute & Fibre Technology, University of Calcutta for providing necessary laboratory and library facilities for the present research work to this group of authors.
Declaration of conflicting interests
The author(s) declared no potential conflicts of interest with respect to the research, authorship, and/or publication of this article.
Funding
The author(s) received no financial support for the research, authorship, and/or publication of this article.