
Abstract
This article presents a systematic study on the effect of input process parameters of the weld-bonding process, namely curing temperature, curing time, welding pressure, welding time and welding current, on the characteristics of the weld bonds, such as bond-line thickness, equivalent nugget diameter, corona size and ultimate shear tensile strength using a Box–Behnken design approach. The effect of overlap length and surface roughness on the shear tensile strength of weld bonds was studied by conducting pilot experiments using a single variable approach. Thereafter, effects of input process parameters, such as curing temperature, curing time, welding pressure, welding time and welding current, on various characteristics of weld bonds was studied by conducting the main experiments according to the Box–Behnken design and response surface methodology (RSM). Regression models were developed to study the influence of input process parameters of weld bonding on characteristics of weld bonds, i.e. bond-line thickness, equivalent nugget diameter, corona size and ultimate shear tensile strength. A combination of weld bonding process parameters for maximum shear tensile strength of the weld bond was obtained with the help of analysis. Further, efforts were made to correlate the bond-line thickness, equivalent nugget diameter and corona size with ultimate shear tensile strength of weld bonds. Developed regression models were validated by conducting confirmation experiments.
Introduction
Weld bonding is a hybrid joining technique involving adhesive joining and spot welding. 1 Weld bonding lowers stress concentration at the periphery of the spot weld, which in turn enhances static and fatigue performance.1,2 It is widely used in fabrication of fuselage skin panels, wing centre sections, leading and trailing edges, wing tips, spoilers and actuated floors in aerospace industries, as well as on the assembly line of automobile cars.
Recently, few reports have been published in the area of effect of input process parameters on tensile, fatigue performance and stress distribution of weld bonds of 1 mm thick aluminium alloy sheets.3–8 Darwish 3 developed weld bonds of commercial aluminium sheets of 1 mm and 2 mm and found that tensile shear strength and damping capacity of the weld bond were higher than the spot welds. You 4 investigated the effect of bi-adhesive on the stress distribution in the weld bond of an aluminium alloy in single lap joint configuration using an elasto–plastic finite element method (FEM) and showed stress distribution along the mid-bond-line. Use of bi-adhesives was recommended to improve the load bearing capability of weld bonds. Liu 5 studied the weldability of laser-assisted weld bonds (LWBs) developed between magnesium and aluminium alloy and reported that dissimilar combinations of magnesium and aluminium can be easily joined by LWBs under controlled parameters. The tensile shear strength of LWB joints was much greater than the laser-welded joints and adhesive-bonded joints. Darwish 6 analysed the stress distribution in spot welds and weld bonds using a finite element technique and found that the presence of an adhesive layer, in conjunction with the spot weld nugget in weld bonds, lowered the stress concentration and strengthened joints. Pereira et al. 7 investigated the effect of overlap length and surface roughness on the tensile shear strength of adhesive bonds of aluminium and reported that an increase of overlap length decreased the shear strength, while a decrease in surface roughness increased the shear strength of single-lap joints. Khan et al. 8 modelled the effect of only three input process parameters related with spot welding, namely welding current, welding time and welding pressure, on shear tensile strength of weld bonds of a 2-mm thick 6061 aluminium alloy sheet.
The presence of a corona bond zone around the periphery of the nugget has been reported in literature.3,8 However, influence of various weld-bonding parameters on the variation in size of the corona zone and its effect on the strength of weld bonds has not been reported. A literature survey did not reveal any systematic study on the effect of five input process parameters of weld bonding, namely welding pressure, welding time, welding current, curing temperature and curing time on bond-line thickness, equivalent nugget diameter, corona size and ultimate shear tensile strength of weld bonds of a 2-mm thick 5052 H32 aluminium alloy sheet. Therefore, in the present work, an attempt was made to (a) investigate the effect of weld-bonding parameters on the size of corona zone, bond-line thickness (BLT) and nugget using design of experiment, (b) relate the mechanical performance of weld bonds of an AA 5052 aluminium alloy with characteristics of weld bonds, namely corona zone, BLT and nugget size, and (c) identify the weld bonding parameters resulting in maximum weld-bond strength by optimizing the BLT, nugget size and corona size.
Experimental procedure
Material and methods
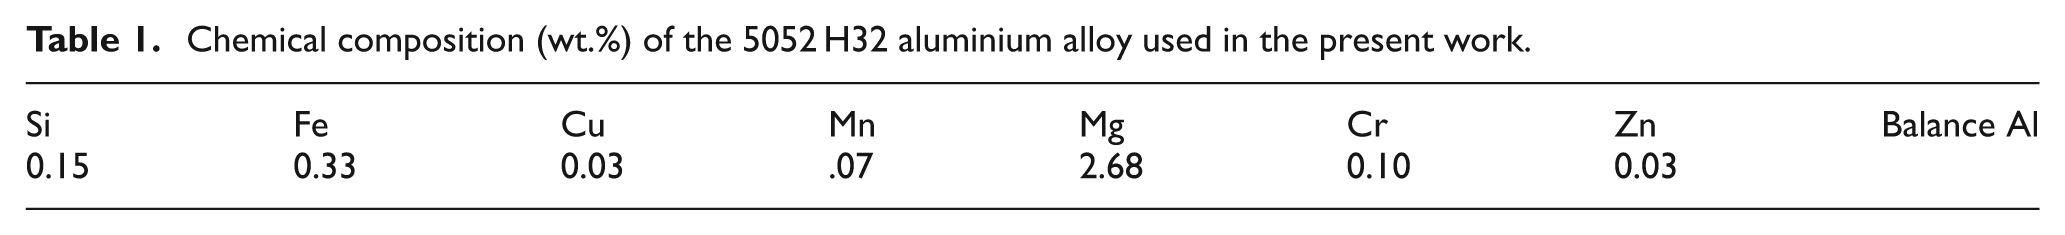
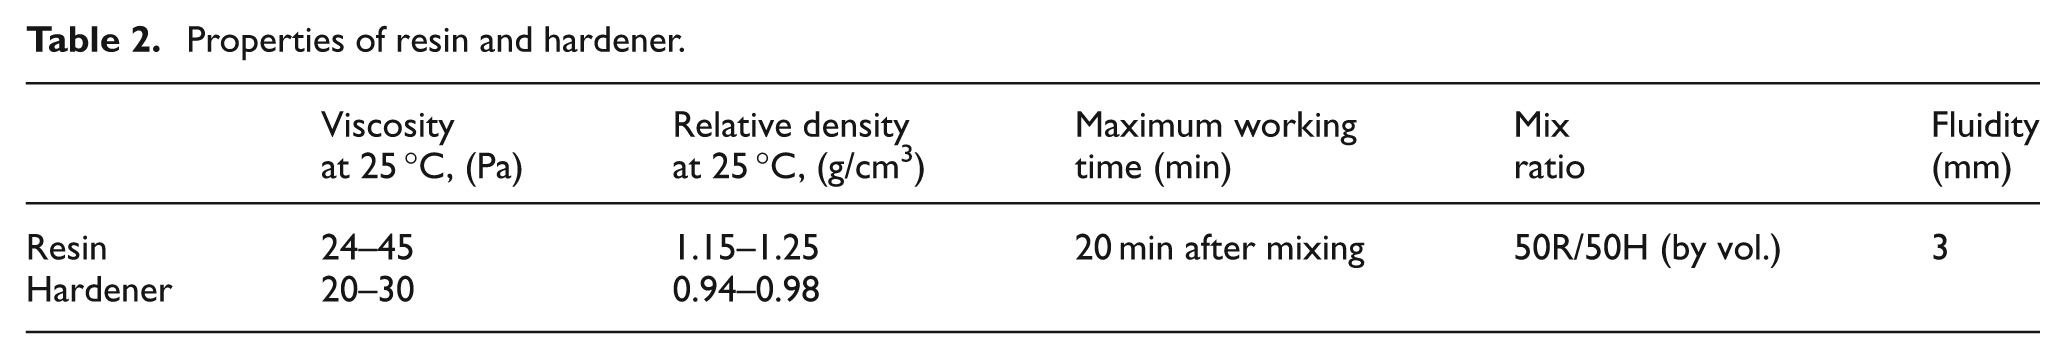
The nominal chemical composition of the 5052 H32 aluminium alloy, and properties of resin and hardener used for adhesive bonding, are shown in Tables 1 and 2. Adhesive was composed of resin (bisphenol epoxy) and hardener (mixture of polyaminoamide and aliphatic polyamine). The weld bonds of the 5052 H32 aluminium alloy, sheet of size 2 × 25 × 100 mm, were developed following a sequence of cutting and cleaning of the sheet, adhesive application and spot welding and curing. 9 A weld-through technique was used to develop weld bonds 10 using the following steps. Procedural steps of weld bonding are schematically shown in Figure 1.
Preparation of 5052 H32 aluminium alloy sheet for weld bonding.
Abrading of the aluminium specimens against different grades of emery paper to remove oxide layer so as to roughen the surface and increase effective surface area for adhesive bonding.
Cleaning of the abraded specimens using acetone to remove any grease, oil, etc.
Marking of the required overlap length on the specimens.
Application of the adhesive layer and development of the adhesive joint.
Development of resistance spot welds through wet adhesive before curing.
Curing of weld-bonded joints was done by placing it in an oven under controlled conditions of time and temperature to facilitate cross linking. The specimens were then cooled in ambient conditions. All weld-bonded joints were tested after 72 h of curing.
Chemical composition (wt.%) of the 5052 H32 aluminium alloy used in the present work.
Properties of resin and hardener.
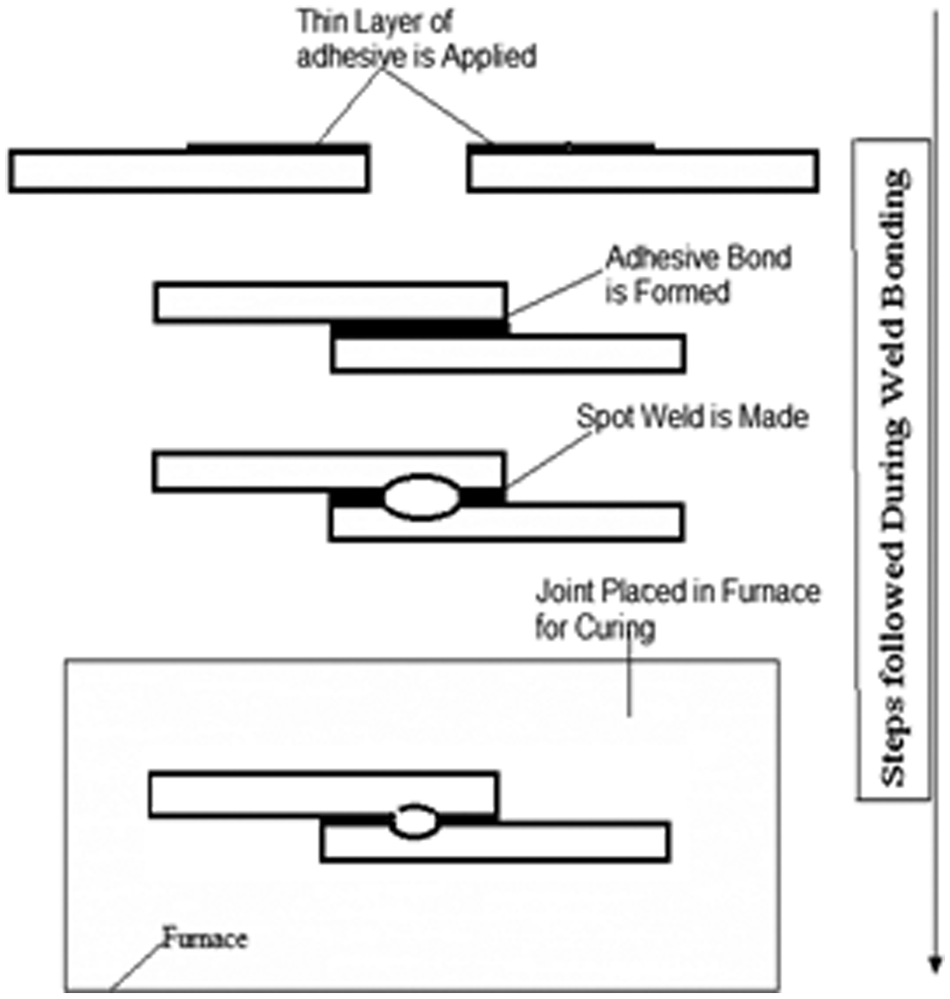
Main steps followed during weld-through technique of weld bonding.
Characterization of weld bonds
Shear tensile test specimens were prepared in accordance with the ASTM D1002 specifications (Figure 2). The shear tensile testing of the weld bonds was carried out at a constant crosshead speed of 1 mm/min on a hydraulically operated universal testing machine. The ultimate shear tensile load carrying capability (KN) was obtained. The corona size and equivalent nugget diameter of the weld bonds were measured using digital vernier callipers from the fracture surface of the weld bond specimens and macrographs of the weld bonds fractured specimens were also taken using a conventional digital camera. The equivalent nugget diameter is the average of major axis diameter (D) and minor axis diameter (d), Deq = (D + d)/2 of the weld nugget.
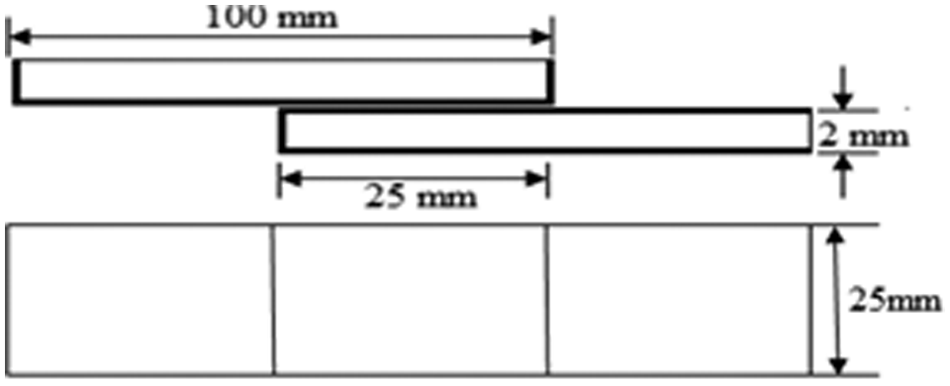
Schematic diagram of shear tensile test specimen.
Scheme of experiments
The experimental investigation was carried out in three phases, namely pilot experiments, main experiments, and confirmation experiments.
Pilot experiments
The pilot experiments were conducted primarily to identify the overlap length and surface roughness value corresponding to the maximum ultimate shear tensile load (USTL)-carrying capability of the weld bond. The weld bonds for pilot experiments developed using a one-variable-at-a-time approach and results of the study are shown in Figure 3(a) and (b). The overlap length of the adhesive joint directly affects load-carrying capability owing to variation in two factors: (a) area of the adhesive joint; and (b) eccentricity of load on the joints. An increase in the area joint increases the strength, but at the same time an increase in eccentricity of load lowers the load-carrying capacity. Similarly, surface roughness affects two factors: (a) mechanical interlocking; and (b) filling of adhesive at the interface. Both these factors also have opposite effects on USTL of the adhesive joint. High surface roughness promotes mechanical interlocking but prevents complete filling of the adhesive into deep abrasive marks and grooves present on the rough surface, which in turn decreases USTL of the adhesive joints, while fine roughness has the reverse effect in respect of mechanical interlocking and filling of adhesive. 7
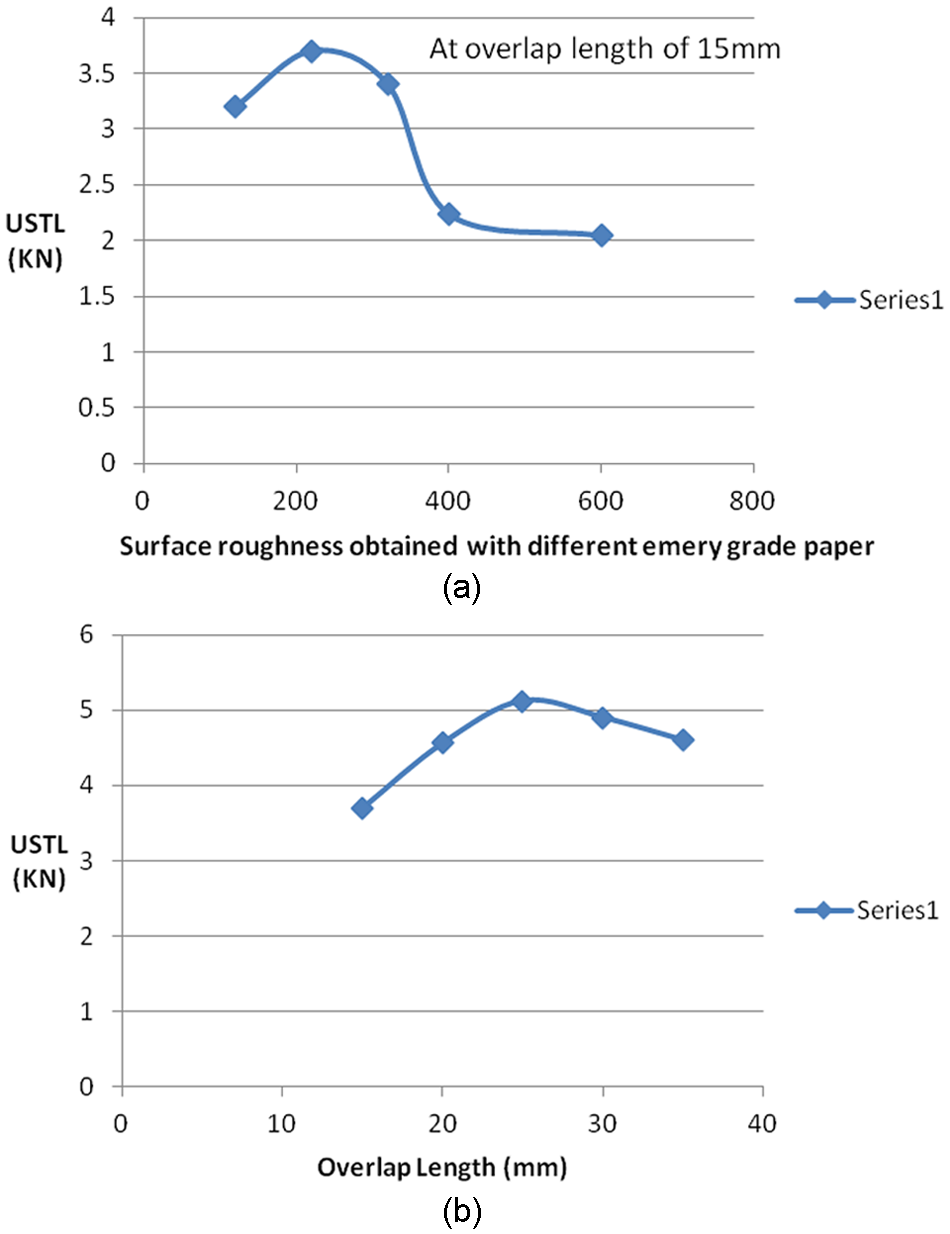
Variation of USTL as function of (a) surface roughness in terms different grades of emery paper, and (b) overlap length.
The influence of surface roughness of the specimens (with and without being abraded against 220 emery grade paper) was studied. Surface roughness was measured using an optical profilometer using the arithmetic mean value (Ra), the root mean-square-average (Rq), ten-point mean roughness (Rz) and the maximum roughness height (Rt). The surface roughness profile of the work surface before and after abrasion against 220 emery grade paper is shown in Figure 4(a) and (b). It is evident from Figure 4(a) and (b) that the surface roughness after being abraded against 220 emery grade paper was significantly increased in comparison to the specimens that are not abraded by any of emery grade paper.
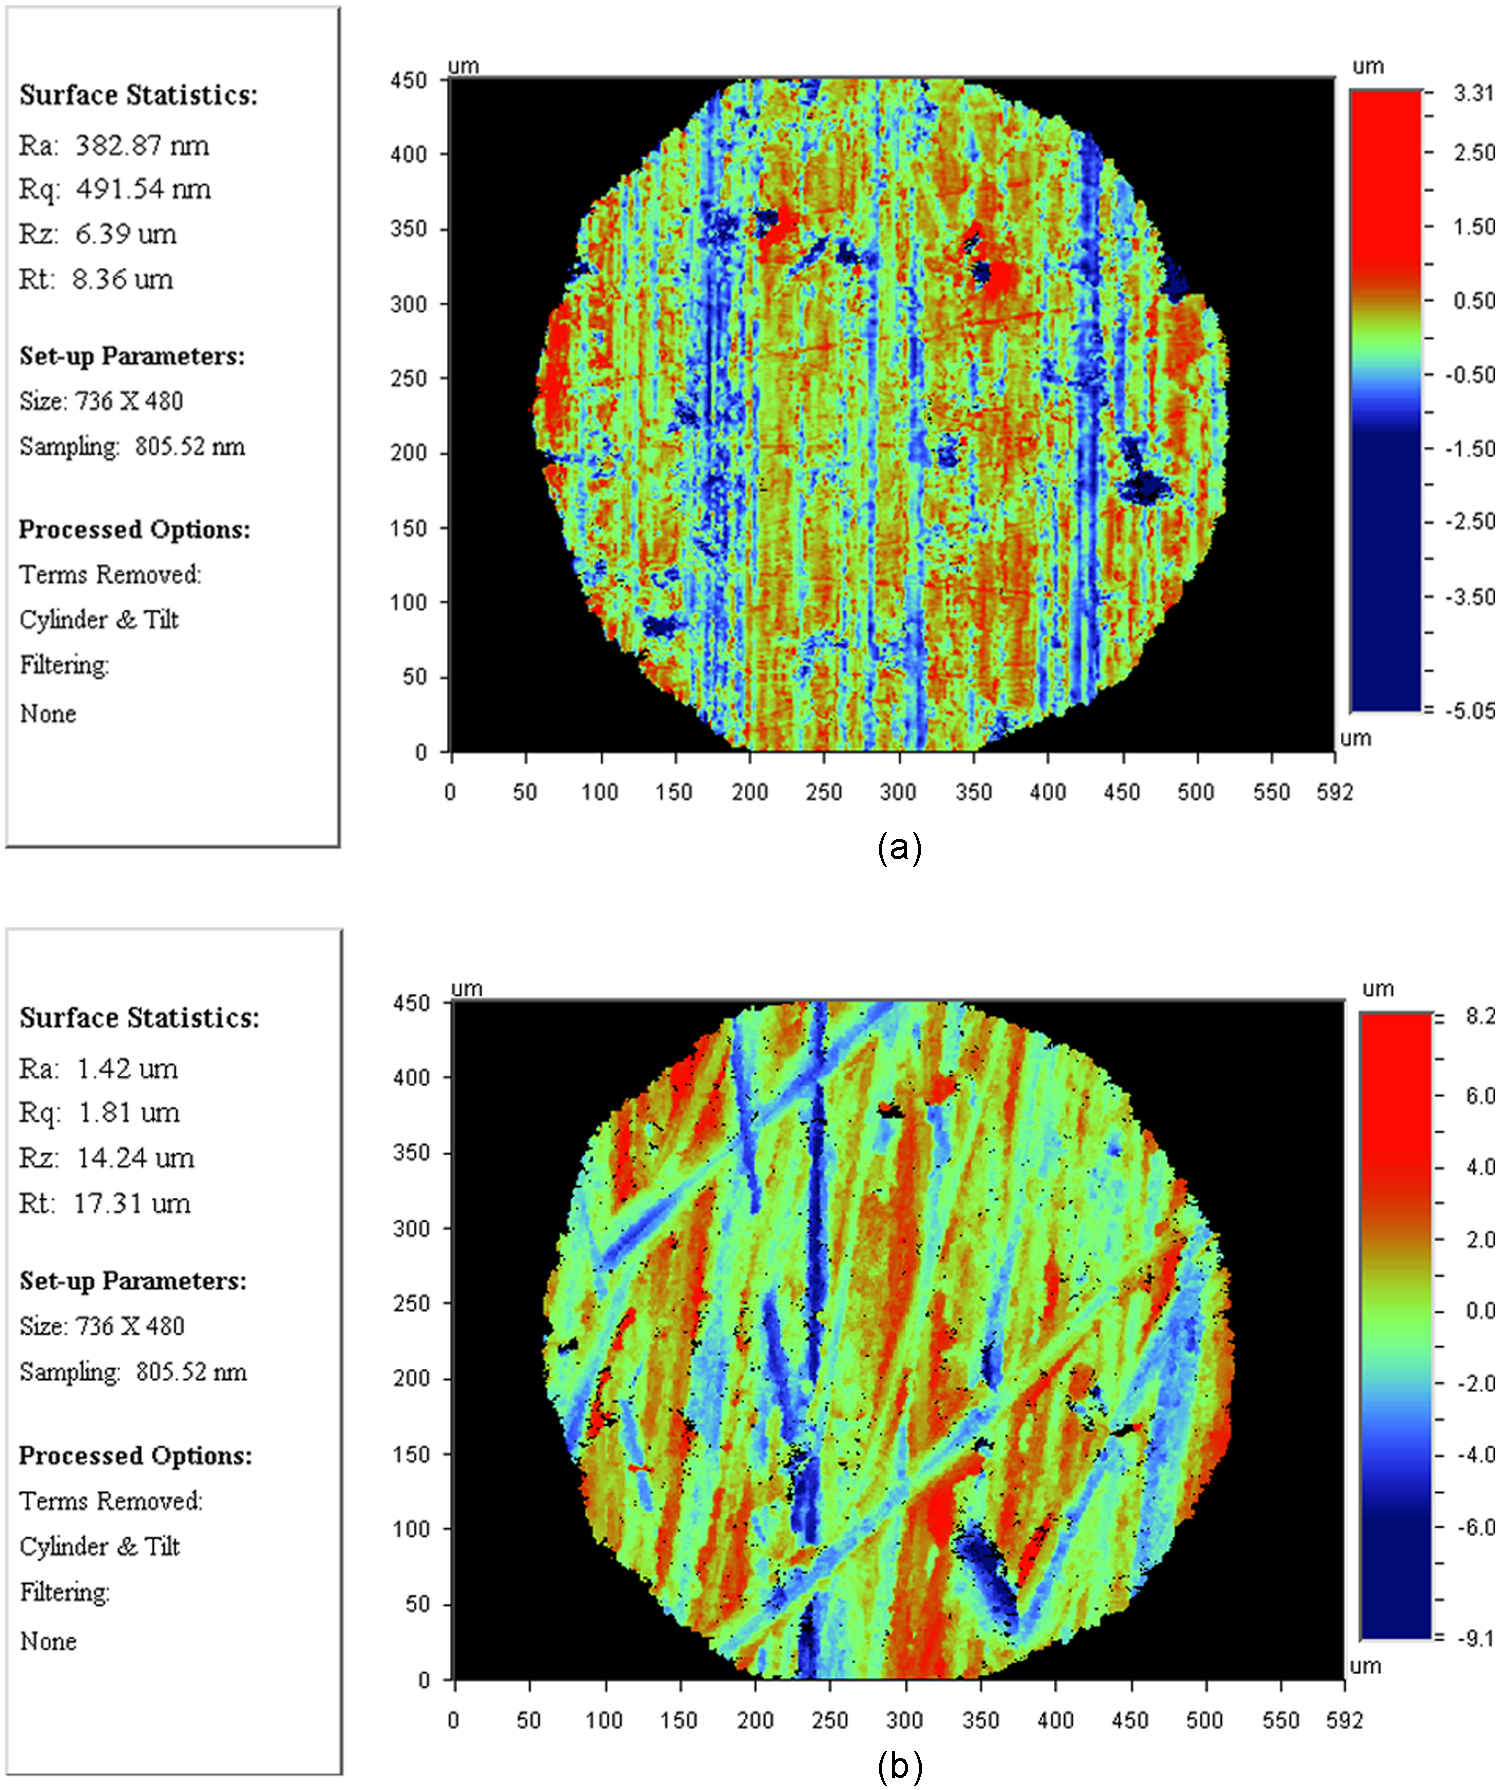
Macrographs showing surface roughness of the specimen (a) before abrading, and (b) after abrading against 220 emery grade paper.
On the basis of the pilot experiments, it was observed that a 25 mm overlap length and surface roughness obtained by abrading the specimen against 220 emery grade paper yielded maximum USTL-carrying capability of the adhesive bond (Figure 3). Accordingly, these values of overlap length and surface roughness were used for developing weld bonds for the main experiments, while other significant input process parameters of weld bonding, such as curing temperature, curing time, welding pressure, welding time and welding current were varied.
Main experiments
Design-Experts software was used to generate the experimental design matrix and analysing the response surface models. A three-level, five-factor Box–Behnken design (BBD) was selected for this study, because it can evaluate quadratic interactions between pairs of factors besides minimizing the number of experiments. The number of experiments (N) required for the development of BBD is defined as N = 2 k(k − 1) + C0, (where k is the number of factors and C0 is the number of central points). 11
The influence of five factors (at three levels), namely curing temperature, curing time, welding pressure, welding time and welding current, and interactions between them were examined in this study. Weld bonds corresponding to 46 experimental runs including six replicas of the centre point were developed in the same sequence as given by the design matrix using a level of parameters given in each array (Table 3). Four response characteristics (BLT, equivalent nugget diameter, corona size and USTL) of weld bonds developed for each experimental run were measured. The empirical relationships between the five input process parameters and four response characteristics were developed.
Box-Behnken design experimental-run matrix and results of main experiments for BLT, equivalent nugget diameter, corona size and USTL.
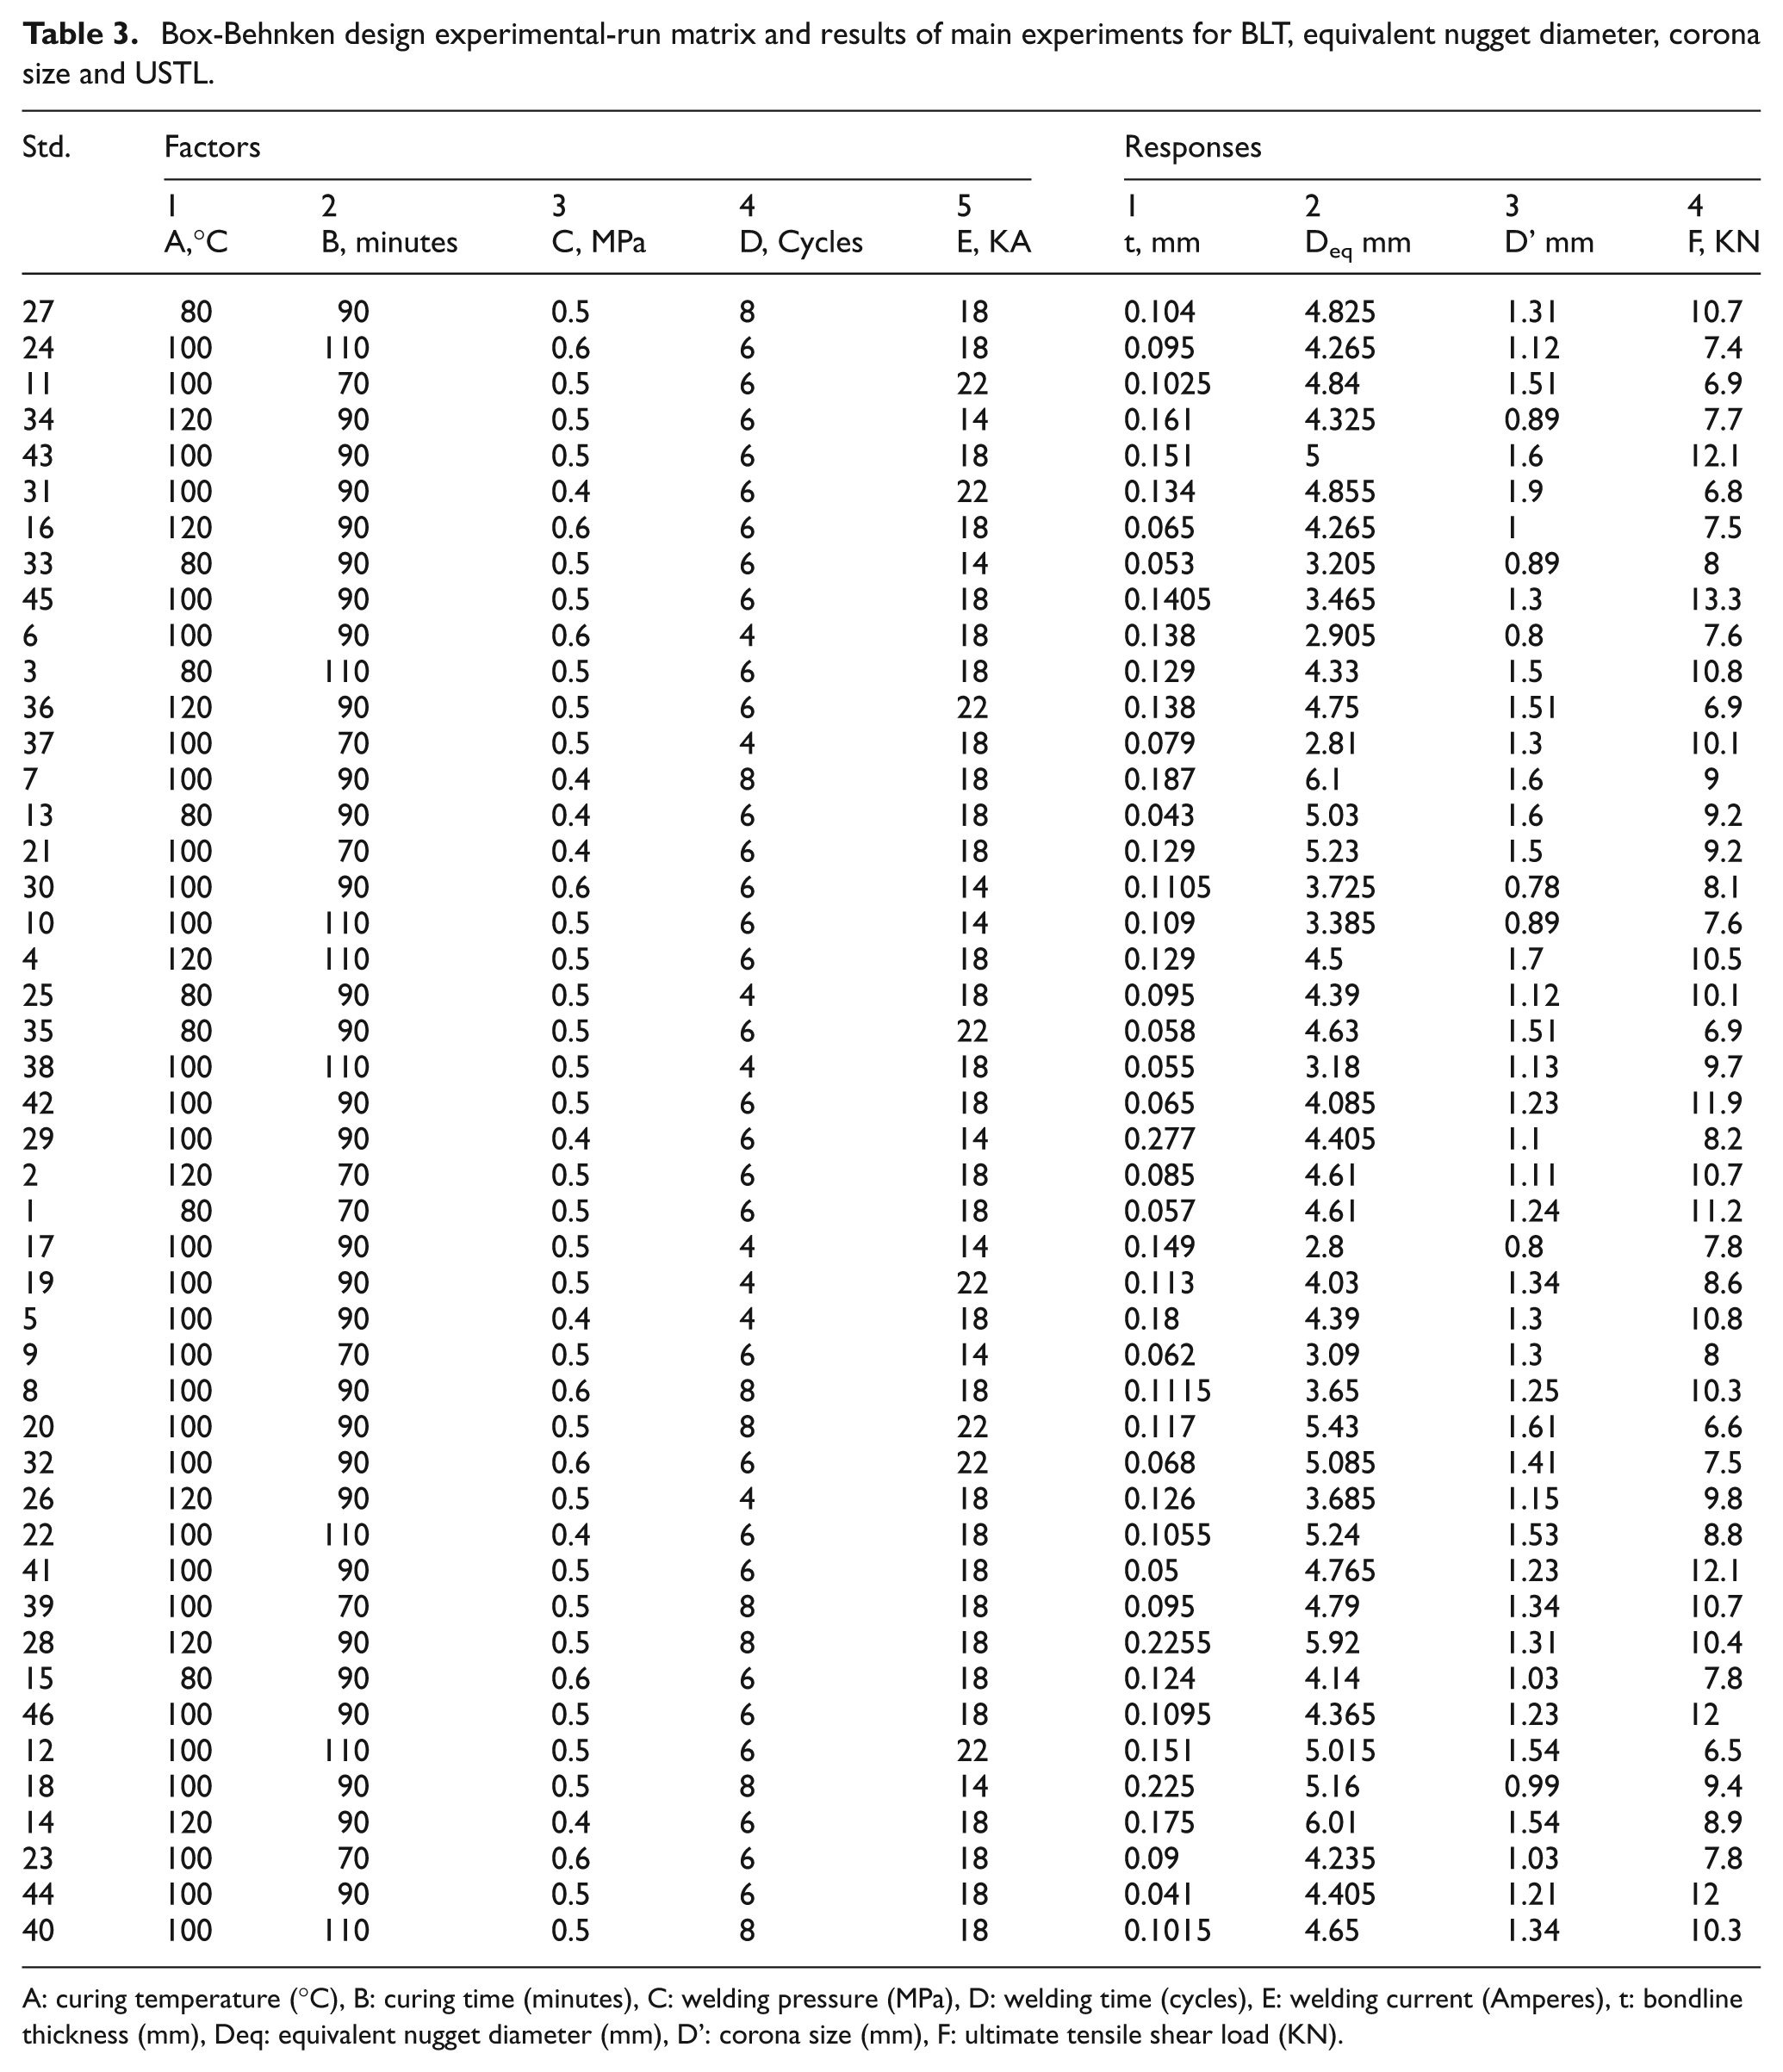
A: curing temperature (°C), B: curing time (minutes), C: welding pressure (MPa), D: welding time (cycles), E: welding current (Amperes), t: bondline thickness (mm), Deq: equivalent nugget diameter (mm), D’: corona size (mm), F: ultimate tensile shear load (KN).
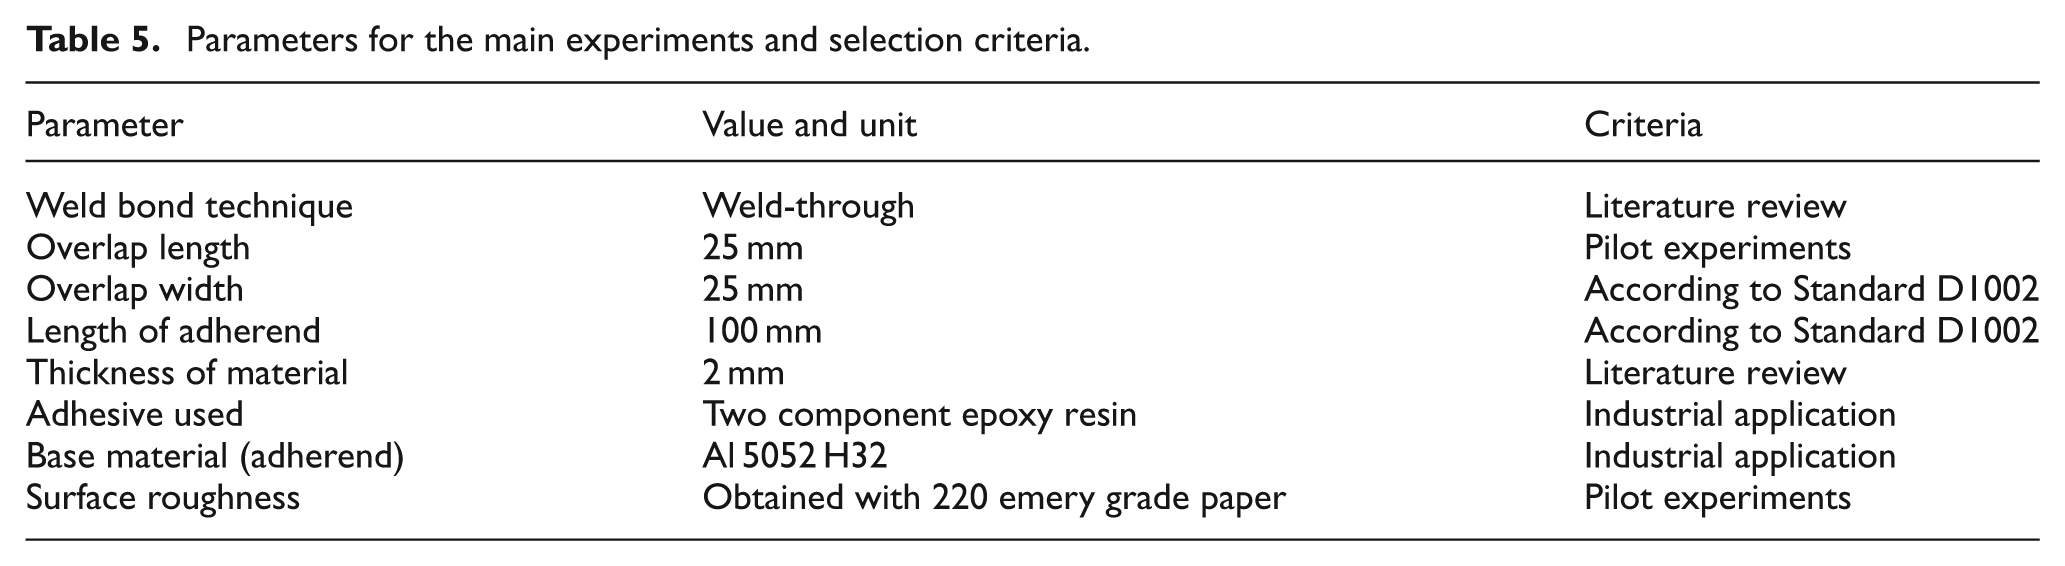
Ranges and levels of input process parameters of weld bonding selected for the pilot and main experiments are shown in Table 4. The levels of input process parameters for the main experiments and their selection criteria are given in Table 5.
Levels and ranges of weld-bonding process variables used in the pilot and main experiments
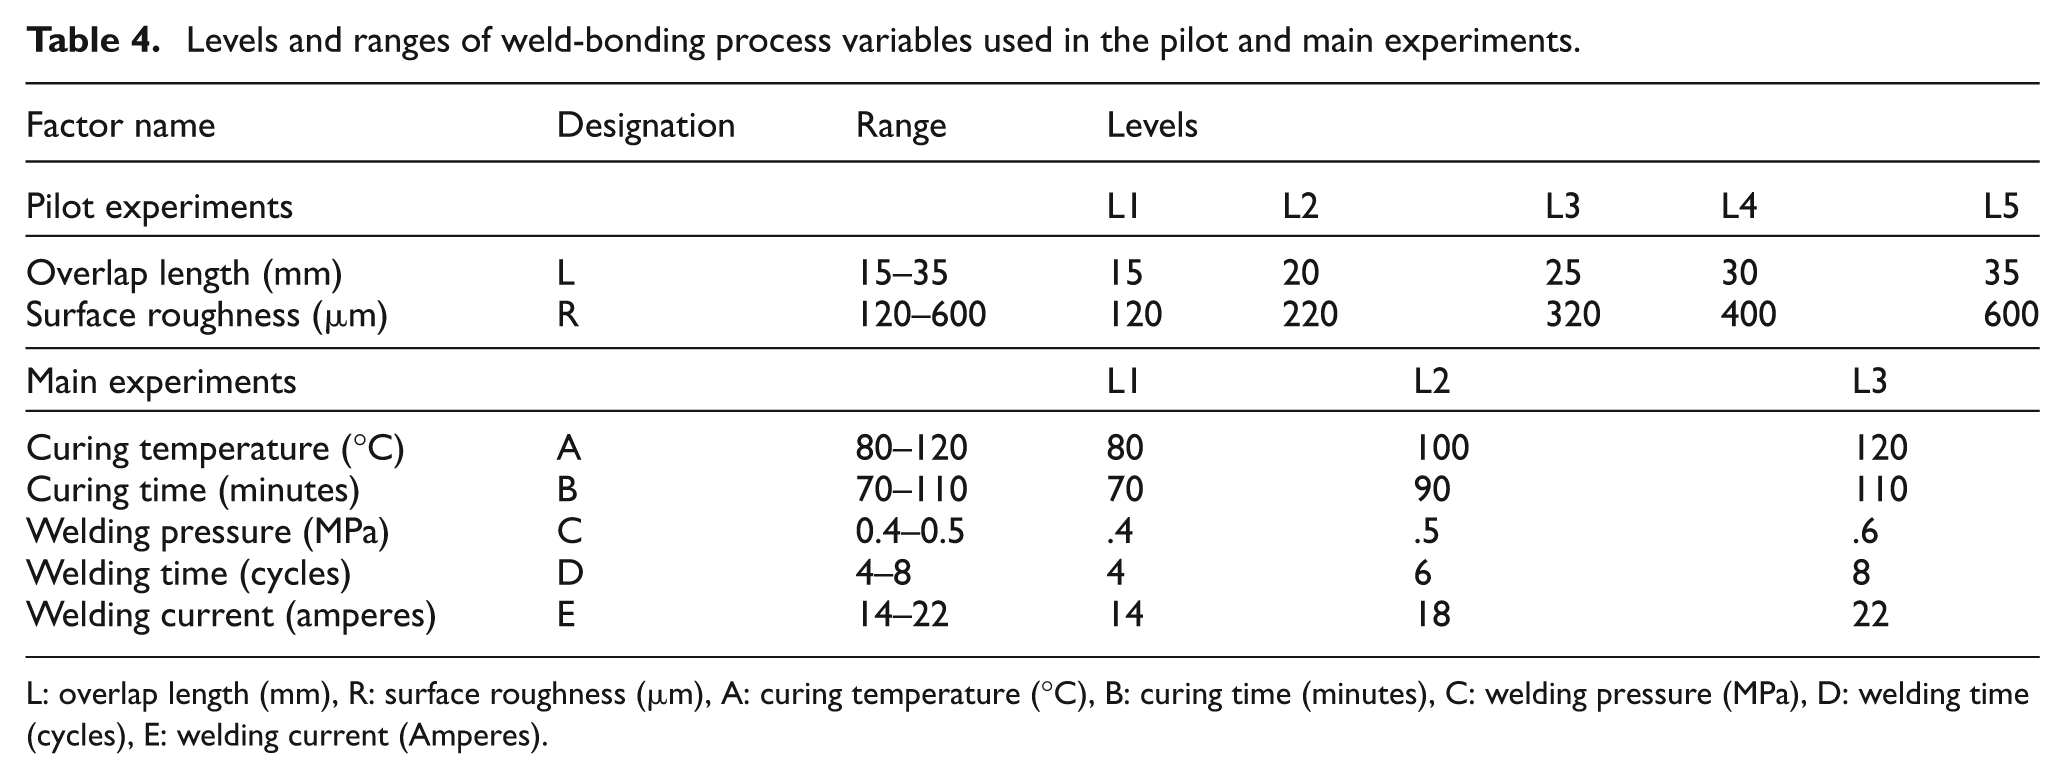
L: overlap length (mm), R: surface roughness (μm), A: curing temperature (°C), B: curing time (minutes), C: welding pressure (MPa), D: welding time (cycles), E: welding current (Amperes).
Parameters for the main experiments and selection criteria.
Results and discussion
Statistical analysis
Each experiment was repeated twice and the average of two values of BLT, equivalent nugget diameter, corona size, and USTL of weld bonds, for each run have been presented in Table 3. The purpose of the statistical analysis of variance (ANOVA) was to identify significant input process parameters affecting said four characteristics of weld bonds. Analysis for each of the above four responses was done with a confidence level of 95%. The significant and insignificant terms were identified on the basis of the ‘Prob > F’ value. Significant model terms exhibit ‘Prob > F’ values of less than 0.05.
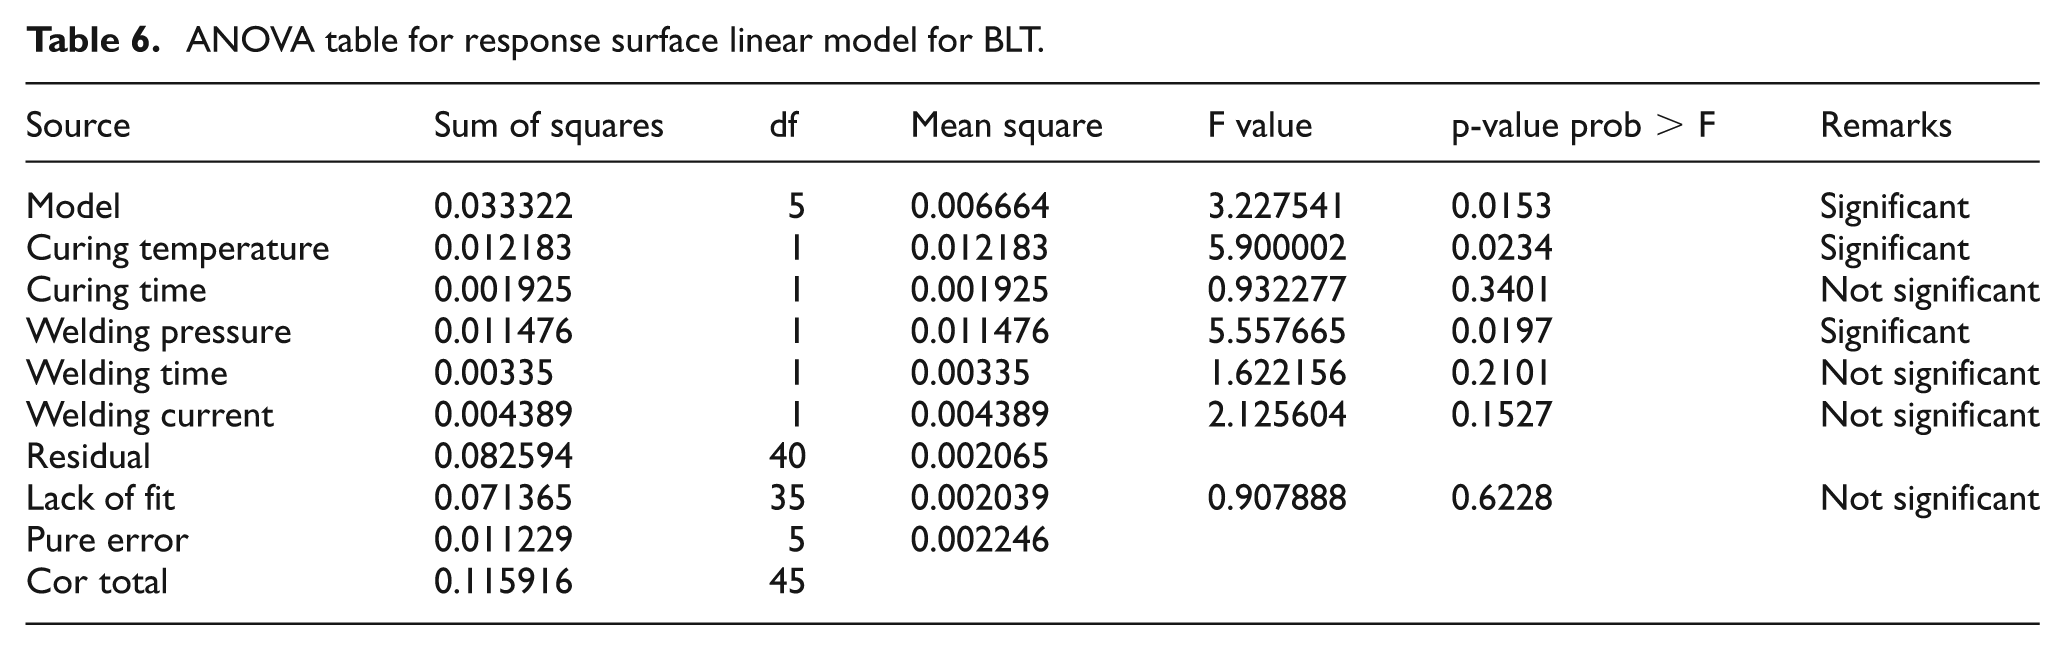
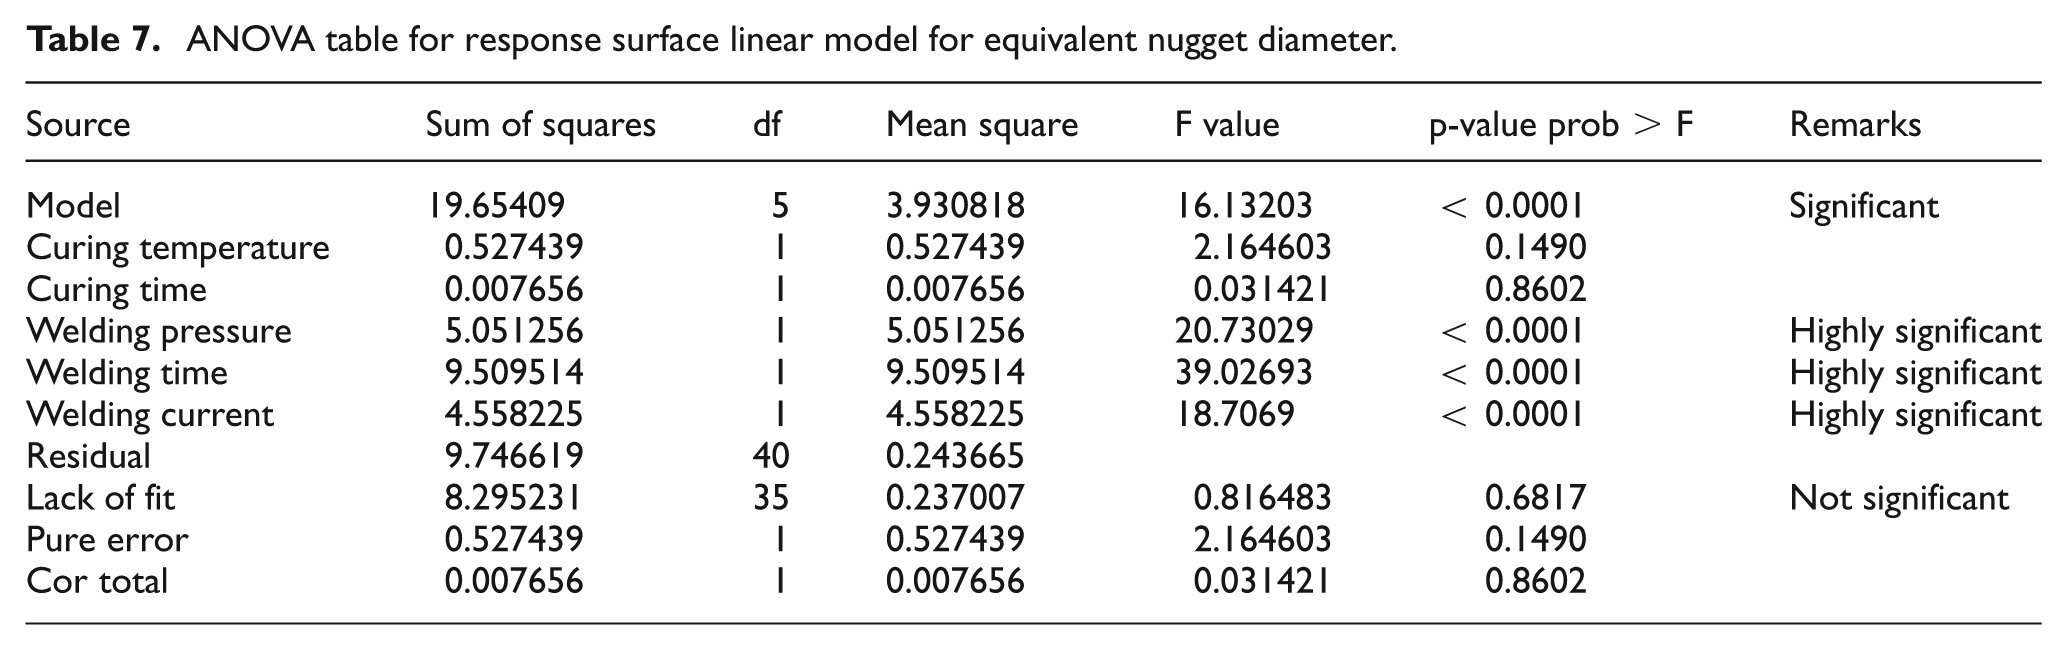
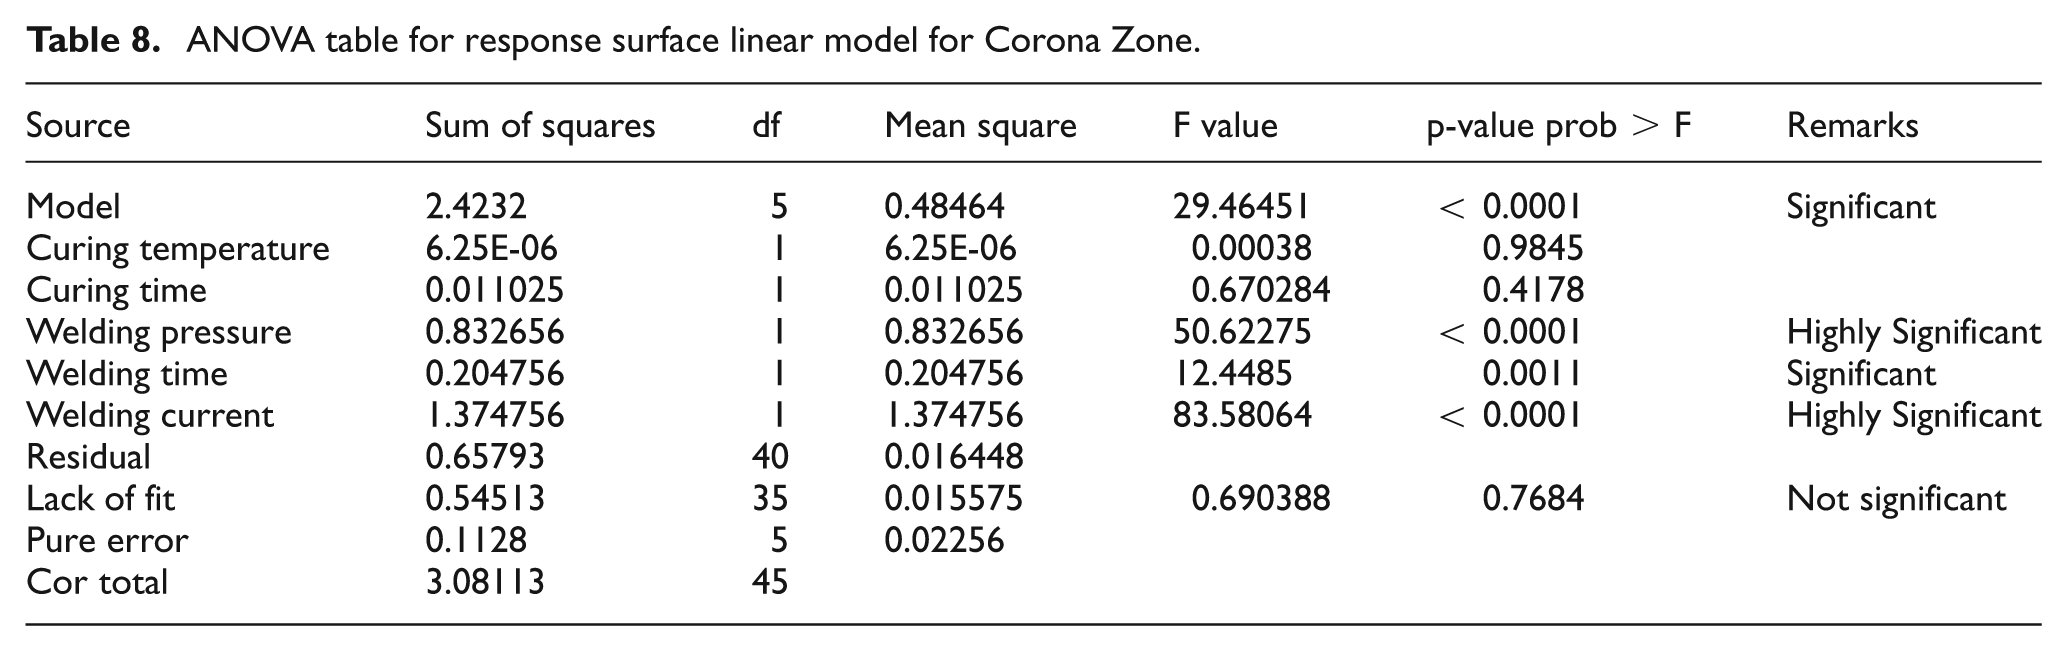
ANOVA for BLT of the weld bond (Table 6) shows that (a) curing temperature, and (b) welding pressure are the significant model terms, whereas curing time, welding time, and welding current are insignificant terms. ANOVA for equivalent nugget diameter and corona size (Tables 7 and 8) shows that (i) welding pressure, (ii) welding time, and (iii) welding current are three significant model terms, while curing temperature and curing time are insignificant. For an equivalent nugget diameter of the weld bonds, all three parameters, welding pressure, welding time and welding current, are highly significant as each one has a p-value < 0.0001, while for corona size, only welding pressure and welding current were found to be highly significant with a p-value <0.0001 and curing time (with p-value = 0.0011) is somewhat less significant.
ANOVA table for response surface linear model for BLT.
ANOVA table for response surface linear model for equivalent nugget diameter
ANOVA table for response surface linear model for Corona Zone
ANOVA for USTL of weld bond (Table 9) shows that welding pressure, welding current, and the interaction between welding pressure–welding time and welding time–welding current, are significant model terms. Additionally, the square of individual parameters, namely curing temperature, curing time, welding pressure, welding time and welding current, were also found to be significant model terms as these have a p-value < 0.05. However, process parameters, namely curing temperature, curing time and welding time, alone are insignificant, probably owing to the narrow range of these process parameters used for the main experiments.
ANOVA table for response surface linear model for USTL.
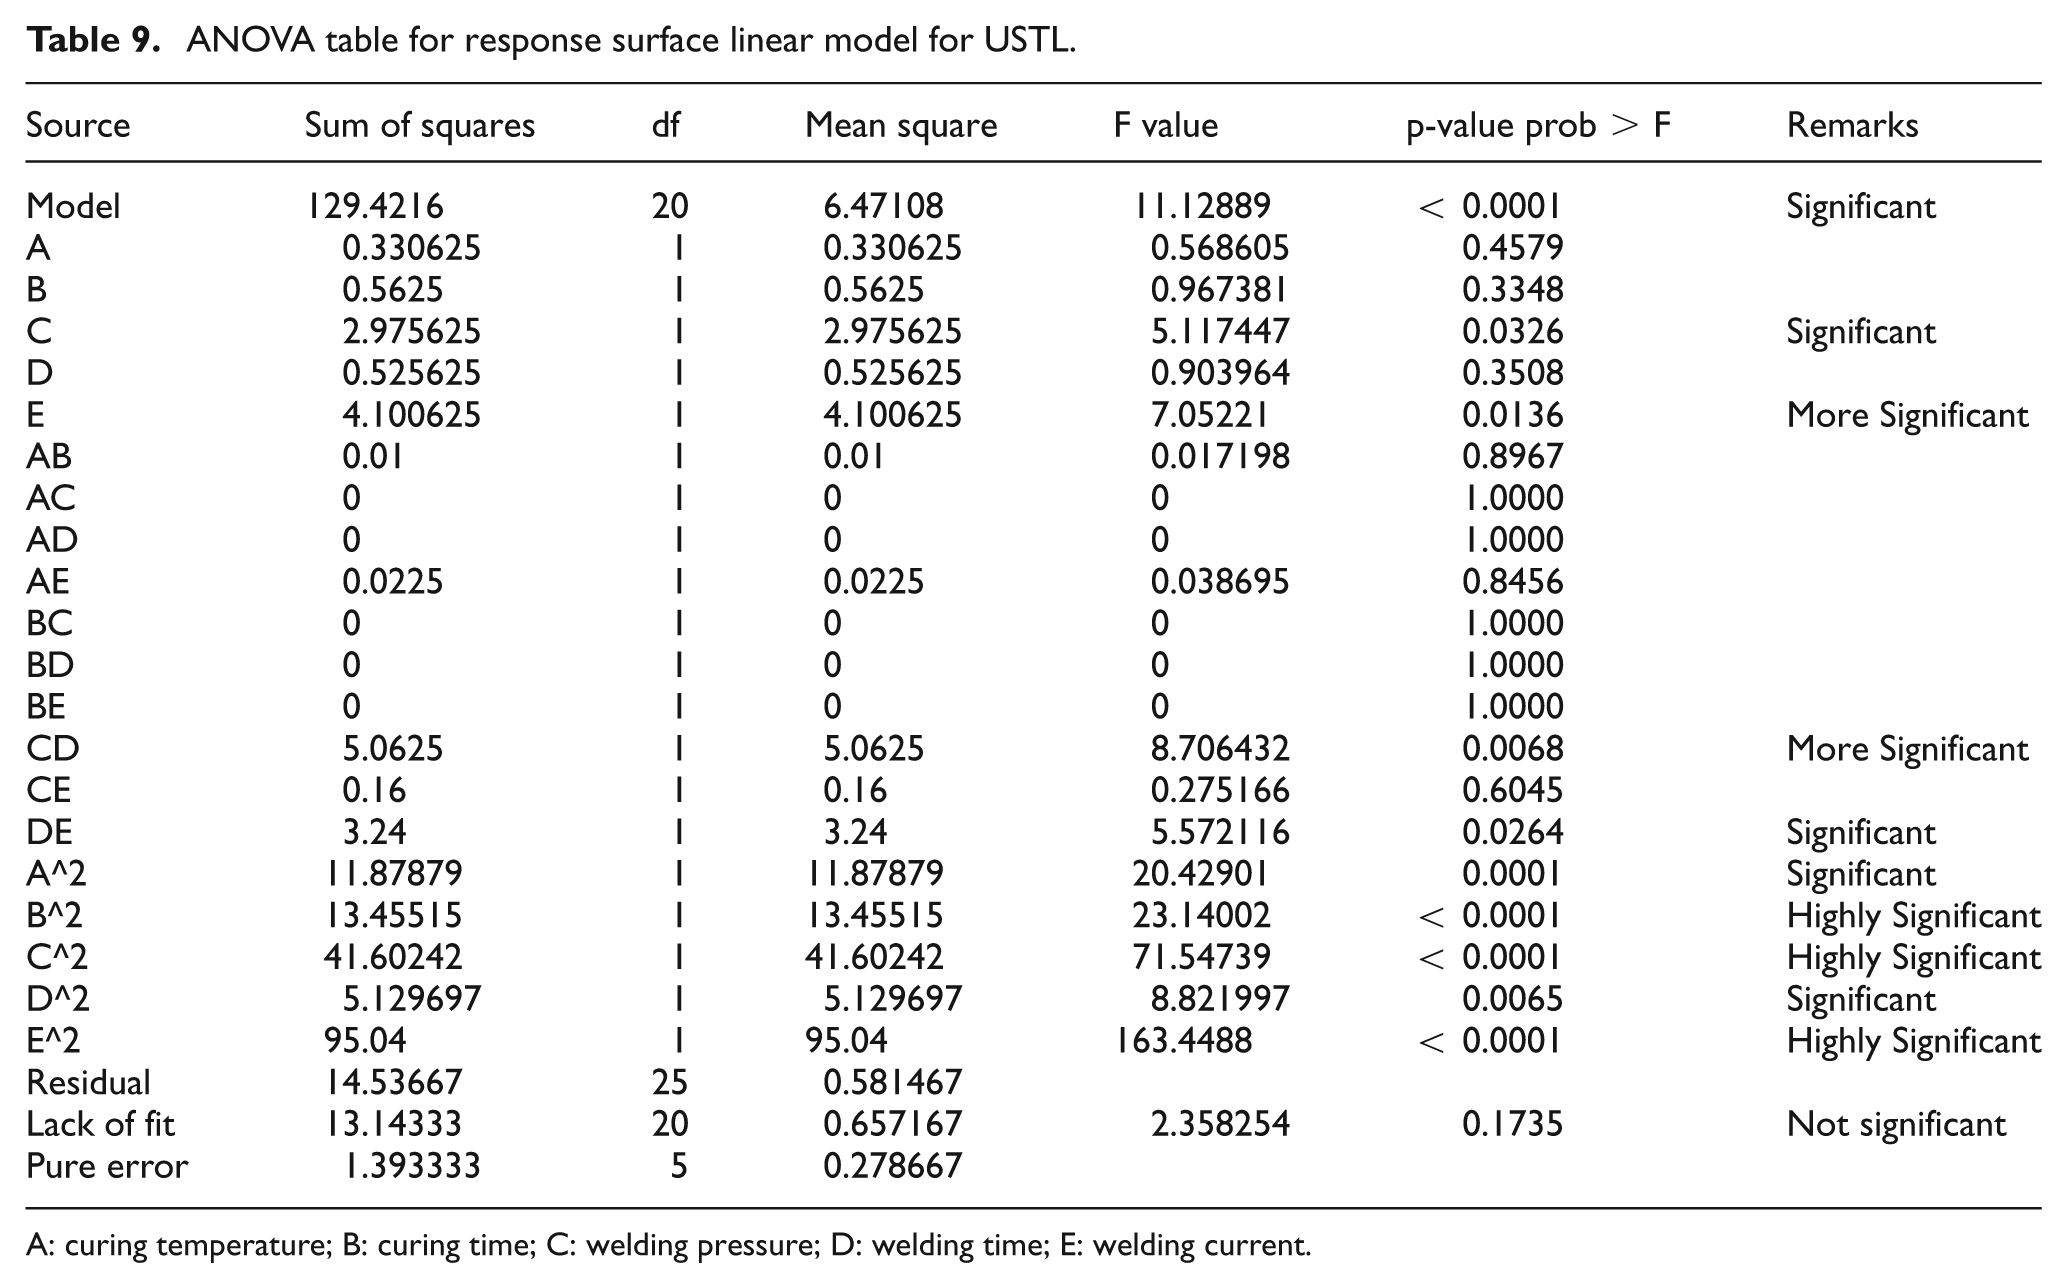
A: curing temperature; B: curing time; C: welding pressure; D: welding time; E: welding current
Multiple linear regression models
To establish the correlation between the input process parameters of weld bonding (curing temperature, curing time, welding pressure, welding time and welding current) and various characteristics (the BLT, equivalent nugget diameter, corona size and USTL-carrying capability) of weld bonds, the following multiple linear regression model equations (1-4) were developed
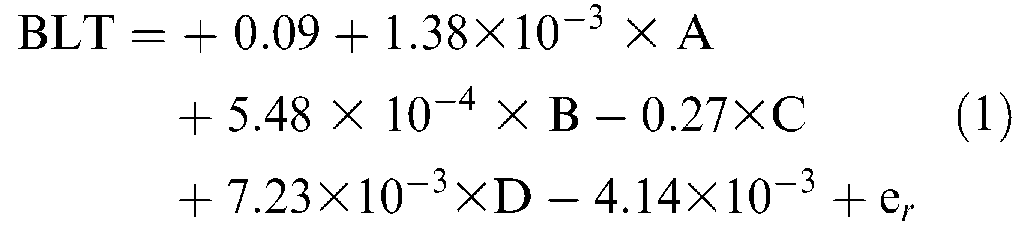
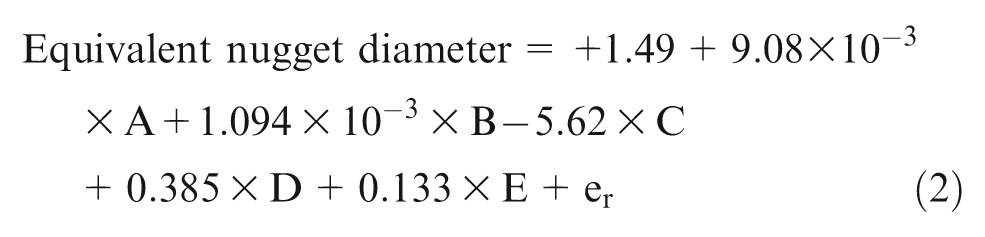
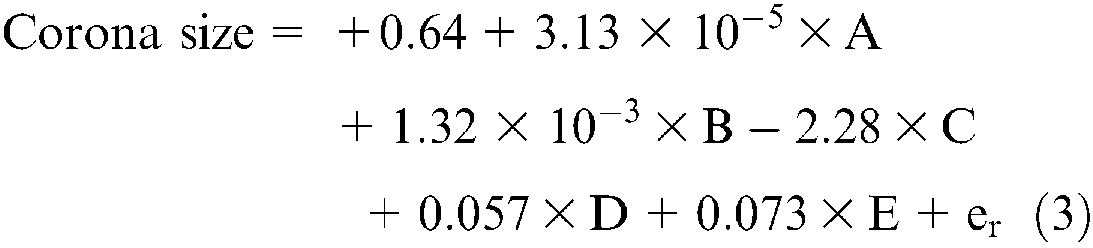
Where A, B, C, D and E are curing temperature, curing time, welding pressure, welding time and welding current, respectively. Characteristics of the weld bonds, namely BLT, equivalent nugget diameter, corona size and USTL, can be calculated within the range of the factors investigated in this work by substituting values of the input process parameters in equations (1), (2), (3) and (4), respectively.
Construction of plots
The response characteristics of the weld bonds were plotted against the input process parameters. Three dimensional response surface plots, based on the model equation, were developed to investigate the effect of interaction between significant main factors on the response characteristics of weld bonds.
BLT
On the basis of ANOVA for BLT, two input process parameters of the weld bonding process, namely welding pressure and curing temperature, were found significant. The effect of welding pressure and curing temperature on the BLT has been presented in Figure 5(a) and (b) It can be observed that an increase in welding pressure reduces the BLT, while an increase in curing temperature increases the BLT. Reduction in the BLT with an increase in the welding pressure is primarily owing to squeezing of the adhesive layer during spot welding that brings the adherends closer to each other. The reduction in BLT of the adhesive layer is known to affect the interfacial contact resistance (so heat generation) and substrate–adhesion interface debonding tendency. An increase in BLT with curing temperature can be owing to a greater thermal expansion of adhesive during curing or instantaneous heat generation during spot welding. However, the authors could not find any support in literature to find the effect of curing temperature on the BLT. These variations in BLT, in turn, can affect the other characteristics of weld bonds, such as nugget size, corona size and USTL-carrying capability.
Variation of BLT as a function of (a) curing temperature, and, (b) welding pressure.
Nugget size
On the basis of ANOVA for nugget size, three input parameters of the weld bonding process, namely welding pressure, welding time and welding current, were found to be significant model terms. The combined effect of welding time–welding pressure and welding current–welding time on the equivalent nugget size has been presented in Figure 6(a) and (b). It is observed from Figure 6(a) that, in general, an increase in welding pressure reduces the equivalent nugget diameter linearly irrespective of the welding time used in this study. Moreover, a decrease in the nugget size of the weld bond owing to an increase of welding pressure was observed to a greater extent for a longer welding time than for a shorter welding time. However, the nugget size was found to increase continuously with an increase of welding time, irrespective of welding pressure. Thus, the effect of weld time and weld pressure is antithesis on nugget size.
Variation of equivalent nugget diameter as a function of (a) welding pressure and welding time, and (b) welding current and welding time.
A combined effect of welding current–welding time on the equivalent nugget diameter has been presented in Figure 6(b). It can be observed that, in general, an increase in welding current and welding time both increases the equivalent nugget diameter linearly. Moreover, an increase in the nugget size of the weld bond owing to an increase of the welding current was more pronounced for a longer welding time than a shorter welding time. However, the nugget size was found to increase steadily with an increase of both welding current and welding time. Thus, the effect of weld time and weld current on nugget size is the same. It can be observed that using a very low welding current for a short welding time nugget is not detectable (Figure 7(a)) and a further increase in current and time increases the nugget size (Figure 7(b) and (c)). An increase in welding current beyond the optimum value, resulted in molten metal expulsion (resulting in internal voids), weld cracking, and lower mechanical strength properties (Figure 8). Excessive current also causes overheating and softening of the base metal, deep indentations and rapid deterioration of the electrodes. 12

Photograph of fractured specimens of weld bonds showing nugget formation and corona size at different parameters.
Photograph of a weld bond specimen developed at 0.4 MPa, 18 KA and 6 cycles, cut along the transverse direction depicting internal voids.
These variations in nugget size can directly be related with heat generation in the interfacial region of the weld bond. Heat generation (Hg) in general increases with an increase in welding time and welding current and reduces with an increase in welding pressure. The heat generated at the interface of the weld bond is given by Joule’s relationship, Hg = I 2 Rτ, where I is welding current, τ is the welding time and R is the contact resistance. 12 Contact resistance, R, is known to decrease with an increase of welding pressure owing to increased metallic intimacy and reduction in thickness of the adhesive layer (BLT) as already described. Thus, reduction in resistance, R, results in less instantaneous heat generation that further decreases nugget size.
Corona size
Heat generation during the resistance spot welding step of weld bonding affects the adhesive in two ways; (a) complete decomposition and mixing of adhesive with molten metal in the spot weld nugget zone, and (b) partial thermal damage and decomposition of the adhesive layer in the vicinity of the weld nugget periphery in the form of a concentric circle as depicted in Figure 7(b) and (c). This thermally damaged area around the weld nugget is termed the corona zone and forms a width in the range 1–3 mm depending upon welding parameters affecting the heat generation during spot welding.
A combined effect of welding pressure–welding time on the corona size has been presented in Figure 9(a). In general, an increase in welding pressure reduces the corona size linearly, especially for a welding time longer than 7 cycles. It can be observed that, in case of a short welding time (less than 7 cycles), with an increase of welding pressure, corona size first decreases and then it becomes constant. Further, the corona size of the weld bond produced, using long weld time and low welding pressure, was found to be larger than that of weld bond produced using a short welding time and high welding pressure. Moreover, a decrease in the corona size of the weld bond owing to an increase of welding pressure was observed to a greater extent for a longer welding time than shorter welding time. At low weld pressure, an increase in corona size with an increase in weld time is steeper and larger than that at high pressures. This is primarily owing to the fact that low pressure results in higher contact resistance, so under greater heat generation will increase in welding time. At high weld pressure, an increase in weld time of up to 7 cycles, does not influence corona size appreciably and remains at a size about 1 mm. Further, an increase in weld time beyond 7 cycles, marginally increases the corona size. Chang et al. 13 reported that the adhesive layer around the weld nugget zone is damaged mostly by carbonizing and decomposition. Thermal damage of an adhesive layer falling under the corona zone will lose its bonding capability and so the larger size of corona zone is expected to deteriorate the USTL-carrying capability of weld bonds.
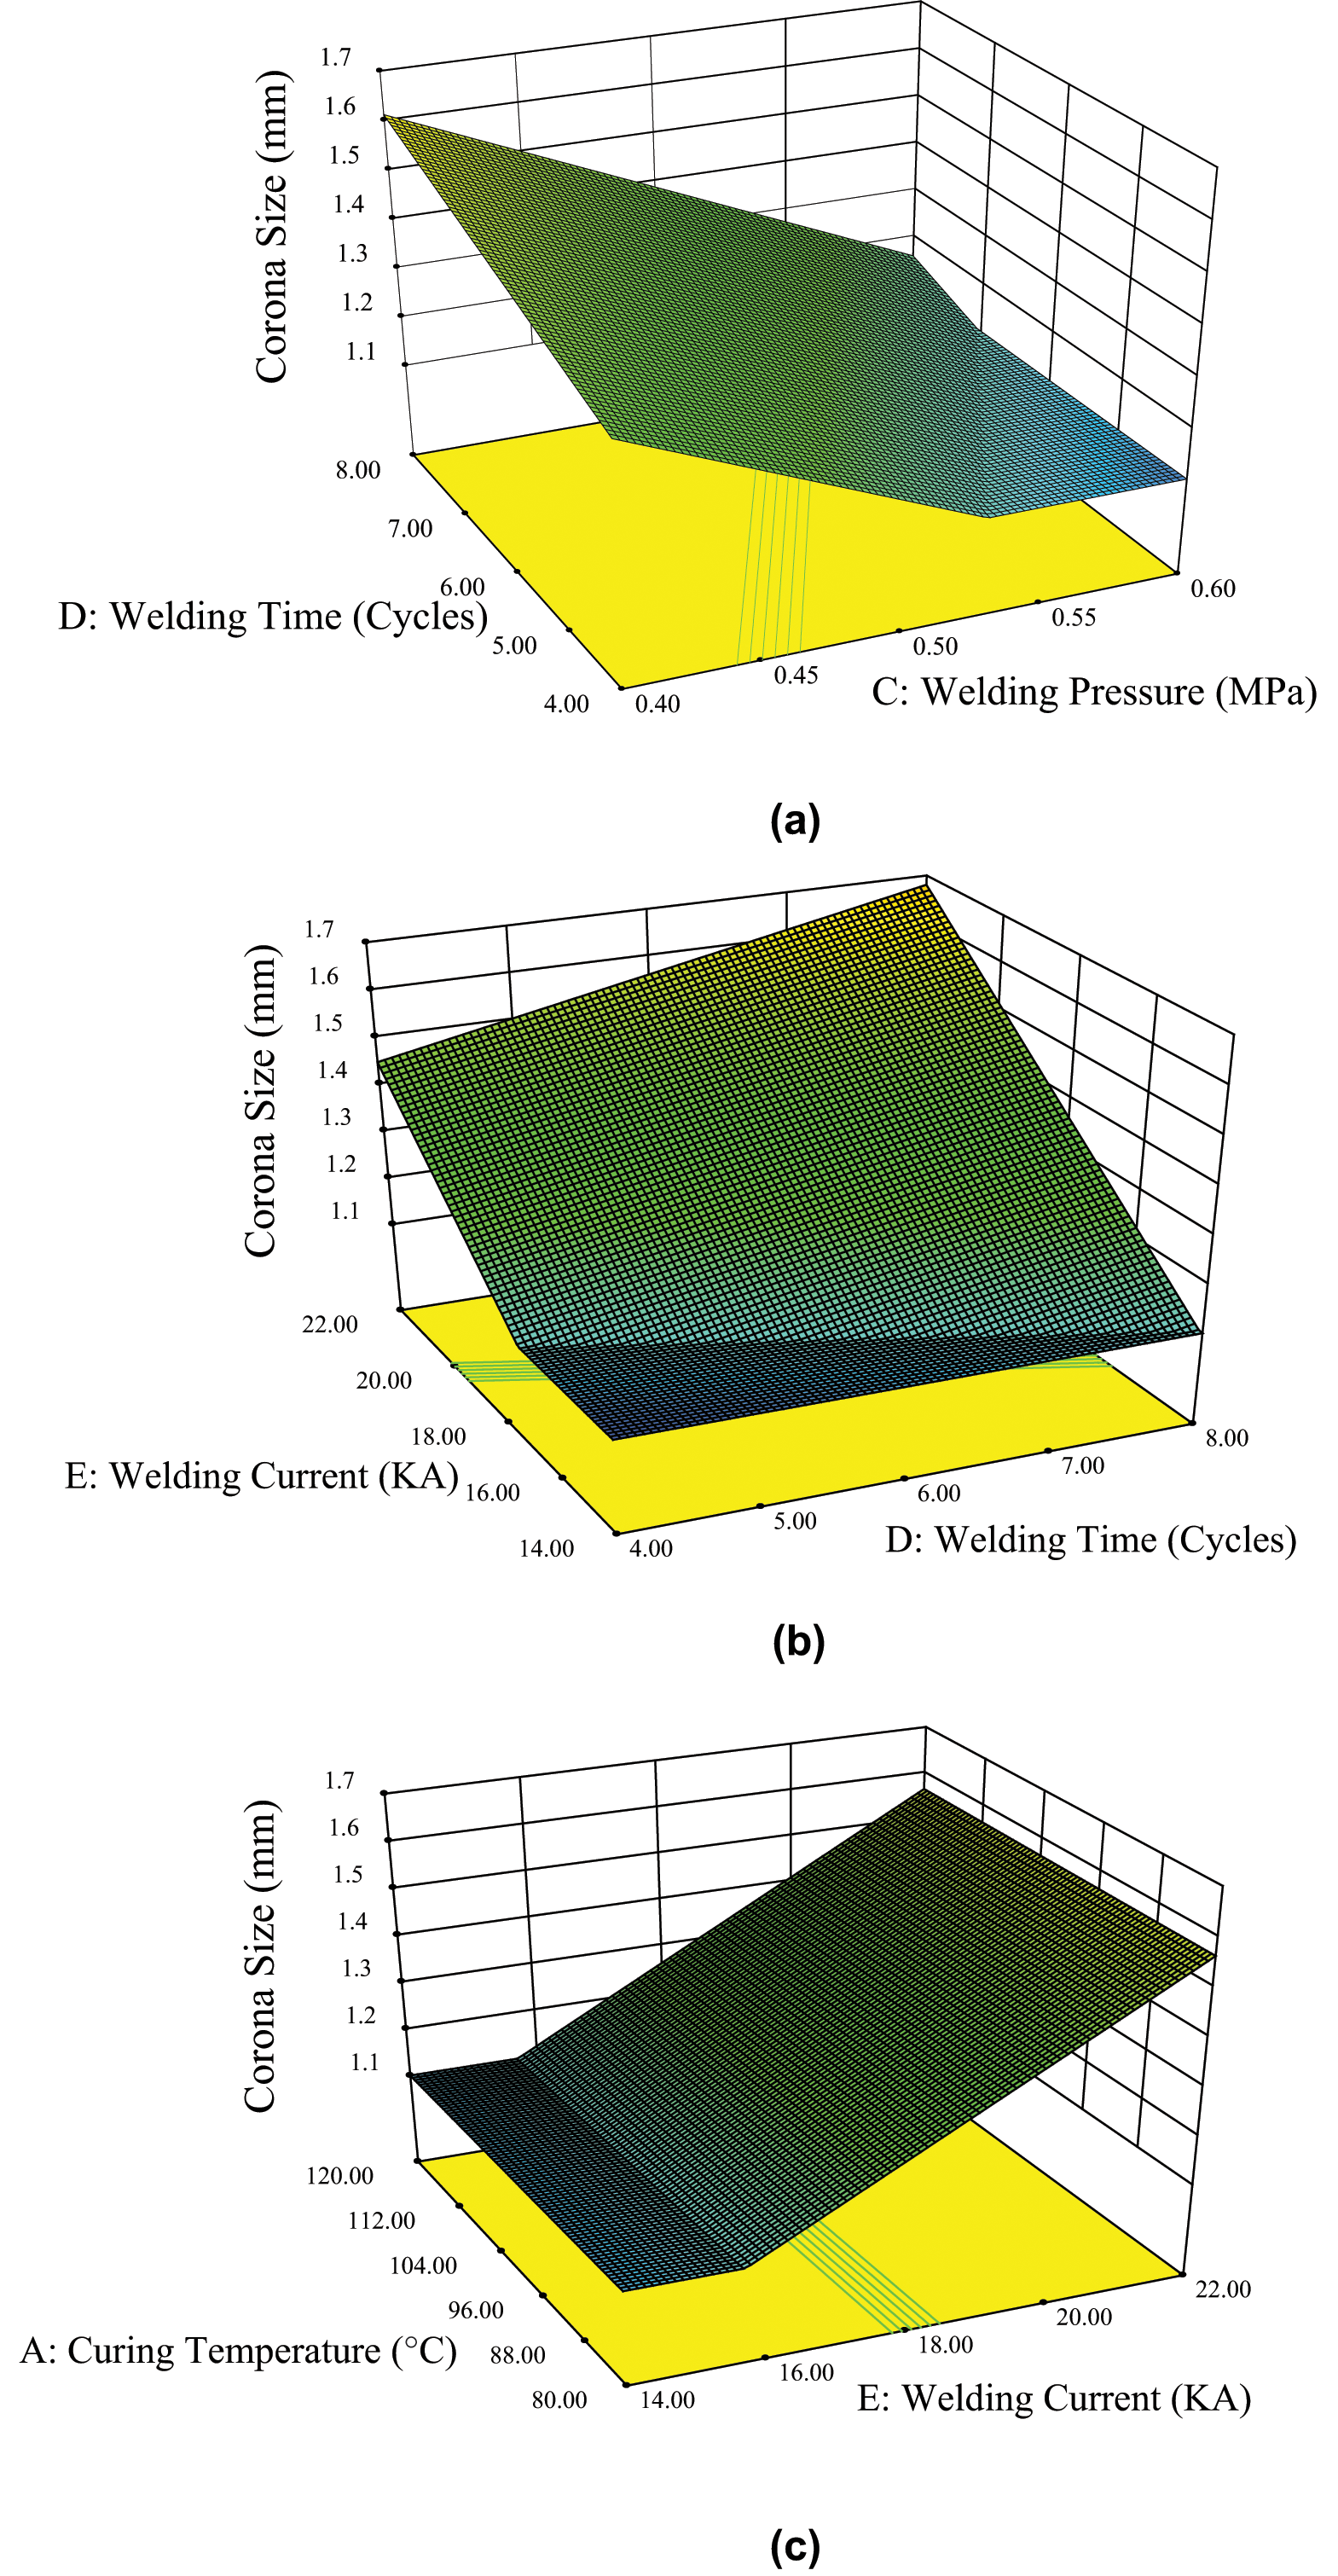
Variation of corona size as a function of (a) welding pressure and welding time, (b) welding current and welding time, and (c) curing temperature and welding current.
It is inferred from Figure 9(b) that an increase in welding time linearly increases the corona size of the weld bonds produced using a high welding current while, in the case of the weld bond, produced using a low welding current, an increase in welding time has a marginal effect on the corona size and it remains almost constant at about 1 mm.
A similar trend was observed with regard to variation in corona size of the weld bond versus welding current relationship for varying welding time. Corona size of the weld bond produced using a longer weld time increases linearly with an increasing welding current, while that in the case of weld bonds produced using a low welding time. It is not appreciably affected until the welding current is increased above 17.5 KA. Further, with an increase in welding current (above 17.5 KA), the corona size increases rapidly from about 1.1 mm to 1.45 mm.
Figure 9(c) shows that an increase in curing temperature does not affect the corona size irrespective of the welding currents used for development of the weld bond in this work. The effect of an increase in welding current on the corona size is similar to what has been described earlier, irrespective of curing temperature investigated in this work.
In addition to heat generation during spot welding, the size of corona zone can be influenced by thinning of the adhesive layer with an increase in welding pressure. A thin adhesive layer produced under high welding pressure conditions can get damaged easily by heat generation during spot welding, which in turn can increase the corona size. Thus, an increase in pressure can produce two opposite effects on the corona size (a) a reduction in heat generation owing to a decrease in thickness of the adhesive layer and an increase in metallic intimacy, and (b) increase in thermal damage owing to thinning of the adhesive layer. Nugget diameter, corona size and USTL of the weld bond joint are closely interrelated and all are affected by heat generation.
USTL
The ultimate shear tensile strength of weld bonds as a function of different input process parameters, namely curing temperature, curing time, welding pressure, welding time and welding current, is shown in Figure 10(a)–(e). It can be observed that, in general, an increase in each of the five parameters (while maintaining others constant at middle levels) increases the USTL-carrying capability of the weld bond and after attaining peak value the ultimate shear tensile strength starts falling. Thus, based on single plots, it is observed that there is some optimum value of each of the above five parameters for maximum ultimate shear tensile strength of the weld bonds. It is observed from Figure 10(a) and (b) that the USTL increases with an increase in curing temperature from 70 to 100 °C, and a further increase in curing temperature up to 120 °C decreases the ultimate shear tensile strength of the weld bond. Similarly, an increase in curing time from 70 to 90 min increases the USTL-carrying capability, thereafter, a further increase in curing time of up to 120 min decreases the ultimate shear tensile strength of the weld bonds.
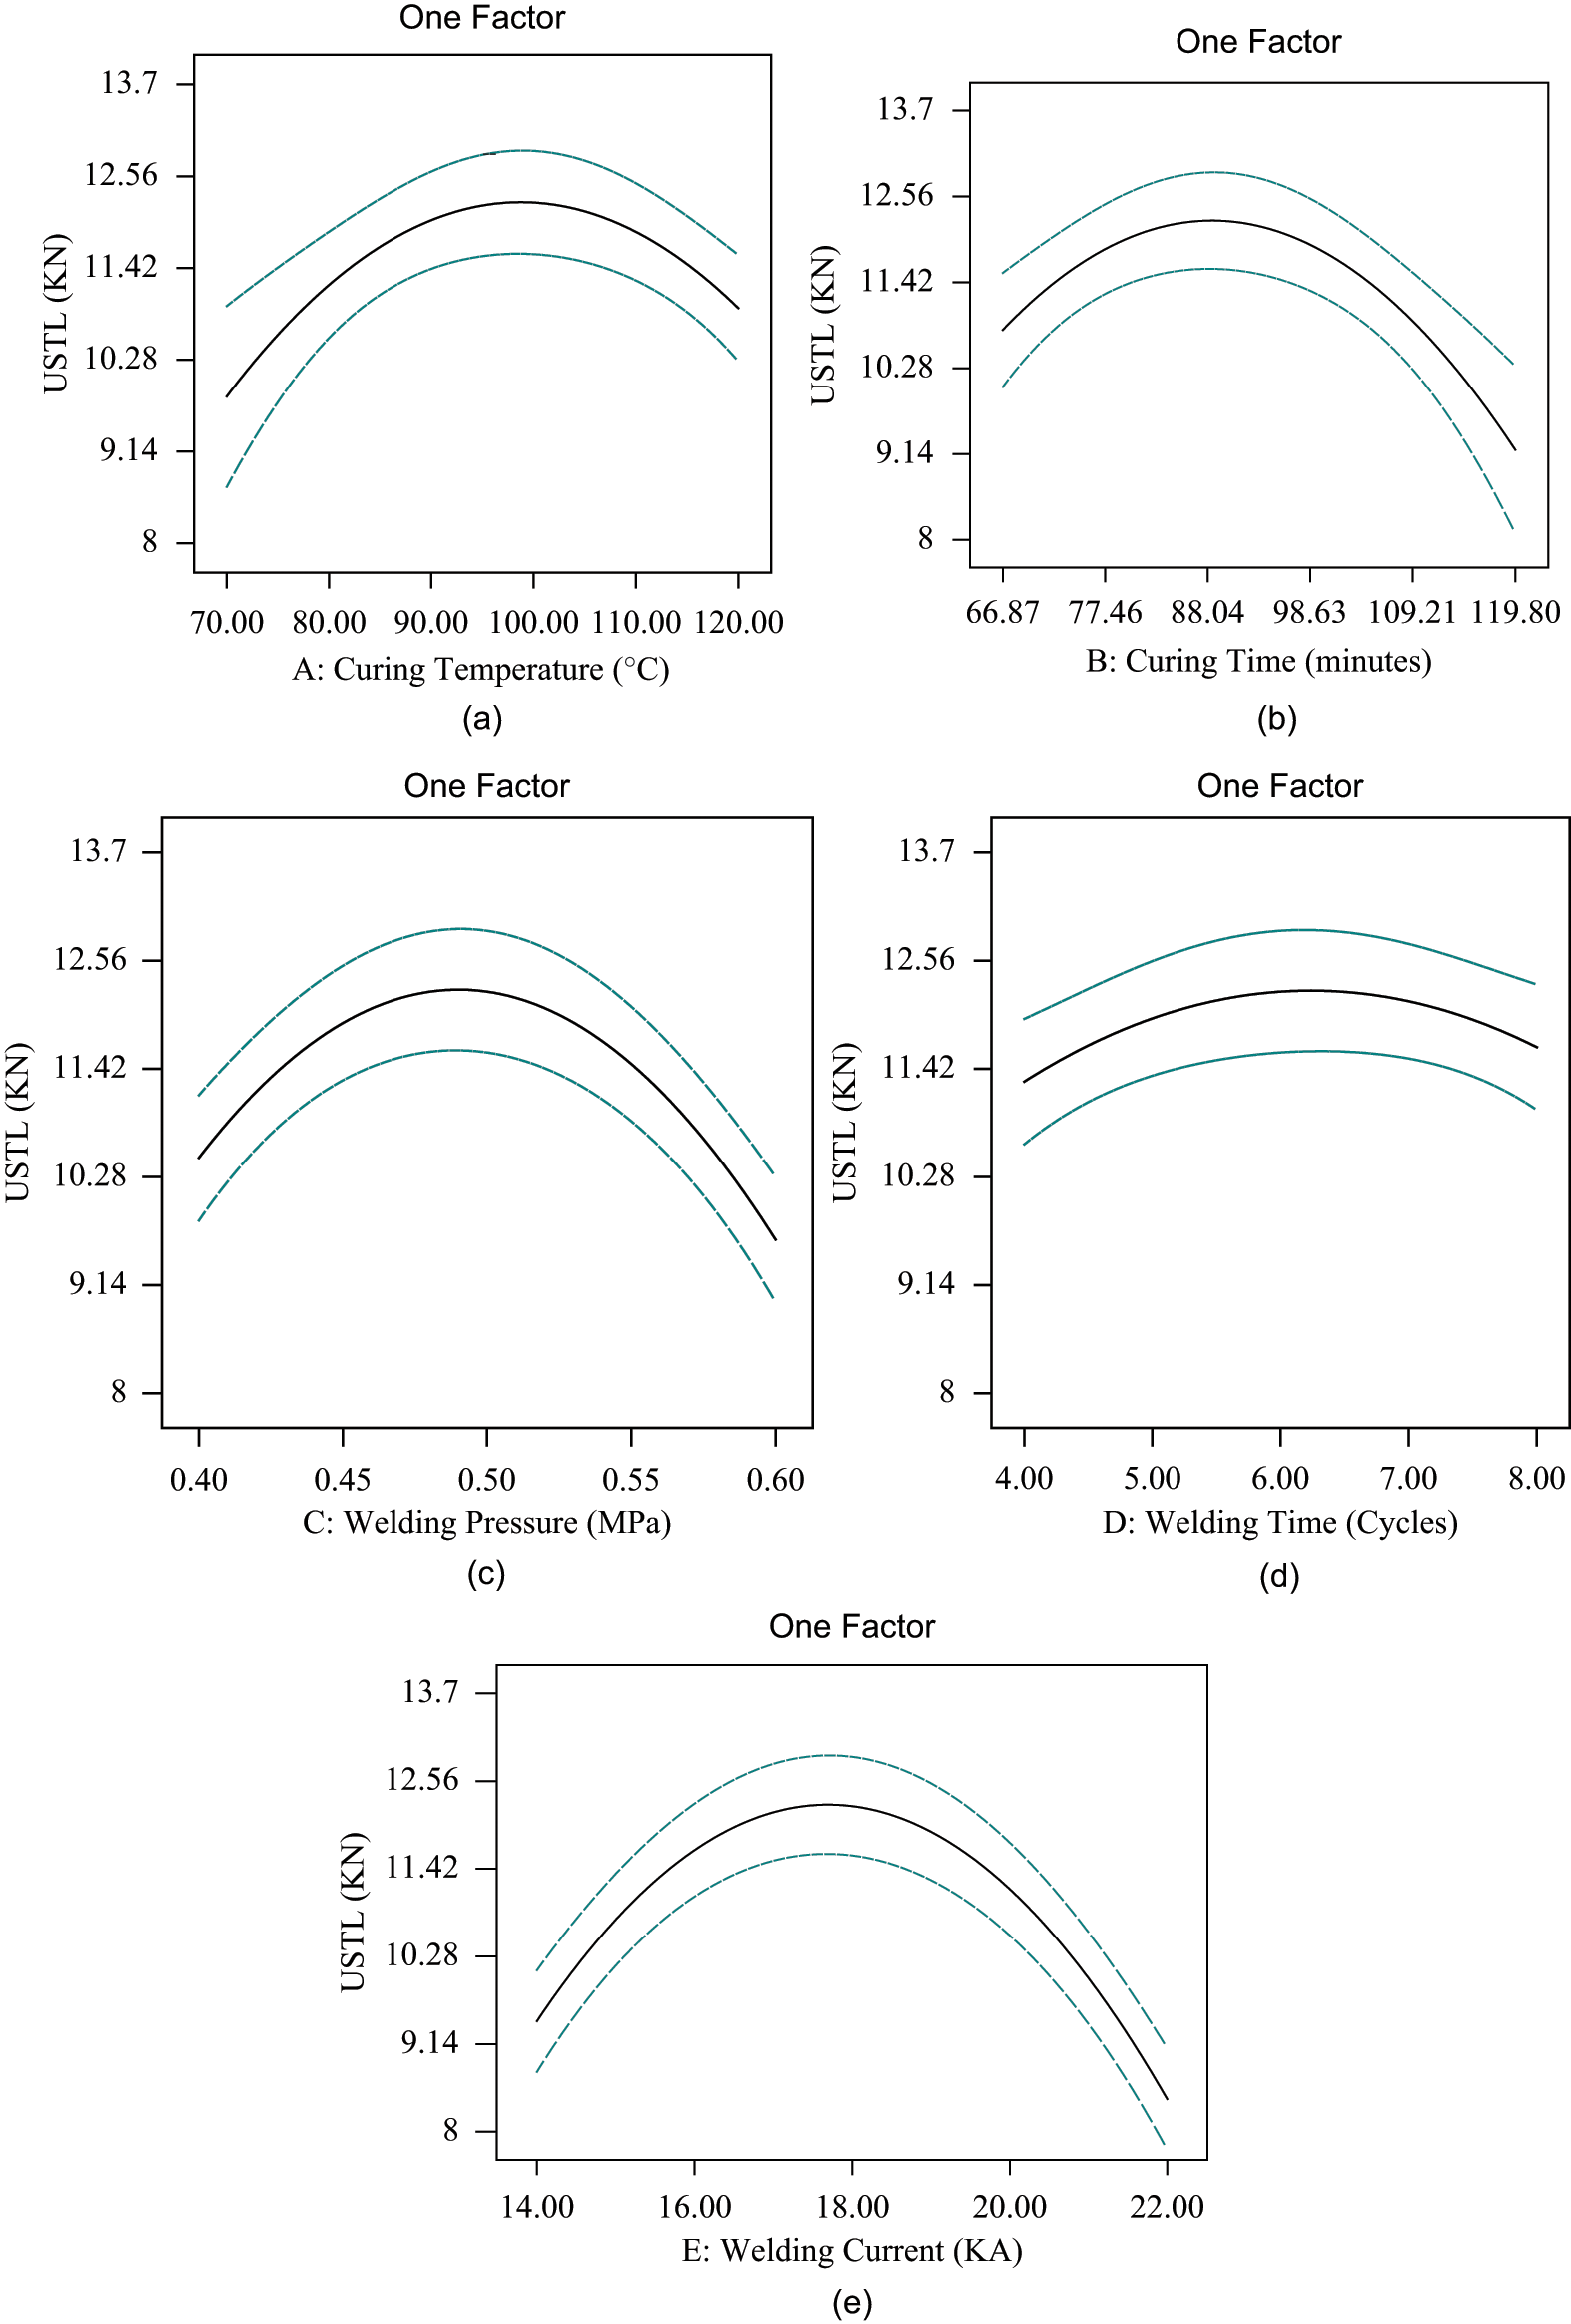
Variation of USTL as function of (a) curing temperature, (b) curing time, (c) welding pressure, (d) welding time, and (e) welding current.
The strength of the weld bonds is determined by the load carrying capabilities of both the adhesive joint and spot weld joint. The success of the curing for facilitating cross linking and polymerization in the adhesive bond largely depends on the curing time and temperature for which the joint is exposed. An initial increase in both curing temperature and time, up to an optimum value, increases the cross linking and polymerization of the adhesive. Weld bonds cured below and above the optimum curing temperature and time conditions result in joints in an under-cured and over-cured condition, respectively. Under-curing is known to produce the incomplete curing reactions (cross linking and polymerization) while over-curing results in the formation of brittle adhesive layers and decomposition of some of the hydro carbons. Thus, both over and under cured weld bonds offer lower USTL-carrying capability of weld bond joints than that cured under optimum conditions. These findings are in agreement with published literature. 14
The influence of spot welding process parameters on the strength of the weld bond is shown in Figure 10(c) and (e). It can seen from Figure 10(c) that the USTL increases with an increase in welding pressure from 0.4 to 0.5 MPa and a further increase in pressure up to 0.6 MPa decreases the ultimate shear tensile strength of the weld bond. Similarly, an increase in welding time (from 4 to 6 cycles) and welding current (from 14 to 18 KA) increases the ultimate tensile shear load carrying capability, thereafter, a further increase in the welding time (up to 8 cycles) and welding current (up to 22 KA) decreases the ultimate shear tensile strength of the weld bonds.
A combined effect of curing time–curing temperature, welding time–welding pressure and welding current–welding time on the ultimate shear tensile strength of the weld bond has been presented in Figure 11(a)–(c). In general, an increase in both curing temperature and curing time first increases the ultimate shear tensile strength of the weld bond and after reaching a maximum, a further increase in both of these parameters decreases it (Figure 11(a)). A similar trend was noticed in respect of inter-dependence of welding time and welding pressure on the ultimate shear tensile strength, which resulted in an inverted convex contour surface of a response surface plot. An increase in welding time, irrespective of welding pressure, first increases the ultimate shear tensile strength of the weld bond and, after reaching a maximum, a further increase in welding time parameters decreases the ultimate shear tensile strength (Figure 11(b)). Moreover, the relative effect of the welding current on ultimate shear tensile strength was found less at low welding pressure.
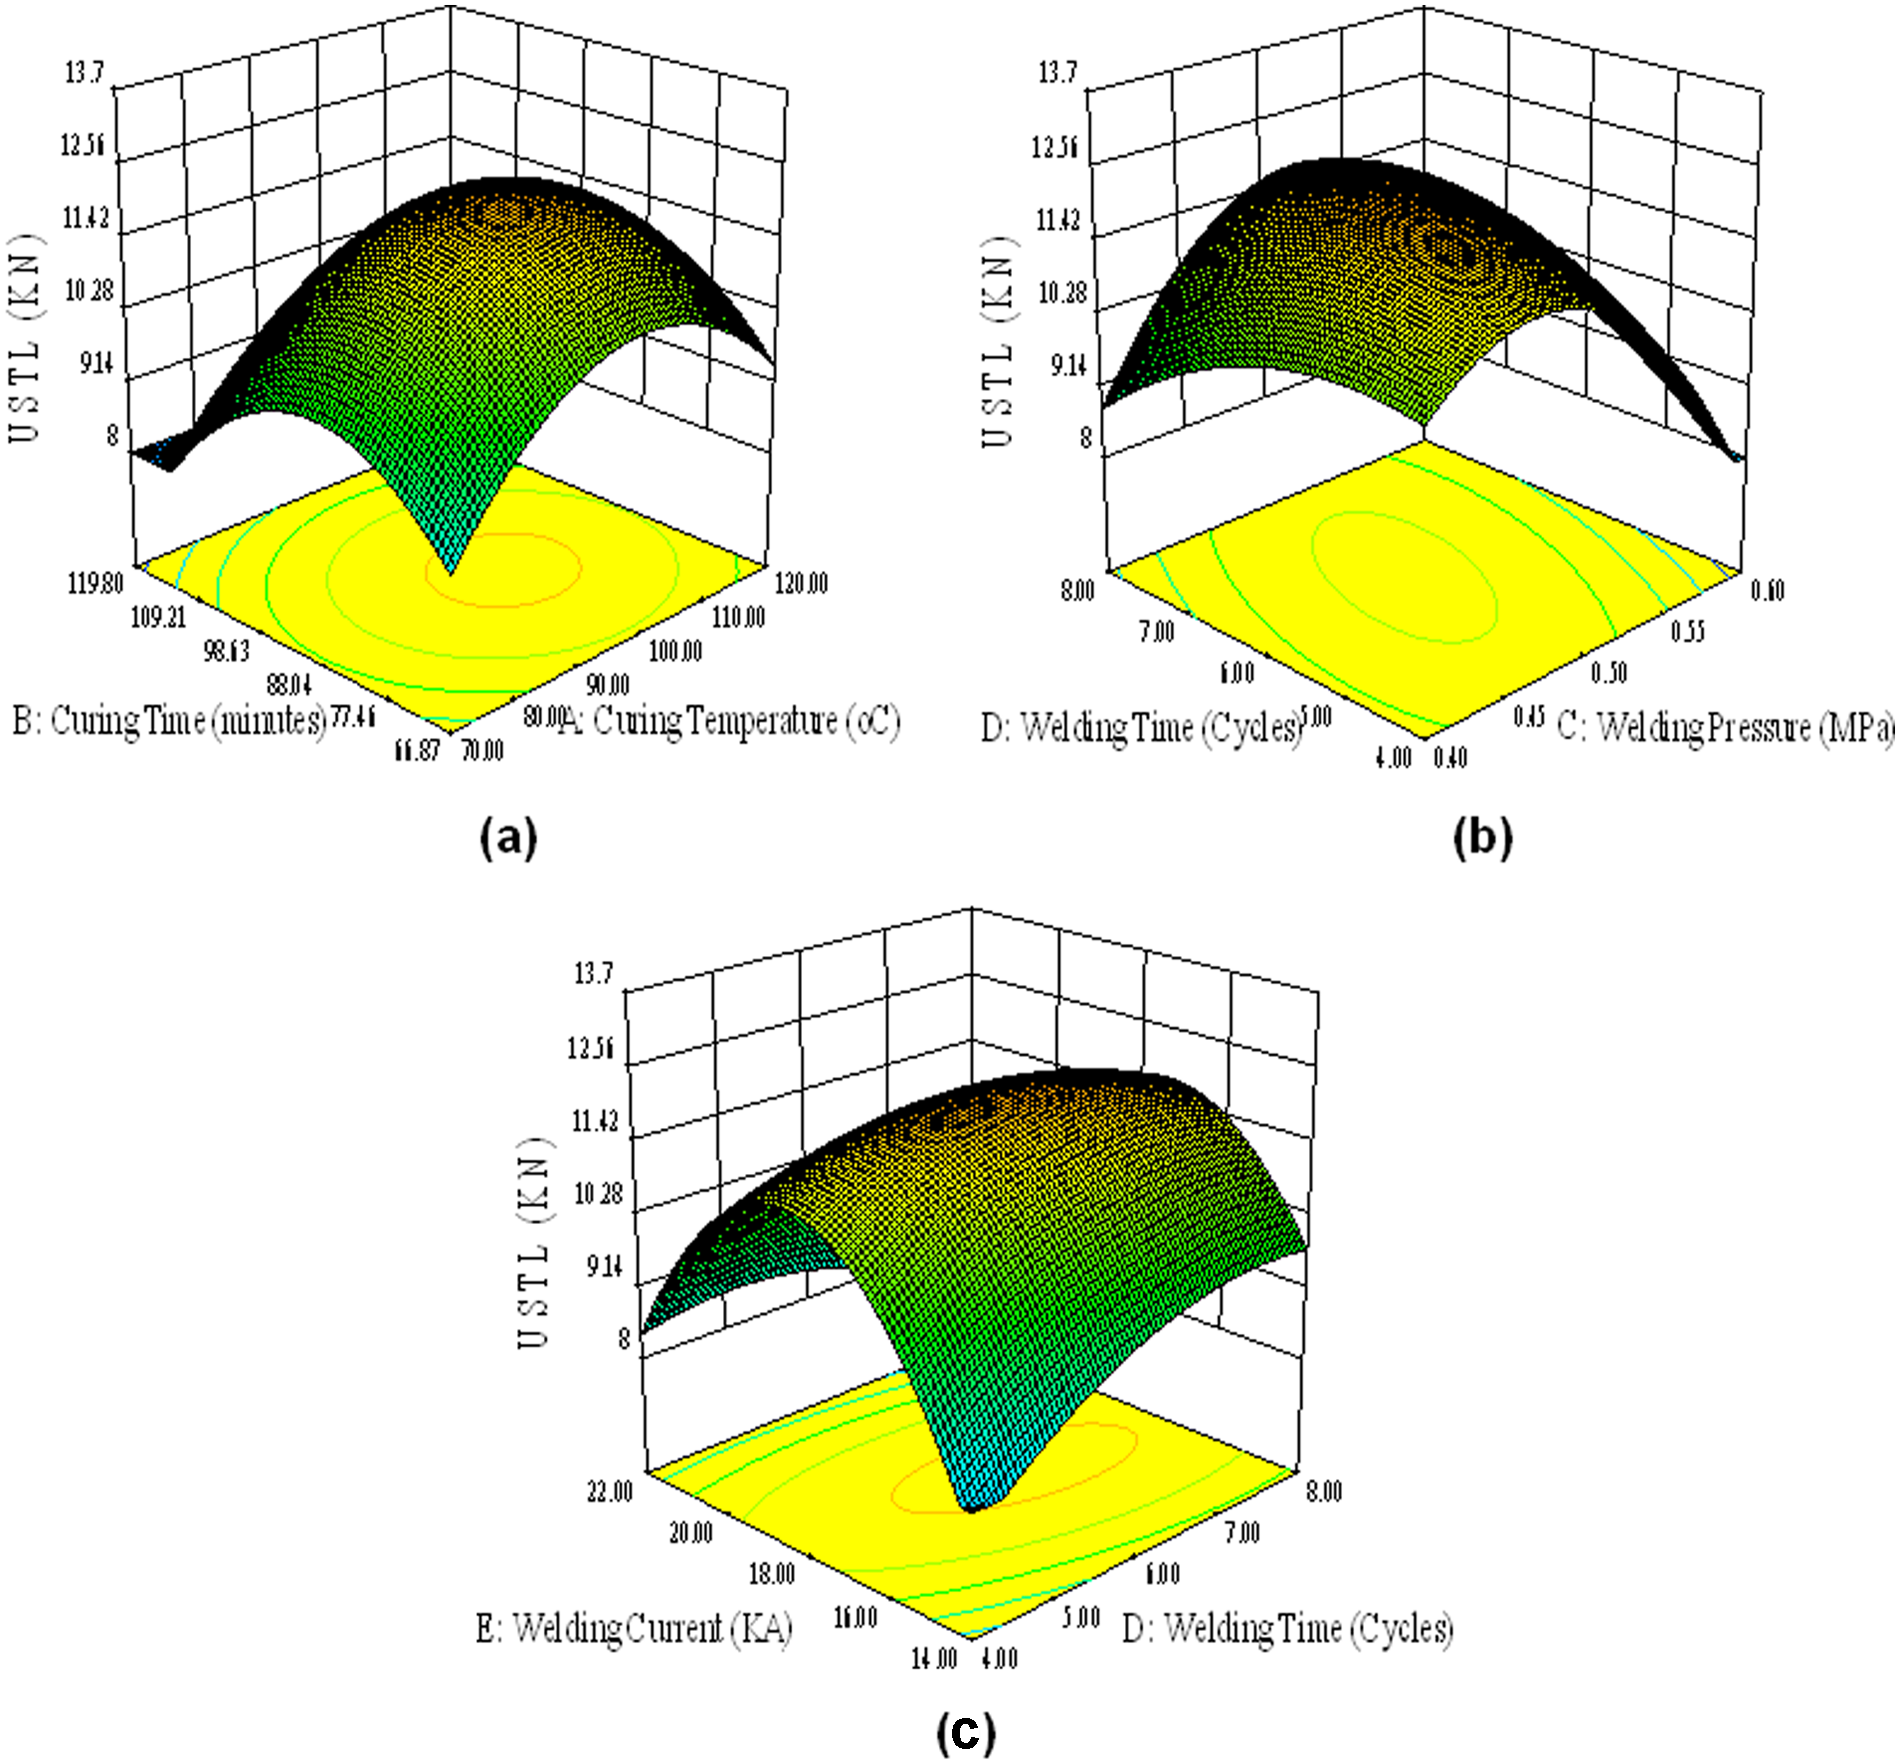
Variation of USTL as a function of (a) curing time and curing temperature, (b) welding time and welding pressure, and (c) welding current and welding time.
Figure 11(b) also shows that, at a low welding pressure with an increase in weld time up to 6 cycles, no appreciable change in USTL is observed, and a further increase in weld time (above 6 cycles) lowers the ultimate shear tensile strength because, already at low pressure, the heat generation is sufficient and with any further increase in weld time above 6 cycles resulted in development of a defected nugget. At a high pressure, an increase in weld time from 4 to 8 cycles, increases the ultimate shear tensile strength of the weld bond. Because at a high welding pressure the heat generation is less, an increase in welding time helps make a sufficient nugget and hence strength is increased. The trend of variation of USTL with an increase in welding pressure at all welding times is similar, which first increases (up to .5 MPa) and then decreases it.
Figure 11(c) shows that, at all welding times, the trend of variation of USTL with increasing welding current is similar, which first increases (up to 18 KA) and then decreases. However, variation of USTL with an increasing welding time at lower and higher welding currents is different. At a low welding current, ultimate shear tensile strength of the weld bond increases with an increase in weld time, while at high welding currents, a slight decrease in ultimate shear tensile strength of the weld bond is observed.
Discussion
A weld bond is a combination of spot weld and adhesive joint, therefore, strength of the weld bond is significantly influenced by the load-carrying capability of the spot weld joint. The strength of the spot weld joint is dictated by the size and quality of the nugget of the spot weld that primarily depends on the heat generation during spot welding. Heat generation during the spot welding stage of the weld bond is governed by the spot welding process parameters, namely welding pressure, welding time and welding current. An initial increase in welding current and welding time directly increases the heat generation, which in turn increases the nugget size and beyond a certain limit of heat input, the quality of nugget starts decreasing and the defective nugget is formed and so decreases in the load-carrying capability of the weld is observed as shown in Figure 8.
Welding pressure
An increase in welding pressure during spot welding decreases the BLT. Reduction in the BLT is expected to increase the strength of the specimen. 15 As in the case of the thin adhesive layer, the strength of the adhesive joint is determined by the strength of the adhesive–adherend interface bond, while the cohesive strength of the bond layer dictates the strength of the adhesive joints with a thick adhesive layer. The adhesive bond is considered to be stronger than the cohesive bond in case of adhesive joining, therefore, the adhesive layer must be sufficiently thin to have the high load-carrying capability of the adhesive joint. However, too thin an adhesive layer can lead to a discontinuous presence of the adhesive layer and so poor strength of the adhesive joint owing to an increased stress concentration in those areas where the adhesive layer is absent. So, an optimum adhesive layer should be present between the adherends to get a maximum bond strength. Song and Lim 15 studied the effect of pressure on the USTL of the adhesive bonded joints and found that the maximum strength of the adhesive bond joints occurs at a pressure of 0.07 MPa. However, in the present study of weld bonding, the authors could not use low pressure as it does not result in any spot nugget formation. Welding pressure has also been reported to affect the equivalent nugget diameter 12 owing to variation in heat generation, and corona size owing to variation in heat generation and displacement of adhesive from both interfaces.
Welding time and current
Welding time and current have a similar effect on the strength of the joint as both the factors directly affect the heat generation. An increase in welding time and current results in an increase in heat generation, which causes an increase in equivalent nugget diameter, 12 and corona size. An increase in the weld nugget diameter is directly attributed to an increase in load-carrying capability of the weld bond. Excessive, longer weld time and higher current, resulted in a defective nugget, which in turn decreases the USTL-carrying capability of the weld bonds. In support of this, an increase in the corona size (burnout of adhesive the near spot) would decrease load-carrying capability of the joint. From Table 3, it can be seen that the maximum equivalent nugget diameter developed is 6.03 mm, while the maximum USTL is obtained with a nugget diameter of 5.03 mm. Excessive current density for a longer time not only increases the corona size but also decreases the soundness of the weld nugget, resulting in internal voids and weld cracking as depicted in Figure 8. Hence, use of a very high welding current for a longer duration deteriorates the USTL-carrying capability of the weld bonds.
Interface failure mechanism
It is well known that the adhesive strength is more than that of the cohesive strength. It has been found that with thicker layers of adhesive present between the adherends, cohesive failure governs, while with thinner thicknesses, adhesive strength governs the failure. Figure 12 shows the fractured specimen of the weld bond developed at parameters corresponding to where the maximum USTL was obtained. It is clearly evident from Figure 12 that the adhesive is completely detached at the interface from the surface of both the specimens, thus showing adhesion failure. This also supports the rising trend of the USTL with an increase in pressure, which, in turn, decreases adhesive layer thicknesses and results in an increased USTL.
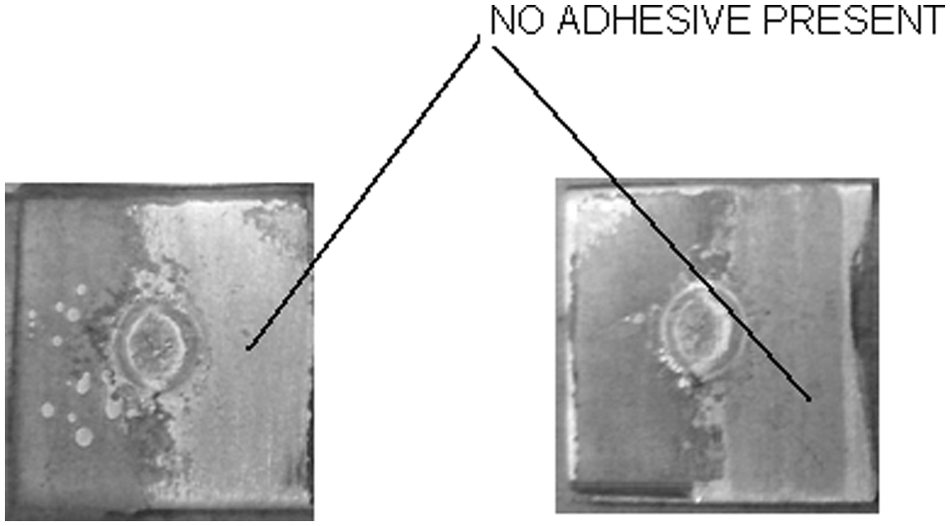
Photographs of fractured specimens of weld bonds showing adhesion interfacial failure.
Confirmation experiments
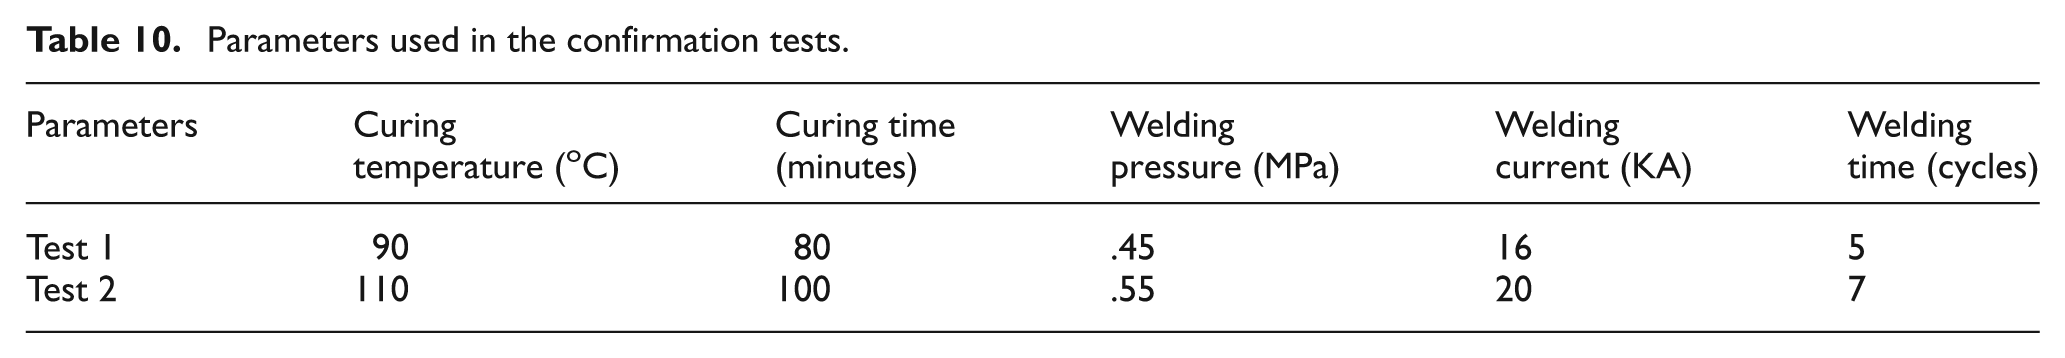
To validate the models developed to predict the BLT, equivalent nugget diameter, corona size and USTL, the confirmation tests were performed by developing the weld bonds using two sets of input parameters within the range of the factors investigated in the work, followed by characterization of the weld bonds for the above characteristics. Input process parameters of the weld bond used for developing the bonds have been shown in Table 10. Table 11 exhibits the BLT, equivalent nugget diameter, corona size and USTL obtained from the confirmation test and that from the model developed in the present work (equations (1), (2), (3) and (4)). It is observed that the model error for the equivalent nugget diameter, corona size and USTL is in single digit and lower than 9%. The model error in the case of the BLT of the weld bond was found to be on the high side (from 13.7% to 35.2%). It is felt that the high model error in the case of the BLT is owing to the inability to measure it accurately. Thus, it can be concluded that the multiple regression equation for the equivalent nugget diameter, corona size and USTL correlates with the experimental results with a reasonable degree of approximation.
Parameters used in the confirmation tests.
Confirmation tests and their comparison with the regression model.
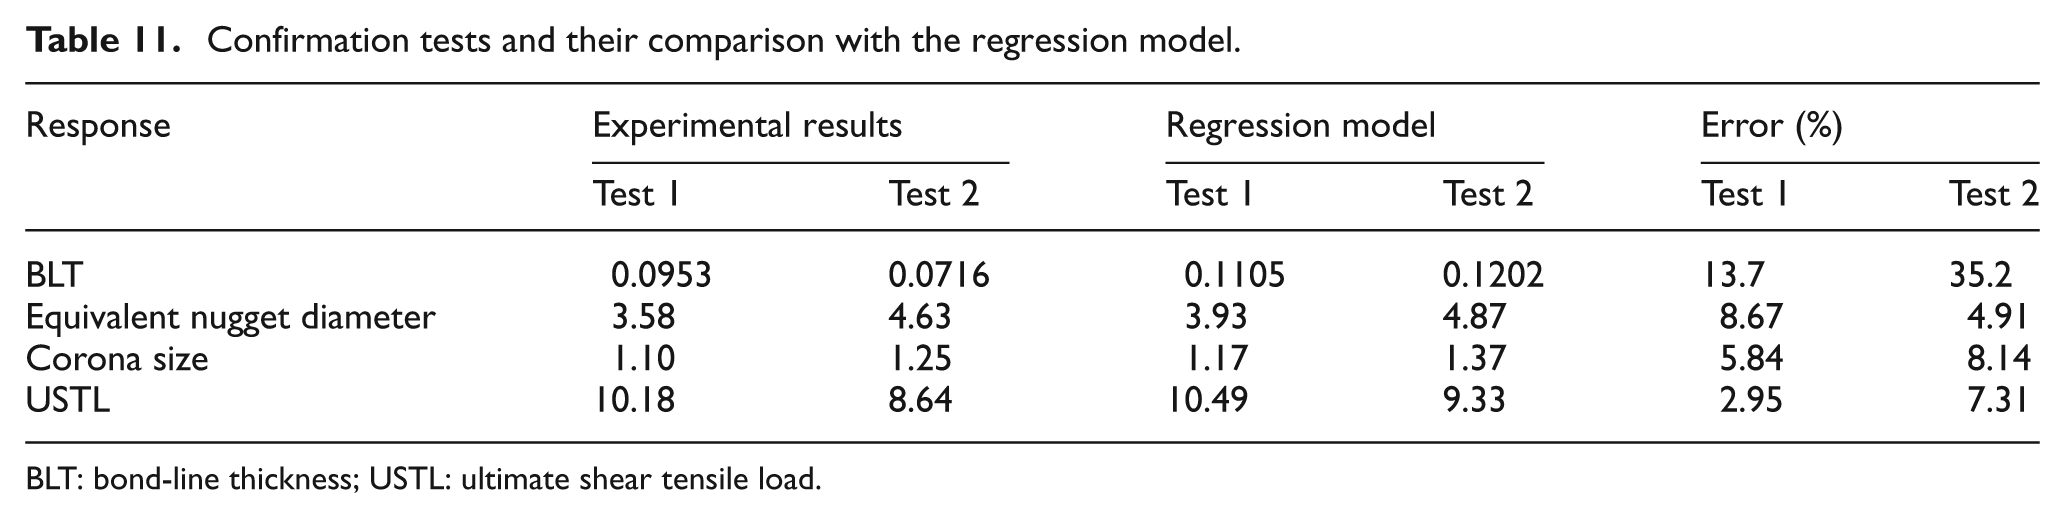
BLT: bond-line thickness; USTL: ultimate shear tensile load.
Conclusions
Using the weld-through technique, weld bonds of a 5052 H32 aluminium alloy were developed taking 2-C epoxy as an adhesive. In this study, four response surface models were developed to investigate the influence of various input parameters of weld bonding on the characteristics of the weld bond (i.e. BLT, equivalent nugget diameter, corona size and ultimate shear tensile performance) using response surface methodology (RSM). Further, it may be noted that the results reported in this work are valid at room temperature, only because the adhesive layer tends to get damaged when exposed either to high temperature or humid atmosphere. The following conclusions can be drawn from the present study.
A surface roughness, ranging between 1.42–1.9 μm obtained with a 220 emery grade paper and an overlap length of 25 mm, is found to give maximum weld bond joint strength while conducting pilot experiments.
Curing temperature and welding pressure were found to be significant model terms affecting the BLT. An increase in welding pressure decreases the BLT.
The three parameters of spot welding – welding pressure, welding time and welding current – are the significant model terms influencing the equivalent nugget diameter (Eq).
The three parameters of spot welding, namely welding pressure, welding time and welding current, are the significant model terms regarding their influence on the corona size. Of these, welding pressure and welding current are highly significant.
All five parameters selected for main experiments, namely curing time, curing temperature, welding pressure, welding time and welding current were found to be significant in respect of their effect on the USTL of weld-bonds. The maximum USTL of the weld bond (13.3 KN) was obtained at the welding current of 18 KA and weld time of 6 cycles at welding pressure 0.5 MPa.
The confirmation experiments show that the regression models for corona size, equivalent nugget diameter and USTL are reasonably accurate, as the error was found to be less than 9%.
Footnotes
This research received no specific grant from any funding agency in the public, commercial, or not-for-profit sectors.