
Abstract
This research examined the influence of solution concentration on Taylor cone morphology, jet behavior, fiber surface morphology, and the impact of spinning voltage on the microbead shape of the beaded fiber. The straight jet length, envelope cone, whipping frequency of the electrospun jet, and Taylor cone morphology were studied using the images captured by a high-speed photography camera. According to the findings, higher solution concentrations result in longer straight jet lengths, smaller envelope cones, and lower whipping frequencies. Scanning electron microscopy was used to ascertain the diameter and surface morphology of polystyrene fibers, revealing that fibers spun with higher solution concentrations had larger diameters. In contrast, low concentration solutions receive more electric field forces due to higher conductivity. The jet tends to break, and fibers with the beads-on-a-string morphology form. Furthermore, the influence of voltage on microbead shape has been further examined using the simulation software COMSOL. As the spinning voltage increases, the jet’s stretching impact is more prominent, and the bead shape gradually changes from nearly circular to spindle-shaped.
Introduction
Electrospinning has been considered the most general, convenient, and simple method of preparing ultra-thin fibers until now, 1 which was initially researched and developed in 1887. 2 Along with its distinctive shape, it has impressive specifications like a high aspect ratio, porosity, and outstanding chemical and physical properties. 3 It is extensively employed in several disciplines, as an illustration, air filtration, 4 energy storage and conversion, 5 oil–water separation, 6 biomedical and biotechnological applications, 7 such as drug delivery, 8 and so forth.
A significant number of researchers have tended to focus on the properties of electrospun bead-free fibers9,10 and the influence of experimental factors on fiber morphology.11,12 It is easy to overlook the role of beaded fibers in air filtration, oil adsorption, and drug release. Cao et al. 13 investigated the electrospun bead-in-string fibrous membrane used for air filtration. It was found that the immobilization of PSQ (polysilsesquioxane) to PLA (polylactic acid) makes more well-distributed bead-in-string structures form in the fiber, which improves the air filter of fibrous membranes. Xi Huangjie et al. 14 used silk fibroin protein as a raw material to study the role of beaded fibers in drug-sustained release. The results showed that the effect of beaded fibers in the medicine-supported release was superior to the effect of non-beaded fibers in sustained drug release. Previous experimental results show that different shapes and sizes of microbeads on beaded fibers will lead to significant differences in the overall performance of the fiber membrane. Therefore, by regulating the size and shape of microbeads on beaded fibers, the fiber membrane with specific functions can be prepared directionally. Zhu et al. 15 developed electrospun highly porous polyvinylidene fluoride (PVDF) fiber webs with unique spindle porous bowl-like beads and porous spindle beads. The experimental results show that the presence of fusiform porous bowl-shaped beads and fusiform beads in the fiber membrane can effectively improve the adsorption capacity of the fiber membrane to oil. Therefore, it is necessary to explore the controllable preparation of spinning beaded fibers.
The effects of solution concentration on Taylor cone shape, jet behavior, and fiber morphology in electrospinning were investigated employing polystyrene (PS). A scanning electron microscope (SEM) with a high-speed camera observed the jet path, Taylor cone morphology, and fiber surface morphology. Image processing technologies were also used to evaluate the obtained photos further. A three-dimensional beads-on-string model was created utilizing numerical simulation to investigate the effect of voltage on the microbead morphology of beaded fibers. In addition, appropriate investigations were conducted to ensure the model’s feasibility and correctness for this experimentation.
Experimental
Materials
PS ((C8H8)n, Mw = 350,000 g/mol, Sigma-Aldrich Co., Ltd., Saint Louis, Missouri, USA) and N,N-dimethylformamide (DMF, C3H7NO, 9.945−9.950 g/ml at 20°C, Sinopharm Chemical Reagent Co., Ltd., Shanghai, China) were used as received, without further processing. The PS solutions at different concentrations (10, 20, 30 wt%) were prepared by dissolving PS particles in DMF, followed by gently stirring for 5 h with an electric mixer (JB90-D, Shanghai Specimen and Model Factory, Shanghai, China) at specific temperature and humidity (25°C ± 0.2°C and 60% ± 5%).
Experimental Setup
Figure 1 shows the experimental system’s schematic diagram, consisting of a solution feeding system, a high-voltage supply system, a collecting system, and a high-speed photography module. First, the PS solution was injected into the syringe, then extruded into the needle spinneret (inside diameter (ID) and the outside diameter (OD) = 1.49 mm/1 mm). The injection speed of the polymer solution was controlled by the syringe pump (LD-P2020, Shanghai Lande Co., Ltd, Shanghai, China). A high-voltage power supply (ES-60P 10 W/DDPM, Gamma High Voltage Research, USA) was applied to the spinneret and the metal-roller-grounded collector. The PS solution was polarized and stretched into a filament jet which the metal roller collector eventually collected under the action of the electric field force.
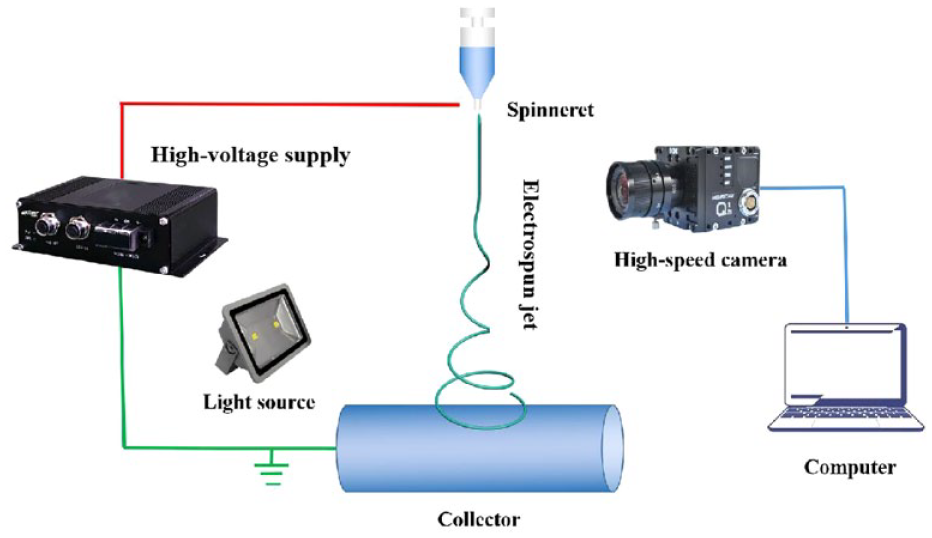
Schematic diagram of the experimental setup.
This study’s Taylor cone and jet path images were captured using the Photron Fastcam Mini AX200 High-Speed Camera (Photron Co., Ltd, Tokyo, Japan) equipped with a Tokina 100 mm lens and an f/2.8. It can capture images at up to 900,000 frames per second (fps). Two 100 W lamps (model-100 LED TWIN, Shanghai Jinqiaojingyi High-Tech Co., Ltd, China) were used as light sources.
The experimentation collector’s flow rate, spinning voltage, working distance, and rotating speed were set at 1.5 mL/h, 20 kV, 20 cm, and 50 r/min, respectively. The investigations were conducted in an environment with a temperature of 25°C ± 0.2°C and relative humidity of 60% ± 5%.
Characterization
A viscometer (NDJ-79, Shanghai LiChen Instruments Co., Ltd, China) was used to measure the viscosity of the solution. In contrast, a handheld conductometer (EXTRE, EC400, Shanghai JiRui Electronic Technology Co., Ltd, China) was used to measure conductivity. Furthermore, to eliminate the imperfections generated by the instrument throughout the experimental procedure, the same set of test data was typically assembled all at once. After gold coating, the surface morphology of the PS fiber was distinguished using an SEM (field emission scanning electron microscope, SU8010, Hitachi, Japan). By calculating the average diameter of 500 fibers, image visualization software (Image J, NIH Image, Bethesda, MD, USA) was employed to evaluate the fiber’s diameter.
Numerical Simulation
The effect of spinning voltage on the microbead shape of beaded fiber at different voltages was simulated by the COMSOL Multiphysics software (version 5.6, COMSOL Inc., Sweden) using the finite element method (FEM) to understand the effects of electric field on bead formation deeply. In this experiment, the Oldroyd-B fluid model in COMSOL simulation software was used to simulate the thinning process of viscoelastic filaments under the action of surface tension. PS is the raw material for the experiment, with a relative molecular weight of average Mn = 170,000. As a polymer, PS has viscoelasticity and is a good fit with the Oldroyd-B fluid model. The spinning solution’s actual properties determined the model’s performance parameters. The weak contribution force was calculated using the viscoelasticity flow interface, which simulated the influence of the electrostatic field force on the spinning jet.
Experimental Results and Discussion
Polymer Solution Properties Analysis
Figure 2 shows the viscosities and conductivities of PS solutions with different concentrations. The figure demonstrates that the viscosity of PS solution increases and its conductivity decreases with the increase of solution concentration. That is mainly because the entanglement degree of the polymer molecular chain in the solution increases with the addition of solution concentration, which directly affects the solution viscosity. And the conductivity of the PS solution is mainly dependent on the solvent content, which decreases with increasing polymer concentration. As we all know, the solution’s viscosity and conductivity play a decisive role in the electrospinning process. This influences the Taylor cone formation and jet movement processes, affecting electrospun fiber geometries. 16
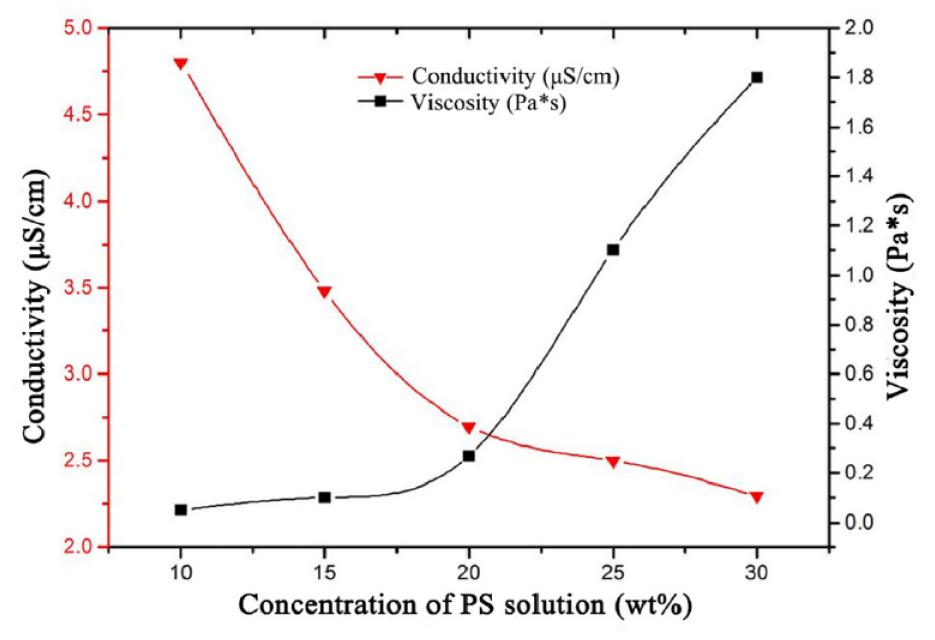
Variations in viscosity and conductivity at different concentrations of PS solution.
Taylor Cone Morphology
In the electrospinning process, the charged polymer solution is polarized under the circumstance of applying spinning voltage. Because of the comprehensive influences of electric field force, surface tension, gravity, charge repulsion, and other factors, a conical droplet is formed at the tip of the spinneret, which is called the “Taylor cone.” The morphology of the “Taylor cone” affects the stability of the electrospinning process. 17
Figure 3 shows the morphologies of the Taylor cones of PS solutions with different concentrations and at other time points. Figure 3(a–a3) shows that a spherical droplet forms at the needle tip when the PS solution concentration is 10 wt% (Figure 3(a)). The droplet volume gradually increases as the solution is injected (Figure 3(a1)). Because of the combined effects of gravity and electric field force, the spherical droplet is slowly stretched (Figure 3(a2)). It is indeed finally smashed, and a tiny bulbiform droplet and an extremely fine jet are formed (Figure 3(a3)). Because of the lower concentration, the solution in spherical droplets contains fewer polymer molecular chains and more solvent than the other two types of PS solution during the process from (a) to (a3), resulting in more electric charges distributed on the droplet surface and a more potent repulsion force. With time progression, the droplet’s surface tension fails to resist gravity and electric field force, causing the jet to break.
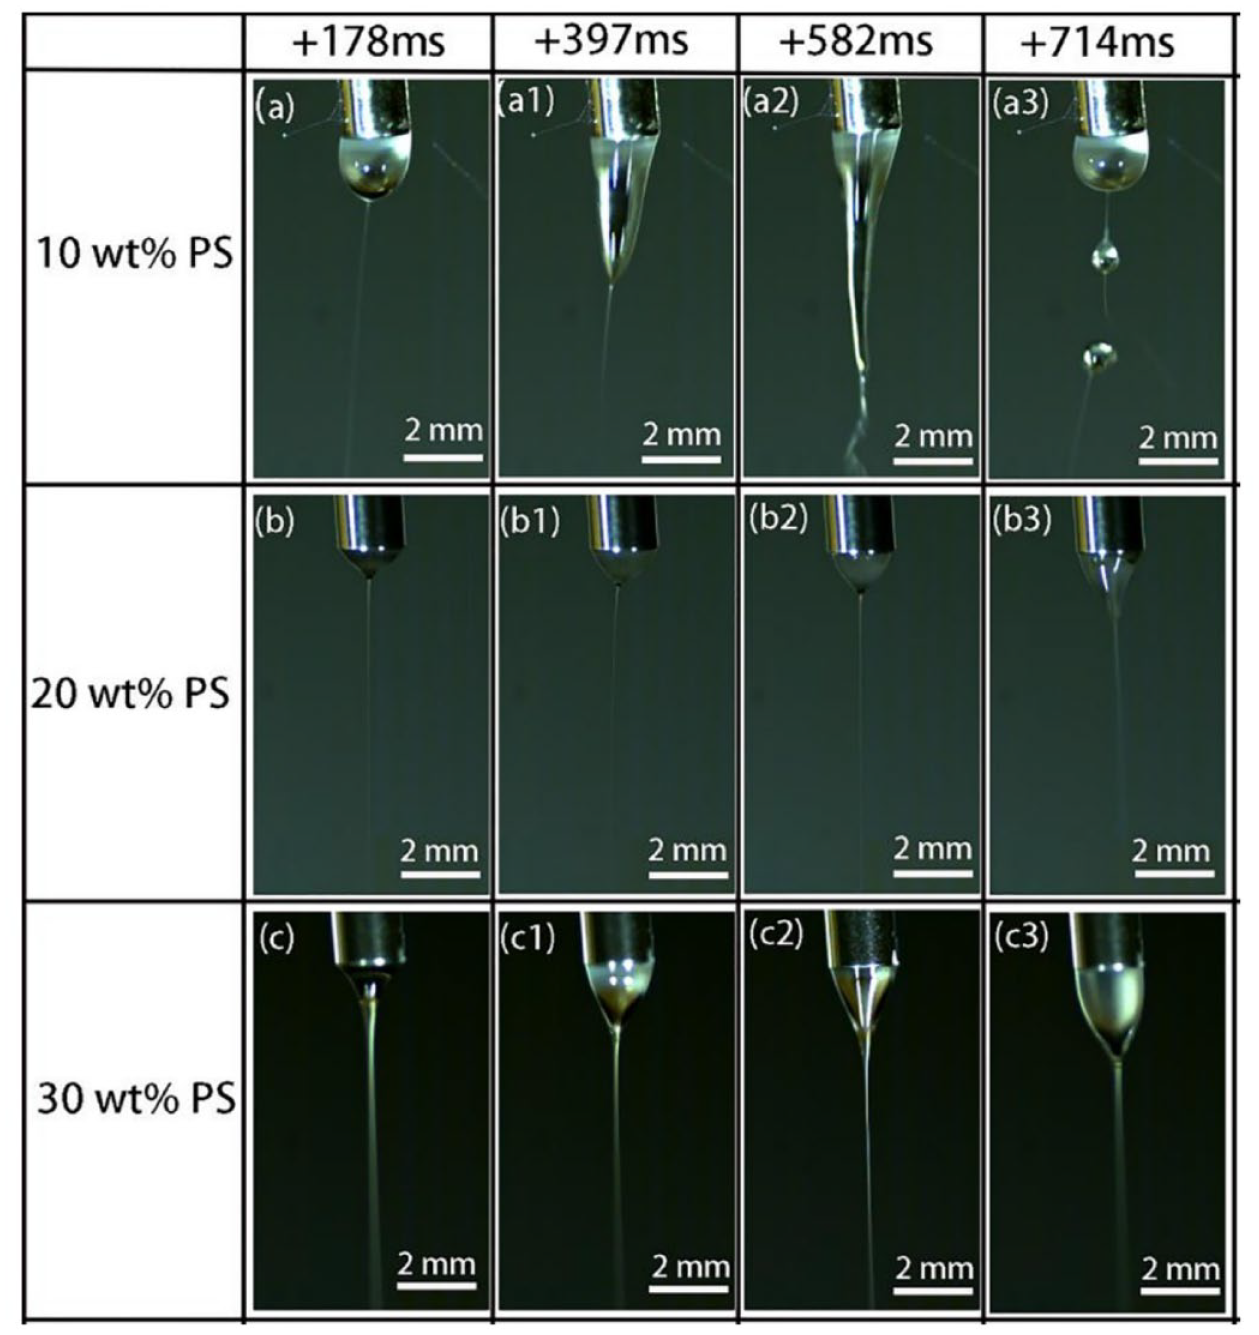
Morphology images of Taylor cone of PS solutions with different concentrations and at various time points: (a–a3) 10 wt% PS, (b–b3) 20 wt% PS, and (c–c3) 30 wt% PS (20 kV, 20 cm gap, 10,000 fps).
In addition, a conical jet forms at the needle’s tip when the PS solution concentration exceeds 20 wt% by content, as seen in Figure 3(b–b3). In the beginning, a conical droplet with a small volume should follow. However, the droplet volume increases with the increase of the solution and maintains a stable conical Taylor cone state. The amount of charge contained in the droplet declines as the concentration increases from 20 to 30 wt%; as a result, the repulsion is weaker, and the droplet prefers to coalesce rapidly, resulting in the droplet forming at the needle tip.
When the concentration reaches 30 wt%, the Taylor cone evolution rule is similar to the 20 wt% PS solution, as illustrated in Figure 3(c–c3). It is worth noting that the Taylor cone of 30 wt% PS is more significant than that of 20 wt% at the same time point because the liquid viscosity increases, and the entanglement degree of the polymer molecular chain is high enough to overcome the tensile force as the concentration increases. As time goes by, the droplet gathered at the tip will increase. The influences of gravity and the electric field force will gradually outweigh the droplet’s surface tension, stretching it further.
Furthermore, in a 20 wt% percent solution concentration throughout the electrospinning process, the Taylor cone is in the most stable state, without a considerable volume variation and no jet rupture. This indicates that the electric field force on the Taylor cone and the surface tension of the liquid are basically in a state of equilibrium.
Jet Behavior
Figure 4 shows the jet motions of PS solution with three different concentrations. The jet is initially extended in a straight line but undergoes a violent whipping motion due to bending instability. The jet length in the straight-line state increases with increasing solution concentration, while the unstable state decreases gradually. When the concentration reaches 30 wt%, the whipping motion of the jet fails to be observed in the same visual field.
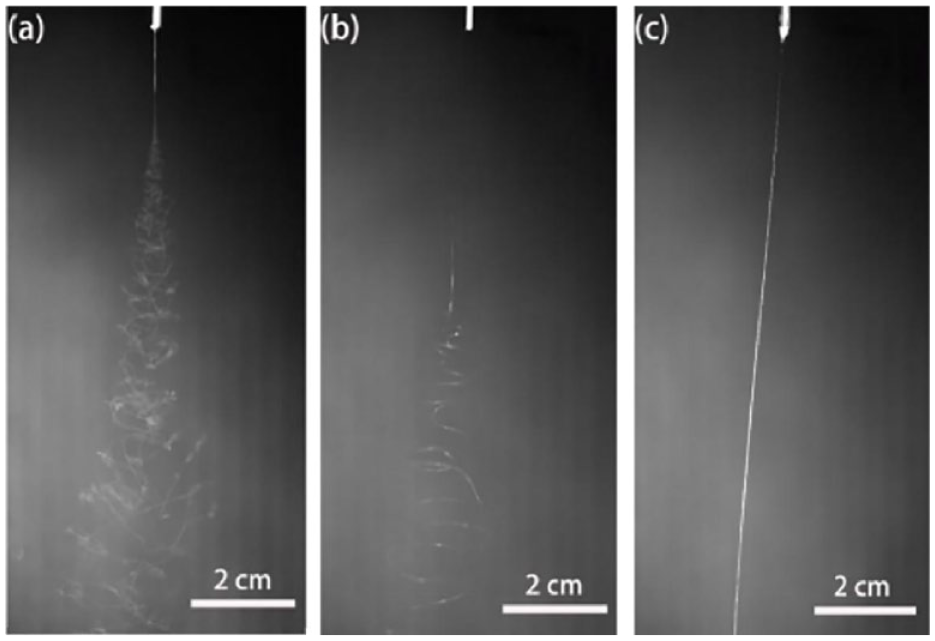
High-speed photographic images of jet motions during the electrospinning process: (a) 10 wt% PS, (b) 20 wt% PS, and (c) 30 wt% PS (20 kV, 20 cm gap, 10,000 fps, 97 µs exposure).
Table 1 shows a single nozzle’s jet motion numerical values at three concentrations under the same electrospinning conditions. Three characteristic parameters, namely, the length of the straight line, envelope cone, and whipping frequency, were studied to research the jet motion. The extent of the whipping movement was determined using an envelope cone. The whipping frequency is defined as the rate of new bends generated at the onset of the whipping motion. These numerical values refer to the average values obtained by calculating 10 sets of parameters of the randomly sampled images captured by the high-speed camera.
Jet motion parameters for three concentrations of PS.
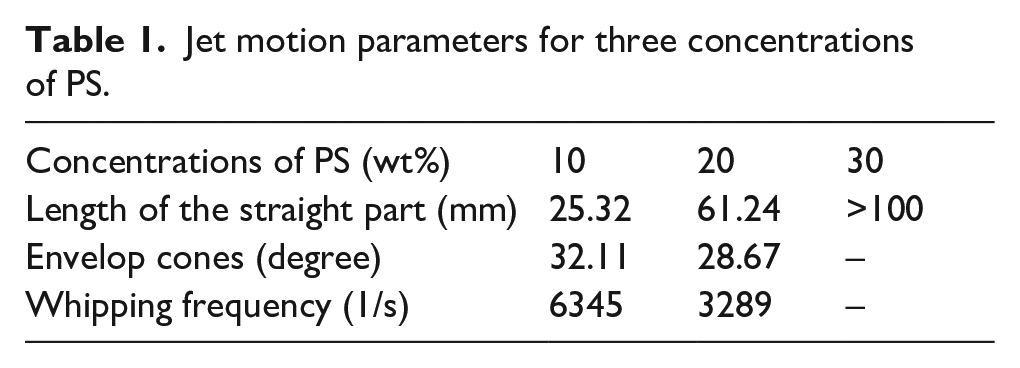
What stands out in Table 1 is that the straight segment length of the jet increases from 25.32 mm to more than 100 mm with the rise of the PS solution concentration, while the envelope cone and whipping frequency decrease. On one hand, the increase of the solution concentration leads to the augmenting of viscosity and the entanglement degree of polymer molecular chains, which is more conducive to the tensile orientation of the jet. On the other hand, the solution’s conductivity decreases with the increase of the solution concentration, and the charge carried by the jet becomes less at the same spinning voltage, followed by the increasing stability in the electric field and the increasing straight segment length jet. And then, the envelope angle of the PS solution decreases from 32.11° to 28.67°, and the whipping frequency reduces from 6345 to 3289 1/s, which fully demonstrates that the whipping motion of the jet tends to be smooth. The lower charge and repulsion force of the jet weaken the instability.
Effect of Solution Concentration on Fiber Morphology
Figure 5(a1–c1) displays the SEM images and fiber diameter distribution of PS fibers with different concentrations. Figure 5(a) demonstrates that 10 wt% PS fibers reveal a beads-on-a-string morphology. Moreover, the PS solution with a 10 wt% concentration obtains the lowest viscosity and highest conductivity, as shown in Figure 2. The low viscosity results in few molecular tangles, while the high conductivity makes the jet subject to great tensile force and leads to jet rupture, which is then drawn directly from the surface of the liquid. The droplet shrinks, the molecular chain is stretched and oriented, and it eventually solidifies into excellent fine fibers; as a result, spindle-like fibers develop. Furthermore, at this concentration, the diameter of PS fiber is relatively fine, with an average diameter distribution of around 0.53 μm. The main reason is that the jet with a lower concentration causes a shorter length of the straight-line segment and a larger whipping area (compared with higher concentration); as a result, the jet extends higher, as shown in Figure 4.
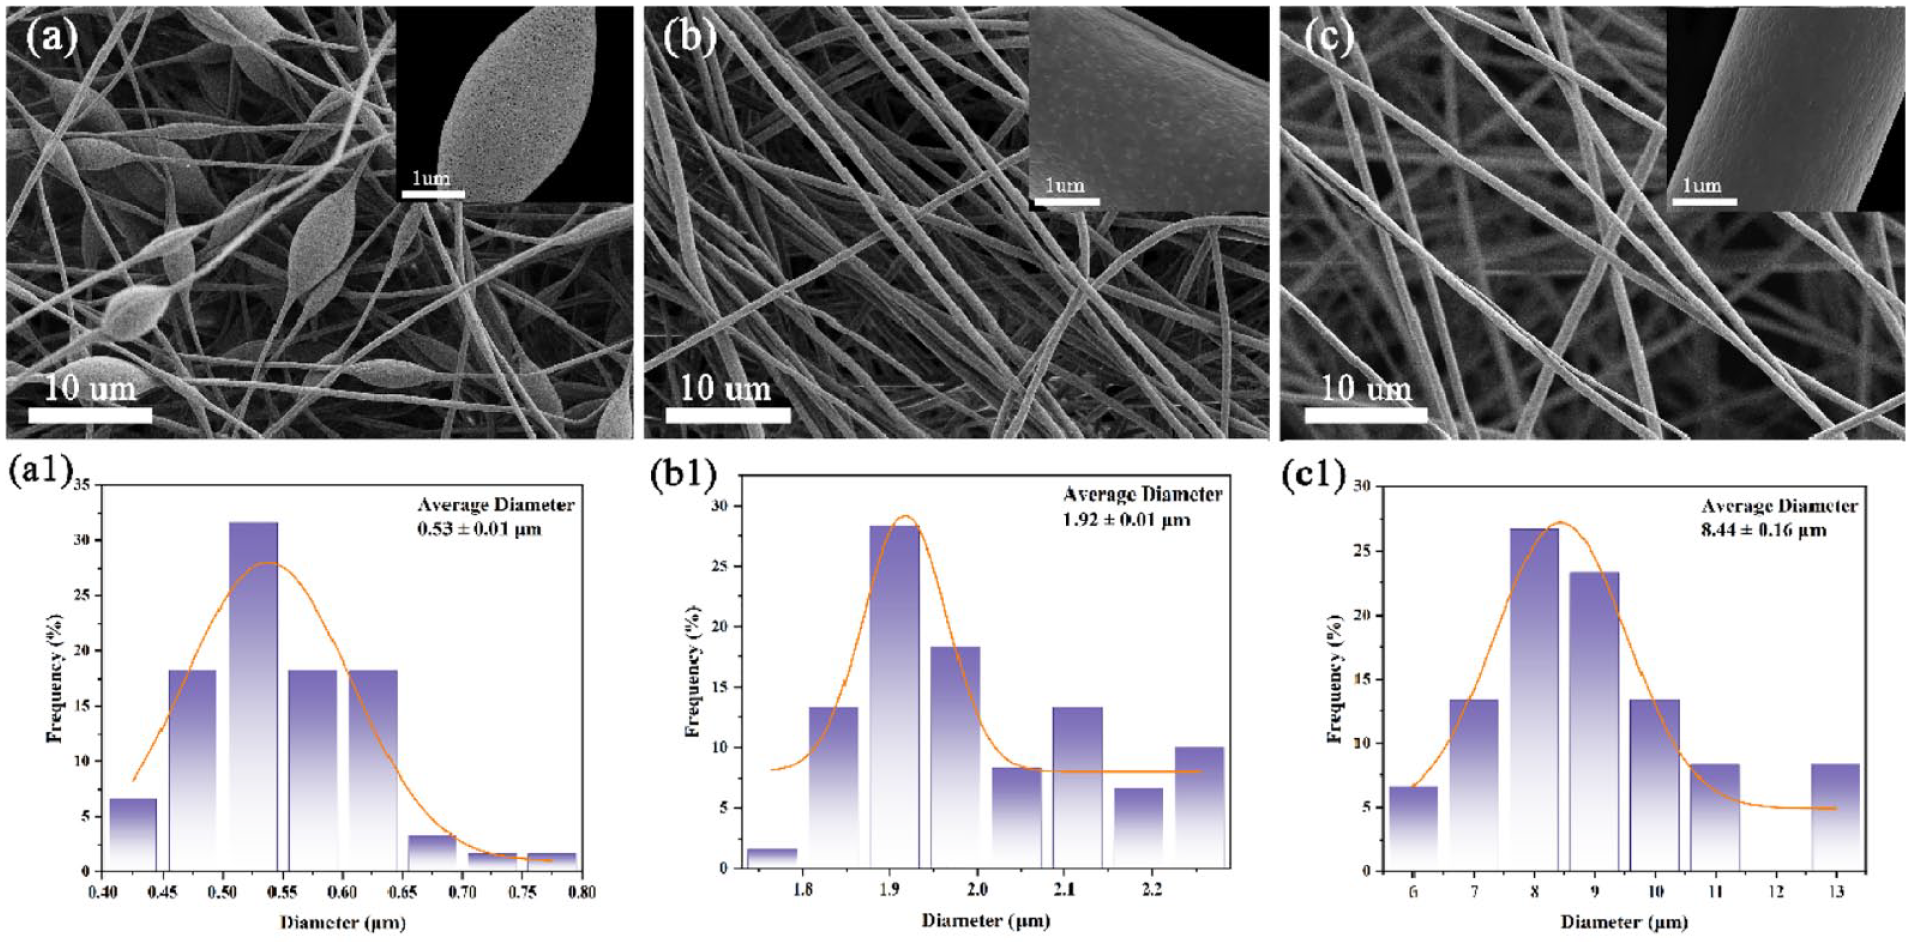
Surface morphologies and fiber diameter distributions of PS electrospun fibers at different concentrations: (a) 10 wt% PS, (b) 20 wt% PS, and (c) 30 wt% PS.
When the concentration is set to 20 wt%, as shown in Figure 5(b), the bead disappears, and the fiber diameter increases to 1.92 μm. Then, the solution concentration increases to 30 wt%, and the fiber diameter rises sharply to 8.44 μm. The results displayed in Figures 4 and Table 1 reveal that the jet path with a higher solution concentration exhibits a longer length of the straight line, smaller envelope cone, and lower whipping frequency. The stretching and refining effects of the jet are weakened, leading to the coarsening of fiber diameter.
The top right corner of Figure 5(a–c) shows the SEM images of PS fibers at higher multiples for the convenience of the observation of surface morphologies. Numerous pores appear on the fiber surface when the PS concentration is higher than 10 wt%. That is because polymeric molecular chains cannot be entangled effectively due to their small quantity; consequently, the water molecules in the air are prone to spread through the loose molecular chains into the jet during the stretching process. At this time, the diffusion of solvent molecules outward will form the enrichment of phase (the collection of polymer macromolecules) and a depleted phase (the combination of water molecules). Continuous and irregular pores appear on the fiber surface with the volatilization of water molecules. Besides, the number of holes on the fiber surface decreases gradually with increasing PS concentration. The reason behind this is that molecular chain entanglement blocks some water molecules from entering, preventing the fiber morphology from being damaged. When the concentration reaches 30 wt%, the volatilization of the jet is enfeebled, and the water molecules fail to enter the jet. Finally, the fiber’s surface tends to be smooth, almost without voids.
Effect of Spinning Voltage on Microbead Shape of the Beaded Fiber
The external electric field formed by the spinning voltage between the electrodes and the induced electric field generated by free and induced charges on the fluid surface seems to be well known to influence the electrospinning process. The electric field is one of the most critical parameters in electrospinning. 18 Therefore, a PS solution with a concentration of 10 wt% picks and other conditions remained unchanged to explore the influence of different spinning voltages on the shape of beads. The beaded forms at the spinning voltages of 10, 15, and 20 kV are shown in Figure 6(a–c); with the increase of the spinning voltage, the resultant electric field between the needle and the target increases. Due to the increased Coulomb force between surface charges, the solution will stretch more effectively, resulting in the shape of the bead gradually shifting from circular to the spindle, as shown in Figure 6(e). The length-to-width ratio of beads increases as the spinning voltage increases. The diameter of the beads also decreases simultaneously, as we see in Figure 6(d). The above experimental results are in good agreement with the simulation results of the bead shape in Figure 6(f), demonstrating the effectiveness of this simulation method.
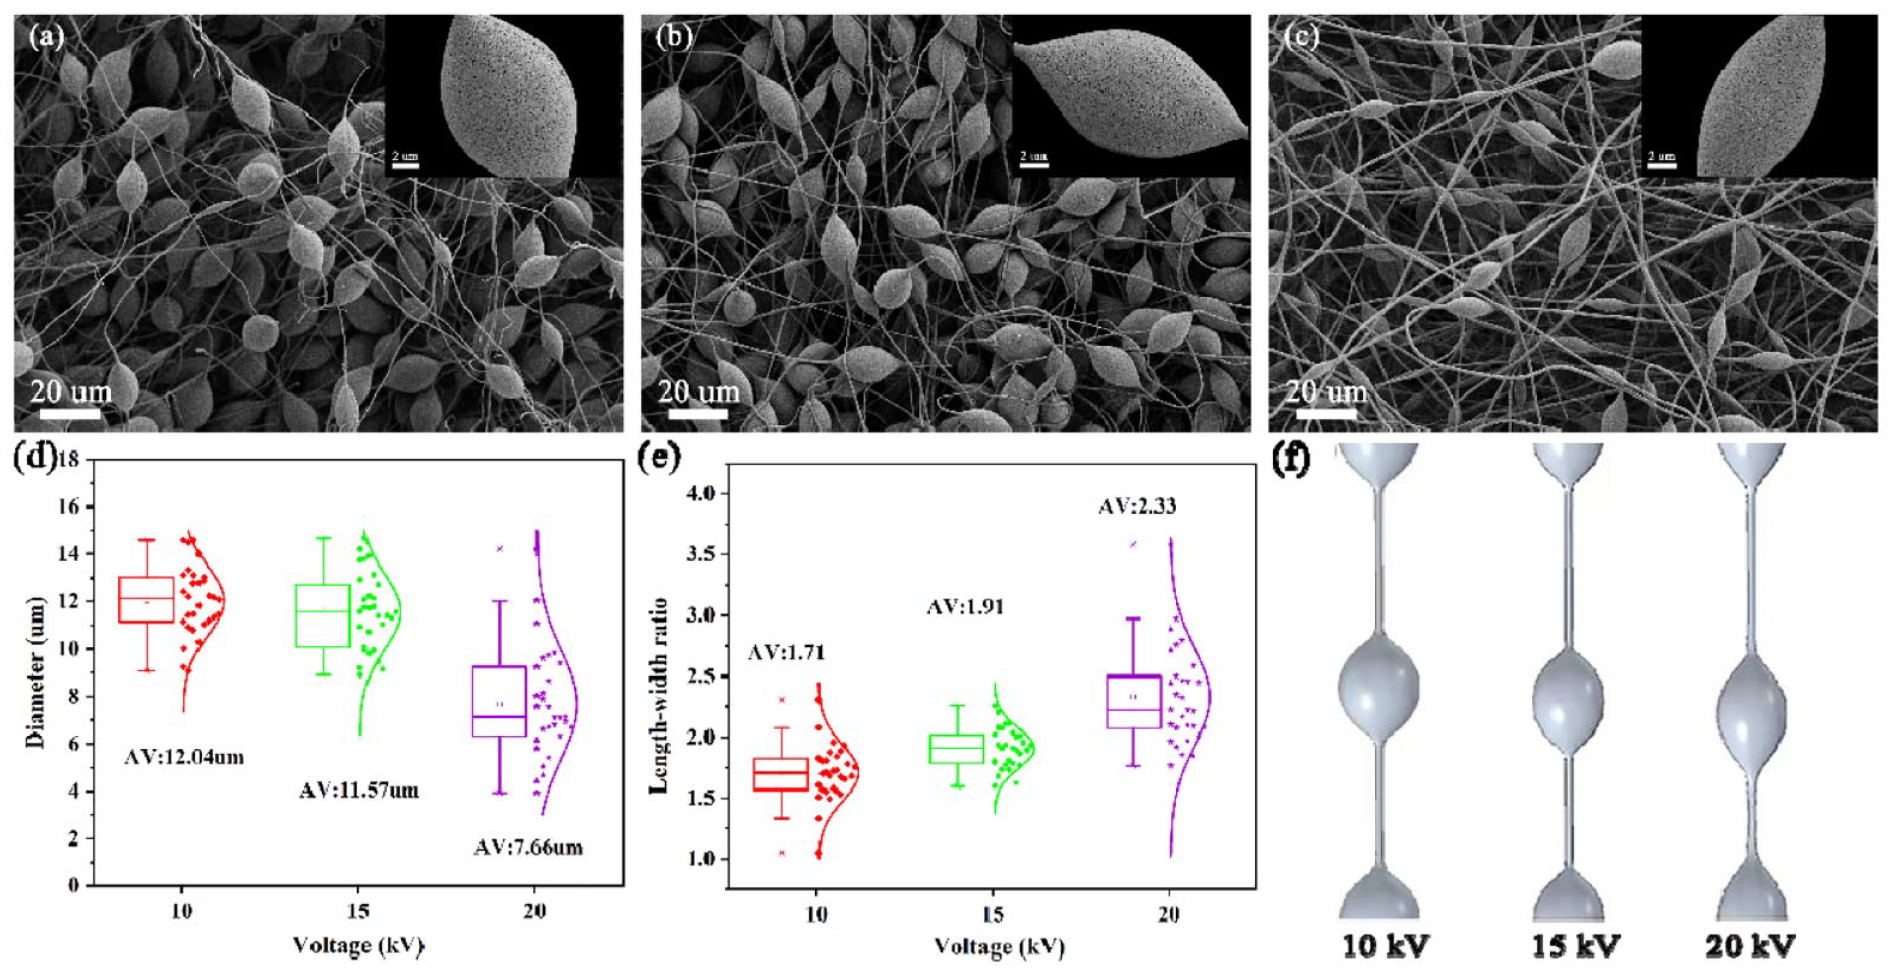
Bead shape under different voltages: (a) 10 kV, (b) 15 kV, (c) 20 kV. (d) Beads diameter under different voltages. (e) Length to width ratio of beads under different voltages. (f) Bead shape simulation under different voltages.
Conclusion
This study investigated the effects of solution concentration on the solution electrospinning process. The investigation finds that the solution concentration influences the Taylor cone morphology, jet motion, fiber diameter, and fiber morphology. According to the findings, a higher solution concentration causes a long straight jet, a smaller envelope cone, and a lower whipping frequency. On the contrary, a lower concentration causes a shorter length of the straight-line segment and a larger whipping area, resulting in more acceptable fiber diameter. The images of the Taylor cone morphology at lower concentration explain the reason for the beads-on-a-string morphology of PS fibers. Assisted by FEM, the microbead shape of beaded fiber under different spinning voltages was simulated by the COMSOL Multiphysics software. The simulation results of the microbead shape analogize with the SEM images in good agreement with each other. The microbead form depends on the degree of stretching during the electrospinning process, and the stronger the spinning voltage, the greater the tensile force. The studies’ findings provide a theoretical underpinning for regulated beaded fiber manufacturing.
Footnotes
Declaration of conflicting interests
The author(s) declared no potential conflicts of interest with respect to the research, authorship, and/or publication of this article.
Funding
The authors disclosed the receipt of the following financial support for the research, authorship, and/or publication of this article: This work was supported by the National Natural Science Foundation of China (Grant No. 11702169), and the Open Project Program of Key Laboratory of Yarn Materials Forming and Composite Processing Technology of Zhejiang Province (Grant No. MTC-2022-01) to Dr. Y. Zheng and Shanghai Local Capacity Building Project (Grant No. 19030501200) to Dr. B. Xin.