
Abstract
Tube necking is a common process used for manufacturing pressure vessels, for example, compressed natural gas capsules, categorized under general spinning processes. An experimentally validated finite element model suited to the process is incorporated to study the deformation, and state of strain and stress in the contact zone. The in situ variation of stress and strain is illustrated via colored contour plots, and Cartesian and polar diagrams. It is shown that in some areas, there are similarities and differences between flow forming and tube necking; for example, like flow forming, the equivalent plastic strain decreases from the inner and outer layers toward the middle layer, and unlike flow forming, the axial strain at the outer layer is negative all around the tube while at the inner layer, axial strain possesses a maximum positive value at contact position. The state of stress and plastic strain in regions around the contact zone is shown at an instant of process duration, which is not quite similar to postprocess stress and strain distribution.
Introduction
Tube necking (neck-spinning) is a widely used process for manufacturing axisymmetric and nonaxisymmetric parts. The process is privileged to its alternatives (e.g. extrusion and deep drawing), because of being flexible, requiring less forces, and no tailor-made dies. Thus, tube necking is being considered the main method for manufacturing some pressure vessels, for example, compressed natural gas (CNG) capsules and fire extinguishers. Tube spinning itself is categorized under the main topic of spinning, which is in fact forming parts by applying required forces and displacements to a rotating blank, through one or several forming rollers. Despite the multiplicity of the studies and publications under the topic of spinning, tube neck-spinning has not been a major focus point of the researchers. Jianguo and Makoto 1 studied the effect of indented feed on spinning forces and strains in parallel spinning of aluminum tubes. The same authors conducted a similar research on paraxial spinning of the one tube end. 2 In another article, they published the results of an experimental research on spinning of a taper shape on tube end 3 and reported several outputs, for example, spinning forces and strains. Makoto et al. 4 performed an experimental study on compression spinning of magnesium alloys and investigated the effect of diameter reduction on several parameters, for example, spinning forces, hardness distribution on tube wall, and thickness strain. Yoshihara et al. 5 simulated the spin forming of magnesium alloys by finite element (FE) method. Xia et al. 6 conducted a research on the forces of nonaxisymmetric tube spinning using FE simulation coupled with experimental evaluation. In a similar study, Xia et al. 7 conducted a research on nonaxisymmetric tube spinning for evaluation of the stress and strain variation in forward and backward spinning passes. Xia et al. 8 also investigated the deformation mechanisms of nonaxisymmetric tube spinning in another article. Akkus and Kawahara 9 presented a simple analytical method for predicting the thickness distribution on the domes formed by spinning at the tube end. Lexian and Dariani 10 presented a contact model used in an finite element model (FEM) to simulate the dome forming by tube spinning. Later, they investigated the effects of roller parameters (nose radius and release angle) on forming quality of the dome formed tubes. 11 Huang et al. 12 investigated the process of neck-spinning at elevated temperature and reported several parameters including equivalent strain and thickness distribution on the tube. Zoghi et al. 13 studied the effect of feed on strain and residual stress raised after completion of a pass in dome-forming tube spinning.
Distribution of stress and strain during the process has not been investigated by former researchers. Knowledge of the in situ distribution of the stress and strain during the process could be highly useful for understanding the deformation modes and investigation of common defects like wrinkling and hot tear. Due to high sophistication degree, as well as dynamic nature and high temperature of the process, experimental or analytical approaches for investigation of stress and strain are difficult to achieve.
This article deals with understanding the in situ deformation and evolution of stress and strain during tube necking process at the contact zone (between roller and tube) through an experimentally validated FE simulation of first pass of a tube spinning process at elevated temperature.
Experiments
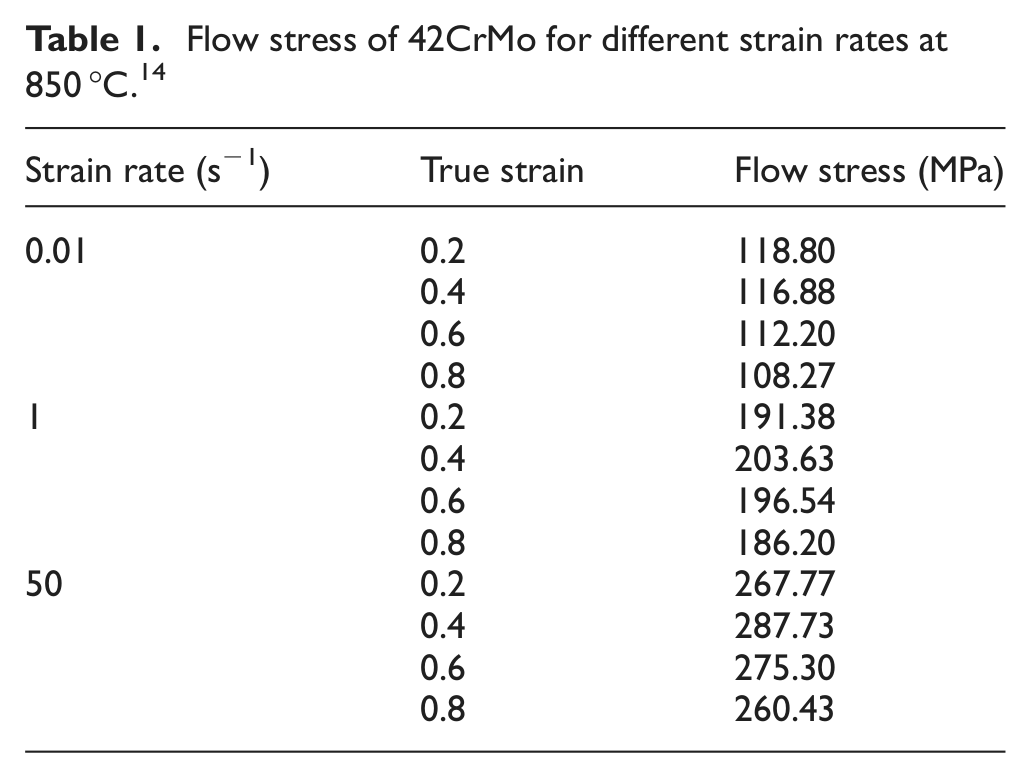
For carrying out the process, a hot tube spinning machine is incorporated. The already heated tube is clamped by a hydraulic chuck and rotated at 850 r/min. The roller travels in a circular arc path along the tube to form the tube into a dome. The temperature of the tube is maintained by several torches heating the tube in the deformation zone. Figure 1 shows the configuration of the machine and tube during operation. The tube diameter and thickness are 232.5 and 5.5 mm, respectively, and 220 mm of its length is projected out of the chuck. Tube material is 42CrMo steel and working temperature is about 850 °C. The material property is depicted in Table 1.
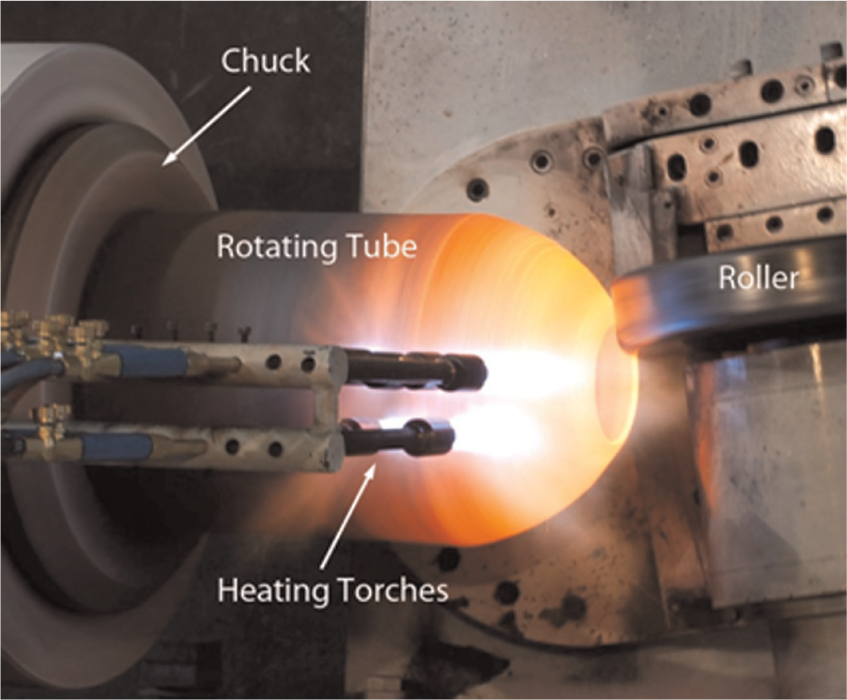
Hot tube spinning machine—experiment configuration.
Flow stress of 42CrMo for different strain rates at 850 °C. 14
The roller forms the straight tube into a dome in eight successive passes. The path of roller at each pass is a circular arc. The schematic illustration of the roller passes and sectioned final workpiece are depicted in Figure 2.
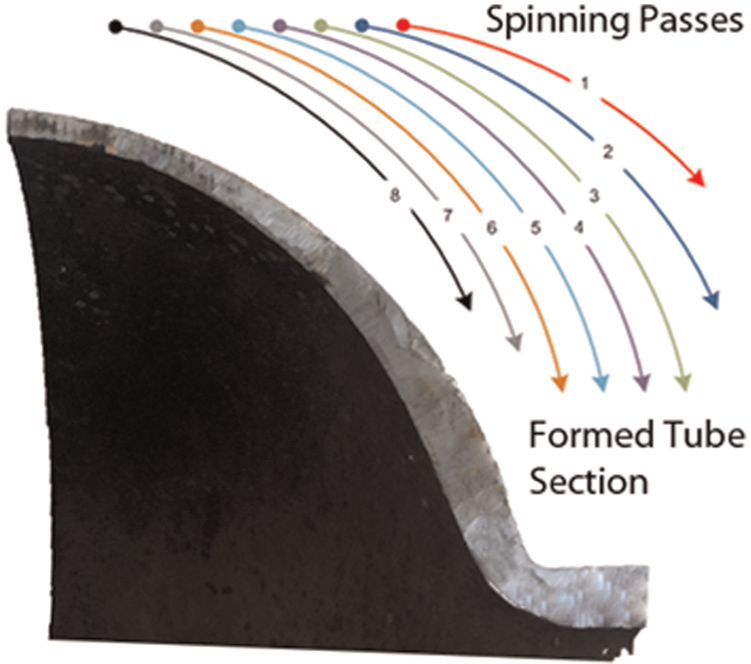
Formed dome section and schematic illustration of roller paths in eight passes.
FE simulation
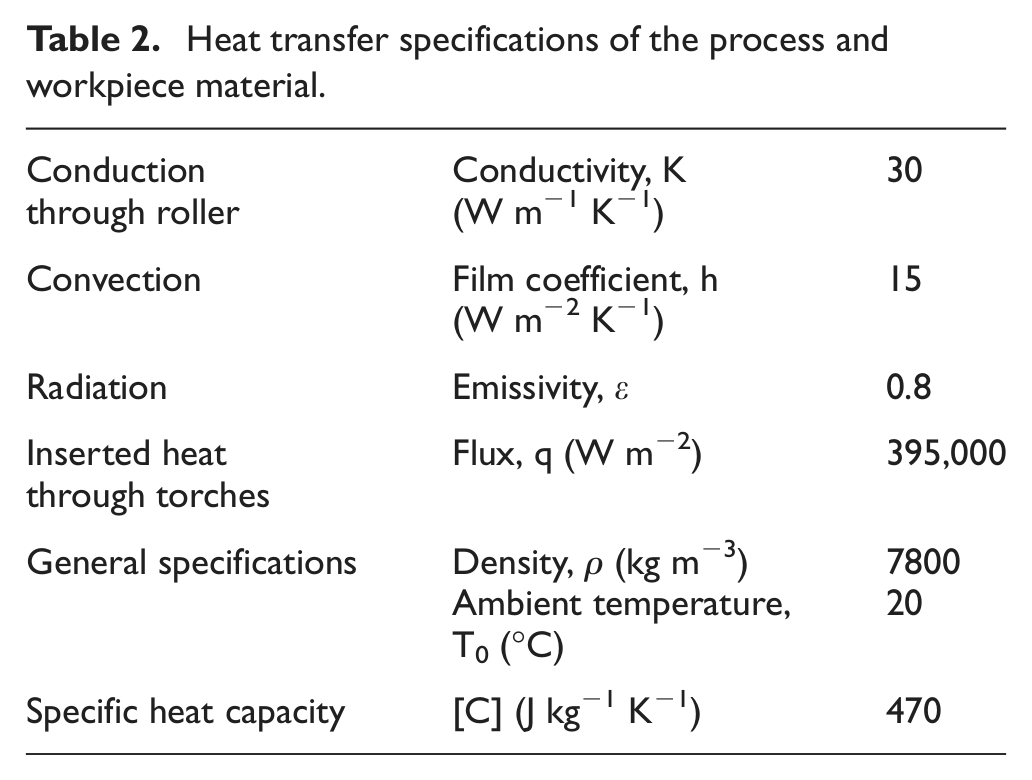
The primary concern in the simulation of the process is dealing with the temperature variation during the process, which may affect the material property. To investigate the state of temperature in the process, a thermal–mechanical coupled FEM is developed. Total number of 5600 shell elements (S4RT) is incorporated, and the effect of strain-induced heat in material is also considered. The inserted heat of the torches is considered as periodic flux. Conduction through roller, convection and radiation out of tube surface into the ambient are also considered. The thermal specifications of the process are tabulated in Table 2. The variation of the temperature in first spinning pass is depicted in Figure 3.
Heat transfer specifications of the process and workpiece material.
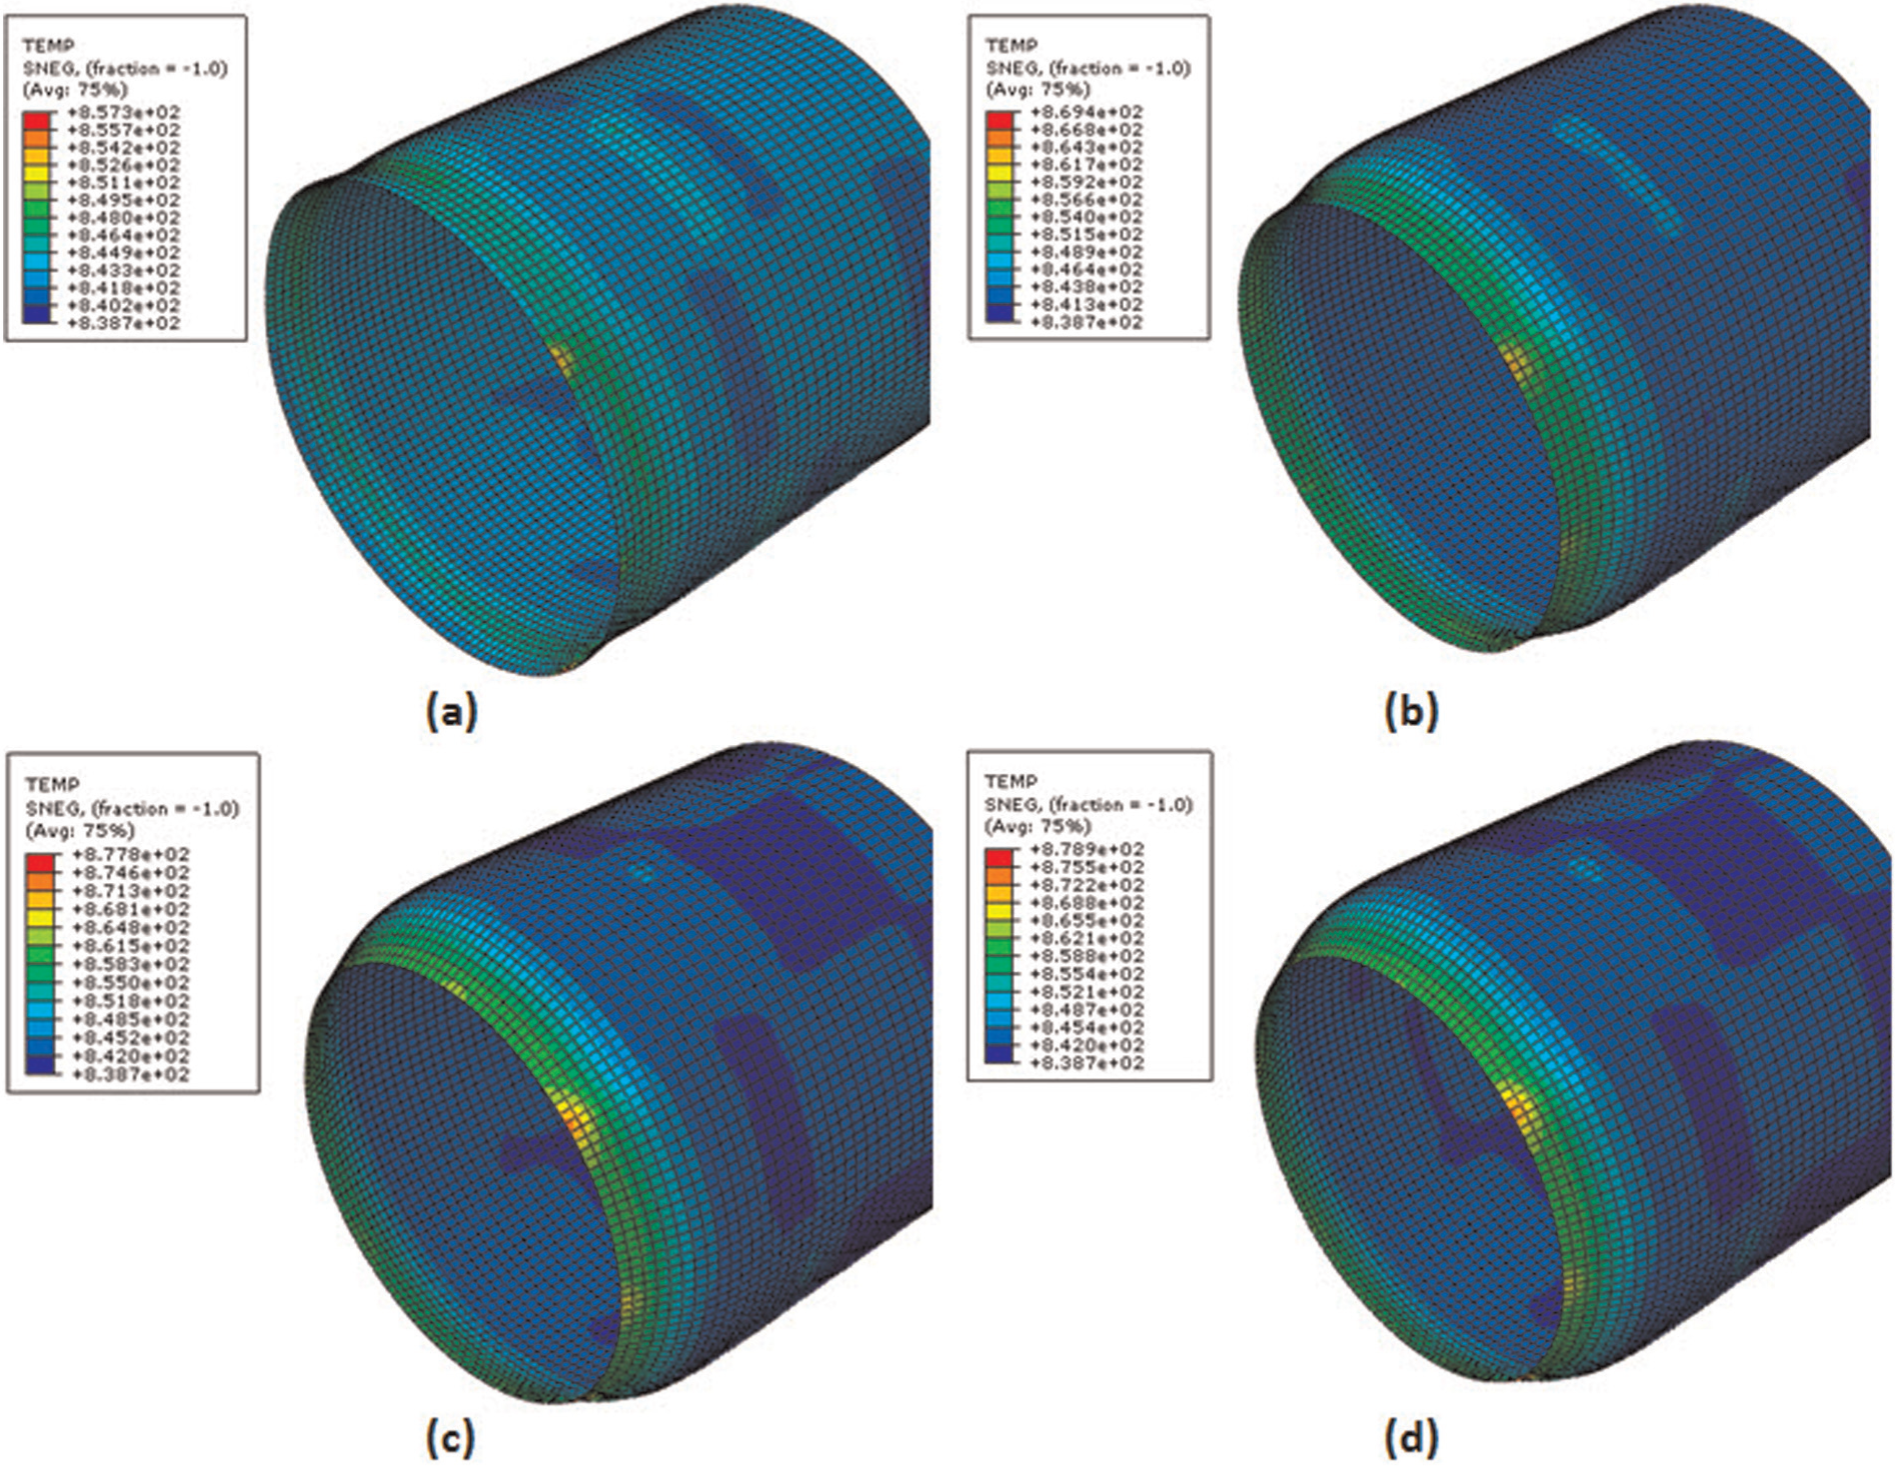
Variation of temperature throughout process obtained from thermal–mechanical coupled simulation.
It is seen that throughout the simulation in first pass (1.64 s), the temperature varies between about 840 °C and 880 °C. The variation of the temperature in thickness, extracted from integration points of the shell elements, was observed to be not very high. Such results seem to be reasonable because of low heat transfer time and existence of the regional heat source (torch) compensating for radiation, conduction, and convection out of tube surface.
The material property variation, associated with the temperature change, is not really concurrent with the temperature variation. The reason is the time dependency of the microstructure evolution mechanisms, for example, recovery, recrystallization (dynamic and static), and grain growth. Usually, the material property change occurs in longer times than short period of such process. Therefore, considering the high render times of the thermal–mechanical FEM simulations, assuming the constant material property throughout the process and neglecting the temperature variations are sensible. In what follows, the isothermal FE simulation of the process in 850 °C is discussed.
A dynamic explicit model is developed using commercial software ABAQUS. Total procedure of forming the tube into dome is simulated. Generally, researchers like Fan et al., 15 Huang et al., 12 and Lexian and Dariani 10 have used shell elements to model spinning processes because of long computation times of the models with solid elements. In this study, cubic solid elements are used to preserve the stress and strain variation in thickness. The model is consisting of 32,000 elements (four elements in thickness) with smaller sizes at the free end, which is the deformation zone. Roller is considered as an analytical rigid part.
Due to the elevated temperature of the process, the strain rate and velocity of the process are important to be considered in material behavior. 16 The strain rate sensitivity is considered in defining the material properties (Table 1) based on the experimental data of Lin et al. 14 Thus, it was not possible to virtually increase the loading speed for saving the computation time. In first spinning pass, of which the stress and strain distributions are extracted, other process speeding techniques, like mass scaling, are not incorporated either. However, for speeding the simulation rendering for later passes, mass scaling factor of 10 is incorporated, and to compensate the virtual dynamic effects, the tube is considered fixed and roller is rotated around it. Furthermore, to avoid the element distortion due to the excessive deformation in later passes, adaptive meshing is incorporated. Contact between roller and tube is considered of penalty type with a friction coefficient of 0.2. Rotational speed is identical to the experiment (850 r/min), and roller translational feed is 0.25 mm per revolution.
Validation of FE simulation
Due to the elevated temperature of the process, real-time measurements are not easy to accomplish. Other methods for measuring the deformation and strain-like grid scribing or marking are also not applicable because of the surface oxidation at high temperature. Therefore, for validation of the FE simulation, the thickness of the formed part is measured via ultrasonic through-transmission testing and compared to the tube thickness obtained from FEM.
Figure 4 depicts the through-transmission ultrasonic thickness measurement setup. In this measurement technique, a piezoelectric transducer (transmitter) coupled to one side of the specimen generates a vibratory signal, and another transducer (receiver) receives the signal at the other side of the specimen. For better transmission of the vibration waves between workpiece and transducers, ultrasonic gel is used as coupling. The thickness is calculated by the time difference between signal generation at transmitter and its receipt at receiver, knowing the speed of sound in medium. Although this is a high precision method, the reason to use it was the difficulty of access to inside areas of the workpiece by simple devices like Vernier scale calipers.
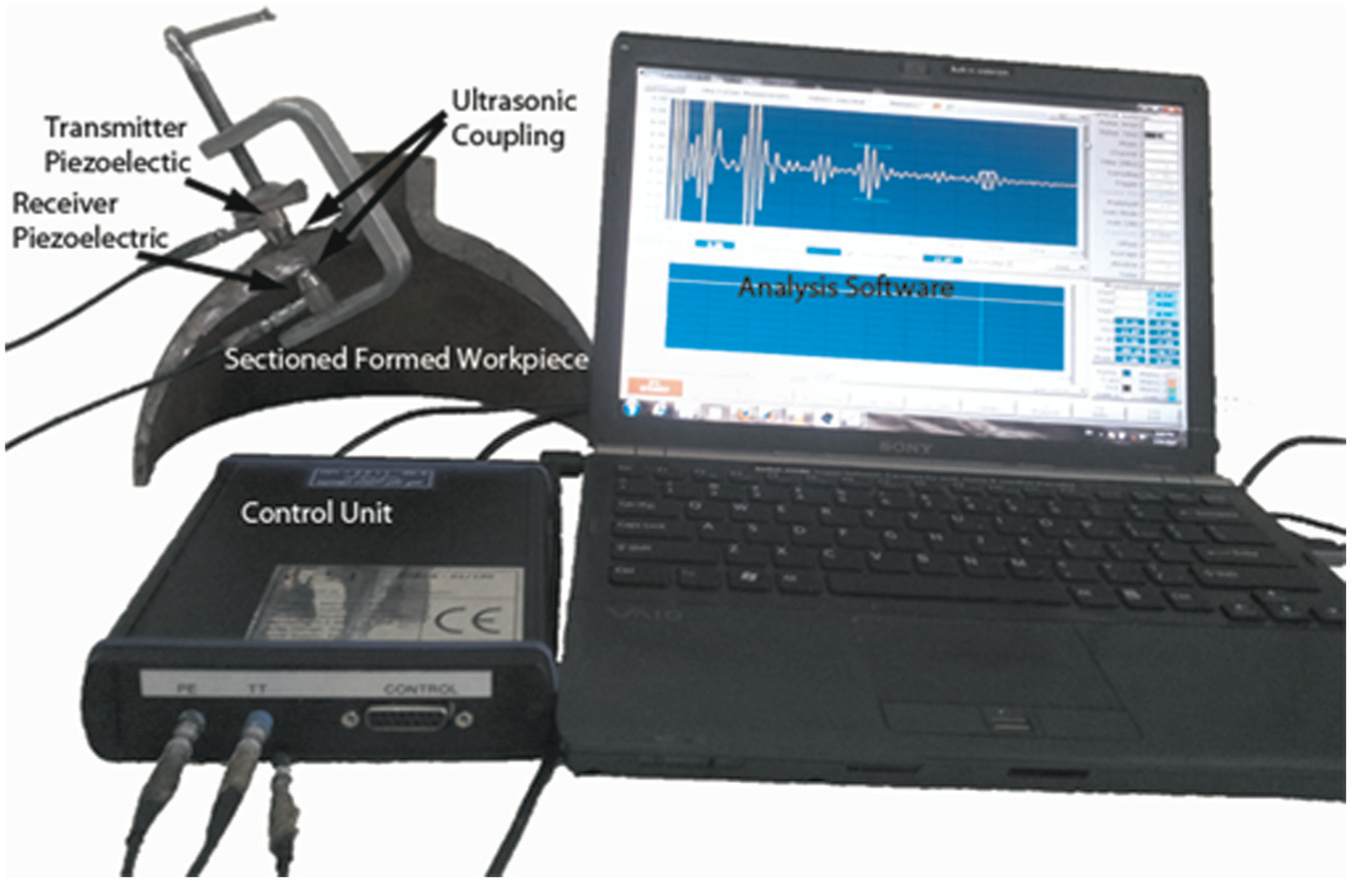
Through-transmission ultrasonic thickness measurement setup.
Figure 5 shows the comparison of the measured tube thickness with that of the simulation. The results of Lexian and Dariani 10 on a similar geometry are also shown in Figure 5. Obviously, there is a good agreement between the simulation results and the experimental ones.
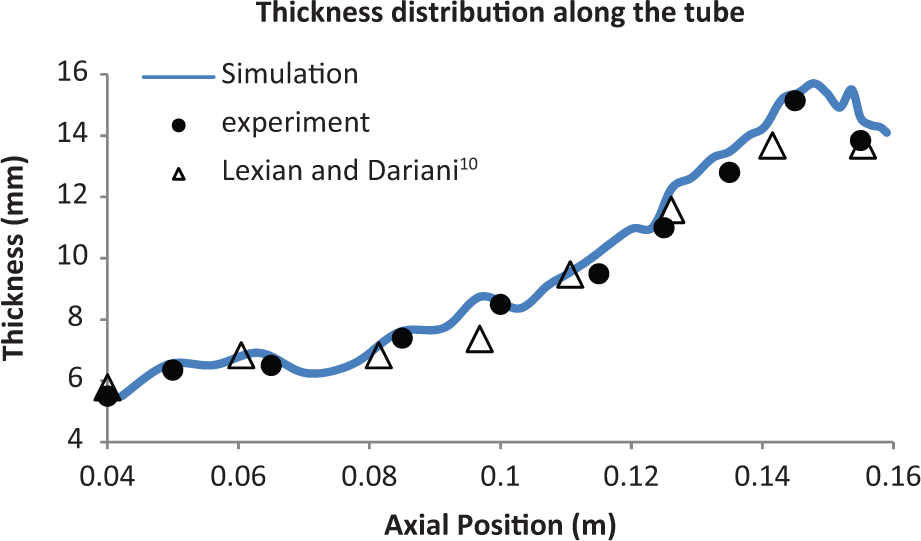
Comparison of the thickness obtained from FE model and ultrasonic measurement.
Results
The state of the stress and strain in contact area of the tube in tube spinning process is investigated in this part. All the illustrations are based on the simulation of the first spinning pass and at the instant when the roller has gone past 20% of its arc path (which is about half the axial distance to the tube end).
Figure 6(a) shows the FEM of the tube and the principal directions based on which stresses and strains are discussed. In Figure 6(b), direction 1 is tangential to the tube and normal to the tube rotation axis. Direction 2 is tangential to the tube and in line with the translational movement of the roller. Direction 3 is the normal to the tube and normal to the translational path of the roller. Strain and stress components in directions 1–3 will be referred to as circumferential, axial, and thickness strain and stress, respectively. It should be noted that the coordinate system of each element is unique and attached to the same element.
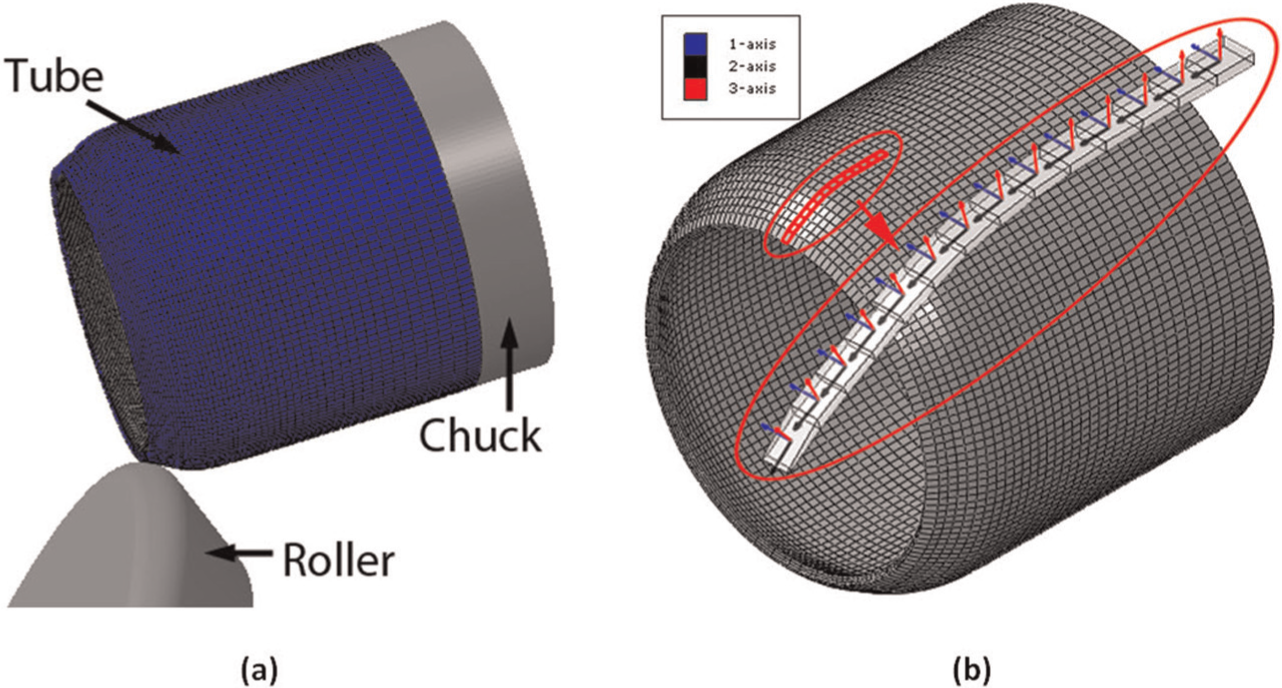
(a) Finite element model of the spun tube and (b) indication of principal directions used for obtaining the results.
Distribution of the plastic strain components
Figure 7(a) depicts the distribution of the circumferential strain (the strain in direction 1). It is easily observed that the entire exterior layer is under negative (compressive) strain. The zone with maximum compressive strain (red colored) is the current contact zone. It is seen that the amount of strain is higher above the contact zone where the roller has already passed. In Figure 7(b), the penetration of the circumferential strain in axial section is depicted. It is seen that it decreases from the outer layer where there is a contact between the roller and the tube to the inner layer.
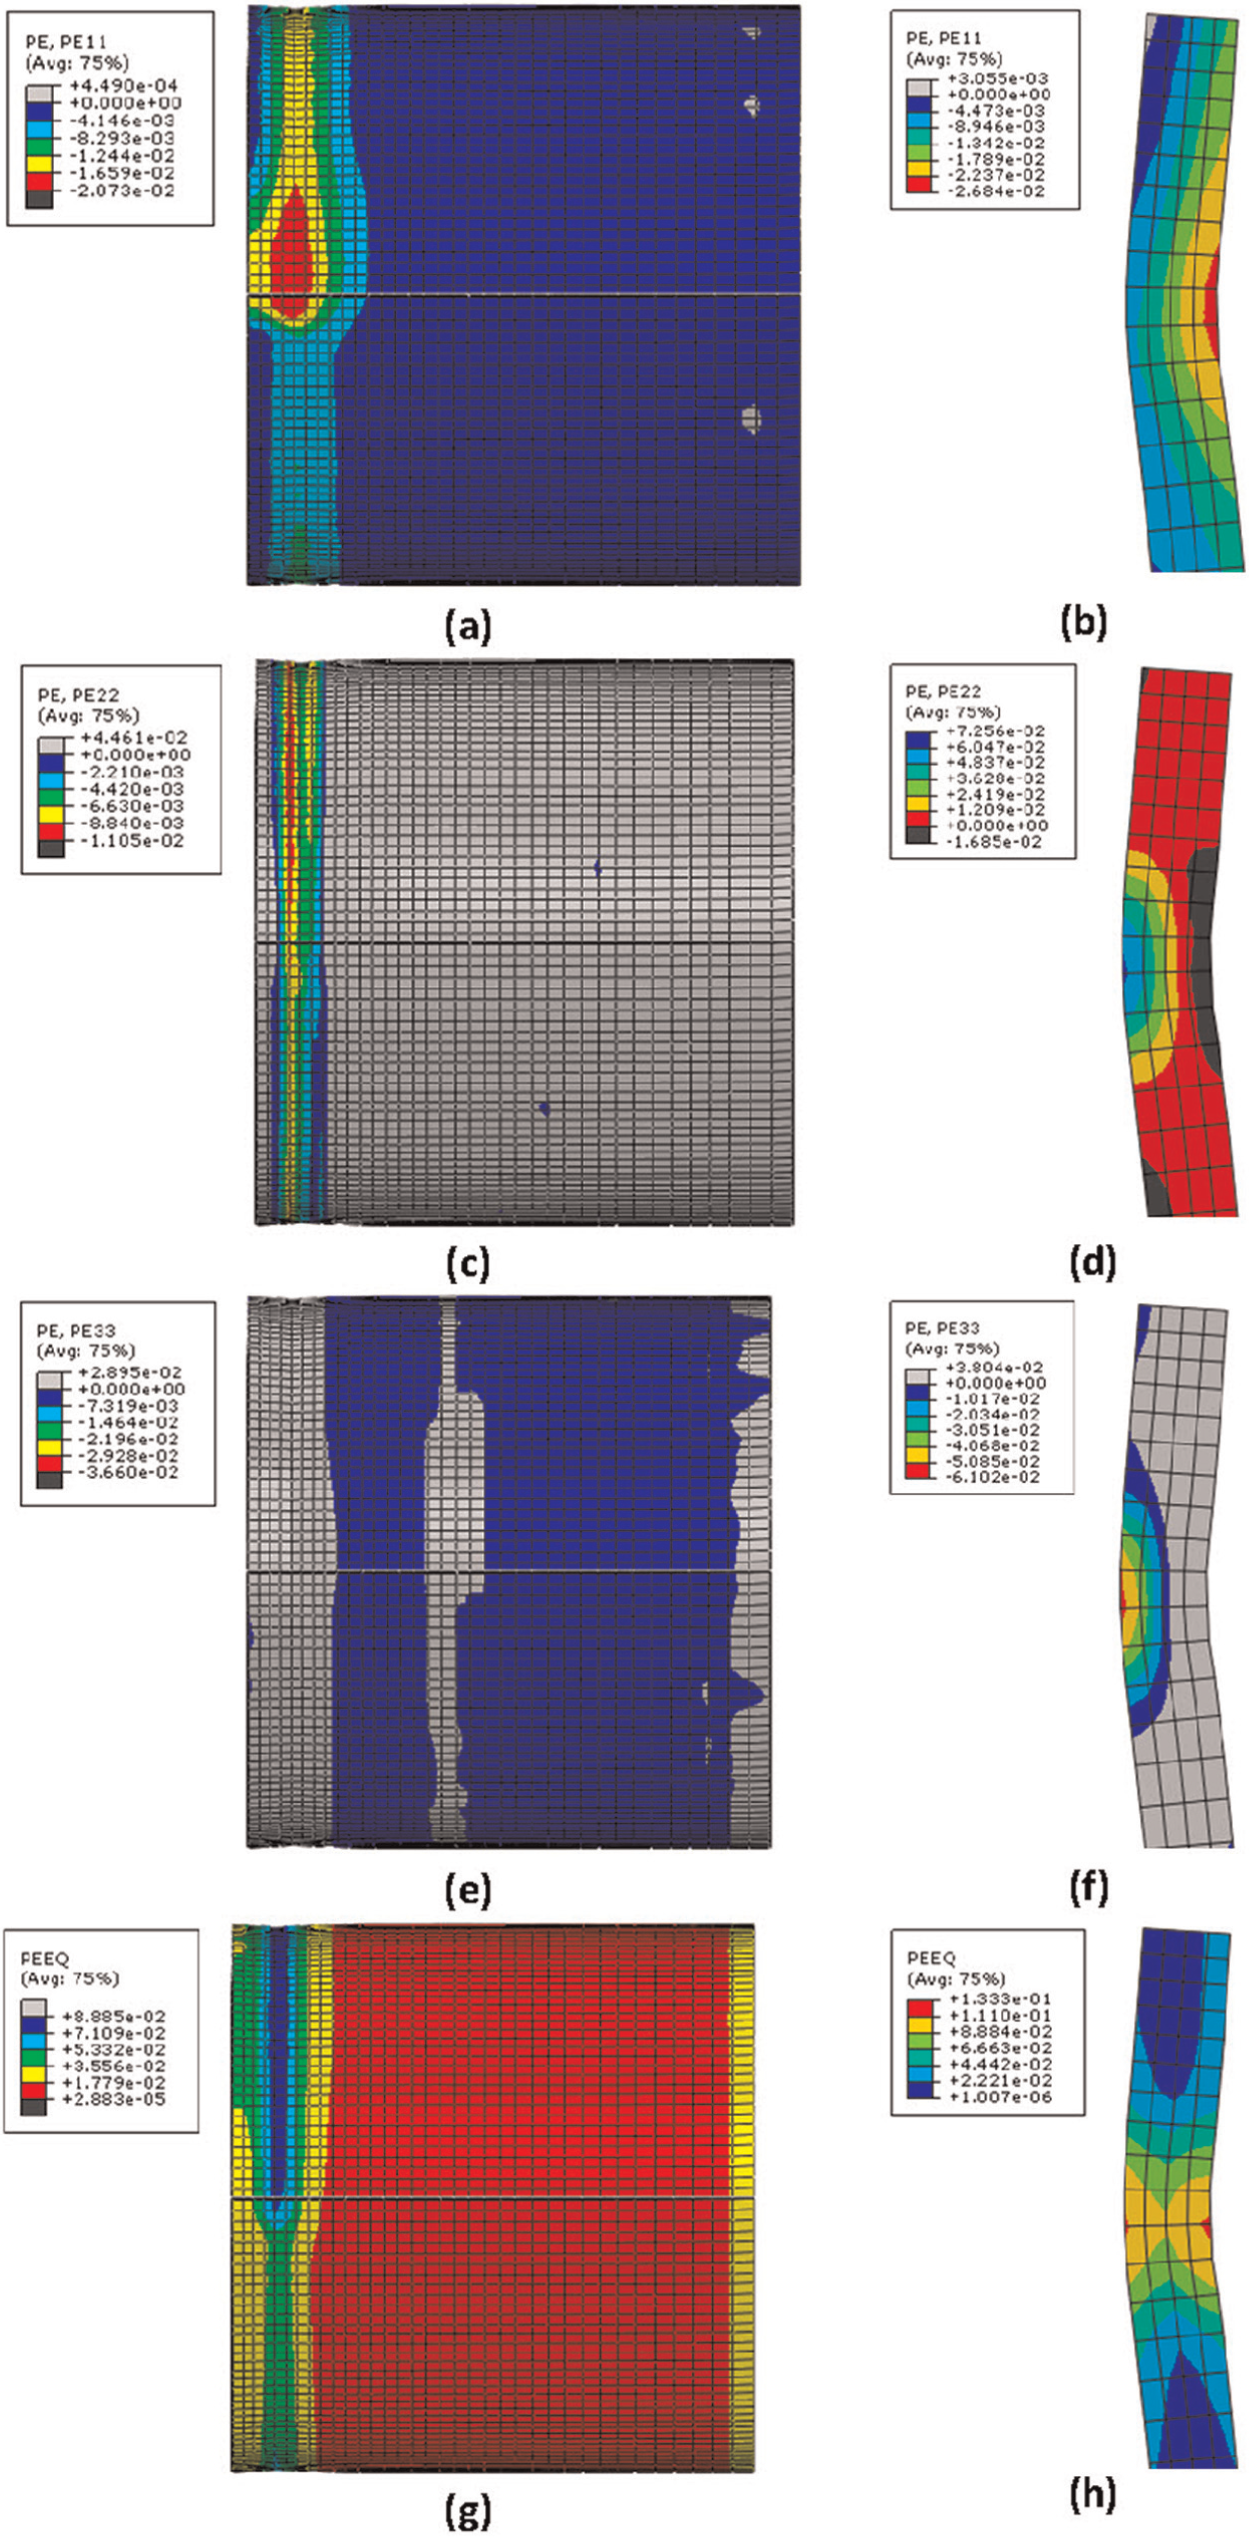
Distribution of plastic strain during the process: (a) circumferential strain on tube surface, (b) circumferential strain at axial section of the contact zone, (c) axial strain on tube surface, (d) axial strain at axial section of the contact zone, (e) thickness strain on tube surface, (f) thickness strain at axial section of the contact zone, (g) equivalent strain on tube surface, and (h) equivalent strain at axial section of the contact zone.
Figure 7(c) shows the distribution of axial strain. The outer layer above and below the roller possesses compressive strain, while it is seen in Figure 7(d) that the inner layers are positive in axial strain value. The negative strain at the outer layer is the result of direct penetration of the roller making a curve with its inner side toward the roller. The maximum elongation in thickness occurs right under the roller contact zone in the inner layer of the tube, which is the outer layer of the curved bend. In fact, the effect of bending and elongation, both together, amplify the positive strain.
Figure 7(e) shows the outer layer of the tube, which undergoes positive thickness strain (in contact area) despite the direct pressure of the roller. This is the result of the negative axial and circumferential strain and the volume being constant during the plastic deformation. It is seen in Figure 7(f) that the thickness strain in the inner layers is negative, obviously compensating the positive axial strain for the volume to be constant.
Figure 7(g) shows the distribution of equivalent strain in the tube outer layer, while Figure 7(h) shows the distribution of equivalent strain in the axial section during the process. Figure 7(g) shows that the amount of equivalent strain, as a measure of total deformation, is highest at the path of roller in circumference, while the swept path possesses larger values of strain than the areas in front of the roller. In the axial direction, there is a considerable symmetry around the roller in chuck side and the free end. Figure 7(h) shows that the equivalent strain distribution in thickness is also of an approximately symmetric nature around the middle layer of the thickness, the inner and outer layers having higher values compared to the middle layer. This is similar to equivalent strain pattern in cold flow forming (at the end of the process), as reported by Roy et al. 17 and Haghshenas et al. 18 It should also be noted that the results of these researchers are on the fully fabricated workpiece (postprocess) while the illustrations in this article represent the stress and strain state while the roller is in contact with the workpiece and the process is not finished yet. However, despite the symmetry seen in distribution of equivalent strain in thickness, one should remember the completely unsymmetrical distribution of the strain components in circumferential, axial, and thickness direction already illustrated in Figure 7.
Figure 8 is the illustration of plastic strain components as well as equivalent strain on an axial line passing from the current roller contact point. Figure 8(a)–(d) depicts the distribution of circumferential, axial, thickness, and equivalent strain, respectively. The values for the outer and inner layers are average of the elements and not nodal values.
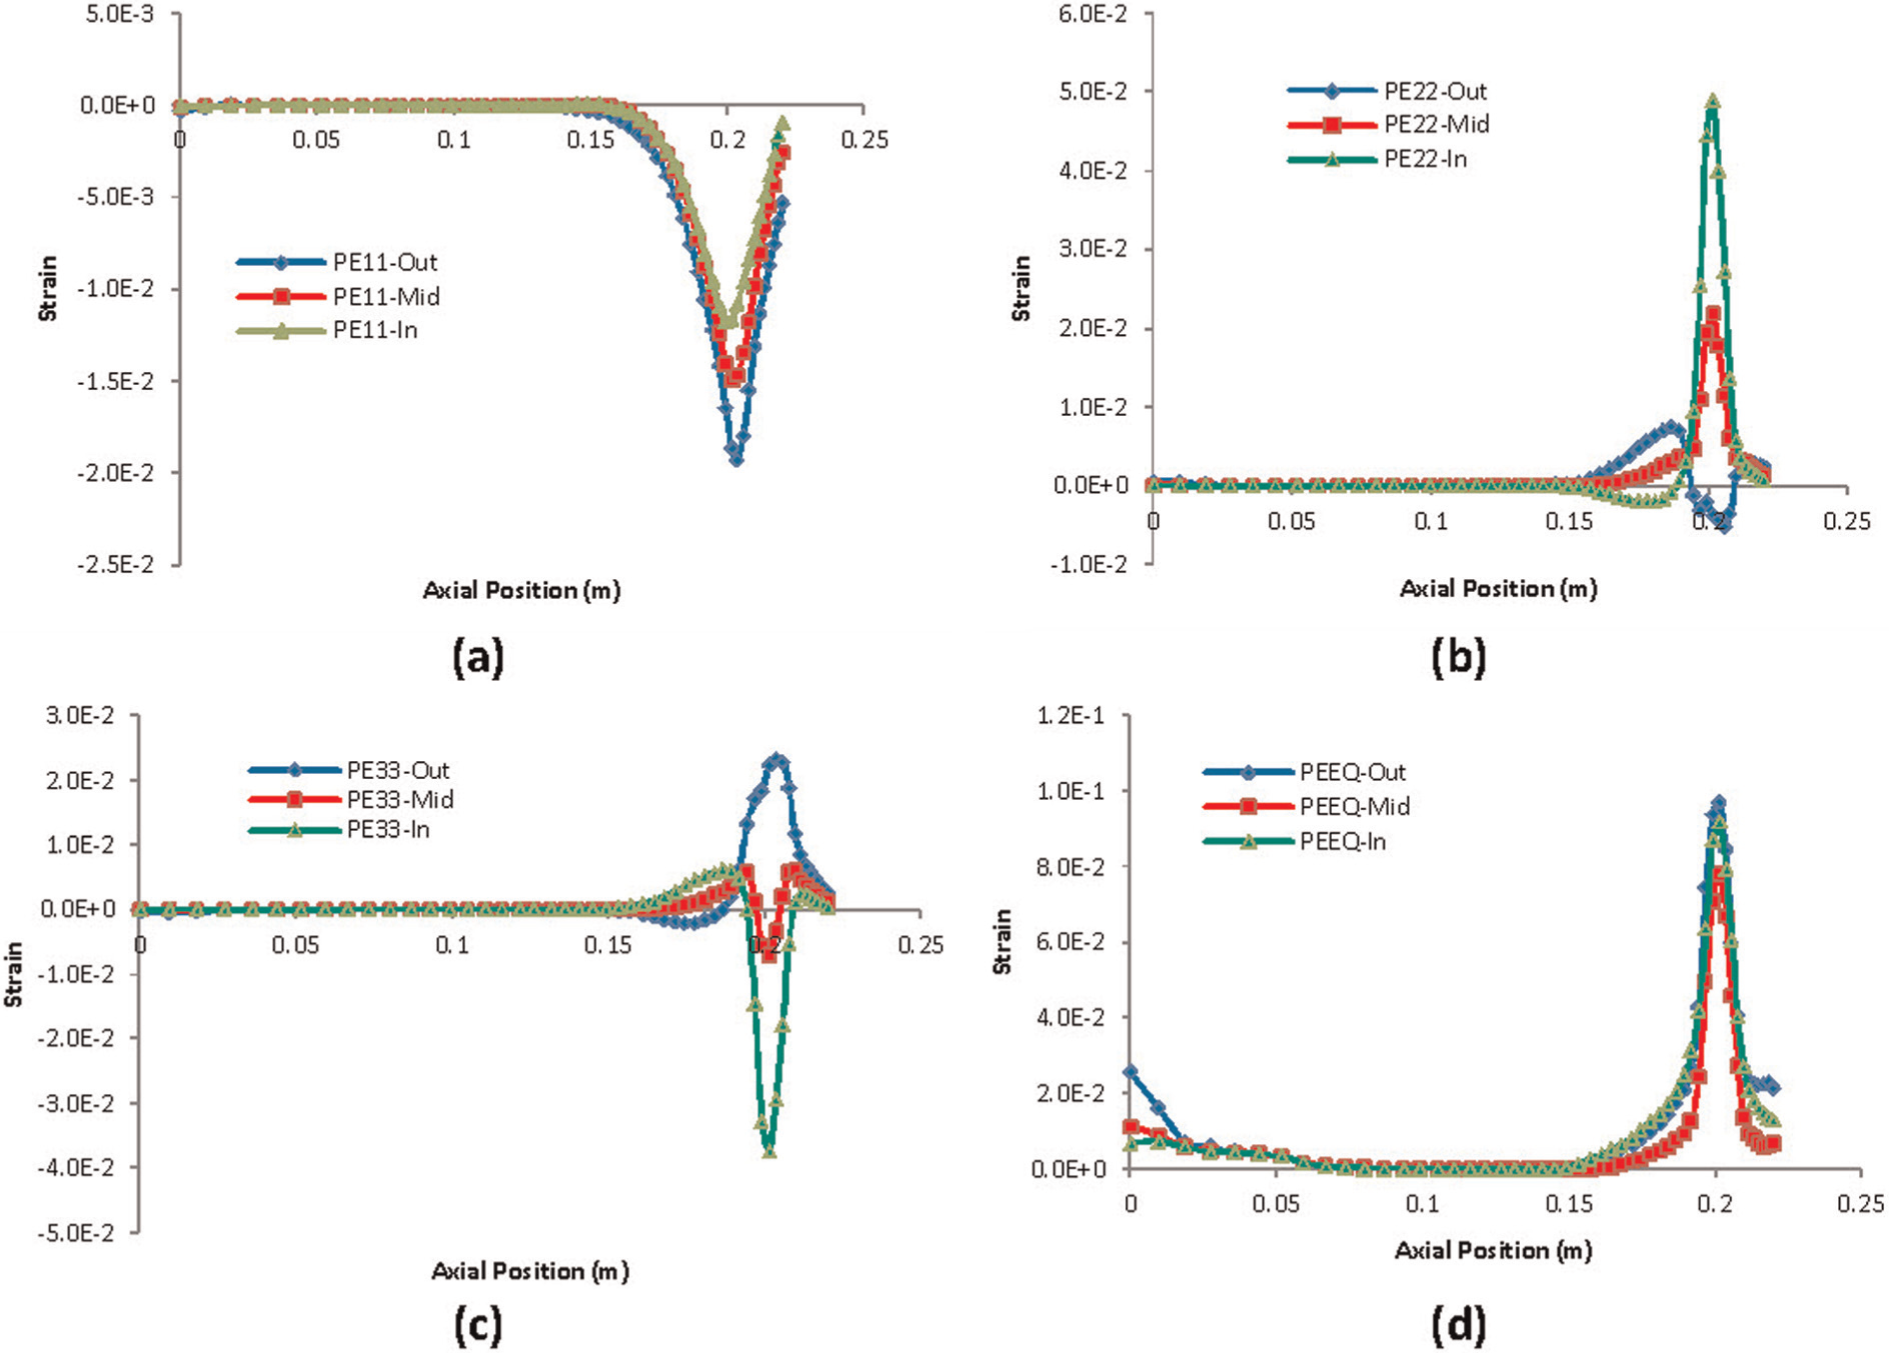
Distribution of plastic strain along the tube axis: (a) circumferential strain, (b) axial strain, (c) thickness strain, and (d) equivalent strain.
The compressive circumferential strain shown in Figure 8(a) similar to Figure 7(b) represents a nonuniform distribution in thickness at the contact zone. Its value is decreasing from the outer layer to the inner layer. The strain value in the outer layer is nearly twice as that of the inner layer. The circumferential strain has also a good resemblance to the distribution of the same strain in conventional spinning presented by Biglari et al. 19 However, previous studies show that the strain after completion of the spinning pass and separation of the roller and workpiece has a uniform distribution in thickness. 13 The distribution of negative circumferential strain should be considered in the investigation of common wrinkling defect that occurs in the presence of compressive strain.
In Figure 8(b), besides the facts revealed in Figure 7(c) and (d), it is seen that the axial strain at the outer layer reaches a maximum positive value right before the contact zone where it has maximum negative value. On the other hand, the axial strain in the inner layer, which has a maximum positive value in the contact zone, possesses a maximum negative value right before the contact zone. This pattern suggests a local indentation of the roller making an inward curve, so the outer layer is compressed and the inner layer is extended. The regions with high tensile axial strain are subject to hot tear defect if the amount of inclusions (especially S and P) is higher than a certain value.
The thickness strain in the outer layer, depicted in Figure 8(c), reaches a maximum positive value in the contact zone, despite the direct pressure of the roller on the outer layer, because both the circumferential and axial strains are negative. Figure 9 shows the distribution of the plastic strain components on the circular path passing from the contact zone. The position 0° is the current roller contact zone, and the tube rotation is counter-clockwise.
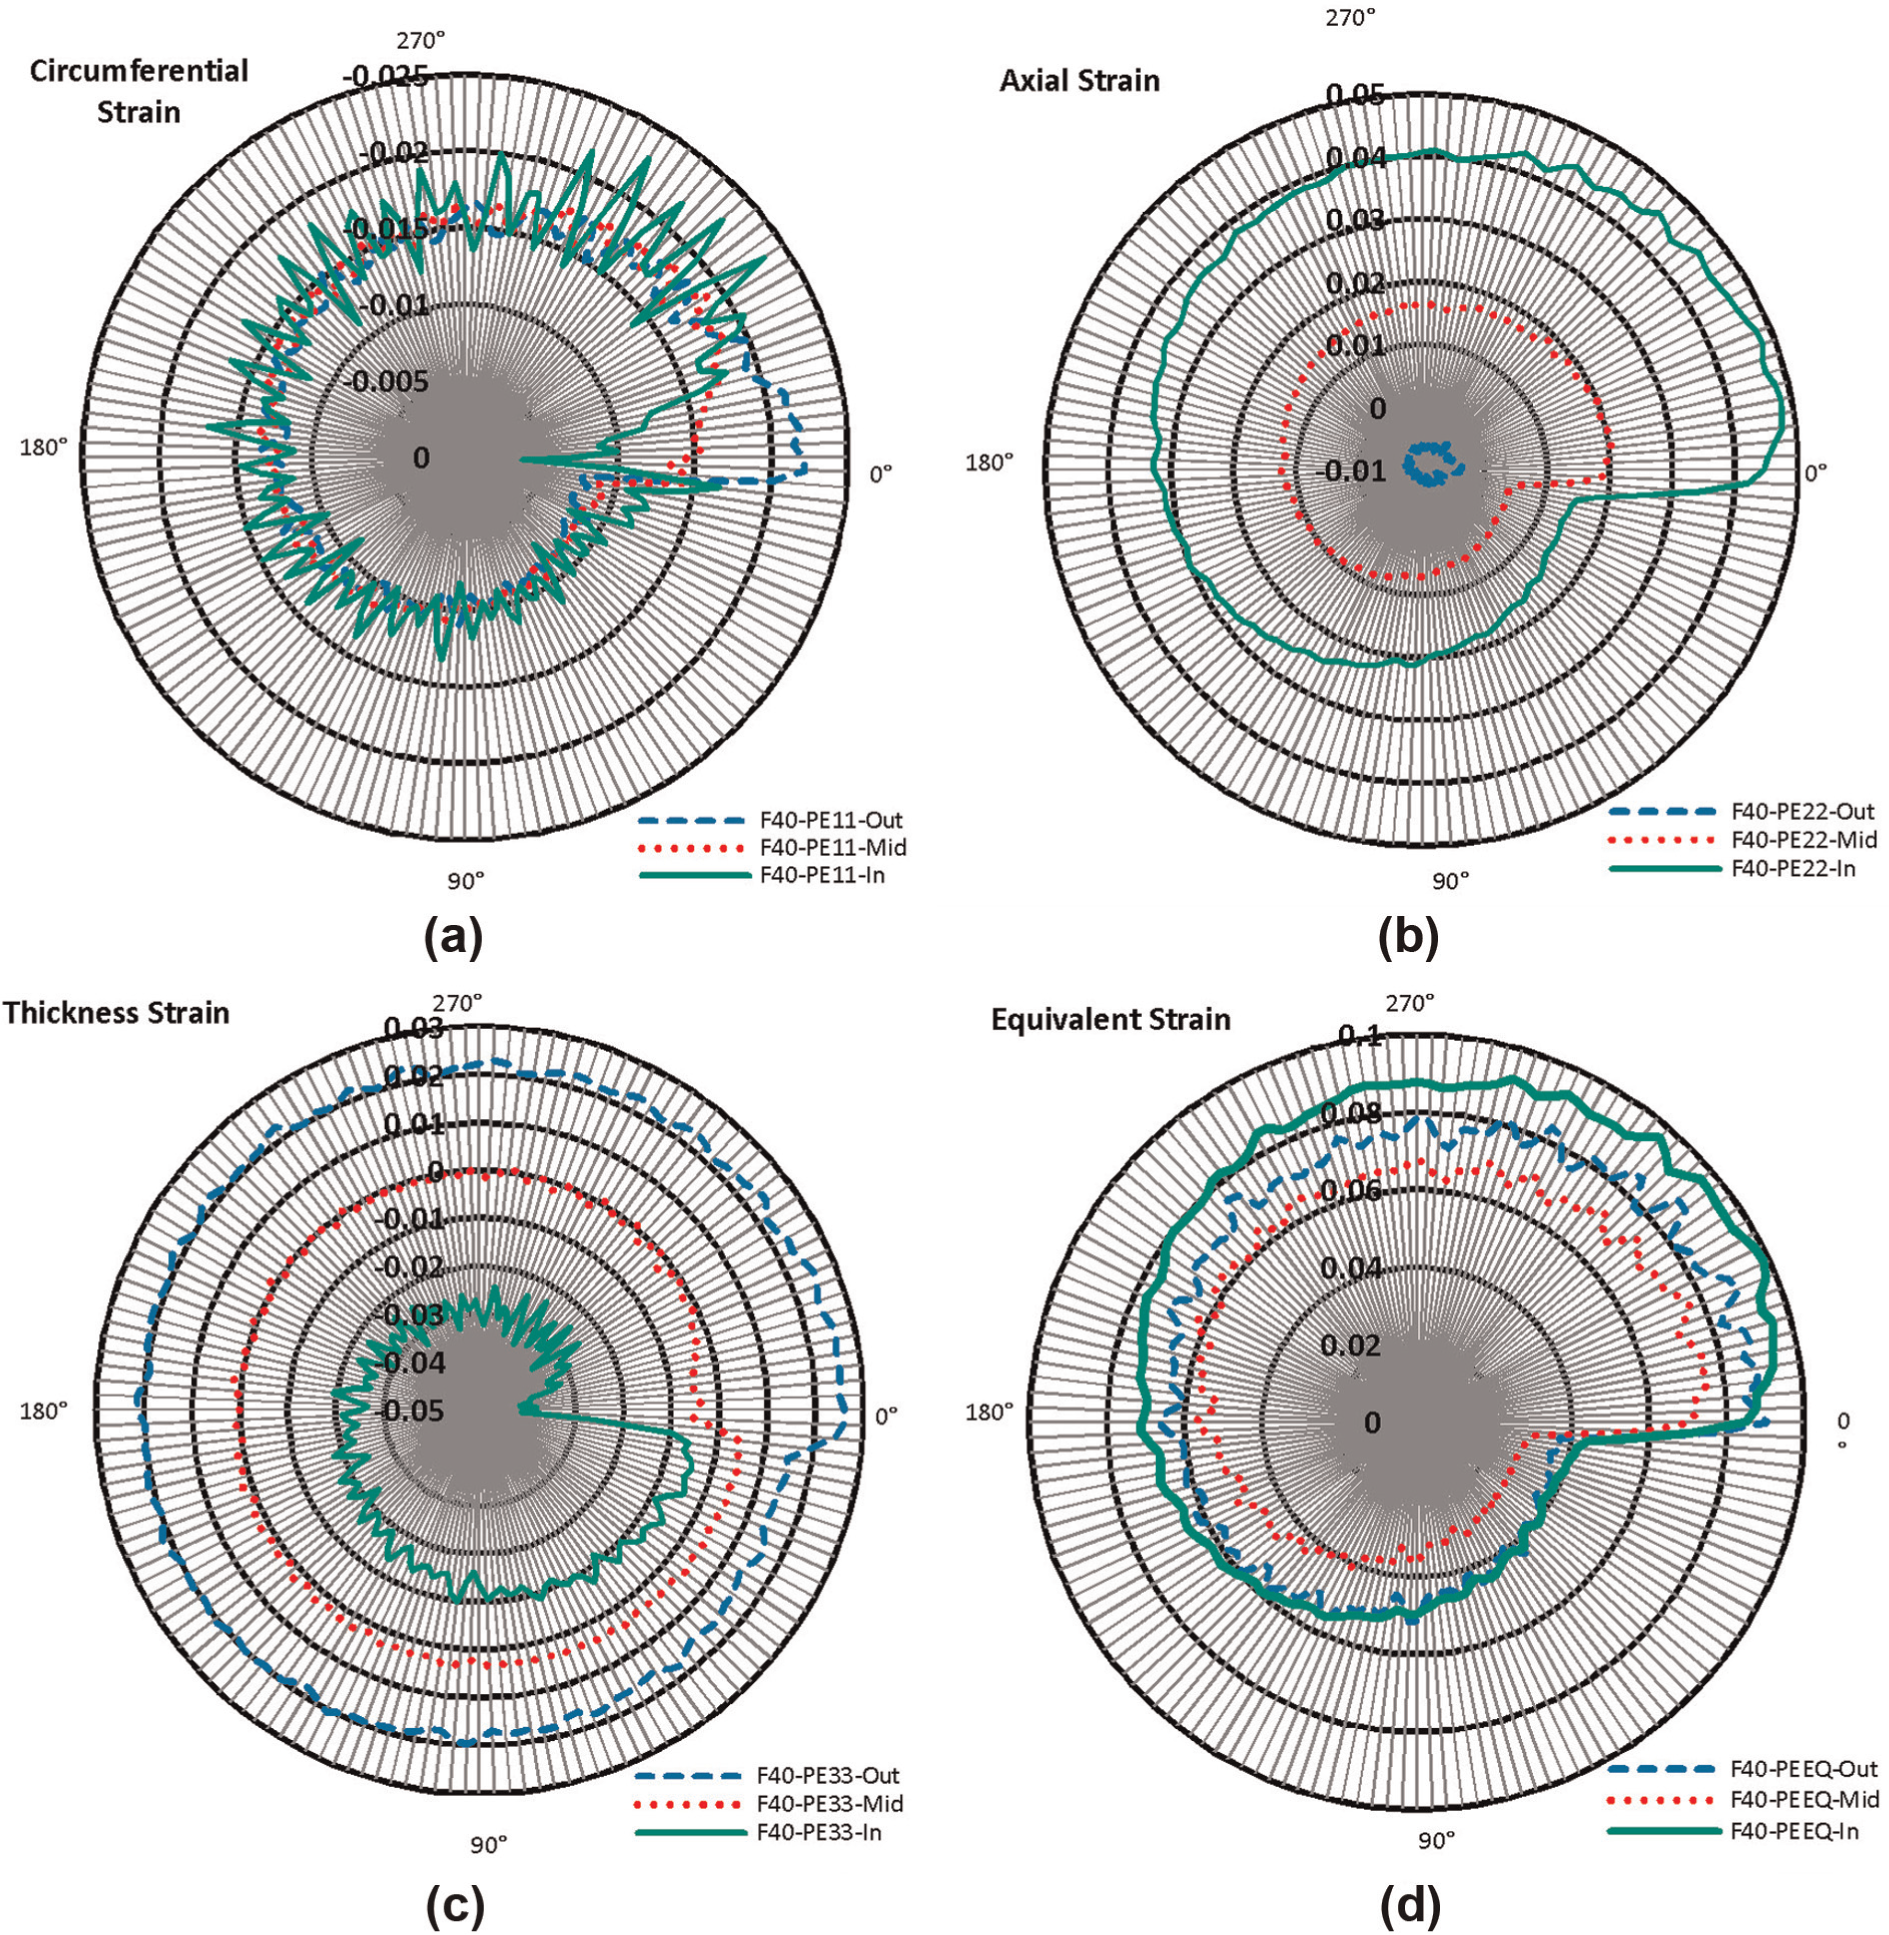
Distribution of plastic strain during the process in circumference: (a) circumferential strain, (b) axial strain, (c) thickness strain, and (d) equivalent strain.
Circumferential strain is depicted in Figure 9(a). The fluctuation is due to the discrete nature of FE. The slight negative values of the strain, even ahead of the roller, represent the general diameter reduction of the tube, remembering that 20% of the process is completed.
Figure 9(b) shows the distribution of axial strain at the contact position. The axial strain is negative in the outer layer, regardless of the angular position. In the inner and middle layers, the value of axial strain at the current roller contact position (0°) is less than twice more than the strain at the opposite side (180°).This is unlike the strain distribution in flow forming presented by Hayama and Kudo, 20 Parsa et al., 21 and Kemin et al. 22 The reason is the basic difference between flow forming and tube necking, where in the case of flow forming, the presence of mandrel as an obstacle inside the tube makes the material pile up in front of the roller; therefore, the axial strain in the contact zone would gain negative values.
Figure 9(c) depicts the distribution of thickness strain around the tube. The middle layer, except for position 0°, has a very small value of strain. However, in about 90° ahead of the current roller contact point (0°–90°), the thickness strain in the middle layer is positive. The inner and outer layers all around the tube possess negative and positive values, respectively. While it is already known that the thickness along the tube increases toward the free end of the tube (Figure 5), and its value is nearly constant around the tube at the same axial position, Figures 8(c) and 9(c) show that during the process, the thickness strain is not uniform in thickness.
In Figure 9(d), it is seen that the amount of plastic strain all around the tube in the inner layer is higher than the outer and middle layers. Considering the dependency of the dynamic recrystallization to the value of the equivalent strain at peak stress, 14 it is expected that the microstructure varies significantly in thickness. However, in this case, the strain value is less than the critical amount. 14
Distribution of the stress components
Strain values depicted in Figure 7 have an accumulative nature, that is, the amount of strains in each position is an accumulative value beginning from the start of the process to the current instant. To deeply investigate the deformation at each instant and to obtain a point of view about the effect of roller contact, it is of benefit to study the distribution of the stress components.
Figure 10(a) and (b) depicts the distribution of the circumferential (hoop) stress during the process where 20% of the forming time and roller travel in first pass has passed. In Figure 10(a), it is seen that the outer layer of the tube in the contact zone possesses negative (compression) values of circumferential stress. The distribution also resembles that of conventional spinning presented in a research conducted by Wang et al. 23 The compressive stress zone gains a bigger width moving from the contact zone toward both ends of the tube. In this regard, there is a distinguishable resemblance to the results that Bai et al. 24 reported regarding shear spinning of parts with inner hoop ribs. However, expectedly, the values of compressive stress decrease as the axial distance from the contact zone increases. The other apparent pattern is that although a fair symmetry is distinguishable, the axis of symmetry is not exactly on the axis of the tube (where the roller is in contact with the tube). In fact, the symmetry axis is located below the tube axis (ahead of the roller). The maximum compressive stress also occurs on the symmetry axis, in front of the roller contact zone. The distribution pattern of the circumferential stress on tube surface is also generally similar to that of flow forming reported by Hua et al. 25 with regard to existence of a fairly wide area with compressive stress that extended along the tube axis.
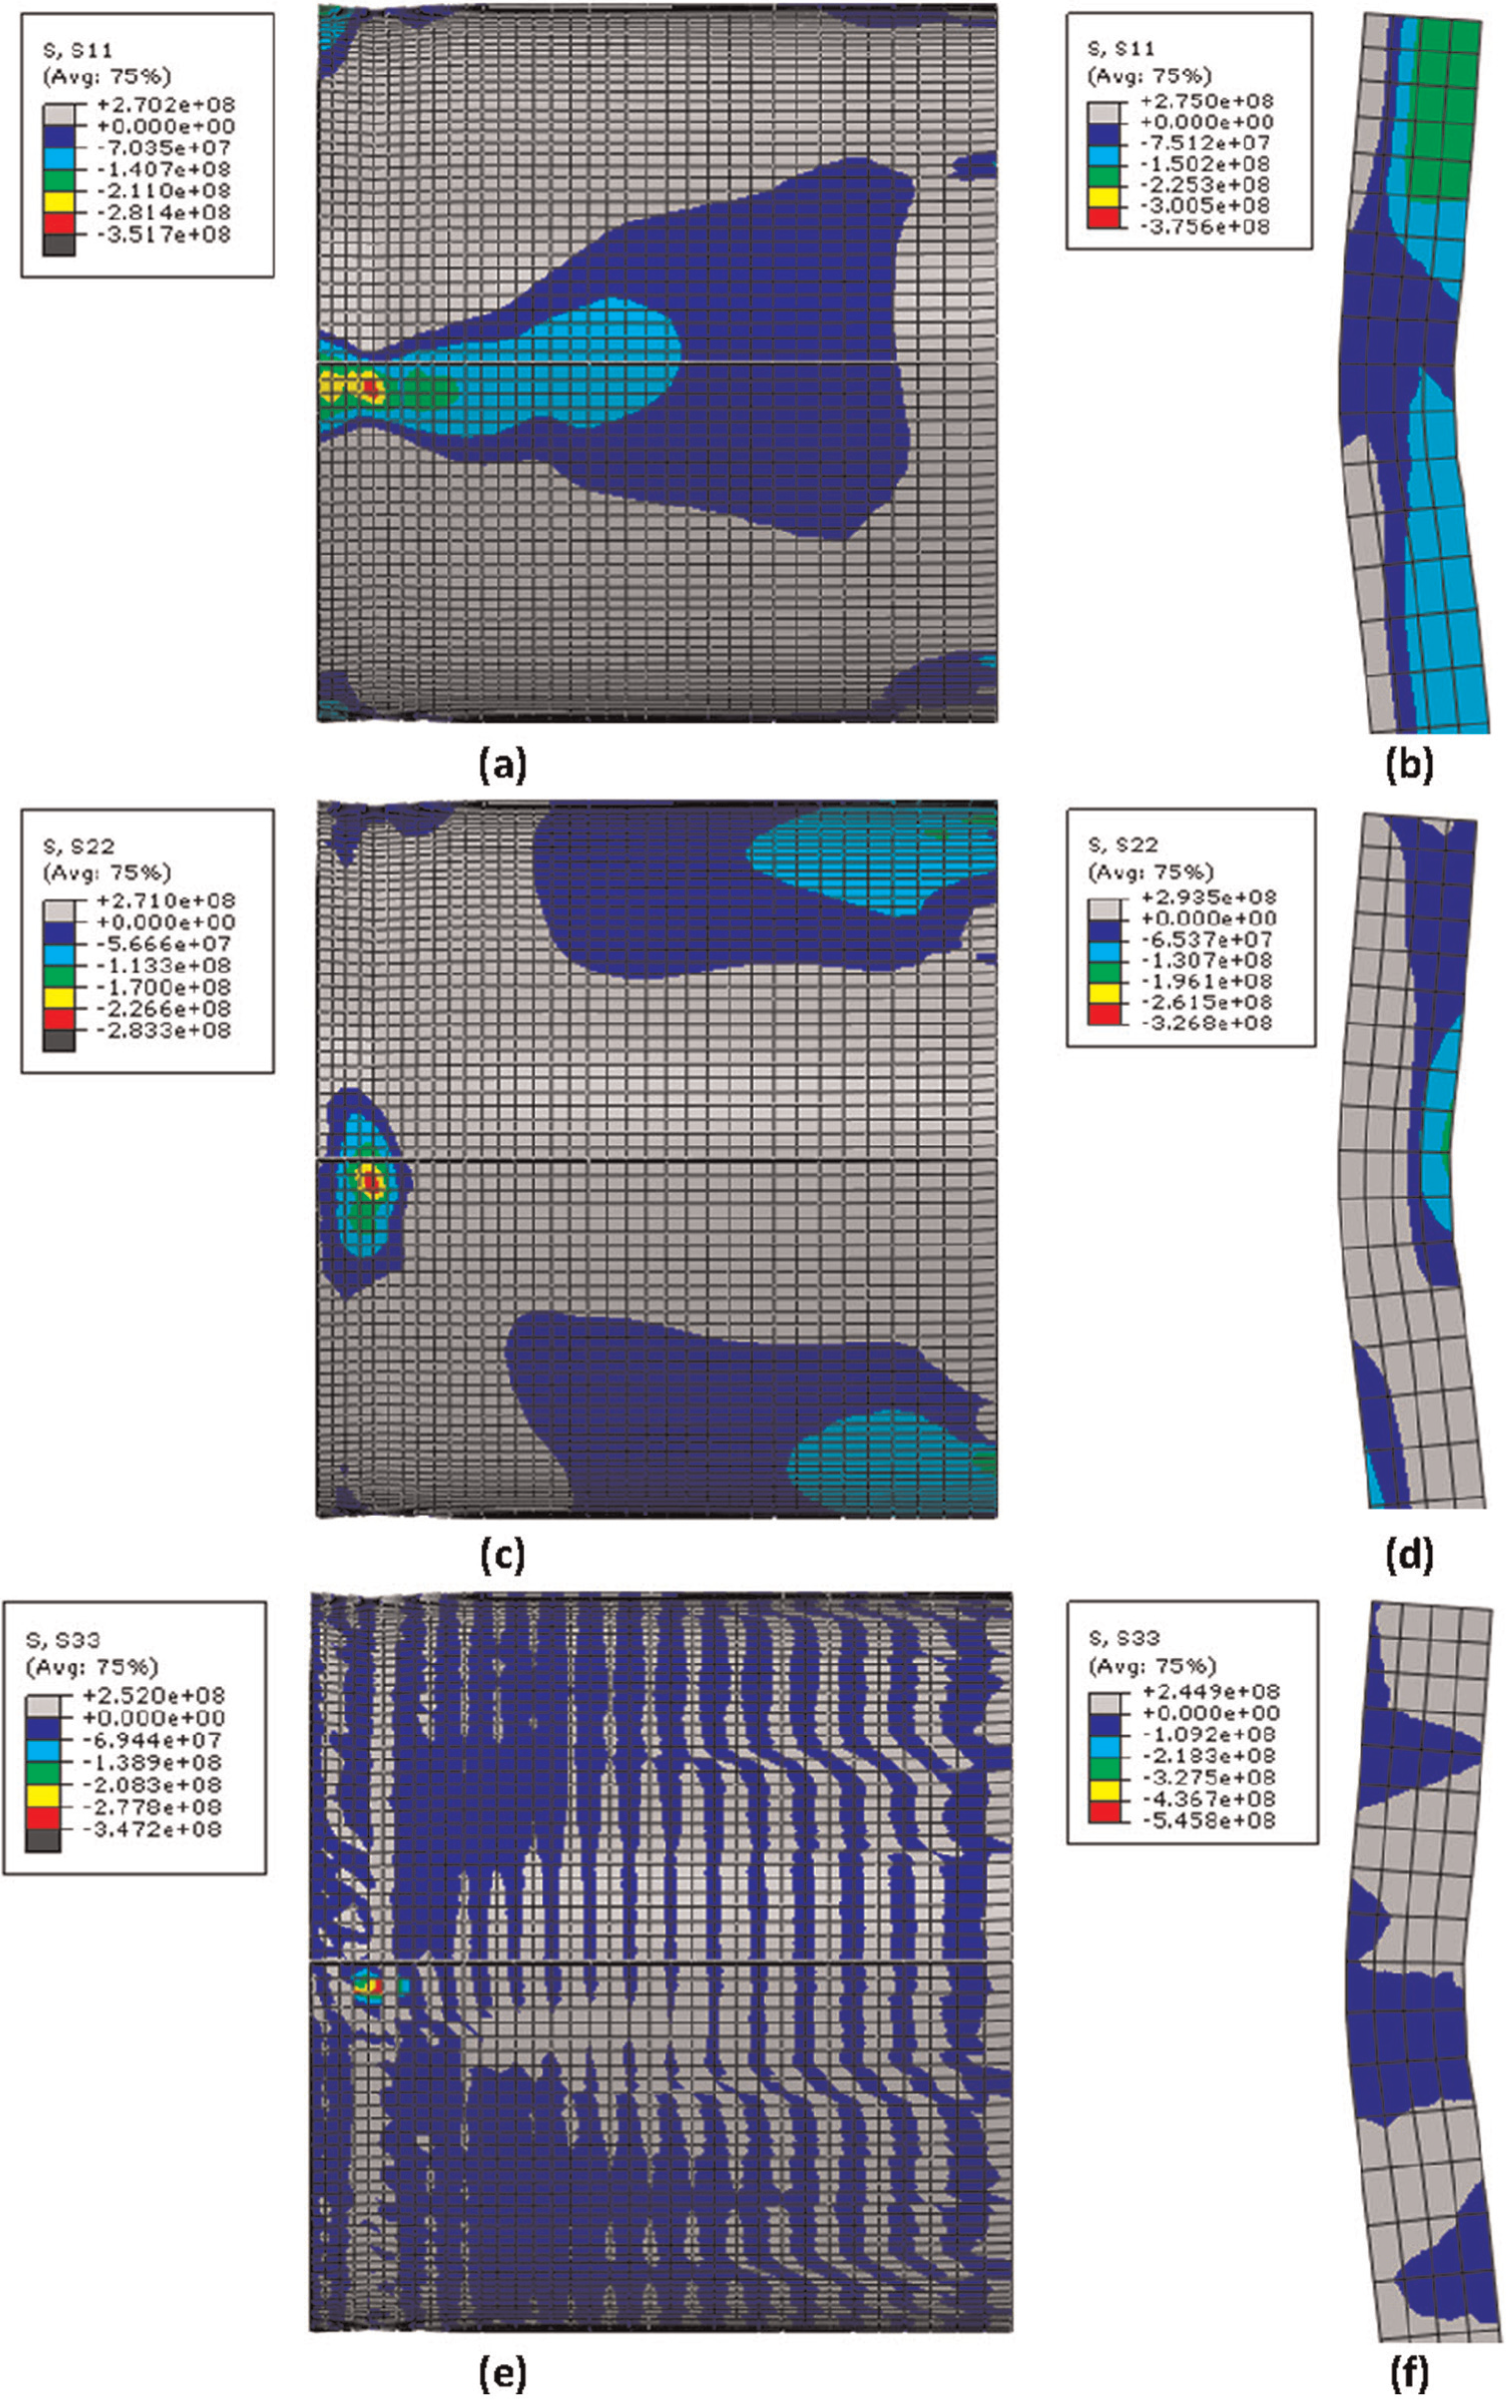
Distribution of stress during the process: (a) circumferential stress on tube surface, (b) circumferential stress at axial section of the contact zone, (c) axial stress on tube surface, (d) axial stress at axial section of the contact zone, (e) thickness stress on tube surface, and (f) thickness stress at axial section of the contact zone.
Figure 10(c) and (d) depicts the distribution of axial stress on the outer layer of the tube and in an axial section in thickness of the tube in contact area, respectively. It is seen in Figure 10(a) that the outer layer in contact area undergoes negative (compressive) axial stress, which again is for penetrating the roller in contact location creating an inward curve on the outer layer. It is also observed that the maximum stress is under the axis of the roller and below contact zone. In Figure 10(d), it is also seen that the distribution of the axial stress in thickness is in accordance with axial strain as shown in Figure 7(d), that is, compressive stress at the outer layer and tensile stress in the inner layer.
Figure 10(e) and (f) shows the distribution of the thickness stress (normal to the layer). In Figure 10(e), it is seen that the thickness stress is negative (compressive) at the outer layer of the tube at contact area with its maximum below the axis of the tube. Observing this picture, it should be noted that the amount of stress at gray areas and blue areas is small and in the elastic zone. It is expected that the normal stress mostly appears in the contact zone, and all the other areas are stress-free (or have small amounts of stress). From this point of view, the necking process is similar to (power) shear spinning as reported by Bai et al. 24 and flow forming as reported by Hua et al. 25 The distribution of the thickness stress is shown in Figure 10(f) in an axial section. Under the roller contact area, stress is of compressive nature. This is in contradiction with the distribution of thickness strain depicted in Figure 7(f). The reason for the stress being compressive is the direct pressure of the roller in this area. Successively, positive and negative normal stress zones are located in axial direction ahead and behind the contact area.
Figure 11 shows the distribution of stress components along the tube passing the current roller contact zone (20% of the process completed) in three thickness layers.
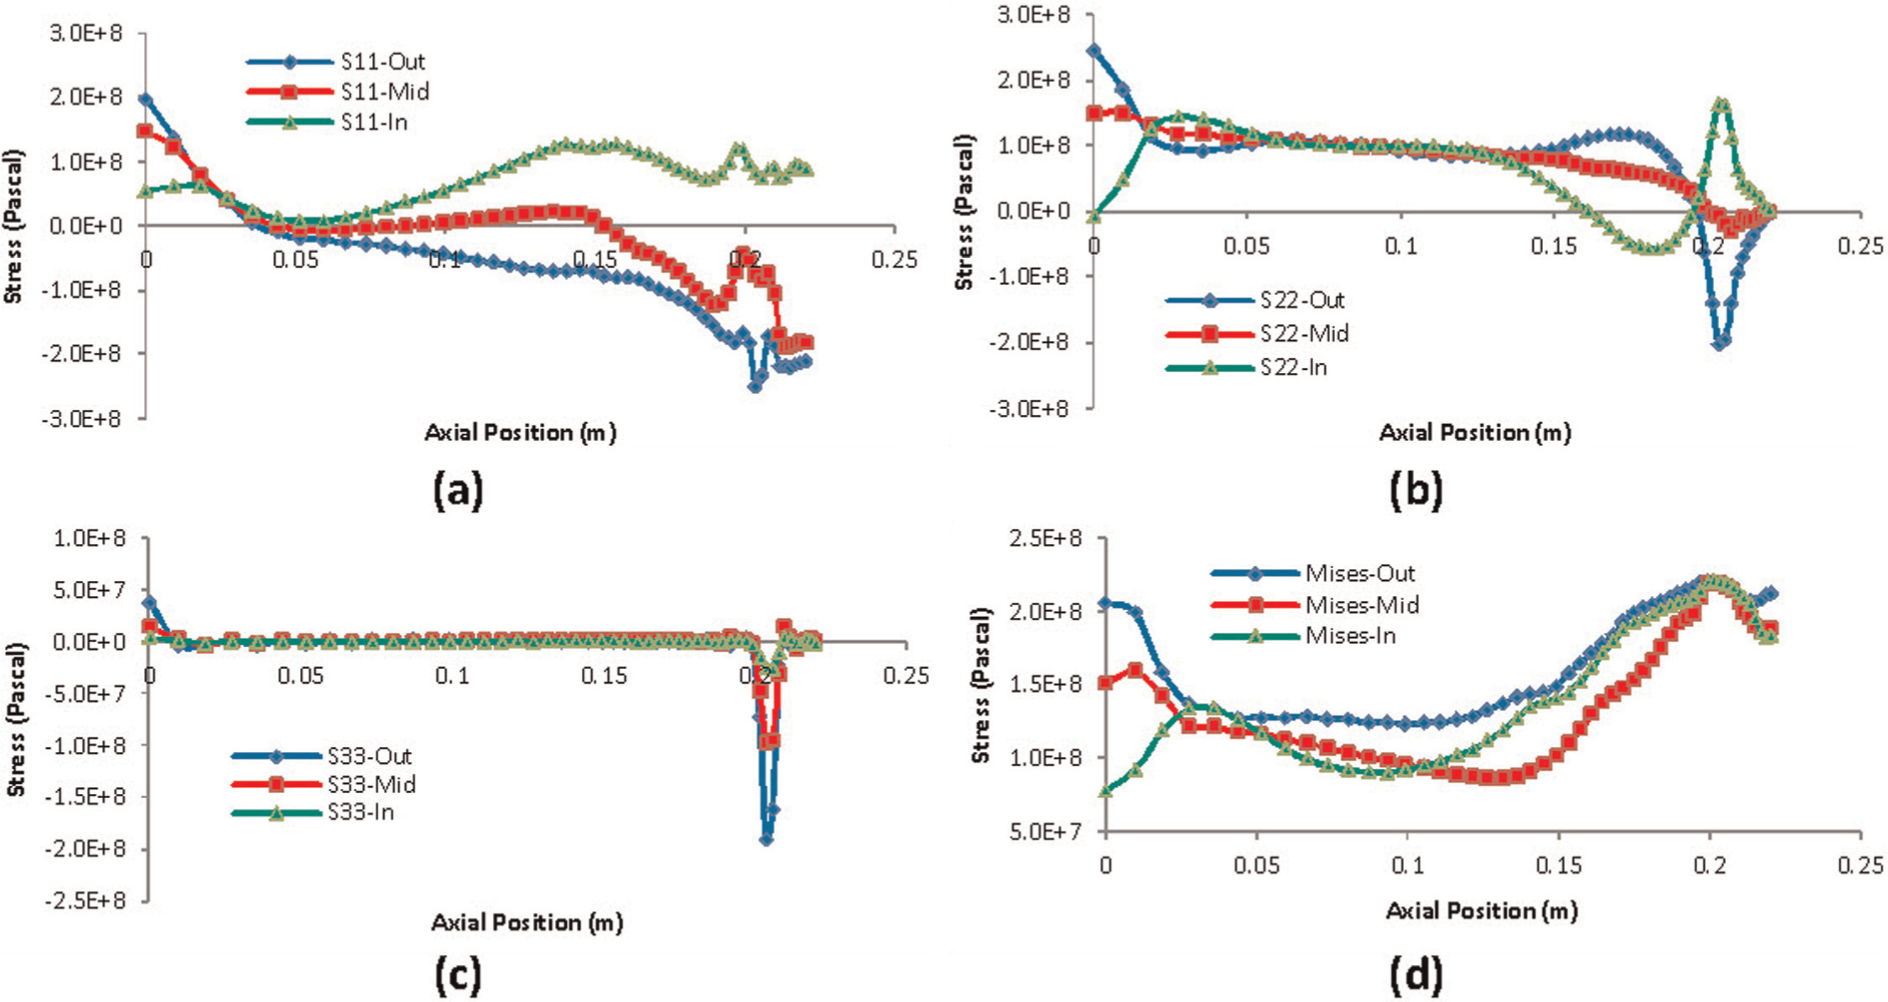
Distribution of stress along the tube axis: (a) circumferential stress, (b) axial stress, (c) thickness stress, and (d) equivalent stress.
Figure 11(a) shows the variation of circumferential stress along the axis. The outer layer represents a compressive stress increasing in value toward the contact position, while the inner layer stress distribution is of completely different trends. In fact, the inner layer stress is of tensile type and increasing toward the contact zone. Axial stress depicted in Figure 11(b) is positive, nearly constant, and equal in all layers in about 60% of the length. Near the contact zone, the stress at the outer layer increases and then rapidly drops down to negative values at the contact zone, while the inner layer stress decreases before the contact zone to negative amounts and then rapidly increases to its maximum at the contact zone. It is interesting to observe the middle layer stress to decrease to its minimum (about zero) at the contact zone. At the contact zone, axial stress distribution implies the bending at the curve of roller nose. The amount of stress at the outer layer is about −200 MPa, while that of the inner layer is approximately 160 MPa and the middle layer stress (neutral axis) is about 0.
As discussed in Figure 10(e), it is also seen in Figure 11(c) that thickness stress (in all layers) is localized in the roller contact zone.
However, despite the differences between the distribution of circumferential and axial stress components, it is observed in Figure 11(d) that the distributions of Von Mises stress in all layers follow similar patterns reaching its maximum at the contact zone. The pattern is also similar to the results of Wang and Long 26 in simulation of conventional metal spinning.
Figure 12 shows the distribution of stress components on the circular path around the tube, passing from the contact zone. The position 0° is the current roller contact zone, and the tube rotates counter-clockwise.
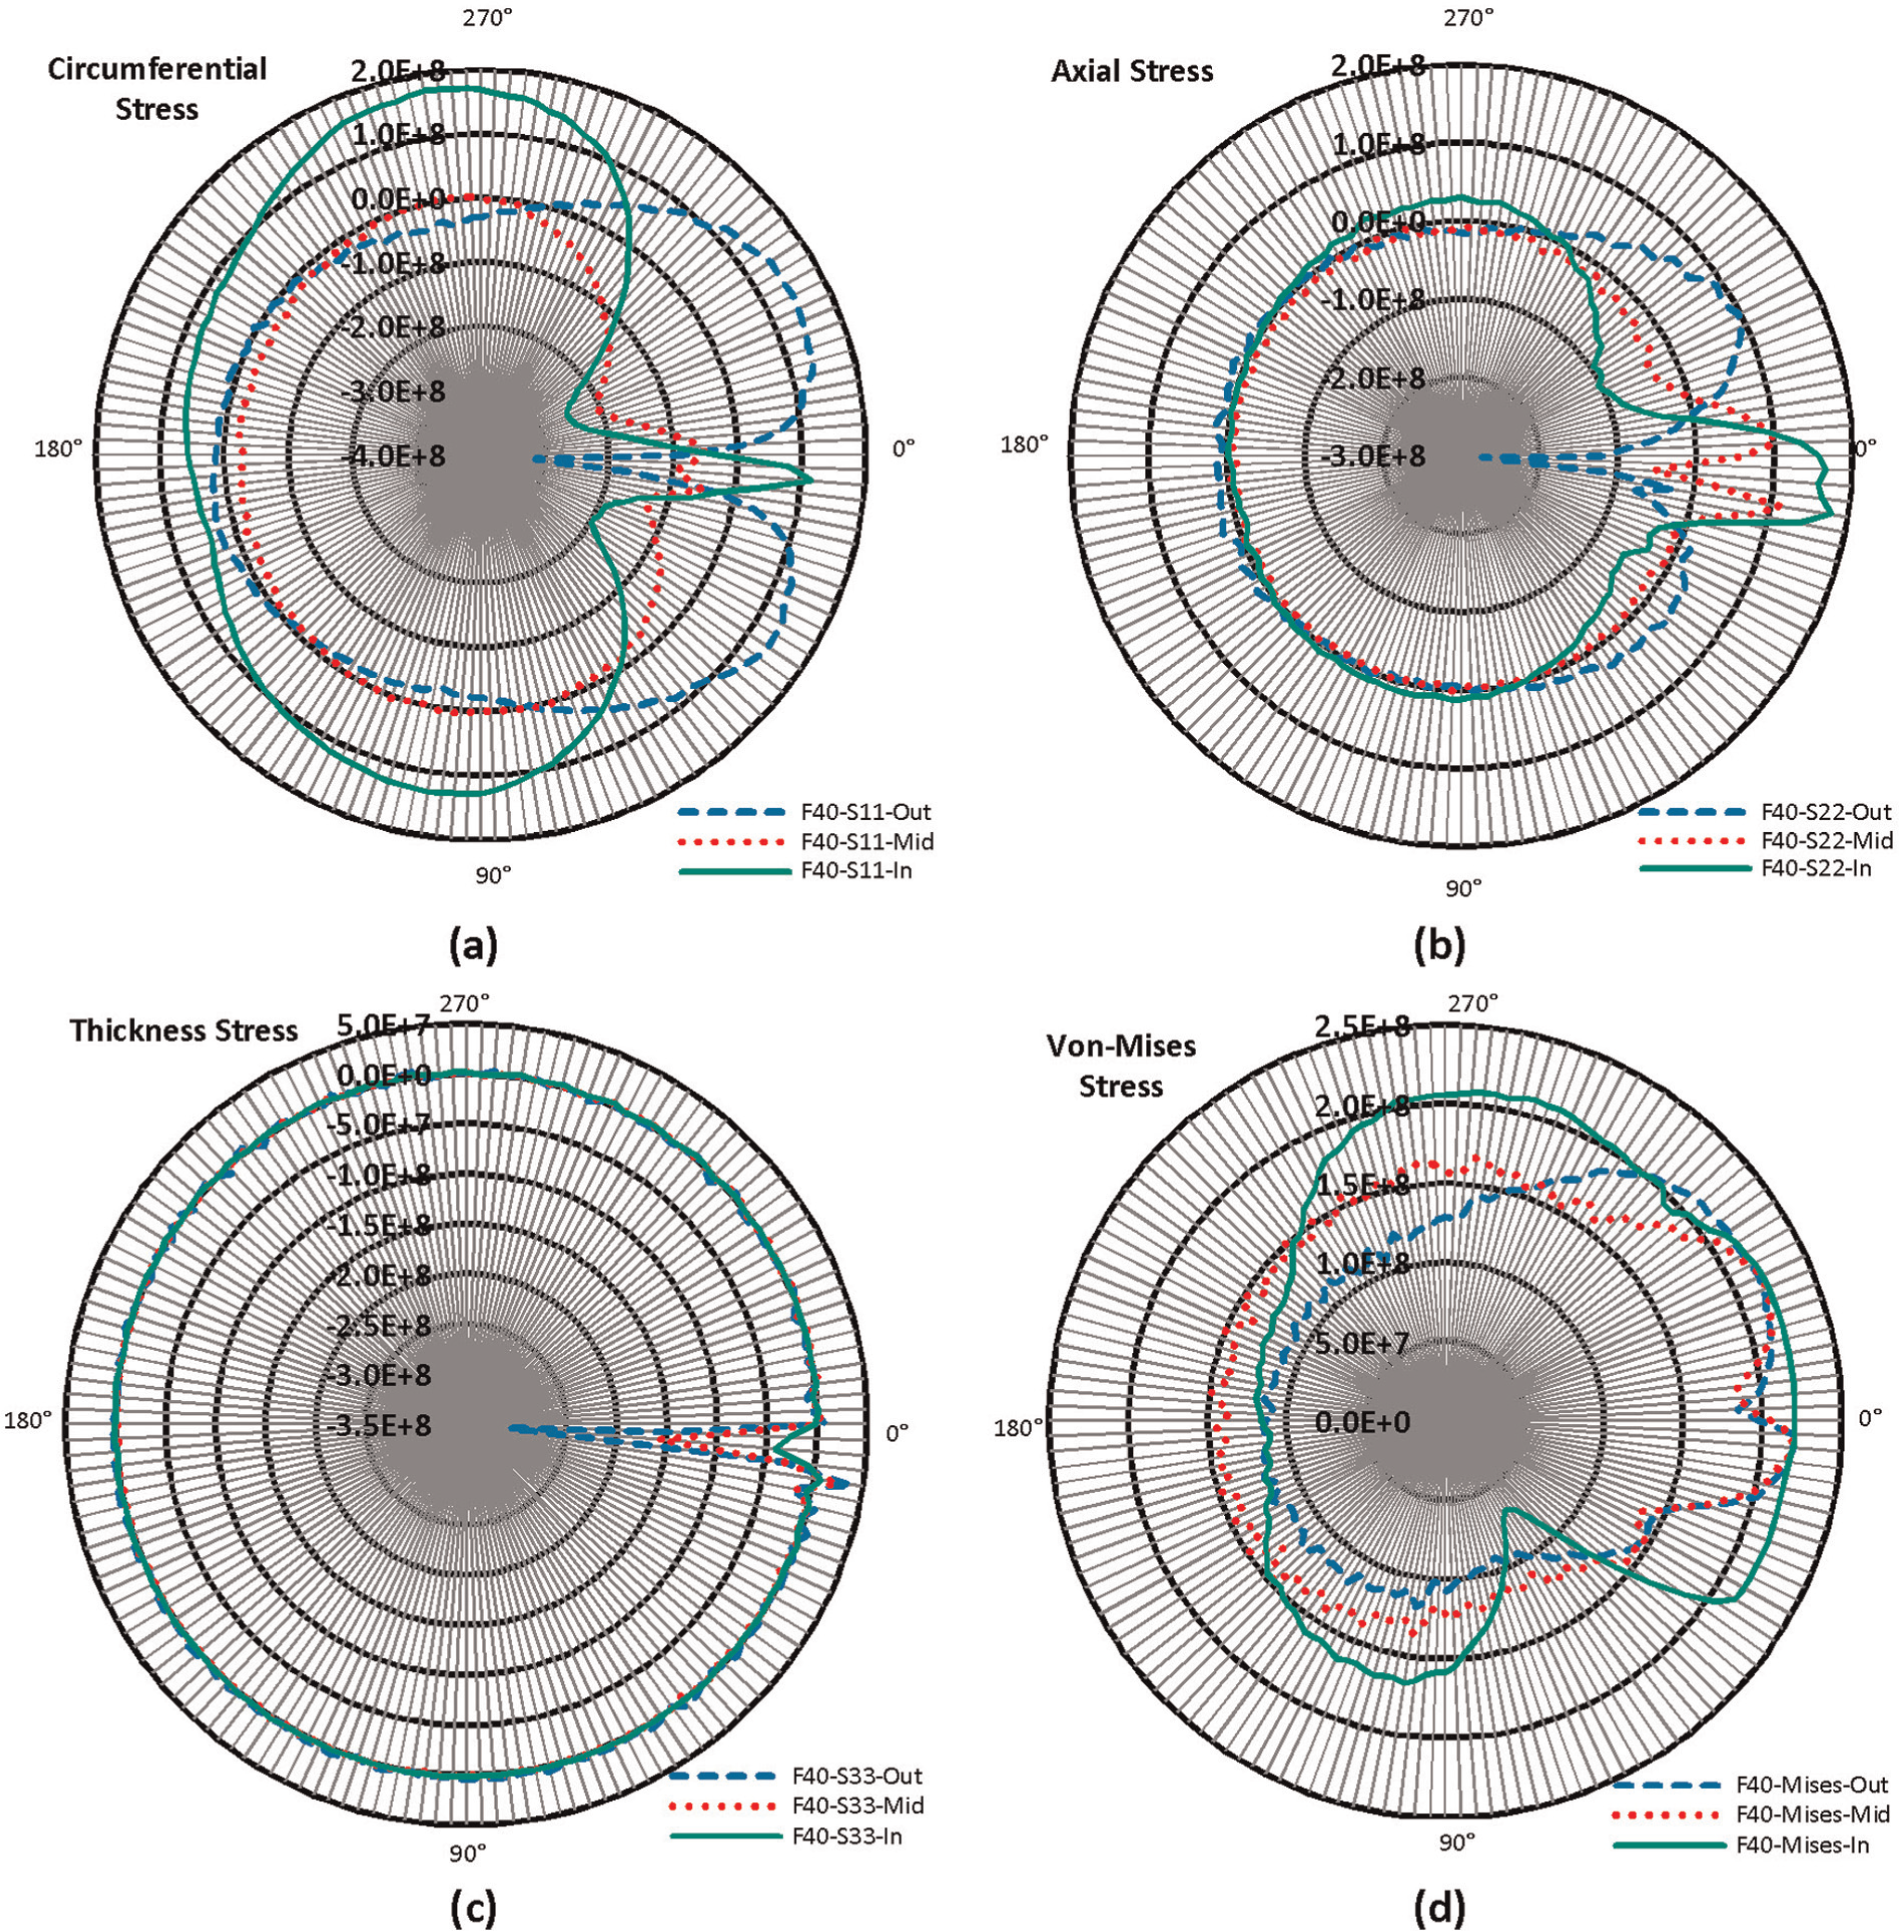
Distribution of stress during the process in circumference: (a) circumferential stress, (b) axial stress, (c) thickness stress, and (d) equivalent stress.
In Figure 12(a), the distribution of circumferential stress is depicted in three layers. The outer layer stress gains its positive maximum right above and below the contact zone. On the opposite side of the tube, the outer layer stress is negligible. Under the roller, the circumferential stress has a maximum negative value as a result of inward bend (with bend axis parallel to tube axis). The same phenomenon makes the inner layer stress positive at the contact zone. Above and below the contact zones, the inner layer gains its maximum negative stress. It is interesting that the maximum positive stress of the inner layer occurs at positions 90° and 270°, that is, at 90° angular distance from the contact zone. The middle layer stress is negligible except for the zones around the contact zone.
Figure 12(b) represents the axial stress distribution in three layers. The stress values in all layers are negligible except around the contact zone. The outer layer gains its positive maximum value above and below the contact zone; in the contact zone, axial stress has its maximum negative value. The inner layer, on the other hand, has a positive maximum value in bend and negative maximums above and below the contact zone. The axial stress distribution pattern suggests bending formed at the roller nose curve (the bend axis normal to the tube axis). The middle layer axial stress has positive maximum values above and below the contact zone. As in Figure 11(b), at the contact zone, the stress amount decreases to around zero (suggesting the bend neutral axis).
The thickness stress, in all three layers, has negative maximums in the contact zone. This is unlike the thickness strain (Figure 9(c)) where the outer layer has a positive maximum value. Other than the contact zone, the thickness stress is zero around the tube.
Von Mises stress distribution around the contact zone is depicted in Figure 12(d). The amount of stress in the outer and middle layers drops down under the roller (position 0°), and the maximum is above and below the contact zone. The maximum amount of stress is related to the inner layer at the contact zone.
Figure 13 shows the state of the stress around the roller contact zone on the outer layer of the tube. Five different types of stress are diagnosed in eight districts: σ11, σ22, and σ33 represent circumferential, axial, and thickness stress, respectively.
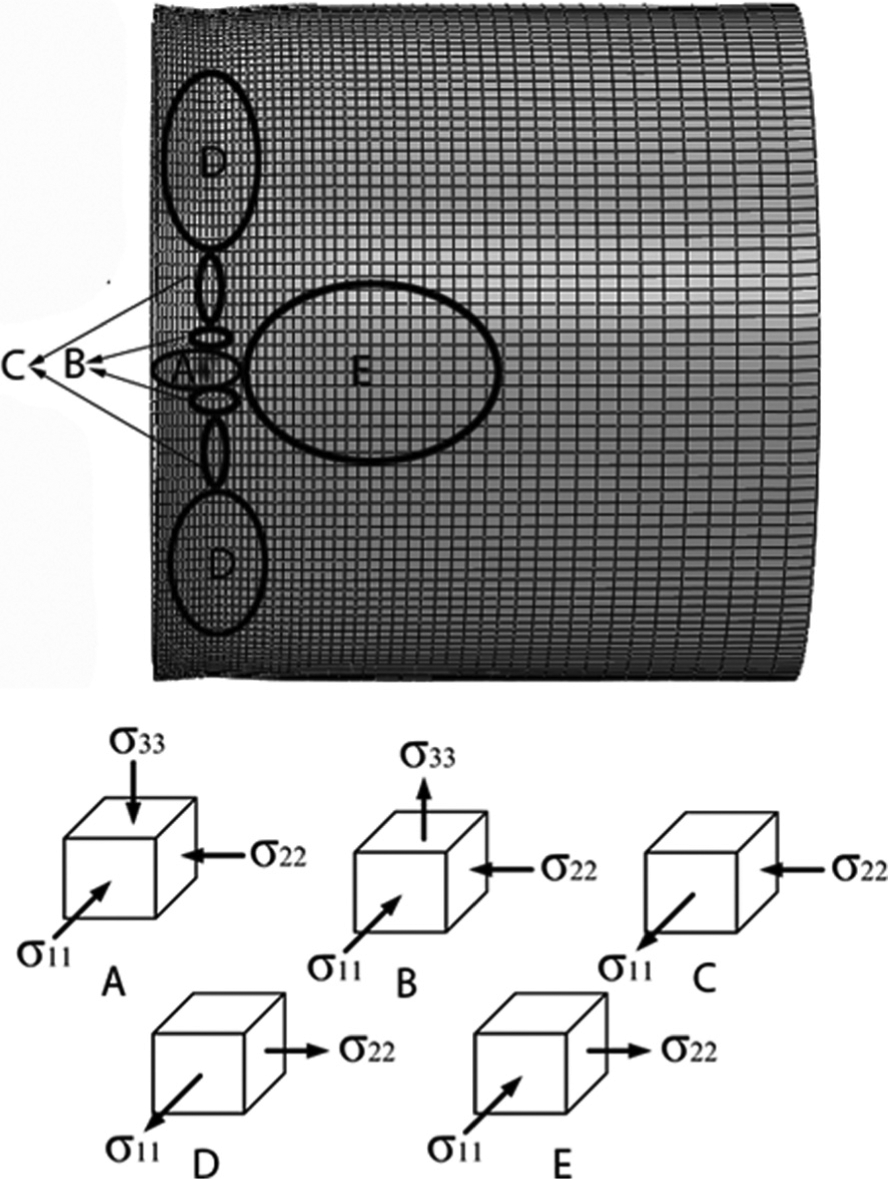
Stress states around the roller contact zone at the outer layer of the tube.
In zone A (under the roller), the state of the stress is seen to be three-dimensional (3D) compression. This is also similar to the state of stress in flow-forming operation presented by Xu et al. 27 This can explain why the amount of equivalent strain in the outer layer is lower than the inner layer in the contact zone (Figures 8(d) and 9(d)). It can also be concluded that ductile failures during the process do not initiate in zone A. Zone B, right above and below zone A, represents compressive stress in circumferential and axial directions and tensile stress at normal to the tube direction. Zone C, further away from zone A in circumferential direction, represents tensile circumferential and compressive axial stress; here, it is not sensible to discuss about the thickness stress because the amount is low and of changing nature in this area. In zone D, the stress is tensile at both circumferential and axial directions. Similar to zone C, thickness stress does not have a constant tensile or compressive behavior. Zone E between the contact area (A) and chuck side represents compressive stress in circumferential direction and tensile in axial direction.
Conclusion
In this article, the temperature variation is checked, in the first spinning pass of dome-forming process, through a coupled thermal–mechanical simulation. It is shown that due to the low process time, temperature variation in time and position is negligible. Therefore, an isothermal FE simulation of the hot tube necking by spinning, with solid elements, is presented, and the state of the strain and stress through thickness and along the tube is studied during the process. The distribution of the stress and strain could be a tool for understanding the deformation in a relatively sophisticated process of tube necking by hot spinning and could be used as a benchmark for analytical approaches to the process as well as investigations of the process defects and optimizations:
The circumferential strain is shown to be of negative value in all thickness layers in the contact zone. The maximum value corresponds to the outer layer in the contact zone. The distribution of negative circumferential strain could be taken into account for investigation of common wrinkling defect of the tube in necking processes. The axial strain is positive in the inner and middle layers, with its maximum in the contact zone, while the outer layer strain is negative in this position. In case of existence of inclusions (like sulfur) in the material, the initiation of circumferential hot cracks and tears is probable in the contact zone. The thickness strain reaches a positive maximum in the outer layer of the contact zone, while the amount of this strain component in the inner and middle layers is negative.
Maximum equivalent plastic strain occurs at the contact zone in the inner and outer layers. The value of equivalent strain is significantly lower in the middle layer. Therefore, the microstructure of the tube (inner and outer) surface would be different from that of its bulk if the limit of dynamic recrystallization happens in these layers.
On the outer thickness layer, there is a region of positive circumferential stress extended along the tube axis passing from the contact zone. The minimum width of this region lies in the contact zone.
Maximum value of the circumferential stress occurs in the inner thickness layer, at 90° offset from the contact position in both directions around the tube.
The axial stress below and above the roller contact zone gains its maximum positive value in the inner layer. Axial stress at the contact zone in the outer layer has a negative maximum in the contact zone.
The contact position, in the outer layer, is under 3D compressive stress state, making it immune for ductile failure; however, care should be taken regarding the neighboring regions.
The thickness stress all around the tube and along the tube axis is negligible except for the contact zone. The maximum negative stress occurs in the outer layer at the contact zone.
Footnotes
Acknowledgements
The authors wish to thank Dr M. Ahmadi from Non-Destructive Testing Laboratory of Department of Mechanical Engineering (Amirkabir University of Technology) for providing thickness measurement facilities and Mr Abolfazl Moulayinejad and Majid Izadi from “Middle East Machinery Co.” for providing facilities and technical support for hot spinning experiment.
Funding
This research received no specific grant from any funding agency in the public, commercial, or not-for-profit sectors.