
Abstract
Background
Chronic stress is a highly prevalent condition that may stem from different sources and can substantially impact physiology and behavior, potentially leading to impaired mental and physical health. Multiple physiological and behavioral lifestyle features can now be recorded unobtrusively in daily-life using wearable sensors. The aim of the current study was to identify a distinct set of physiological and behavioral lifestyle features that are associated with elevated levels of chronic stress across different stress sources.
Methods
For that, 140 healthy female participants completed the Trier inventory for chronic stress (TICS) before wearing the Fitbit Charge3 sensor for seven consecutive days while maintaining their daily routine. Physiological and lifestyle features that were extracted from sensor data, alongside demographic features, were used to predict high versus low chronic stress with support vector machine classifiers, applying out-of-sample model testing.
Results
The model achieved 79% classification accuracy for chronic stress from a social tension source. A mixture of physiological (resting heart-rate, heart-rate circadian characteristics), lifestyle (steps count, sleep onset and sleep regularity) and non-sensor demographic features (smoking status) contributed to this classification.
Conclusion
As wearable technologies continue to rapidly evolve, integration of daily-life indicators could improve our understanding of chronic stress and its impact of physiology and behavior.
Keywords
Introduction
Chronic stress has been conceptualized as a process in which external or internal demands (stressors) exceed personal resources for a prolonged period of time. 1 Accordingly, the experience of chronic stress depends on the interaction between the type and magnitude of demands and individual differences in coping mechanisms. 2 In the face of demands-resource imbalance, a complex physiological response is set in motion in order to maintain healthy functioning, a process that is called “Allostasis”. 3 The term “Allostatic Load” (AL) refers to the costs of repeatedly activating these physiological stress systems in response of chronic excessive demands. 1 This over-activation may be manifested as constant heightened stress indicator levels, such as elevated heart rate among chronically stressed individuals, 4 but may also be manifested as hypo-reactivity such as blunted cortisol response to acute stress among stress-related psychopathological populations. 5 AL and chronic stress have been repeatedly associated with poor physical and mental health outcomes including cardiovascular diseases and depression.6–11 Importantly, chronic stress can stem from different sources such as professional or work-related, 12 socio-economic status 13 or social factors, 14 and these different sources may lead to differential outcomes.15–18 For example, interpersonal (intimate relationship, close friendships, social life, family relationships) but not non-interpersonal (academic, work, financial, health related) chronic stress was found to prospectively predict the onset 19 and recurrence 16 of major depression in emerging adults. An opposite pattern was found among daughters of depressed mothers, such that chronic non-interpersonal stress, but not other forms of chronic stress, predicted the development of a psychiatric disorder at 30-month follow-up assessment. 15 Other work suggest that non-interpersonal academic stress may lead to increased depression symptoms among college students.20–22 Overall, different populations may be more sensitive than others to different stress sources, and different chronic stress sources may carry diverse mental and physical sequels.
Typically, AL is assessed as a composite score of 10 peripheral biomarkers including urinary cortisol, inflammatory cytokines, serum cholesterol, hemoglobin levels and blood pressure. 23 These indicators were shown to reliably account for subjective chronic stress levels.24,25 For example, in a population representative sample of 1421 healthy adults, a short version of the AL index was positively correlated with perceived chronic stress and this relationship was stronger among women than among men. 25 In another study, work-related chronic stress was associated with AL index more strongly in men compared to women. 26 While very reliable, AL peripheral measures are highly intrusive and entail substantial burden to participants. Also, these measures require extensive laboratory work and cannot be assessed in real-time. In recent years, the emergence of wearable sensors has provided a path to overcome some of these challenges by enabling passive collection of physiological data in real-time and without interruption to daily-life.27–30 Recent studies demonstrated the potential of using physiological features that were extracted from wearable sensors to predict subjective stress levels and stress resilience.28,29,31 For instance, a machine learning algorithm predicted next-day stress levels in a group of 104 college students with an accuracy of 81.5% using wearable sensor data on skin conductance and body temperature alongside data collected from surveys, smartphone logs, and daily weather. 32 Similarly, a machine learning algorithm that used wearable sensor data on skin conductance and body temperature was able to classify participants into high versus low stress groups with 78.3% accuracy in a sample of 201 healthy participants. 33 Among physicians, wearable sensor data on heart rate (HR) and sleep patterns during the stressful period of internship was used to differentiate stress resilient from stress susceptible individuals. 28 Finally, in a large cohort study of more than 600 posttraumatic stress disorder (PTSD) patients, PTSD severity, sleep disturbances and chronic pain were predicted with 73–79% accuracy using sensor measures of HR circadian rhythms, heart rate variability (HRV) and emergency department survey data. 34
In addition to physiological features, wearable sensors provide valuable information on behavioral patterns that may also play an important role in stress perception, particularly chronic stress. To this end, wearable sensors can assess lifestyle habits such as physical activity, sleep and daily routines, all are features that were found to be altered among individuals with elevated levels of chronic stress.35–38 Indeed, previous studies were able to implement data from wearable sensors on lifestyle-related sleep and physical activity in models that predict stress and stress-related psychopathology.28,39 Several demographic features that can be assessed unobtrusively were also found to be tightly related to chronic stress and physiology, particularly body mass index (BMI),38,40,41 age,42,43 smoking44,45 and place of residence.46–48 For example, high levels of chronic stress increased the odds of being a smoker in a large-scale community-sample study (n > 200,000) across countries and continents, 44 whereas nature exposure or density of green space at residency was associated with stress reduction.46–48 These markers are of course not necessarily independent and may interact. For instance, demographic features like age and smoking can substantially impact physiological features such as heart rate and lifestyle features as physical activity.43,45
Despite improved understanding of the relations between chronic stress, physiology and lifestyle habits, it is not yet clear what daily-life features are associated with elevated levels of chronic stress in the general population. Due to the paucity of studies that combined physiological and lifestyle-related features from wearable sensors alongside demographic features, the shared and differential contribution of these feature sets to chronic stress has yet to be thoroughly assessed. Furthermore, while different sources of chronic stress may be characterized by differential impact on physiology or lifestyle, majority of studies thus far investigated chronic stress as a unified phenomenon. Hence whether and what daily-life features are associated with chronic stress from a particular source is unclear. Taken together, the aim of the current study was to identify a distinct set of physiological, lifestyle and demographic features that are associated with elevated levels of chronic stress across different stress sources. For that, 140 healthy female participants wore the Fitbit Charge3, a commercial wearable fitness tracker, for one continuous week while maintaining their daily routine. Prior to that week, participants’ levels of chronic stress across nine different chronic stress sources were assessed using the Trier Inventory for Chronic Stress (TICS). 2 A machine learning algorithm was used in order to accurately classify participants into high versus low in chronic stress across stress sources using physiological and lifestyle features that were extracted from sensor data, as well as non-sensor-related demographic features. For top models, the importance of the contribution of each feature to model performance was assessed, as well as the contribution of only physiological versus only lifestyle versus only demographic features. We hypothesized that a combination of physiological, lifestyle and demographic features will yield models with improved prediction accuracy compared to models that use only one group of features.
Methods
Participants
One hundred and forty (140) healthy female participants were recruited to this study via social media adds. Prior to recruitment, participants completed online screening questionnaire in order to ensure eligibility. Only females were recruited to reduce physiological variability in the sample. Inclusion criteria included age between 18 to 45, female gender and BMI < 30. Exclusion criteria included any current or past cardiovascular, psychiatric or neurological disorder, hypertension, drug abuse, working in night shifts, regular intake of any chronic medicine and pregnancy or lactation in the past year. All participants provided written informed consent approved by the University of Haifa Institutional Review Board (IRB) committee (approval # 032/19 & 429/20). Upon study completion, participants received $100 as compensation for their time.
Procedure
The study involved a laboratory session that was followed by one week of wearable sensor recording in real-life settings. Upon arrival to the laboratory session participants were informed about the sensor and the data that it records. Next, they completed several self-report questionnaires including the TICS. 2 Upon session completion, participants were released with the sensor on their non-dominant hand, and were instructed to passively wear it for seven consecutive days without removing it and without interacting with it, and while maintaining their regular daily routine. One-week later participant returned to the laboratory to return the sensor and receive compensation for their time.
Chronic Stress
The Trier Inventory for Chronic Stress (TICS) is a well-established, well-validated, 57-item self-report questionnaire that measures chronic stress from nine different sources 2 with high reliability (Cronbach's α ranging between.85 to.92). 49 The nine stress sources (sub-scales) include: work overload (“I did not have enough time to complete daily tasks”); social overload (“I wasted a lot of time dealing with other people's problems”); pressure to preform (“I had to work in order not to disappoint others”); work discontent (“my daily tasks were not interesting”); excessive demands at work (“I fulfilled my responsibilities insufficiently, even though I tried my best”); lack of social recognition (“even though I did my very best, my work was not appreciated”); social tension (“I had disagreements with others that lead to tension”); social isolation (“time at which I was isolated from others”) and chronic worries (“times when my worries incapacitated me”). Each sub-scale assesses exposure to stress with reference to the last three months. Each item is scored on a five-level Likert scale that range from 0 to 4. As indicated in the TICS manual, raw scores per sub-scale were transformed to standardized t-scores based on accepted norms. 2 Participants were divided based on a median split of t-scores into high versus low chronic stress separately in each stress source (Table 1). Following common procedure, participants with TICS scores that are close to the median (between the 45th and 55th percentile) were omitted to improve classification. 32
TICS sub-Scale Scores and Demographic Information for the Final Sample (n = 129).
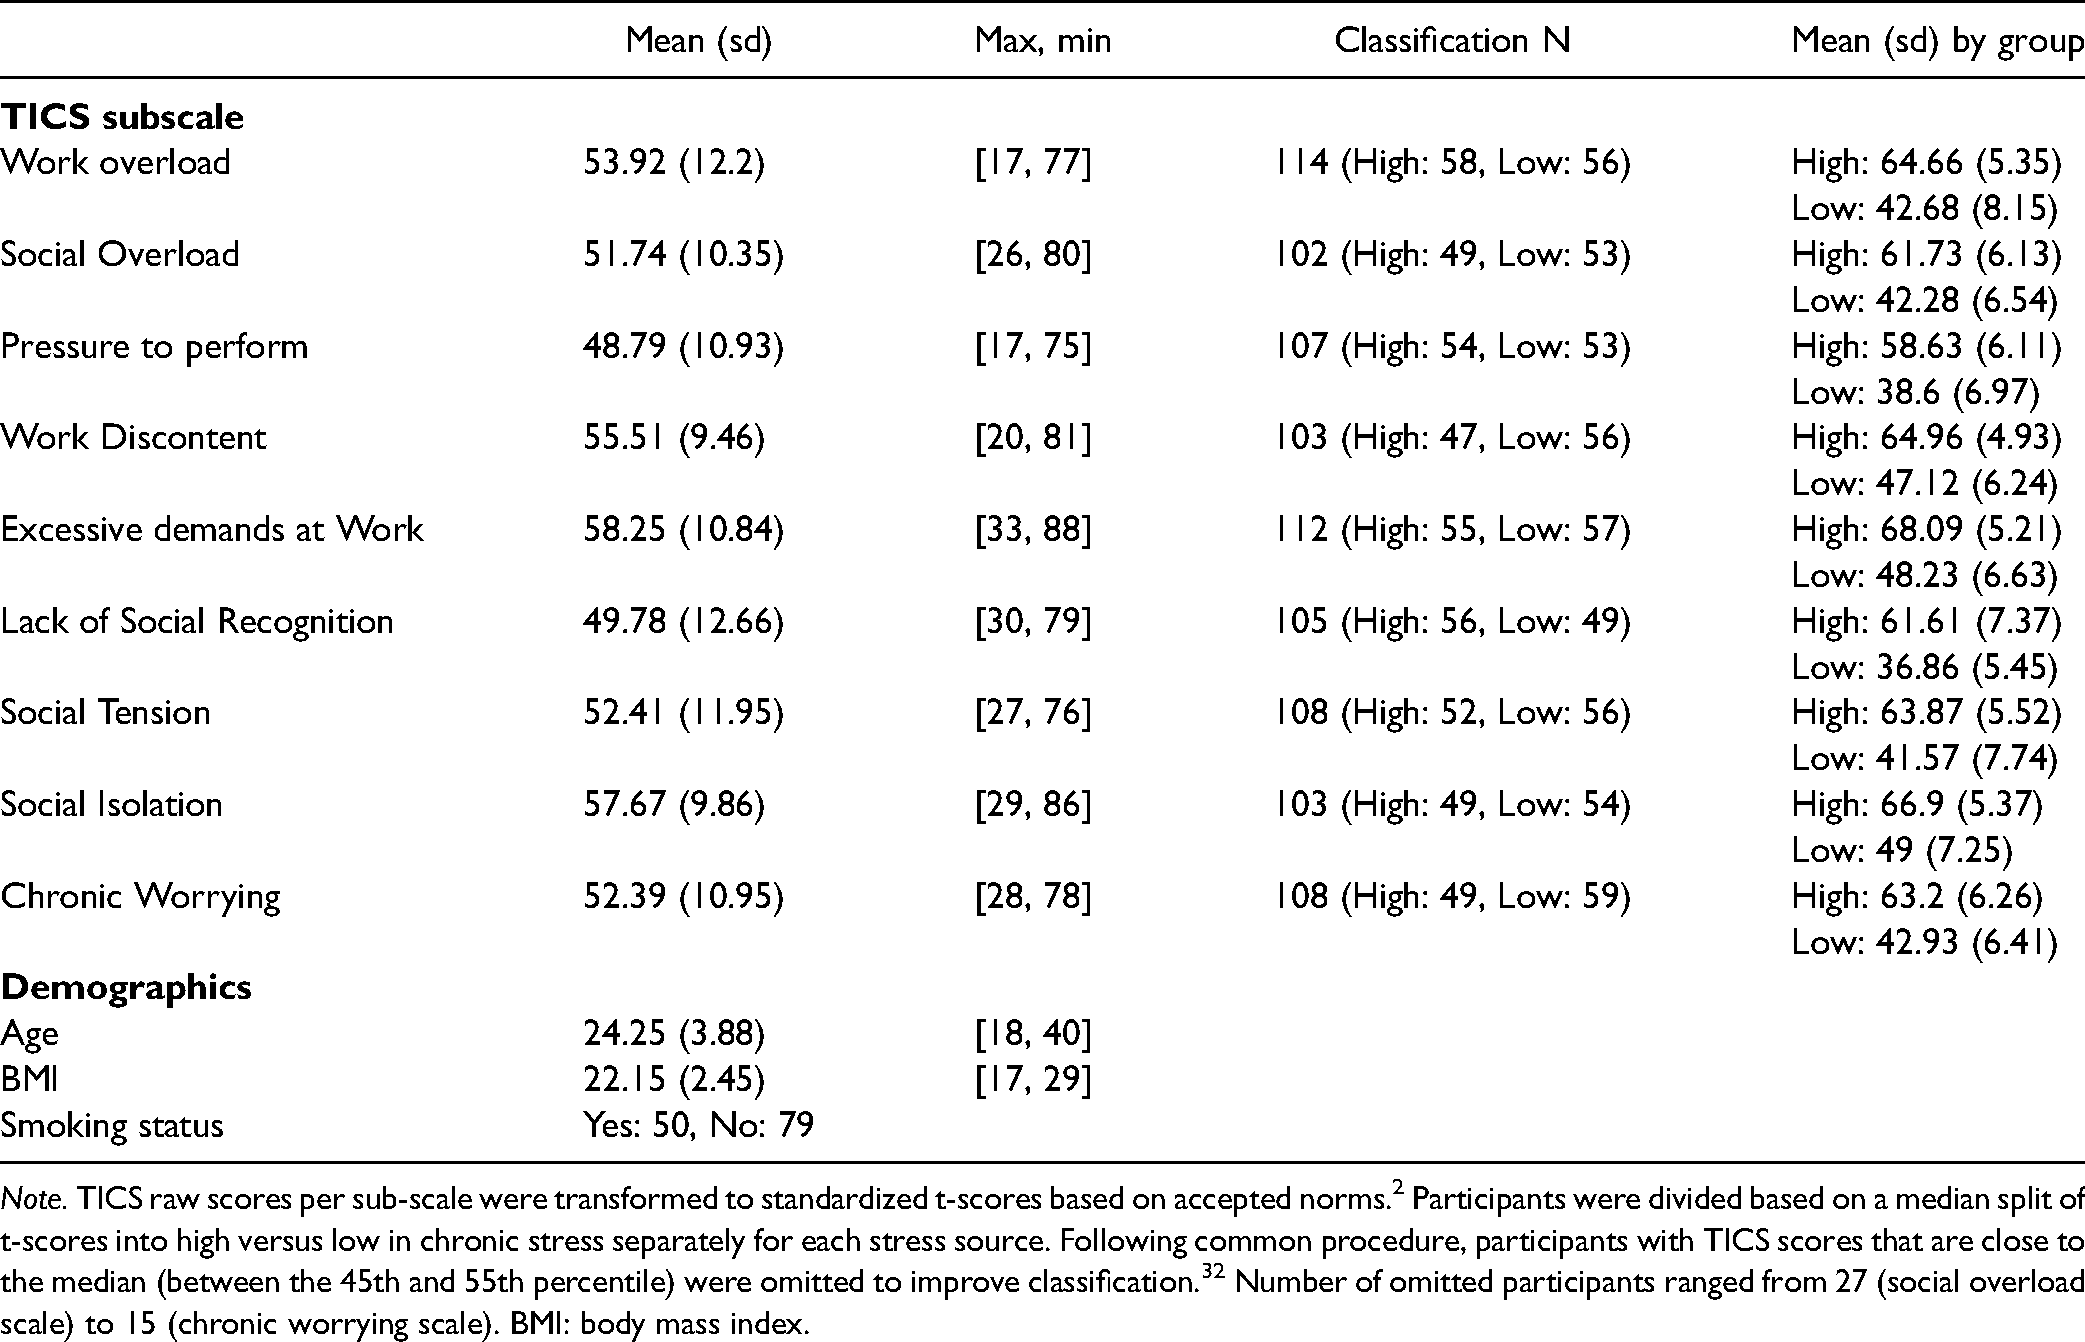
Note. TICS raw scores per sub-scale were transformed to standardized t-scores based on accepted norms. 2 Participants were divided based on a median split of t-scores into high versus low in chronic stress separately for each stress source. Following common procedure, participants with TICS scores that are close to the median (between the 45th and 55th percentile) were omitted to improve classification. 32 Number of omitted participants ranged from 27 (social overload scale) to 15 (chronic worrying scale). BMI: body mass index.
Wearable Sensor
The commercially available wrist-worn fitness tracker Fitbit charge3 was used in order to record physiological and lifestyle features in real-life settings. The sensor uses 3-axis accelerometer to measure movement, an altimeter to track altitude changes, an optical photoplethysmography (PPG) to track HR and a vibration motor for notifications and alarms. This sensor was selected due to its long battery life that enabled full week recording without charging, as well as its established reliability and validity in measuring diverse features of daily-life including physical activity, sleep and stress.29,50,51 Participants wore the sensor on their non-dominant hand, two cm above the styloid process of the radius, such that it was securely in contact with the skin, but not tight enough to restrict blood flow or cause any inconvenience. Throughout study period, all sensor related notifications and reminders were disabled and participants received no feedback regarding their behavior and habits including sleep and physical activity. This was done in order to assure that participants will maintain their typical daily routine during the measurement week.
Sensor Data pre-Processing
All recorded sensor data was collected with Fitbit cloud. Anonymity was kept by uploading participants’ data using only a unique study ID as identifier. Recorded data included HR (BPM scores in 5-15 s resolution), sleep (onset and offset), step count per minute, altitude and minutes spent in different activity levels (sedentary, lightly and very active minutes) per day. Preprocessing of these data included the following steps: For HR data, each HR measurement is given a confidence score between 0 (no confidence – invalid measurement) and 3 (full confidence – valid measurement) by the Fitbit algorithms. HR measurements with confidence scores lower than 2 were omitted. BPM values lower than 40 or higher than 180 were also discarded. Next, HR signal was down-sampled to one-minute resolution and all segments with less than 2 valid measurements per minute were omitted. From a total of 1,331,989 minutes that were recorded throughout the full measurement week across participants, 1,151,780 minutes survived these procedures (86.5%) and were regarded as representing valid measures of HR recording. The average (SD) number of minutes per participant was 8928 (1201). The resulting HR signal formed the basis to all physiological features. For sleep data, night sleeps were considered valid only if sleep onset occurred between 8pm to 8am and sleep lasted at least three hours. Valid night sleep was defined as the longest continuous night sleep period for a given night. For steps count, the number of steps per minute per participant was extracted and each (awake) minute was classified as rest (0 steps), low activity (<9 steps), medium activity (10> steps <50) or high activity (>50 steps). Further, the Fitbit device automatically classifies minutes of each day into three categories based on HR and steps count. These categories are “sedentary minutes”, “lightly active minutes” and “very active minutes”. The daily time spent in different activity category was calculated per participant. All preprocessing steps were conducted using Python programming language.
Data Preprocessing and Feature Extraction
Following pre-processing, sensor data was divided into physiological features that are derived from HR measures and other sensor-related lifestyle features, alongside non-sensor-related demographic features. For a full description of the feature extraction process see supplemental text. The feature extraction process yielded a final set of 23 features to be included in the models (Tables 2 and S1); Nine physiological features including: sleep HRmean, sleep HRsd, resting HRmean, resting HRsd, high activity HRmean, mesorsd, amplitudesd, acrophasemean and acrophasesd. Ten lifestyle related features including: overall sleep timemean, overall sleep timesd, sleep onset timemean, sleep onset timesd, sleep regularity index, steps countmean, steps countsd, and mean daily time spent in different activity levels (lightly\moderatly\very active minutes), and four demographic features including: age, BMI, smoking status and Normalized Difference Vegetation Index (NDVI). 52 In order to account for potential dependence between features, all pair-wise feature interactions were included in the model.
Final set of Physiological, Lifestyle and non-Sensor-Related Demographic Feature (n = 23).
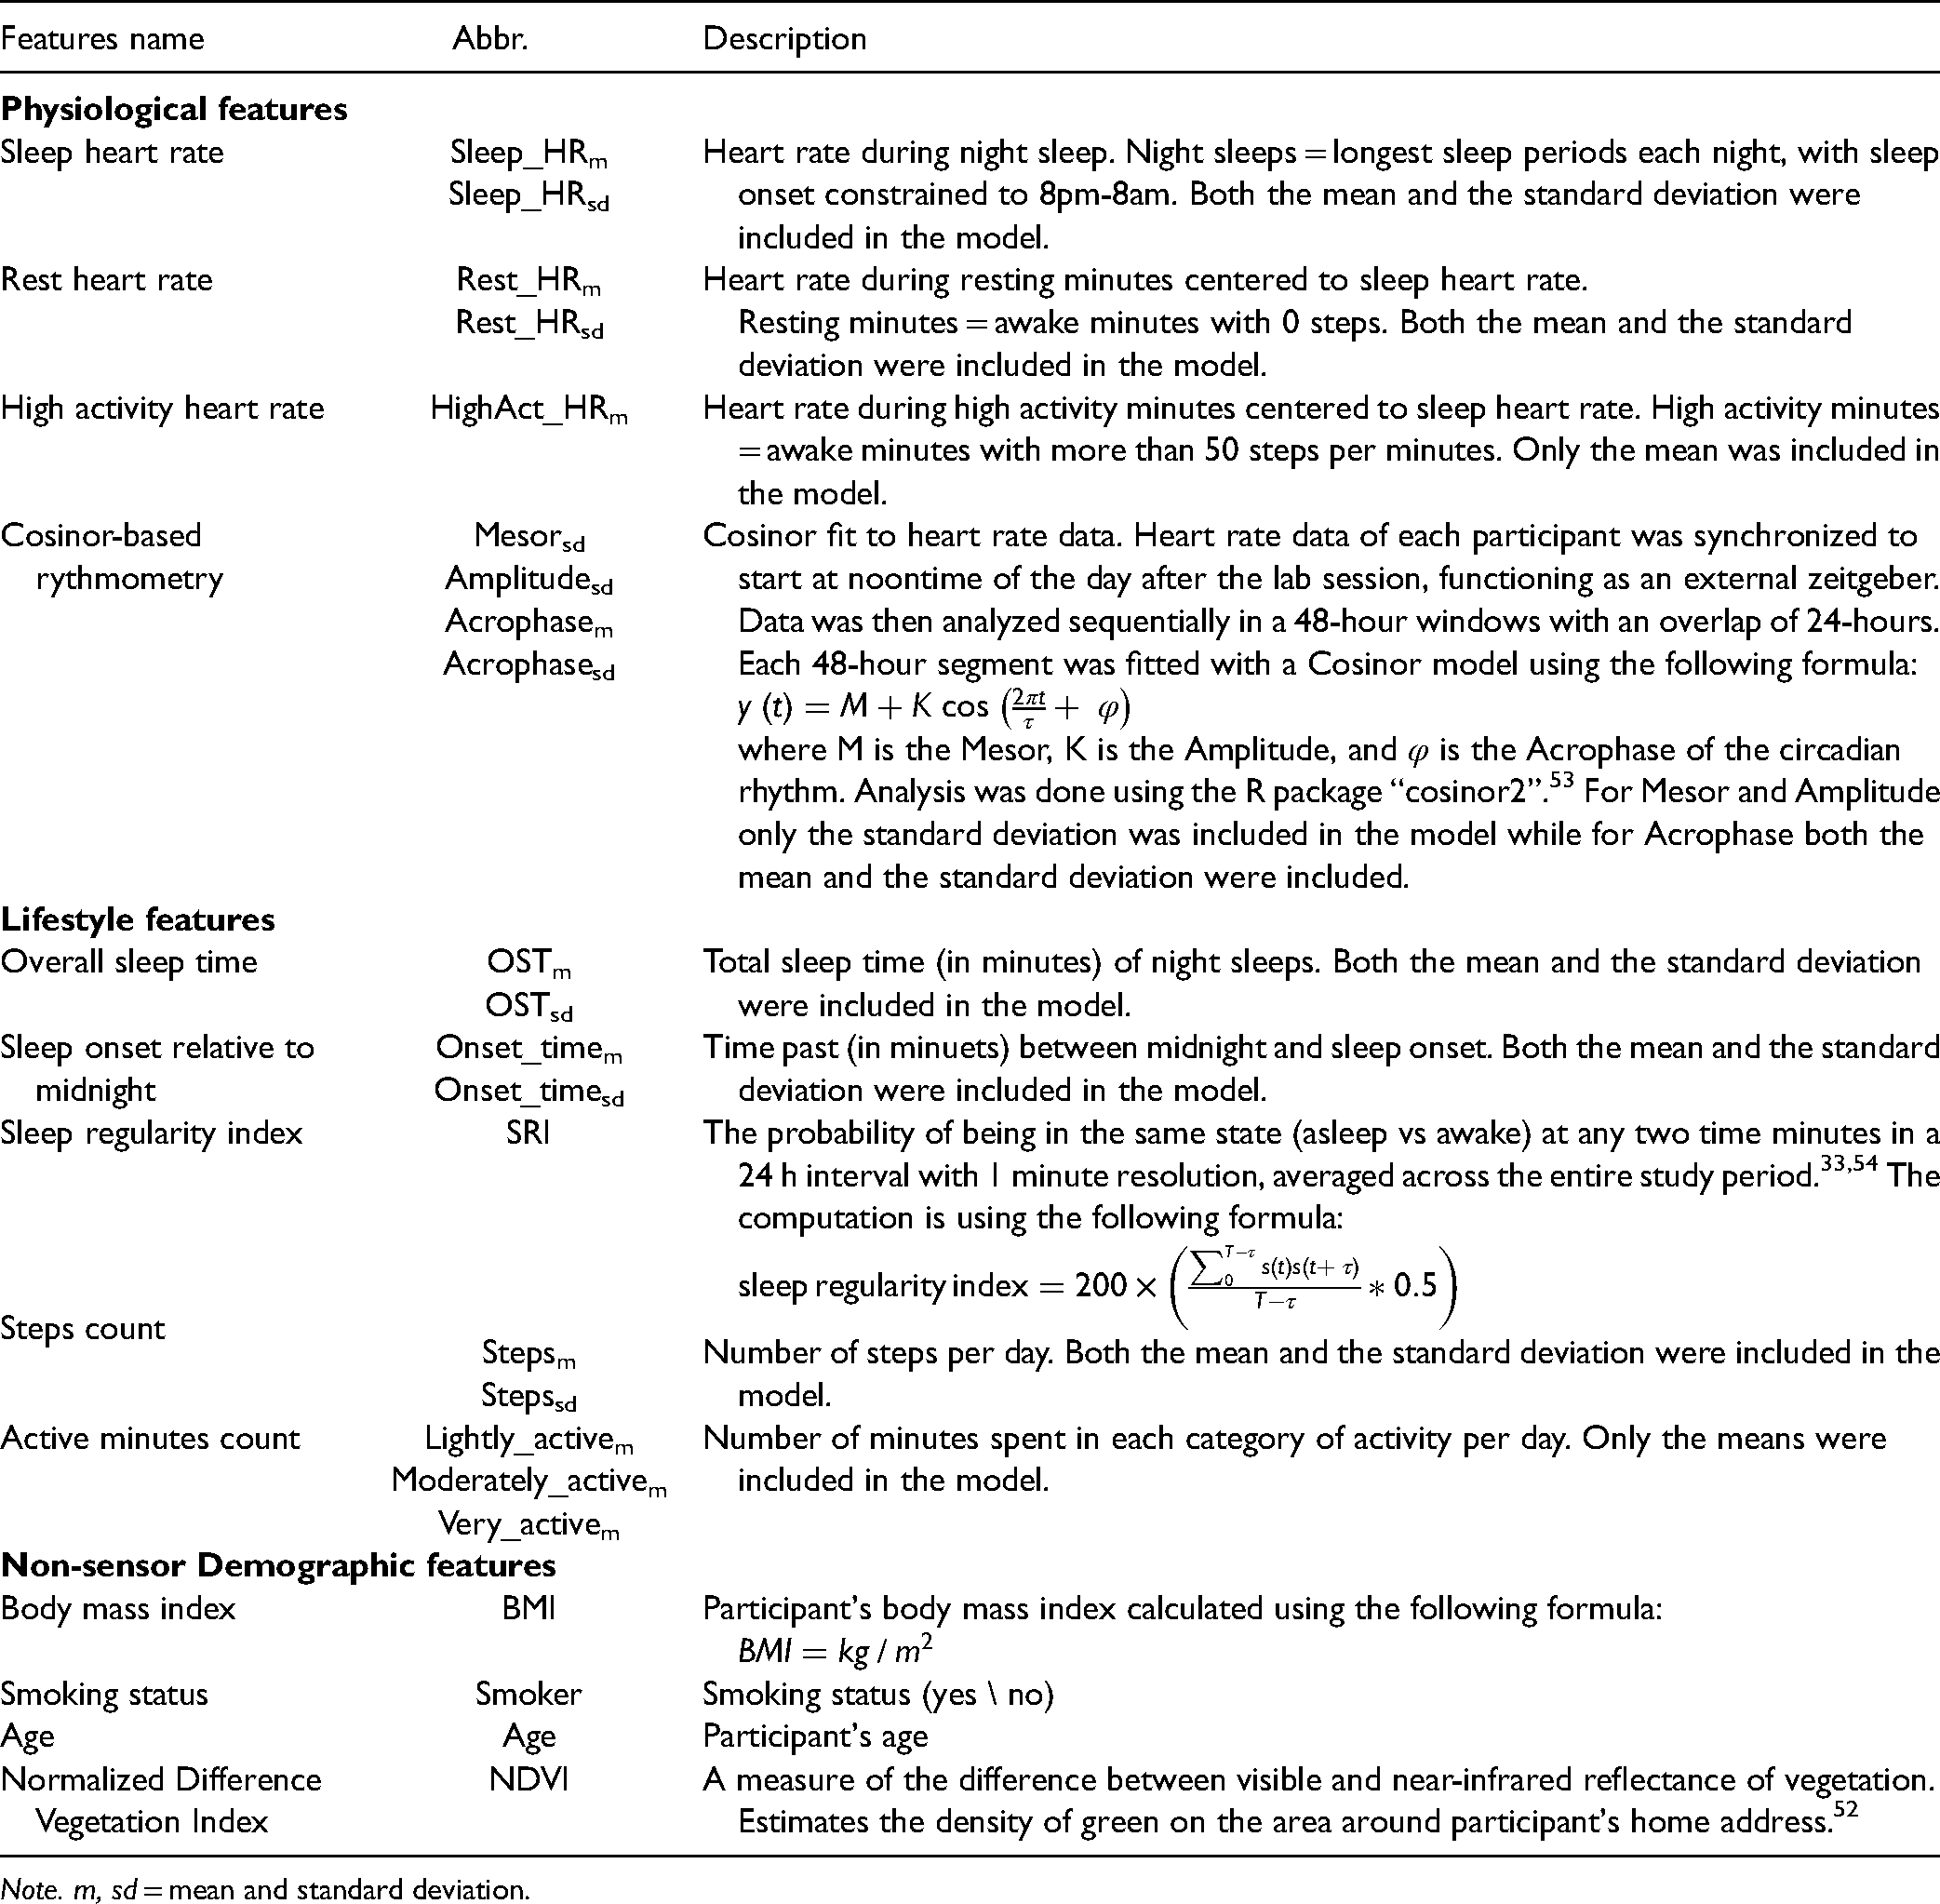
Note. m, sd = mean and standard deviation.
Classification Models and Performance Assessment
The R “caret” package was used for model training and validation, as well as for testing feature contribution. A support vector machine (SVM) model with a polynomial kernel was constructed separately for each of the TICS nine sub-scales as outcomes using the “kernelab” package. 55 SVM was selected due to its stability and robustness given imbalanced dimensionality, 56 and given its established validity for analyzing complex psychological constructs using limited sample size. 57 The degree of the polynomial kernel was tuned as part of model training. A fixed 70/30% split was used to partition the data into train and test sets in order to avoid testing data contamination and overfitting. The training data was used for parameter tuning and model building using a 3-fold cross validation with fixed folds. Fixed folds were chosen to allow reproducibly. Accuracy was used as the optimization metric. Model performance was measured using models’ classification accuracy of the test data and examination of the confusion matrix (specificity and sensitivity). Positive predictive values, negative predictive values and the area under the receiver operating characteristic curve (AUC of the ROC) were also reported, which indicates the model's ability to distinguish between two classes. Specifically, the ROC is built by extracting class probabilities (the probability of belonging to a specific class) and calculating specificity and sensitivity at different thresholds of probability. The AUC is calculated based on the ROC. It represents the ability of a model to distinguish between two classes, with AUC = 1 indicating perfect classification. For the model that achieved the highest accuracy, ROC curve analysis and simple logistic regression models were used to assess feature importance and compare the high versus low stress groups, respectively. Further, permutation analysis was used to validate model significance. Specifically, test data labels of the specific TICS scale (high vs. low) were shuffled for 1000 times. For each iteration, the trained model's prediction accuracy was calculated in order to generate a null distribution. Model accuracy significance was inferred if the original accuracy fell above the 95th percentile of this null distribution. Finally, the classification accuracy of this model was tested again using only physiological, only lifestyle or only demographic features.
Results
Of the 140 eligible participants, eleven participants were excluded from the study due to missing demographic information (n = 7) or invalid sensor data (n = 4). The remaining 129 participants had satisfactory number of minutes with valid data throughout the full measurement week (M = 8863; SD = 1256).
Chronic Stress Scores
Table 1 & Figure 1A depict the mean scores and distribution of the nine different TICS sub-scales. Overall, chronic stress scores were moderately positively correlated, with correlation coefficients ranging between 0.29 to 0.65, indicating that participants’ chronic stress levels varied with respect to stress sources (Figure 1B).
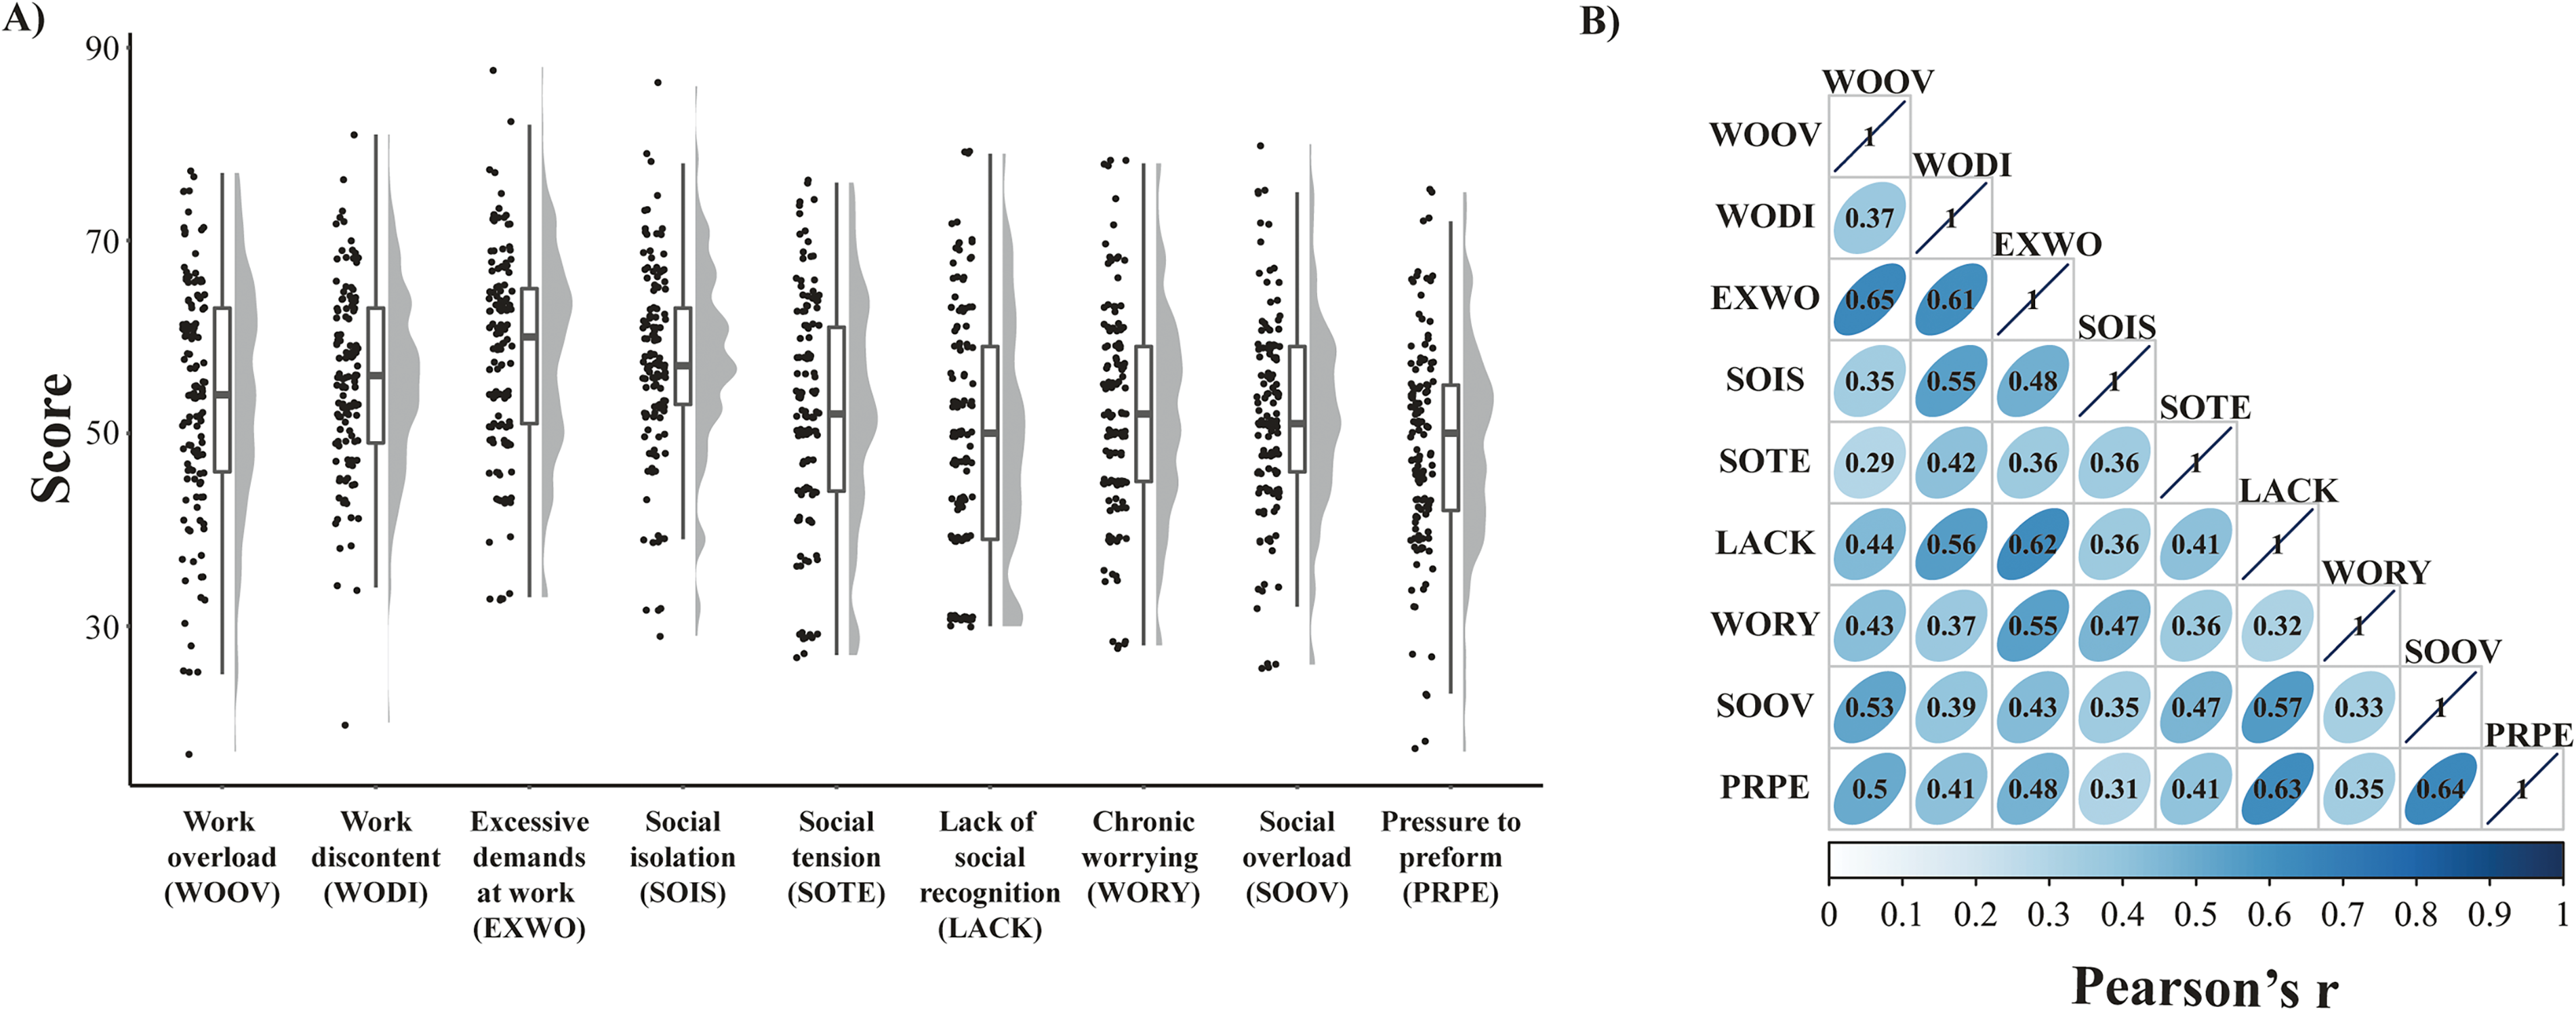
Distribution and pair-wise correlations of TICS sub-scales. All correlations were significant. p < .05, Bonferroni corrected.
HR Data from Daily-Life
Prior to model estimation, HR data was examined to ensure reliability. Figures 2 and 3 depict mean HR continuously throughout the week and mean HR during different levels of activity, respectively. Figure 2 shows the average HR trajectory during the seven measurement days, indicating a clear circadian rhythm. Figure 3 depicts, as expected, that HR was highest during high activity (>50 steps per minute) and lowest during sleep. Repeated measure ANOVA with a Greenhouse-Geisser correction using HR in the different activity categories as a within-subject variable revealed a significant main effect of activity type (F(1.73, 221.87) = 1252.49, p < .0001). Post hoc pairwise comparisons revealed a significant effect of all the 10 pairwise comparisons (all p's <.0001; Bonferroni corrected), indicating that activity levels as defined here based on step-count were associated with differences in HR (See Tables S2 and S3).

Mean HR continuously throughout the week. The blue line depicts mean beats-per-minute (BPM) per hour for all 129 participants. The grey area represents 95% confidence interval. The bottom bar depicts the percentage of participants that were awake at any given hour throughout the week.

Mean HR during different activity levels. Mean beats-per-minute (BPM) during High activity (steps per minutes > 50), Med activity (10 < steps per minutes < 50), Low activity (0 < steps per minute < 10), rest (steps per minute = 0) and sleep. Error bars represent standard deviation. All pairwise comparisons were significant. p < .05, Bonferroni corrected.
Chronic Stress Classification
SVM models accounted for the classification of high versus low in chronic stress separately for each TICS sub-scale. The highest test accuracy emerged from the SVM model that predicted chronic stress from a social tension source (SOTE), achieving 79% classification accuracy (Figure 4). The cross-validation tuning of parameters for this model was set to degree = 1 (a linear kernel) and C = 0.25 for the final model. Further, this model achieved out-of-sample specificity of 94% (16/17) and sensitivity of 62% (10/16). The positive and negative predictive values for the model were 90% and 72%, representing the chance of being in the high social tension group if classified as such and the chance of being in the low social tension group if classified as such, respectively. The AUC of the ROC curve was 0.80. Notably, social tension was the only TICS sub-scale in which the model predicted classification above chance (p = .0011, all other p's >.1147). As can be seen in Figure 5, the results of the permutation analysis indicate that this model accuracy was not driven by chance, with 79% accuracy scoring well above the 95th percentile of the null distribution.

SVM classification performance. Performance accuracy of the full model per each of the nine TICS subscale. Error bars represent 95% confidence intervals. Dotted horizontal line depict chance level. Social tension (SOTE) was the only TICS sub-scale in which the model predicted classification above chance (p = .0011, all other p's >.1147).

Permutation analysis performance. Test data labels were shuffled for 1000 times. For each iteration, trained model prediction accuracy was calculated in order to generate a null distribution. Dashed line – 95th percentile, straight line: actual accuracy (79%). Model accuracy was well above the 95th percentile of the null distribution.
Feature Importance
Exploring feature importance in the social tension model was restricted to non-interacting features and was performed on the whole dataset. As can be seen in Figure 6, the seven most important features (all AUC > 0.6) were mean sleep onset time (Onset_timem, AUC = 0.689), smoking status (Smoker, AUC = 0.669), HR circadian rhythm (Acrophasem, AUC = 0.631), mean difference between resting HR and sleep HR (Rest_HRm, AUC = 0.616), density of green space (NDVI, AUC = 0.612), average steps count (Stepsm, AUC = 0.610) and sleep regularity index (SRI, AUC = 0.601). A series of post-hoc simple logistic regression models revealed that the odds of being in the high stress group increased by 1.1% for every additional minute added to subjects’ sleep time onset (95% CI [.05% to 1.8%]; p = .0008), and by 11.4% for each additional BPM increase in the difference between resting HR and sleep HR (95% CI [2.0% to 22.6%]; p = .0199). Being a smoker also substantially increased the chance of being in the high stress group by 327.7% (95% CI [88.5% to 919%]; p = .0006). On the other hand, higher SRI decreased the chance of being in the high stress group by 2.2% (95% CI [4.3% to 0.3%]; p = .0283). Variability in HR circadian rhythm (mean acrophase), NDVI and average steps count did not significantly increase the odds of being in the high stress group when assessed separately (p = .1977; p = .3551; p = .3369, respectively).
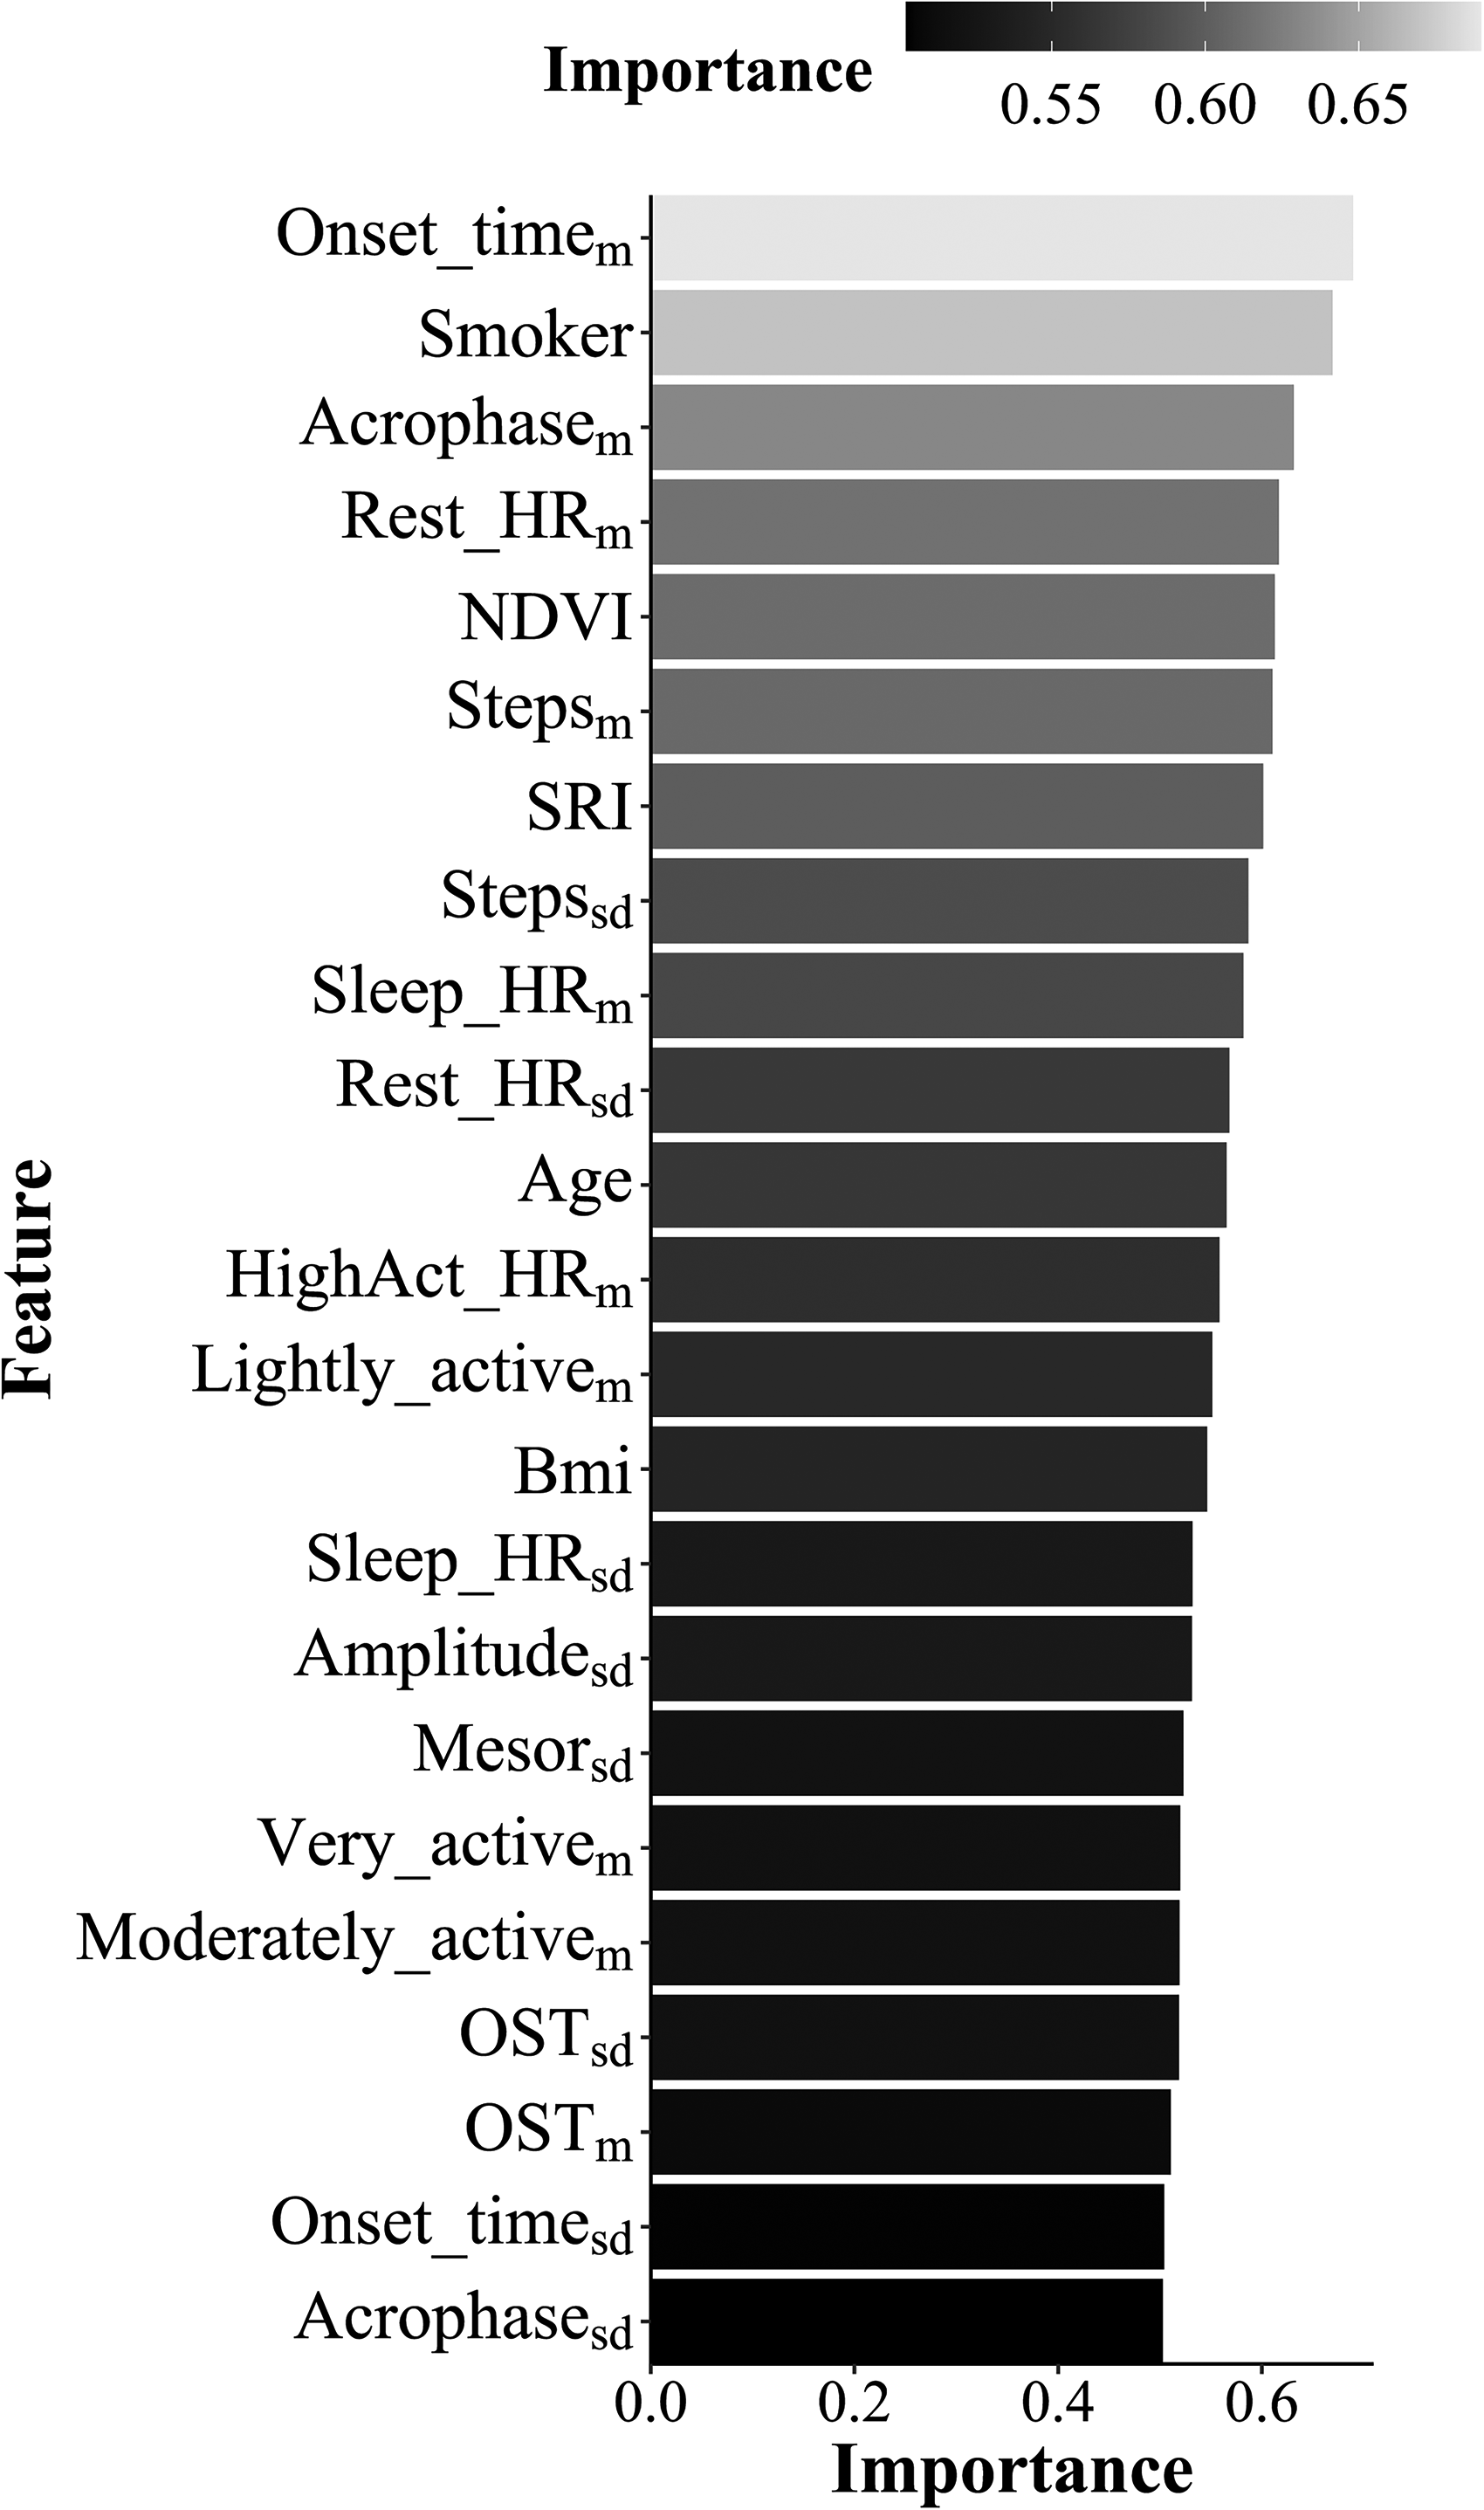
Feature importance. Feature importance are given as area under the receiver operating characteristic curve (AUC of the ROC). See Table 2 for a detailed description of each feature.
Physiological versus Lifestyle versus Demographic Features
Model performance of the social tension chronic stress scale was tested when including only physiological, only lifestyle and only demographic set of features. All three models achieved accuracy scores that are not different than chance level (Physiological: 50% accuracy, p = .5679; Lifestyle: 50% accuracy, p = .5693; Demographic: 65% accuracy, p = .0631), indicating that each independent set of features by itself is not sufficient to account for social tension chronic stress in our sample.
Assessing the Role of Additional Demographic Features
Considering the impact of menstrual cycle on stress responsivity and stress-related psychopathology,58–60 we conducted post-hoc analyses to assess whether high and low social tension chronic stress groups differ in menstrual phase. Menstrual phase [follicular (n = 55) / luteal (n = 57))] was calculated for each participant based on self-reported last menstruation date. In addition, given that our results were specific to chronic stress from a social tension source, the relation between participants’ family status and high and low social tension was examined. For that, participants were divided into “single” (n = 76) versus “in-relationship” based on their self-report. In-relationship accounted for married (n = 5), married with children (n = 2) as well as single in a stable relationship (n = 25). Results revealed that the proportion of participants exhibiting high versus low social tension did not differ with respect to either menstrual phase (X2(108) = .8164, p = .3662) or family status (X2(108) = .1464, p = .7019).
Discussion
Chronic stress is a highly prevalent condition with substantial implications on physical and mental health.7,61 The results of the current study add to a growing crop of literature that demonstrate the utility of wearable sensors in accounting for variability in chronic stress, in this case chronic stress due to social tension, using unobtrusive measurements.33,62,63 Specifically in here, an SVM classifier that integrated physiological and lifestyle features from wearable sensors, alongside demographic information, was able to classify individuals into high versus low in social tension chronic stress with 79% accuracy. The features that contributed the most to this classification included a mixture of physiological factors such as resting HR and HR circadian rhythm, lifestyle habits of sleep onset time and sleep consistency and demographic information on smoking status and density of green space in residential address. Notably, models that used solely physiological, lifestyle or demographic features failed to account for variability in social tension chronic stress in our data. Taken together and corresponding to previous suggestions, 63 these results point on the importance of incorporating multiple types of information in order to improve stress classification accuracy. Given the dire effects of chronic stress on physical and mental health,7,8 including chronic stress form a social source, improved understanding of how specific types of chronic stress are manifested in daily lives may carry substantial societal and clinical implication.
Achieving 79% accuracy in the classification of participants into high versus low social tension chronic stress is comparable to previous studies that were conducted in daily-life.32–34,64 Majority of studies to date included some forms of self-reported data as features in their models. For instance, predicting PTSD and other trauma-related outcomes was improved by combining self-reported symptoms taken at the emergency department with data from wearable sensors. 34 Similarly, data from electronic diaries was used together with sensor data for classifying students into high versus low stress groups. 33 Here, classification was obtained by a combination of passively collected objective physiological and lifestyle features as well as demographic information, suggesting that social tension chronic stress can be detected with substantial accuracy even without collecting self-reported subjective data.
With regard to the contribution of specific features, the most significant physiological features in predicting elevated levels of social tension chronic stress were larger difference between resting HR and sleep HR and delayed peaks in HR circadian rhythm. Higher resting HR may depict heightened basal cardiac arousal, a physiological state with substantial ties to stress. 4 In fact, elevated resting HR has been consistently reported among individuals diagnosed with stress-related psychiatric disorders,65,66 and furthermore, psychotherapy reduced resting HR among these patients. 67 Of note, previous findings suggested that elevated resting HR among psychopathological populations might partly stem from the effect of psychiatric medications. 68 In here, we add to the existing literature by showing a small but significant effect of elevated resting HR among healthy unmedicated females, as a factor of their social tension chronic stress level. With respect to circadian rhythm, its impact on different autonomic functions, including HR, is critical for homeostasis maintenance, hence withhold strong mutual interactions with stress systems.69–71 In preclinical studies, chronic stress was shown to lead to delayed peaks (acrophase) in circadian body temperature fluctuations in rats that were also exposed to early life stress. 72 This, alongside current findings, may point towards delayed acrophase as a maladaptive impact of chronic stress on circadian systems. The fact that the mean acrophase by itself did not significantly predict the odds of being in the high or low social chronic stress group in our post-hoc examination may reflect the complexity of relationship between HR circadian regulation and chronic social tension stress.
Lifestyle habits that were most predictive of high social tension chronic stress in here include late sleep onset time and irregular sleep/wake cycle. These results are consistent with previous findings highlighting the contribution of sleep patterns to accurate detection of stress levels,73,74 and further support the well-established association between stress and sleep. For example, self-reported tendency to eveningness (preferred time to preform various activities, ie a “morning person” or an “evening person”) was a weak but a significant predictor of perceived stress 75 and work-related stress. 76 One possible mechanism is that later sleep onset reflects bedtime stress-related rumination. 77 Alternatively, and related to the previous point, late sleep onset and particularly irregular sleep/wake cycle, may impact or be impacted by, dysregulated circadian systems and hence contribute to chronic stress.
With respect to demographic information, social tension chronic stress was more prevalent among smokers, corresponding to previous findings. 44 While acute nicotine intake increases the activation of the HPA axis, chronic nicotine use was found to be related to blunted HPA reactivity, suggesting that stress reactivity is compromised among smokers. 78 The amount of green space surrounding participants’ residential address (NDVI) was an additional important demographic predictor. Greenspace coverage was found to be inversely associated with work related chronic stress 47 and general life stress and worries.48,79 Similar to mean acrophase, NDVI also did not predict the odds of belonging to the high social tension group in post hoc analysis, implying on complex relationship between greenspace coverage and social chronic stress. For example, a previous study found that the relation between perceived stress and lifestyle features (sleep quality) was moderated by greenspace coverage. 80 Thus, it is possible that greenspace and stress are related through interactions with other features. Features interaction may also explain why each set of features alone was not sufficient to predict social tension. For example, sleep disturbances were found among smokers 81 and so does elevated heart rate, 82 and the relationship between chronotype and stress resilience was mediated by sleep quality. 83 Other possibility is that additional factors that were not measured in here may interact with current features. For example, low socioeconomic status was associated with increased cigarette smoking prevalence. 84 Similarly, physical activity was shown to be related to sociodemographic variables such as age, unemployment and income status.85,86
Typically, chronic stress is assessed using a general scale. In here, out of the nine sub-scales of chronic stress that were assessed, social tension was the only source of chronic stress that was accurately predicted. Social tension refers to chronic stress that stems from interpersonal conflicts and tensions that are not successfully managed. 2 Lifestyle behavioral features such as sleep are particularly important to social processes, 87 and indeed, similar to our findings, social stress (social rejection) was associated with later bedtime. 88 However, how exactly different sources of chronic stress may pose differential impact on physiology and behavior is not yet clear. Considering the novelty of this result, we can only speculate that social tension was a particularly impactful source of chronic stress in the current sample due to specific sample characteristics. To this end, our sample included only healthy women, a population that might be particularly susceptible to the effects of social stress (unresolved social conflicts), considering that women are more susceptible than men to “the cost of caring”. 89 This is also in line with the notion that women are more sensitive to interpersonal stressors than men, 90 and that social conflicts may hamper the ability to recruit social support, an important coping mechanism, particularly for women.91,92 This interpretation, nevertheless, should be regarded with cautious considering the relatively young age of our participants, an age at which social responsibilities are potentially limited. Also related to the age of our participants, at their age many of them were still students, a population that might be particularly sensitive to social conflicts and to the effect of interpersonal stress,16,19,93 and at the same time might be less sensitive to work-related stress. This in turn may explain why data obtained from these participants accounted for chronic stress from a social tension source but not from any TICS scale of work-related stress. Given that we did not collect data regarding participants’ work status, these notions cannot be directly tested in here. Still, our findings highlight the importance of taking the sources of stress under consideration in chronic stress research.
While identifying distinct physiological and lifestyle features from daily-life that are associated with elevated levels of social chronic stress is highly informative, several limitations of this study should be acknowledged. First, the current study cannot infer whether the identified features are the causes or consequences of social tension chronic stress. For the majority of the features that were found to be associated with elevated chronic stress it is easy to imagine how they may contribute to chronic stress but may also by the result of it. This include elevated resting HR, late sleep onset time, irregular sleep/wake cycle and smoking. In fact, it may very well be the case that the same feature is the result of stress for one participant but the source of stress for another. Intervention studies that manipulate one or more of the identified features while repeatedly measuring stress levels, or that attempt to reduce chronic stress while measuring relevant daily-life features, may aim to assess causality. Also related, considering that TICS was only administrated once, it is not clear how chronic the stress reported in this study really is. Future longitudinal assessments may be useful in that regard as well. Second, as in all studies that implement machine learning algorithms, the sample size is a limiting factor. The current sample size is comparable to recent studies in the field, and furthermore, SVM represents a conservative classifier. Still, larger samples could enable implementation of more complex algorithms, potently yielding improved classification accuracy. Also important in that regard, in light of sample size considerations we explicitly choose to include only data from healthy young females. This enabled us to overcome age and/or sex related variability in physiological and lifestyle features.94,95 At the same time, this choice limits the generalizability of our findings. For example, the effects of chronic stress exposure were shown to be age-dependent.42,96 Thus, future research is warranted to test the relevance of current findings at different age groups, among males, and in other heterogeneous populations.
Using a commercial device raises several limitations as well. First, wearable sensors might be prone to biased measurements, particularly during high physical activity. Second, wearing commercial fitness trackers may promote physical activity, influencing participants’ daily routine. 97 In here, all possible feedbacks (e.g. reminders to move) were disabled, but participants could still actively watch their steps count, which could increase physical activity. Hence, despite careful consideration of the data and rigorousness analytic procedures, current features should not be regarded as clinically precise and cannot lead to specific health recommendations. A final limitation relates to the absence of any self-report data from during the measurement week. On the one hand, accurate classification based only on objective passively obtained features represent a virtue of the current study, since disruption to participants’ daily-life was kept to a minimum. On the other hand, incorporating daily self-report assessments could have helped to elucidate how daily-life events and behaviors may account for some of our findings. For example, a daily rumination questionnaire could explain whether bedtime delays are a result of rumination. Even further, since findings were specific to chronic stress from a social tension source, daily reports could have enriched physiological and lifestyle features by tying them with the emergence of randomly occurring interpersonal conflicts.
Conclusion
Data on participants’ physiology and lifestyle that were passively collected using a wearable sensor, alongside demographic details, enabled the classification of healthy adult females into high versus low in social tension chronic stress with 79% accuracy. All three types of features, physiological, lifestyle and demographic, contributed to this accurate classification. These findings demonstrate the inherent potential of combining non-medical wearable devices in stress research. Additionally, this study may pave the way for the future testing of the causal relationship between the aforementioned physiological and lifestyle variables and chronic stress, especially from social/interpersonal source. For example, testing whether social conflicts precede or are the cause of later bedtime and irregular sleep/wake cycle. In light of the invasiveness of existing measurement for chronic stress and allostatic load, the use of wearables represents a promising path to measure physiology and health habits in an unobtrusive manner. As wearables technologies continue to rapidly evolve, new and improved daily-life indicators can be studied and integrated to create a broader understanding of chronic stress and its impact on physiology and behavior and hence on physical and mental health.
Supplemental Material
sj-docx-1-css-10.1177_24705470221100987 - Supplemental material for Predicting Chronic Stress among Healthy Females Using Daily-Life Physiological and Lifestyle Features from Wearable Sensors
Supplemental material, sj-docx-1-css-10.1177_24705470221100987 for Predicting Chronic Stress among Healthy Females Using Daily-Life Physiological and Lifestyle Features from Wearable Sensors by Noa Magal, Sharona L. Rab, Pavel Goldstein, Lisa Simon, Talita Jiryis and Roee Admon in Chronic Stress
Footnotes
Declaration of Conflicting Interests
The author(s) declared no potential conflicts of interest with respect to the research, authorship, and/or publication of this article.
Funding
The author(s) disclosed receipt of the following support for the research, authorship, and/or publication of this article: This research was supported by the Israel Science Foundation (ISF) (grant# 738/20), a Joy Ventures Neuro-Wellness Research Grant, and a dataset collection grant from the University of Haifa Data Science Research Center (DSRC), all awarded to Dr. Admon.
Ethical Approval
Ethical approval was provided by the University of Haifa Institutional Review Board (IRB) committee (approval #032/19 & 429/20).
Informed Consent
All participants provided written informed consent approved by the University of Haifa Institutional Review Board.
Trial Registration
Not applicable, because this article does not contain any clinical trials.
Supplemental Material
Supplemental material for this article is available online.
References
Supplementary Material
Please find the following supplemental material available below.
For Open Access articles published under a Creative Commons License, all supplemental material carries the same license as the article it is associated with.
For non-Open Access articles published, all supplemental material carries a non-exclusive license, and permission requests for re-use of supplemental material or any part of supplemental material shall be sent directly to the copyright owner as specified in the copyright notice associated with the article.