
Abstract
Depression and anxiety disrupt daily function and their effects can be long-lasting and devastating, yet there are no established physiological indicators that can be used to predict onset, diagnose, or target treatments. In this review, we conceptualize depression and anxiety as maladaptive responses to repetitive stress. We provide an overview of the role of chronic stress in depression and anxiety and a review of current knowledge on objective stress indicators of depression and anxiety. We focused on cortisol, heart rate variability and skin conductance that have been well studied in depression and anxiety and implicated in clinical emotional states. A targeted PubMed search was undertaken prioritizing meta-analyses that have linked depression and anxiety to cortisol, heart rate variability and skin conductance. Consistent findings include reduced heart rate variability across depression and anxiety, reduced tonic and phasic skin conductance in depression, and elevated cortisol at different times of day and across the day in depression. We then provide a brief overview of neural circuit disruptions that characterize particular types of depression and anxiety. We also include an illustrative analysis using predictive models to determine how stress markers contribute to specific subgroups of symptoms and how neural circuits add meaningfully to this prediction. For this, we implemented a tree-based multi-class classification model with physiological markers of heart rate variability as predictors and four symptom subtypes, including normative mood, as target variables. We achieved 40% accuracy on the validation set. We then added the neural circuit measures into our predictor set to identify the combination of neural circuit dysfunctions and physiological markers that accurately predict each symptom subtype. Achieving 54% accuracy suggested a strong relationship between those neural-physiological predictors and the mental states that characterize each subtype. Further work to elucidate the complex relationships between physiological markers, neural circuit dysfunction and resulting symptoms would advance our understanding of the pathophysiological pathways underlying depression and anxiety.
Keywords
Background
Worldwide, 615 million people suffer from the common mental disorders of depression and/or anxiety. Close to 10% of the world’s population is affected. 1 The effects can be devastating. Depression is now the leading cause of disability around the world contributing greatly to the global burden of disease.2,3 Depression is characterized by a constellation of disturbances in mood, thought and function, commonly including persistent sadness, a lack of interest or pleasure in previously rewarding or enjoyable activities, sleep and appetite disruptions, tiredness and poor concentration. 4 Anxiety is characterized by overlapping symptoms of cognitive and sleep disturbances, as well as hypervigilance. 4 These disorders disrupt daily function and their effects can be long-lasting, recurrent and even fatal. After unintentional injuries, suicide caused by mental disorders such as depression is the leading cause of death in young people aged 10 through 34 years, accounting for more than other diseases combined. 5
Depression and anxiety are complex disorders and their causes are not fully understood. Genetic, neurological, hormonal, immunological, and neuroendocrinological mechanisms as well as stress can play a role in the onset and course of depression and anxiety.6,7 In this review, we consider the relationship between chronic stress and depression and anxiety. One conceptualization of depression and anxiety is that they arise from maladaptive responses to chronic stress and that a disruption in neural circuit function is involved.8,9 Depression and anxiety can also exhibit biological characteristics of chronic stress in the absence of a history of chronic life stressors. Regardless of etiology, depression and anxiety have been associated with many physiological markers of chronic stress, and the full relationship between symptom profiles, neural circuit dysfunctions, and physiological markers of stress in depression and anxiety has not yet been ascertained.
We define chronic stress as the emotional and physiological impacts experienced over a prolonged period of time during which the individual feels they have little or no control, which encompasses chronic stress experienced in adulthood as well as early life stress. These long-term effects are typically accompanied by endocrine system responses that can be beneficial in acute situations but are thought to become detrimental to mental health when prolonged. Without amelioration of the source of impact of chronic stress, depression can all too often become chronic, starting in adolescence, continuing through early adulthood and go on to affect personal, social and professional functioning for the rest of life.8,9 The consequences of an inability to adapt to prolonged and uncontrollable stress over time are apparent in a disruption of human brain circuits that regulate emotional and cognitive functions (for review 8 ).
These views of depression and anxiety are compatible with the increasing understanding of depression and anxiety as disorders that arise from multiple possible types of disruption in brain circuits that regulate emotional and cognitive functions at the core of human experience (for review10,11) and are subject to the impact of chronic stress. This understanding has been made possible by rapid advances in human neuroimaging that allow us to measure large-scale circuits formed by the correlated activity between brain regions during both task-free and task-specific conditions. This knowledge forms the foundation for the development of precision medicine for psychiatry informed by neuroscience, or ‘precision psychiatry’. 12
Given that the chronic effect of stress plays a central role in disrupting circuit function, it will ultimately be important to have the means to quantify indicators of stress and use them as surrogate indicators of both symptoms and of circuit disruption. In doing so, we might also use indicators of stress in early detection of the emergence of symptoms and circuit disruptions, although a complete discussion of this speculation is beyond the scope of the current review. This integration is further advanced in other areas of precision medicine and precision health. For example, in cardiovascular medicine, readings of blood pressure may indicate when there is a need to obtain a more proximal and detailed scan of the heart using cardiac imaging.
In outlining this future vision, we recognize that we currently lack an integrated body of knowledge about symptoms, stress indicators and neural circuits in depression and anxiety, primarily because research into the role of stress in neural circuits has been pursued separately from research into indicators of stress in depression and anxiety. Thus, we first provide an overview of the importance of repetitive stress, and its putative role in the development of depression and anxiety. This overview serves as the basis for then providing a scoping review of the current knowledge regarding objective physiological indicators (or markers) of stress and how they do or do not correlate with depression and anxiety defined by symptoms. For this, we focus on markers of cortisol, heart rate variability and skin conductance that reflect states of tonic and phasic changes in arousal, which we conceptualize as accessible physiological indicators of stress and its impact. Lastly, we provide a brief overview of neural circuit disruptions that characterize particular types of depression and anxiety and a preliminary illustration of how physiological markers may act as surrogate correlates of these disruptions.
Stress, Depression, and Anxiety
Most available research investigating the role of stress in depression has focused on acute (or episodic) life events, rather than on the co-occurring effects of chronic, ongoing, often uncontrollable stressful situations (for review 13 ). By definition, acute (episodic) stressors have relatively discreet beginnings and endings and likely only explain part of the maladaptive response to stress in the development of depression and how it can become a chronic disorder. Some of the most consistent findings regarding acute stress have been in regard to the role of stressful life events in compounding the severity of depression and related anxiety symptoms (for review13,14).
Although stress is a normal and healthy response to many situations, prolonged and uncontrollable (i.e., chronic) stress could lead to dysfunction of the stress response, resulting in increased reactivity to subsequent stressors. 15 Chronic stress is associated with higher risk of cardiovascular and metabolic diseases16–18 and is known to increase the risk of developing depression and anxiety and/or exacerbate current symptoms, with effects on sleep, appetite, energy, mood, emotion regulation. 19 This has been demonstrated extensively with the mouse model of chronic stress used to study the neurobiological basis depression and antidepressant response. 20 In addition, this concept is supported by literature documenting a strong link between depression and HPA axis dysfunction,21–23 and evidence that physiological indicators of sustained, severe stress, such as elevated stress hormone levels 24 and low heart rate variability, 25 are also often found in depression21,26–29 and anxiety.30,31
Due to the complex relationship between chronic stress, depression, and anxiety, indicators of chronic stress offer a means to measure physiological markers of maladaptive stress in anxiety and depression. As we currently lack objective biomarkers for depression and anxiety, 32 we propose a foundation for objective ways in which the physiological signs of chronic stress may be operationalized and measured in depression and anxiety. Such markers could ultimately be used to predict onset, diagnose, or target treatments in these disorders.
Physiological Markers of Stress in Depression and Anxiety
As highlighted in the original work of Hans Selye, stress functions as both the source of a stressor and as the result in the form of stress responses. This point is relevant to the goal of developing quantifiable stress markers to better understand and detect depression. Basic neuroscience studies suggest that the neural mechanisms underlying the development of depressive symptoms in response to stress may at least in part be distinct from those that underlie endogenous depression that resembles the impact of repeated stress but can occur in the absence of such stress. Thus, it is necessary that quantified markers of stress are ultimately available to human subjects researchers and clinicians alike to detect and monitor depression in a manner that allows for parsing of underlying mechanistic causes and intervening accordingly. Even more fundamentally, the development of objective measures that allow us to directly ‘read out’ the behavioral and biological underpinnings of depression will advance the precision of mental health disciplines, in regard to measurement itself and in regard to obtaining insights into the causes of disorder relevant to each individual. Currently, the clinical diagnosis of depression (and of anxiety) rests on the documentation of a certain number of symptoms that are observed to significantly impair functioning for a certain duration of time. There is substantial overlap in these diagnostic criteria as they apply to depression and anxiety. 33 It is possible for two people diagnosed with depression to share only one symptom in common. This symptom-based diagnostic approach allows for communication across clinicians but does not provide a quantifiable standard from which to interpret underlying causes, and how these causes may form particular subtypes relevant to individual experiences (including experiences of the impact of exposure to stresses). Within the basic neuroscience domain, investigators have highlighted the importance of focusing on specific dimensions of depression for developing quantified markers, related to underlying mechanisms, rather than to try and recreate the entire syndrome of symptoms. 34 In the clinical domain, we recognize that there remain many gaps to be filled in order to achieve precise and objective measurement of dimensions and subtypes of depression. To take a step toward addressing these gaps, we first focus first on a scoping review of objective markers of stress implicated in the broad diagnostic syndromes of depression and anxiety. We suggest that through synthesizing this information we may be in a position to identify candidate markers worthy of more detailed investigation in relation to underlying subtypes and dimensions that are relevant to the mechanism of depression developing through the impact of repeated stress. Following this, we present an illustration of how a next step may be to incorporate measurement of neural circuits relevant to both depression and stress, in order to move closer to objective quantification of cohesive dimensions that cause particular forms of depression.
As a context for our scoping review, we specify that our focus is on the measurement of the stress response through commonly assessed psychophysiological metrics derived from the cardiovascular (heart rate variability; HRV), eccrine (skin conductance; SC), and endocrine (cortisol) systems. A complete overview of the future of this field would require consideration of indicators of stress acquired through other measures and means, including but not limited to temperature change, muscle tension, voice, and behavioral indicators such as keyboard and mouse use, as well as markers of inflammation and genetics and epigenetics, but this is out of the scope of this review. HRV, SC, and cortisol are also well-studied physiological measures of stress that have been implicated in clinical emotional states and can be measured non-invasively alongside fMRI. They also reflect states of tonic and phasic changes in arousal, which we conceptualize as accessible physiological indicators of stress and its impact. For example, a phasic response encompasses Walter Bradford Cannon’s concept of ‘fight or flight’, referring to the reflexive physiological stress response (for review 35 ). These changes involve both the autonomic nervous system and hypothalamic-pituitary-adrenal (HPA) axis, two major systems that respond to stress in an attempt to re-establish physiological homeostasis and psychological regulation (for review 35 ).
Literature Search Procedure
The relationship between physiological markers of stress and negative emotional states of depression and anxiety has been the subject of many prior studies. We undertook a literature search using the PubMed database to provide a summary review of the peer-reviewed meta-analytic studies reporting on these findings. The following search was used to query PubMed for meta-analyses published between 01/01/2000 and 10/31/2020 that have linked depression and anxiety to HRV, SC, and cortisol: (“skin conductance” OR “electrodermal activity” OR “galvanic skin response” OR “electrodermal response” OR “psychogalvanic reflex” OR “sympathetic skin response” OR “heart rate variability” OR “RR variability” OR “heart period variability” OR “cortisol”) AND (“depression” OR “depressed” OR “anxiety” OR “anxious”) AND (english[lang]) AND (2000:2020/10[dp]) AND (journal article[pt]) AND (“loattrfull text”[sb]) NOT ((case reports[pt]) OR (Clinical Trial Protocol[ptyp]) OR (pubmed books[filter]) OR (comment[pt]) OR (Published Erratum[sb]) OR (“animals”[MeSH Terms:noexp])) AND (“meta-analysis”[tw] OR meta-analysis[pt]), which yielded 85 results.
Study Selection
Initial screening was based on titles and abstracts, then full text was reviewed (see Supplementary Material 1 for complete list of articles retrieved and screened with inclusion/exclusion criteria). Article screening and selection was completed by one individual. Articles were included (n = 13) if a meta-analysis was conducted to compare measurements of HRV, SC, or cortisol in depressed or anxious individuals to that of non-depressed or anxious (control) individuals (Figure 1). Articles were excluded (n = 72) for the following reasons: not a meta-analysis (n = 4), no cortisol, HRV, or SC assessment (n = 4), study population that is not currently depressed or anxious (n = 39), has a significant comorbid condition (e.g., stroke, cancer, psychosis; n = 7), or is only comprised of children or adolescents (n = 2), study utilizes HRV, SC, and cortisol biofeedback as an intervention only (n = 5) or only measures the physiological parameter as a treatment outcome (n = 9; Figure 1). Included articles were then categorized by HRV, SC, and cortisol and by whether the study population was anxious or depressed (Figure 1). Five meta-analyses were identified for HRV26,30,31,50,51 and eight were identified for cortisol,21,27–29,52–55 but no studies that met inclusion criteria were identified for SC (Figure 1).

An overview of the published peer-reviewed meta-analyses reporting on a relationship between one or more physiological markers of stress (HRV, SC, and cortisol) and anxiety and/or depression.
Because no meta-analyses that assess SC in depression or anxiety in comparison to controls were identified (Figure 1), a second PubMed search was conducted to identify systematic reviews on this subject. The following search was used to query PubMed: (“skin conductance” OR “electrodermal activity” OR “galvanic skin response” OR “electrodermal response” OR “psychogalvanic reflex” OR “sympathetic skin response”) AND (“depression” OR “depressed” OR “anxiety” OR “anxious”) AND (english[lang]) AND (2000:2020/10[dp]) AND (journal article[pt]) AND (“loattrfull text”[sb]) NOT ((case reports[pt]) OR (Clinical Trial Protocol[ptyp]) OR (pubmed books[filter]) OR (comment[pt]) OR (Published Erratum[sb]) OR (“animals”[MeSH Terms:noexp])) NOT (“meta-analysis”[tw] OR meta-analysis[pt]) AND (”systematic review”[tw] OR systematic[sb]), which yielded eight results.
Initial screening of systematic reviews was based on titles and abstracts, then full text was reviewed (see Supplementary Material 1 for complete list of articles retrieved and screened with inclusion/exclusion criteria). Articles were excluded (n = 7) for the following reasons: study population not currently depressed or anxious (n = 1), study does not assess SC in depression or anxiety (n = 3), study utilizes SC biofeedback as an intervention only (n = 1), SC is only measured as a treatment outcome (n = 2). One systematic review was included that assessed SC in depression in comparison to non-depressed (control) individuals. 56
Data Extraction
Key findings on SC, HRV, and cortisol in depression and anxiety disorders were extracted from included meta-analyses and one systematic review. A brief summary of the findings across all reviewed articles is provided in Table 1. For data on age, sex, number of cases and controls, medication status, diagnostic method, cortisol collection method, and effect size of findings, see Supplementary Material 2.
Summary of findings from literature review on the relationship between physiological parameters of interest and anxiety and depression.

If medication is not indicated, there was a mix of medicated and unmedicated individuals or medication status was unspecified. If age is unspecified, study population was comprised of adults, individuals of all ages under 60, or age was not specified. Cortisol collection methods include saliva, urine, plasma, blood, and CSF. In one study, cortisol was measured in hair only, which is indicated in the table. Abbreviations: Area under the curve with respect to ground (AUCg); Area under the curve in the waking period (AUCw); Area under the curve with respect to baseline (AUCi); Heart rate variability (HRV); High frequency (HF); Low frequency (LF); Very low frequency (VLF); Interbeat interval (IBI); Mean of standard deviations of NN intervals (SDNN); Root mean square of the successive differences (RMSSD); Skin conductance level (SCL); Skin conductance response (SCR); Major depressive disorder (MDD); Specific phobias (SP); Panic disorder (PD); Social anxiety disorder (SAD); Post-traumatic stress disorder (PTSD); Obsessive compulsive disorder (OCD); General anxiety disorder (GAD); Bipolar disorder (BP).
Summary of Literature Review Findings
In the meta-analytic studies reviewed, there is a general trend that heart rate variability is reduced in depression, regardless of medication status, across time domains,26,31,51 such as the root mean square of the successive differences (RMSSD),26,50 and frequency domains (high26,50,51 and low 50 ). Depressed individuals also have been found to have reduced inter-beat intervals. 50 Time-domain and high frequency HRV were also found to be reduced across anxiety disorders in both medicated and unmedicated populations.30,31
In individuals with depression, cortisol is consistently elevated when measured continuously over the course of 12–24 hours,28,29 at waking, 54 and in the morning,27–29 afternoon,21,28,29 and evening or night.27–29 Depression is also generally characterized by blunted cortisol stress reactivity 21 and impaired recovery. 21 However, one meta-analytic study found that cortisol stress reactivity was increased in males with depression, but decreased in females with depression, 52 indicating there may be sex-dependent factors in stress reactivity in depression. Cortisol in anxiety is a slightly more complex picture, with cortisol found to be elevated in males with anxiety but not females, and stress reactivity increased in males with anxiety but decreased in females with anxiety. 52 Hair cortisol was also found to be lower in individuals with anxiety. 55
Individuals with depression were found to display lower tonic skin conductance, 56 and decreased phasic SCR, 56 and with increased phasic latency SCR. 56 No meta-analytic studies or systematic reviews were identified that measured skin conductance in anxiety in comparison to controls, thus, more research is needed to elucidate this relationship.
Brain Circuits Impacted by Stress and Implicated in Depression and Anxiety
Depression and anxiety have been associated with many physiological markers of chronic stress, but the full relationship between symptom profiles, neural circuit dysfunctions, and physiological markers of stress in depression and anxiety has not yet been ascertained. 57 However, it is important to consider the contribution of neural circuit dysfunction when elucidating the relationship between stress and these disorders. Here, we provide an outline of six large scale neural circuits implicated in negative emotional states that can occur in depression and anxiety.11,58 These six circuits are referred to as default mode, salience, negative affect, positive affect, attention, and cognitive control.11,58 Drawing on this outline, in the subsequent section, we provide an illustration of how quantified disruptions in these circuits map on to physiological markers of stress and symptoms of depression and anxiety.
The
The
Affective circuits are robustly activated by stimuli that signal potential threats, negative events, or rewards. The
The
Two additional circuits are relevant to the cognitive and concentration features of depression and anxiety that commonly are given less emphasis than mood features. The frontoparietal
Preliminary Illustrative Analysis of How We Might Examine the Relationship Between Depression and Anxiety, Physiological Stress Markers, and Circuit Dysfunction
We propose an initial analysis through which we can illustrate the relationship between mental states of depression and anxiety, physiological responses to stress, and neural circuit dysfunction. Our field currently lacks detailed and systematic knowledge about how neural circuit dysfunction and responses to stress are expressed in physiological markers of stress, and how these markers map on to symptoms. Although we lack such knowledge, the purpose of this illustration is to provide one example for how we might start to examine such relationships, focusing on markers of heart rate variability and without relying on pre-defined diagnostic states. A theoretical basis for these relationships has been established prior 86 and in this illustration we expand on the link between specific symptom subtypes, neural circuit dysfunction assessed using functional neuroimaging and physiological markers of HRV recorded concurrently with the functional neuroimaging of neural circuits. HRV was selected as a starting point in this illustrative analysis because it is a well-characterized marker associated with stress, anxiety, and depression and the only marker for which we had a sufficient physiological marker and fMRI data to conduct a meaningful analysis.
This preliminary illustration is guided by conceptual working hypotheses. For example, overactivation of the negative affect circuit is implicated in symptoms of anxious arousal. Under conditions of chronic stress, if the negative affect circuit cannot adapt to stress it may stay ‘switched on’ in a form of alarm mode and produce the symptoms characteristic of anxious arousal symptoms, including a feeling of fear, a racing heart, palpitations and sweaty palms.
For purposes of clarity, we structure the prototype illustration around sub-sections that outline the participants, approach and illustrative findings.
Participants
The illustrative analysis was undertaken with 43 participants with clinically significant symptoms of depression and anxiety and 23 age-matched healthy participants (Table 2), who were also taking part in an ongoing complementary study. 87
Characteristics for participants in the illustrative analysis, spanning demographics and symptom severity assessed by prior established features of anxiety and depression expressed in standardized units quantifying standard deviations from the healthy reference mean of zero.

DSM diagnosis was measured with the Mini-International Neuropsychiatric Interview (MINI; v.7). For symptom severity, we used a measure of symptoms that distinguishes between generalized anxiety (tension and worry) and fear-related anxiety (social anxiety, phobia, panic) and we refer to these as G-Anxiety and F-Anxiety, respectively.
Forming Symptom Subgroups
Symptom severity was assessed using prior-determined factors from the Depression, Anxiety and Stress scale, 88 which provide a standardized means of quantifying symptom dimensions relevant to depression and anxiety. In prior work we have established the reproducibility of these factors across independent samples. 88 Generalized anxiety (also called ‘tension’) is characterized by symptoms such as difficulty in relaxing, feeling wound up and a sense of touchiness (Supplementary Table 1). Fear-related anxiety (also called ‘anxious arousal’) is characterized by feelings of fear and panic, and physical sensations of a racing heart, nervous energy and trembling hands (Supplementary Table 1). Depression (encompassing ‘anhedonia’ is characterized by aspects of depression that reflect hopelessness, a loss of pleasure and ability to experience positive feelings and a loss of motivation and energy (Supplementary Table 1).
Using cluster analysis we have shown that these factors form distinct symptom subtypes, also reproducible across samples. 88 When these factor loadings and cluster centroids were applied to the present sample, we identified three distinct symptom subtypes and a normative subtype (Figure 2). Subtype 1 is characterized by prominent symptoms of Generalized Anxiety combined with moderate Fear-related Anxiety. Subtype 2 is characterized primarily by Depression. Subtype 3 is characterized by a prominent Depression combined with Generalized Anxiety and a comparative lack of Fear-related Anxiety. The Normative mood subtype is characterized by a relative absence of each of symptoms that define each of the three factors.

Symptom profiles of different subtypes. Subtype 1 is characterized by prominent Generalized Anxiety (G-Anxiety) combined with moderate Fear-related Anxiety (F-Anxiety). Subtype 2 is characterized primarily by Depression. Subtype 3 is characterized by a prominent Depression combined with Generalized Anxiety (G-Anxiety) and a comparative lack of Fear-related anxiety (F-anxiety). Normative mood is characterized by a relative absence of each of these symptoms.
Physiological markers of heart rate variability: Data for markers of heart rate variability were acquired concurrently with functional neuroimaging using pulse oximetry integrated with a GE Discovery MR750 scanner (details of functional neuroimaging are provided in the following section). Recordings were taken for 20 minutes during the scanning session. The participant’s pulse was monitored by a photopulse sensor that detects blood flow in the vascular bed of the participant’s finger/thumb or toe. The sampling frequency was 100 Hz. We used Python Heart Rate Analysis Toolkit, HeartPy 89 to analyze the pulse signal. The toolkit is designed to handle (noisy) PPG data collected with either PPG or camera sensors. Both time domain and frequency domain markers of heart rate variability were quantified, In the time domain we quantified the standard deviation of RR intervals (SDNN), root mean square of successive differences (RMSSD) and the proportion of successive differences above 50 ms (pNN50). In the frequency domain we quantified measures of low-frequency (frequency spectrum between 0.05 and 0.15Hz; LF), high-frequency (frequency spectrum between 0.15 and 0.5Hz; HF), and the ratio of high frequency to low frequency (HF/LF).
Brain Circuit Measurements
Neural circuit function was assessed using functional neuroimaging at the Center for Neurobiological Imaging (CNI) at Stanford University using a GE Discovery MR750 scanner. Neural circuits were defined and quantified by a prior established procedure. 68
Negative and positive affect circuits were engaged by a task in which participants viewed facial expressions of emotion task. A standardized set of 3D evoked facial expression stimuli were presented in pseudorandom order, with five repeated blocks of eight stimuli per block for sad, threat evoked by fear, threat evoked by anger, and happy, relative to neutral blocks with a duration of 500 ms and interstimulus interval of 750 ms. Participants were instructed to actively attend in order to answer post-scan questions about these faces, and we controlled for active attention by monitoring alertness with an eye tracking system. We also presented the same stimuli nonconsciously in a backward-masking design to prevent awareness; face stimuli were presented for 10 ms followed immediately by a neutral face mask stimulus for 150 ms, and with a stimulus onset asynchrony of 1250 ms to match that of the conscious condition. 90
Cognitive control circuit was engaged by a Go-NoGo task. ‘Go’ trials (the word “press” in GREEN), required participants to respond as quickly as possible, while in the ‘NoGo’ trials (“press” in RED) participants were to withhold responses. 180 Go and 60 NoGo stimuli were presented in pseudorandom order; 500 ms each with an interstimulus interval of 750 ms. 90
Pre-processing and data analysis were performed using Statistical Parametric Mapping (SPM) software implemented in MatLab (Wellcome Department of Cognitive Neurology) and the FSL 91 following previously established procedures. Briefly, pre-processing of functional data included realignment and unwarping, normalization to a standardized template, and smoothing. Quality control diagnostics included removing scans with incidental findings, scanner artefacts and signal dropout. Participants’ data were included if no more than 25% (38/154) of time points were censored for frame-wise displacement or variance spikes.
Our regions of interest for each of the six circuits were established in a prior synthesis of the literature 86 and quantified using prior established systematic procedure. 68 Masks to define these a priori regions are generated using the meta-analytic platform Neurosynth 92 with peaks identified using the Functional Neuroimaging (AFNI) 3dExtrema function. We imposed a restriction that each peak has a minimum z-score of 6 and each region extends no farther than 10mm from the peak. For subcortical regions, Neurosynth maps were intersected with anatomically defined boundaries from the Automated Anatomical Labelling (AAL) atlas. 93
Activation values for each region were mean-centred and scaled to be expressed as standard deviation units. We expressed the extent of dysfunction in these values in terms of standard deviation units referenced to the mean of a healthy reference sample. Through this procedure, activation values were interpretable relative to a healthy reference mean of zero. Region-to-region connectivity was computed using a psychophysiological interaction procedure. Quantification of activation connectivity and activation followed the previously established systematic procedure. 68 To provide an overall neural measure of function for each circuit we computed a global circuit score that combined activation and connectivity of constituent primary regions and their connections.
Illustrative Approach
A tree-based prediction model was implemented first to analyze the relationship between physiological markers of heart rate variability for the three symptom subtypes relative to each other and to the normative mood subtype. The model was trained on data from 44 participants and validated on data from nonoverlapping 22 participants. We then analyzed the importance of each feature in predicting the symptom group using SHAP (SHapley Additive exPlanations). 94 SHAP values show the impact of having a certain value for a given feature in comparison to the prediction we would make if that feature took some baseline value.
Second, we analyzed the relationship between these physiological markers and subtypes when neural circuit measures were also included. This second tree-based prediction model provided an evaluation of the effect and importance of each of the six neural circuits (global circuit score and within circuit regional activation and connectivity) and heart rate variability markers. The goal was to identify the combination of neural circuit dysfunctions and physiological markers that accurately predict each symptom subtype, suggesting a strong relationship between those neural-physiological predictors and the mental states that characterize each subtype.
To implement these models a multi-class random forest classification model was trained and validated on the same participant groups. The importance of each feature was again analyzed using SHAP values. The goal of SHAP in the current illustration was first to explain the prediction of an instance of a subtype by computing the contribution of each physiological marker feature to the prediction and, second to explain the prediction of an instance of a subtype by computing the contribution of these physiological markers to the prediction when neural circuit features are included.
Results With HRV Markers
Using neural circuit scores and heart rate variability markers to train the model we achieved 40% accuracy which is an approximately 15% improvement over the chance level of 25% on the validation set.
Results With Global Circuit Scores
We next report results for global circuit neural circuit dysfunction. Using neural circuit scores and heart rate variability markers to train the model we achieved 54% accuracy which is an approximately 30% improvement over the chance level of 25% on the validation set. Thus, the inclusion of global neural circuit scores improved the accuracy of the model, based on physiological markers alone, by an additional 15%. Figure 4 shows the sorted features by the sum of SHAP value magnitudes across participants for prediction of three symptom subtypes and the normative mood subtype. In this figure, SHAP values show the distribution of the impact each global neural circuit and physiological marker feature has on the model output, predicting subtype. The impact of each feature on each subtype is proportional to the extent (length) of the corresponding color in each row. For example, global salience circuit dysfunction is much more important for deciding whether a participant belongs to subtype 1 than to other subtypes, as indicated by the greater extent of mauve color (corresponding to subtype 1 in the legend), relative to the other colors that correspond to three symptoms subtypes and the normative mood subtype. Positive affect circuit dysfunction followed by the LF/HF maker, on the other hand, are more important for distinguishing subtype 2.
To provide a complementary informative visualization, in addition to quantifying importance (Figures 3 and 4) we also quantified the effect of each global neural circuit and physiological heart rate variability feature on predicting subtype (Figure 5).

The impact of physiological marker features across the three symptom subtypes and the normative mood subtype. The x-axis represents the mean absolute value of the SHAP values for each feature. The overall length of the color bar in each row indicates the relative importance of the contributions of these features to each subtype. Abbreviations: High frequency (HF); Low frequency (LF); Root mean square of the successive differences (RMSSD); Mean of standard deviations of NN intervals (SDNN); Percentage of successive RR intervals that differ by more than 50 ms (PNN50).
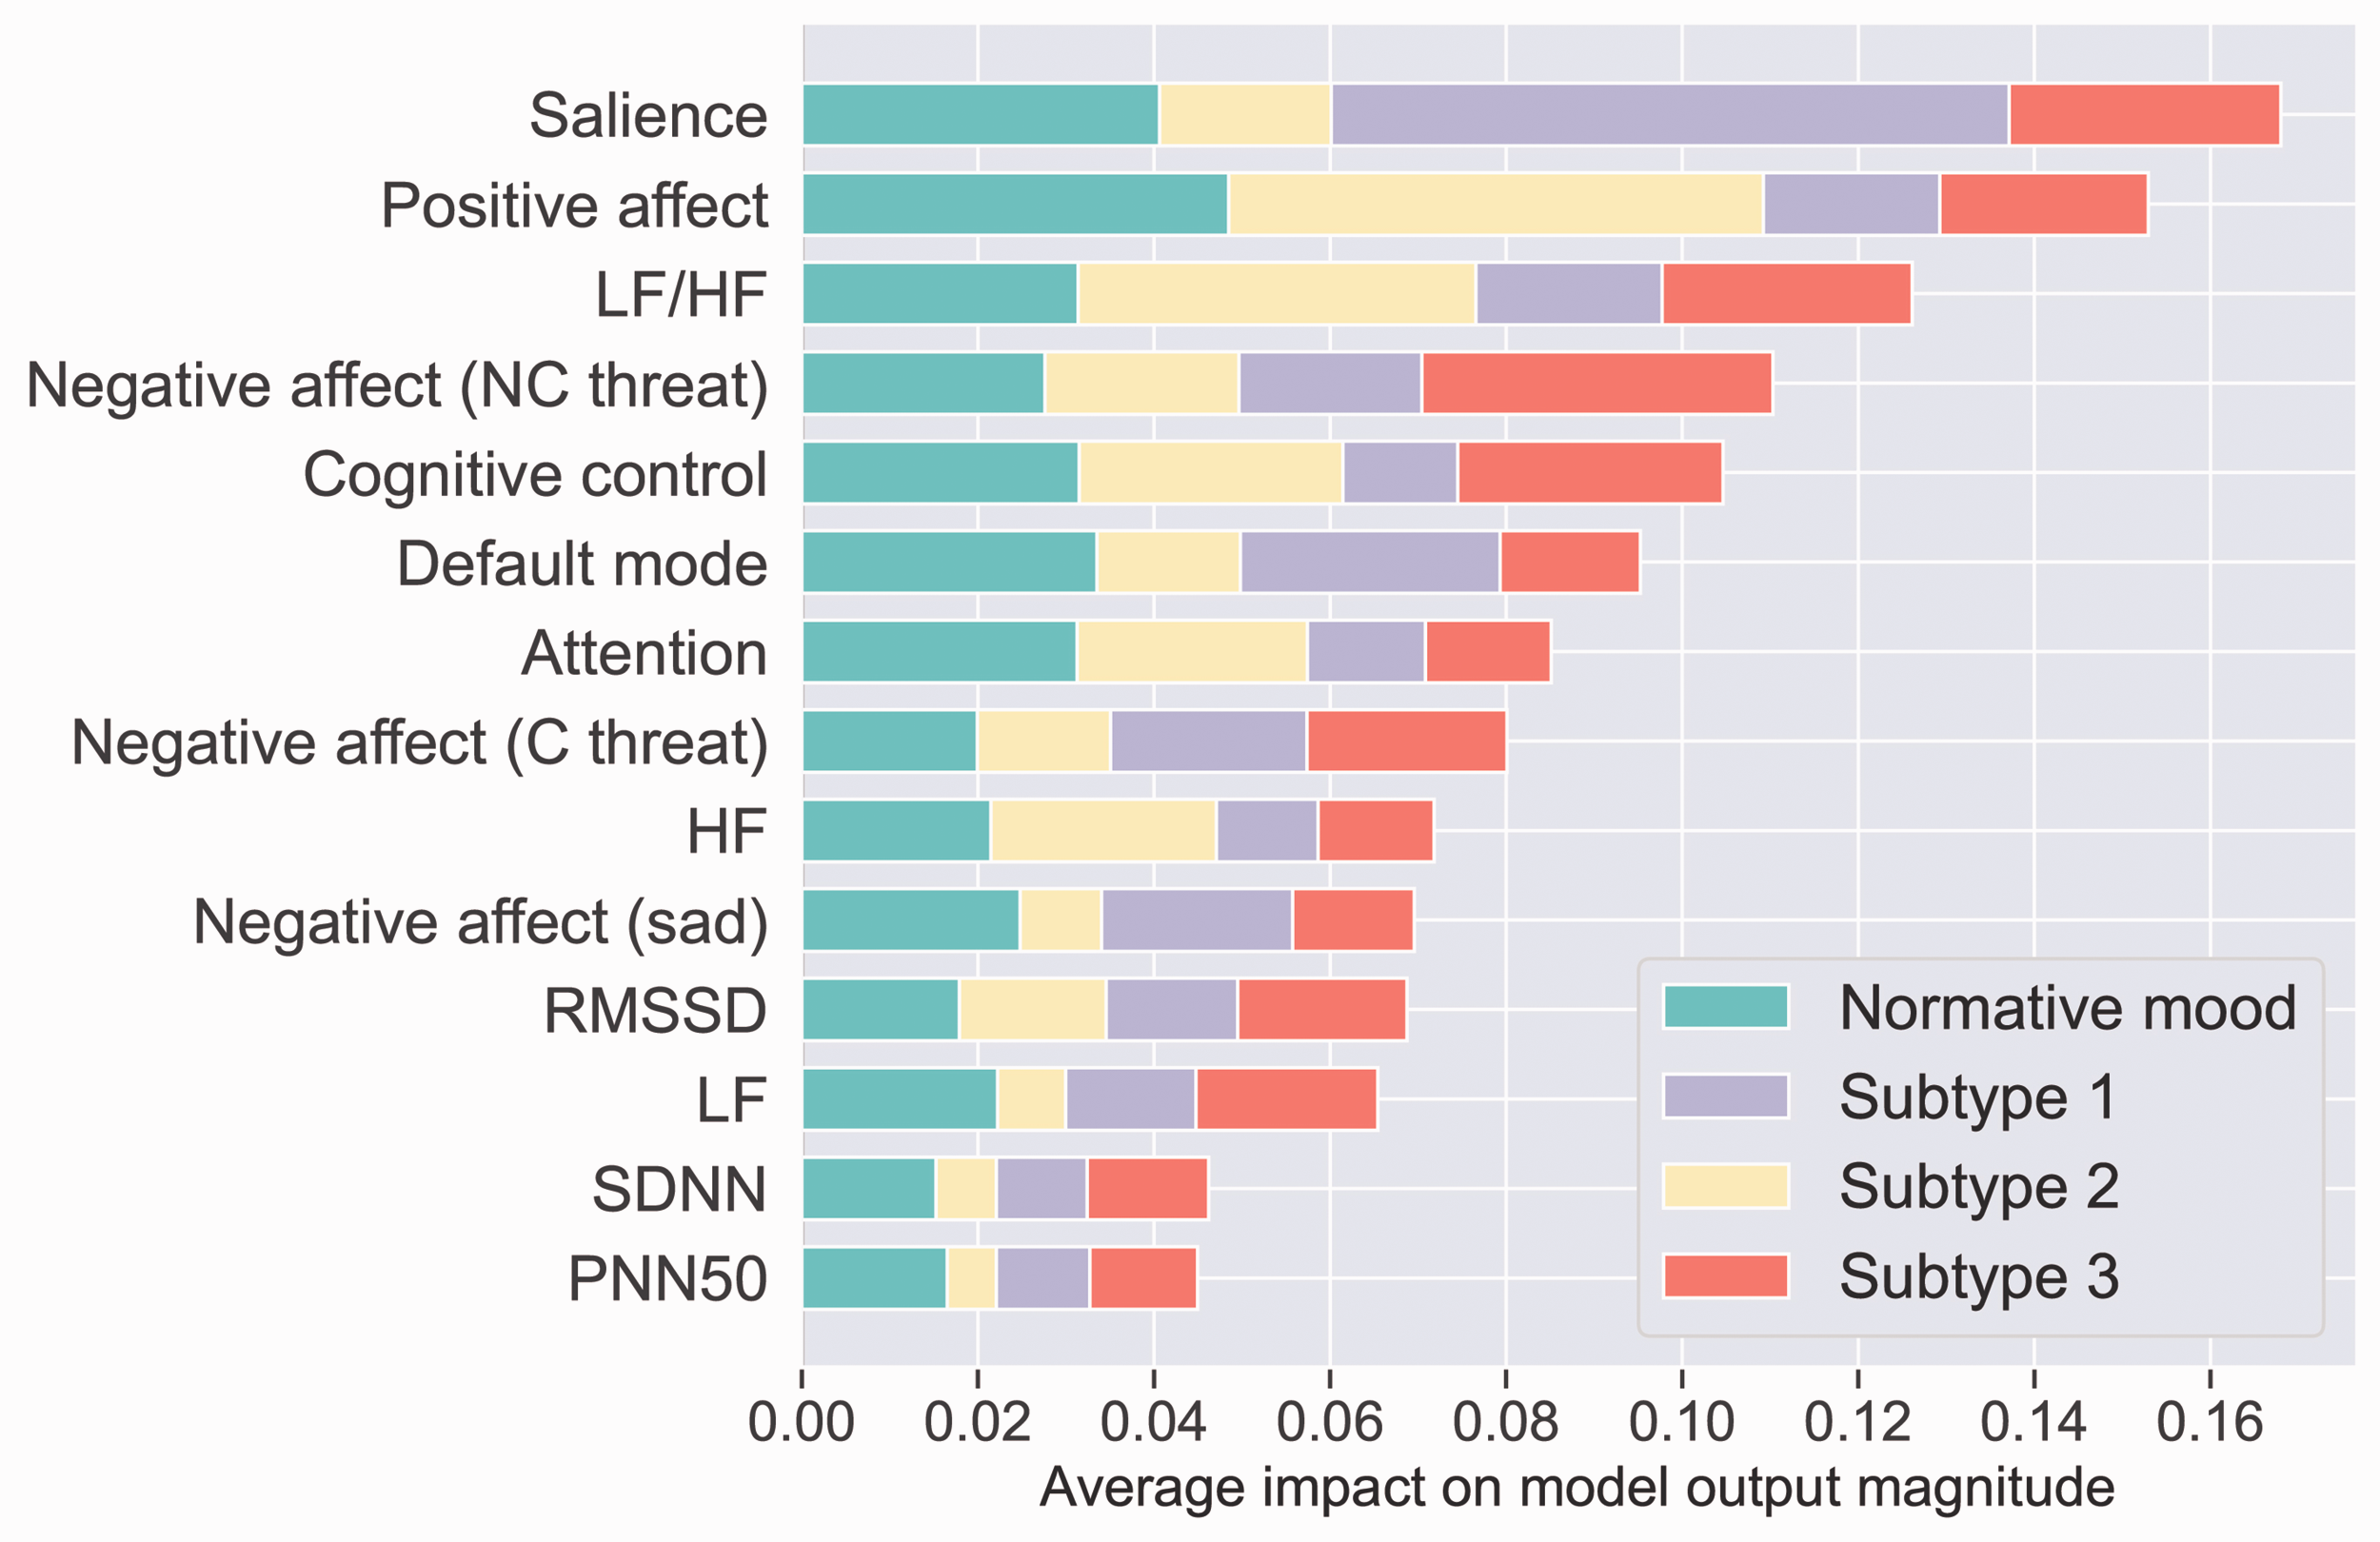
The impact of neural circuit and physiological marker features across the three symptom subtypes and the normative mood subtype. The x-axis represents the mean absolute value of the SHAP values for each feature. The extent (length) of color in each row indicates the relative importance of the contributions of these features to each subtype. For example, global salience circuit dysfunction is much more important for deciding whether a participant belongs to Subtype 1 than to other subtypes, as indicated by the greater extent of mauve color (corresponding to Subtype 1 in the legend), relative to the other colors that correspond to three symptoms subtypes and the normative mood subtype. By contrast, a combination of positive affect circuit dysfunction and the LF/HF stress marker is important for characterizing Subtype 2 as indicated by the yellow. Features are sorted based on their importance with the most important one at the top. Abbreviations: High frequency (HF); Low frequency (LF); Root mean square of the successive differences (RMSSD); Mean of standard deviations of NN intervals (SDNN); Percentage of successive RR intervals that differ by more than 50 ms (PNN50).

The distribution of the impact of each neural circuit and physiological heart rate variability feature on the predictive model output. The color represents the feature value (pink high, blue low). For example, for Subtype 1, the combination of global Salience, Default Mode, Negative Affect (evoked by both threat and sad) and the LF/HF stress marker are the top 5 measures with the most impact for predicting membership of this subtype. For Subtype 2, a different combination – positive affect, LF/HF along with cognitive control, attention and the HF stress marker – have the most impact for prediction of membership. For Subtype 3 yet another combination – negative affect (for threat), salience, cognitive control, the LF/HF stress marker and positive affect circuit dysfunction – have the most impact for prediction of membership. These findings suggest that participants with the greatest dysfunction on these measures are most likely to belong to Subtypes 1, 2 and 3, respectively. Abbreviations: High frequency (HF); Low frequency (LF); Root mean square of the successive differences (RMSSD); Mean of standard deviations of NN intervals (SDNN); Percentage of successive RR intervals that differ by more than 50 ms (PNN50).
In Figure 5, each point on the plot represents a Shapley value for a neural circuit or physiological marker feature per participant. Given that these plots present data for individual participants we stratify them by each of the subtypes (Figure 5, panels (a)–(c)). The position on the y-axis is determined by the feature and on the x-axis by the Shapley value. The color represents the value of the feature from low to high. Overlapping points are jittered in y-axis direction, so we get a sense of the distribution of the Shapley values per feature. The features are ordered according to their importance for the model.
Discussion of Illustrative Results
Our illustrative results provide preliminary indications that specific associations between negative mood states and autonomic stress markers, in this case markers derived from HRV recordings, may be revealed when subtypes of depression and anxiety are considered. The illustrative sample comprised three symptom subtypes (Subtype 1 with prominent symptoms of Generalized Anxiety combined with moderate Fear-related Anxiety, Subtype 2 with Depression and Subtype 3 with prominent Depression combined with Generalized Anxiety and a comparative lack of Fear-related Anxiety) along with a normative subtype is characterized by a relative absence of these symptoms (Figure 2). Predictive models indicated that the ratio of LF/HF is especially important for determining subtype membership overall. In addition, lower frequency was relatively more important for distinguishing depression comorbid with generalized anxiety (Subtype 3) whereas higher frequency was relatively more important for distinguishing fear-related anxiety (Subtype 2). Although of lesser relative importance, PNN50 contributed to distinguishing the combined presence of generalized and fear-related anxiety (Subtype 1).
Notably, the addition of circuit score information substantially boosted the accuracy of the predictive model (Figure 4). Over and above the ratio of LF/HF, dysfunction of both salience and positive affect reward circuits made important contributions to subgroup differentiation, with salience dysfunction most relevant to generalized and fear anxiety (Subtype 1) and reward circuit dysfunction to Depression (Subtype 2). Since these circuit dysfunctions have previously been implicated in anxiety and blunted emotion forms of depression, 11 our illustrative findings raise the possibility that specific stress markers may map on to specific markers of underlying neural dysfunctions to determine clinical symptom phenotypes. Negative affect circuit dysfunction, involving the amygdala, contributed in particular to Subtype 3 in addition to the low frequency HRV marker. As a further complement to these findings, when the predictive models were run stratified by each subgroup, it was apparent that, along with the HRV LF/HF and frequency markers, salience dysfunction was most important for Subtype 1, positive affect reward dysfunction for Subtype 2 and negative affect circuit dysfunction for Subtype 3 (Figure 5).
Limitations
In this scoping review we faced the main limitation of any review of multiple physiological measures of stress; the difficulty in comparing results across the variety of different methodologies and techniques. In addition, we focused on meta-analyses in our literature search to synthesize a broad picture of the field, and in doing so, we may have missed important individual studies. There are also gaps in the literature, such as the lack of meta-analytic studies and systematic reviews investigating skin conductance (or EDA) in relation to anxiety disorders. In addition, not all meta-analyses investigated sex differences, and further investigation would be necessary to draw conclusions regarding sex differences based on the findings from the scoping review. Lastly, none of the meta-analyses reviewed reported on race or ethnicity, which are important considerations that should be included in future work on markers of depression and anxiety, especially as accuracy of optical sensors, such as those used to measure heart rate, can vary when tested on diverse skin tones. 95
A further limitation seeking to integrate findings across studies is the variation in the characteristics of each sample. The samples included in the meta-analyses reviewed here also include participants who are both medicated and unmedicated and who are at different phases of illness, through to remitted. This situation is compounded by the inherent limitations of the current diagnostic classifications for both anxiety and major depressive disorders. The diagnostic criteria for these disorders are broad and highly heterogenous within categories, such that two participants may share only a few symptoms, but both meet diagnostic criteria. Our illustration offers one way forward to parse the heterogeneity of symptoms across anxiety and depression and attempt to form coherent subgroups based on symptoms and then determine if these subgroups are predicted by coherent profiles of physiological stress markers and whether neural circuit information adds to the accuracy of prediction.
Conclusion
Across meta-analytic studies there is general consensus that physiological markers of stress characterize states of depression and anxiety, indicative of maladaptive responses to stress in these states. A generally consistent finding is of reduced heart rate variability in both depression and anxiety, most apparent in the high frequent domain for anxiety and in both domains and for the ratio of high to low frequency in depression. The picture for cortisol is more mixed, with meta-analyses providing evidence for both heightened and reduced cortisol reactivity in depression and anxiety. In regard to cortisol level, assessed using both peak and area under the curve measures, the most consistent evidence is for heightened cortisol in depression, including in older adults with depression. There is an absence of studies of skin conductance in anxiety. In depression, skin conductance tends to be reduced, both tonically and phasically, and latency of skin conductance responses are slowed. Several factors may contribute to the heterogeneity of study findings, including the phase of illness, medication and age. Our illustrative data also highlight how, because of the heterogeneity inherent to the diagnoses of depression and anxiety may, more precise relationships between specific physiological stress markers and specific symptom phenotypes may be conflated. Thus, an exciting avenue for future research in the field is to adopt some of the approaches used in developing a precision medicine for psychiatry; for example, to parse individual symptoms and evaluate if more specific symptom subtypes and dimensions are characterized by more specific profiles of maladaptive response to stress. Our illustration also highlights the potential value of including additional biological markers, such as neural circuits implicated in depression and anxiety and impacted by chronic stress. Elucidating the detailed relationships between physiological stress markers, neural circuit dysfunction and resulting symptoms would advance our understanding of the pathophysiological pathways underlying depression and anxiety and bring us closer to an objective means to detect these conditions earlier, including states of risk prior to the development of an overt clinical disorder.
Future Directions
Considerable work is needed to further elucidate the precise relationships between physiological markers of stress and specific clinical presentations of depression and anxiety. Larger studies are needed with standardized patient groups in regard to phase of illness, age, sex, and unmedicated status. It would also be important for studies to assess multiple physiological markers in the same study so as to determine if specific profiles of markers characterize particular symptom dimensions. At a more fundamental level there is a significant gap in meta-analytic knowledge about skin conductance markers of anxiety that could be filled in a future meta-analysis focused on this topic. A striking observation from the meta-analytic studies we reviewed is that they have for understandable reasons focused on lab-based measures of physiology and thus rely on either a single time point of measurement or a limited number of measurements over time. Given the relapsing, remitting course of depression and anxiety, and the physiological changes that may occur in risk states due to chronic stress but prior to the onset of manifest symptoms, it is imperative that future studies make use of new technologies to provide more fine-grained physiological measurement. Furthermore, given the psychological nature of the appraisal of stress, these measurements should be complemented with contextual information that can provide the fine-grained mediating information to better explain the potential differences across individuals that evolve towards mental disorders and those that show resilience. This kind of information is enabled by the evolution of ubiquitous computing systems that capture not only the expected stress measurements but also information about the environment, productivity, and workflow agendas, among others.
Supplemental Material
sj-pdf-1-css-10.1177_24705470211000338 - Supplemental material for Stress Markers for Mental States and Biotypes of Depression and Anxiety: A Scoping Review and Preliminary Illustrative Analysis
Supplemental material, sj-pdf-1-css-10.1177_24705470211000338 for Stress Markers for Mental States and Biotypes of Depression and Anxiety: A Scoping Review and Preliminary Illustrative Analysis by Megan Chesnut, Sahar Harati, Pablo Paredes, Yasser Khan, Amir Foudeh, Jayoung Kim, Zhenan Bao and Leanne M. Williams in Chronic Stress
Supplemental Material
sj-zip-2-css-10.1177_24705470211000338 - Supplemental material for Stress Markers for Mental States and Biotypes of Depression and Anxiety: A Scoping Review and Preliminary Illustrative Analysis
Supplemental material, sj-zip-2-css-10.1177_24705470211000338 for Stress Markers for Mental States and Biotypes of Depression and Anxiety: A Scoping Review and Preliminary Illustrative Analysis by Megan Chesnut, Sahar Harati, Pablo Paredes, Yasser Khan, Amir Foudeh, Jayoung Kim, Zhenan Bao and Leanne M. Williams in Chronic Stress
Footnotes
Declaration of Conflicting Interests
The author(s) declared the following potential conflicts of interest with respect to the research, authorship, and/or publication of this article: LMW declares patents 62/589,452 & 15/820, 338. Systems & Methods for Detecting Complex Networks in MRI Image Data that are not directly related to this research.
Funding
The author(s) disclosed receipt of the following financial support for the research, authorship, and/or publication of this article: authors LMW, ZB and PP received support for the research from the Stanford Catalyst for Collaborative Solutions. Neural circuit and symptom data were acquired with support from the National Institute of Mental Health: MH1010496.
Supplemental material
Supplemental material for this article is available online.
References
Supplementary Material
Please find the following supplemental material available below.
For Open Access articles published under a Creative Commons License, all supplemental material carries the same license as the article it is associated with.
For non-Open Access articles published, all supplemental material carries a non-exclusive license, and permission requests for re-use of supplemental material or any part of supplemental material shall be sent directly to the copyright owner as specified in the copyright notice associated with the article.