
Abstract
Background
With increasing life expectancy, dietary choices are crucial for healthy aging.
Objective
This study investigates associations between two dietary indices, the energy-adjusted Dietary Inflammatory Index (E-DII) and the healthful Plant-based Diet Index (hPDI), and biomarkers related to metabolic health and micronutrient status, focusing on the mediating role of gut microbiota.
Methods
We conducted a secondary, exploratory analysis of baseline data from 129 community-based participants aged ≥70 years (median age: 75 years). Dietary indices were calculated from 3-day food protocols, and biomarkers were measured in blood samples. Cognitive and physical function were assessed using validated questionnaires, body composition was determined via bioimpedance, and fecal gut microbiota composition through 16S rRNA gene sequencing. Statistical analyses included multiple linear regression models, Permutational Multivariate Analysis of Variance, and mediation analysis.
Results
We found no significant associations between the indices and gut microbiota diversity. However, red blood cell (RBC) folate and serum uric acid were significantly associated with E-DII (stand. β = −0.32 and 0.23, respectively, p < 0.01 and 0.01) and contributed to microbiota composition variance (R2 = 0.01, Q = 0.21). Specific genera correlated with serum uric acid (Oscillibacter: coefficient = −0.01, Q = 0.24, Gemmiger: coefficient = −0.02, Q = 0.23) and RBC folate (Bacteroides: coefficient = 0.03, Q = 0.22), independent of dietary patterns.
Conclusions
This study suggests that gut microbiota composition does not mediate the associations between a healthy plant-based or anti-inflammatory diet and metabolic health markers in a healthy, older population. However, microbial genera were associated with uric acid and folate concentrations independent of the investigated dietary patterns, indicating potential roles in folate and uric acid metabolism.
Keywords
Introduction
Rising life expectancy in recent decades has increased the need to address age-related health challenges. 1 Promoting healthy aging, defined as preserving physical and cognitive function while extending lifespan, 2 is essential to combat diseases such as sarcopenia and cognitive decline, osteoporosis, kidney diseases, cancer, type 2 diabetes mellitus (T2DM), and cardiovascular diseases (CVDs). 3
Understanding the substantial role of diet as a modifiable factor influencing overall health is central to achieving healthy aging. Therefore, assessing dietary patterns and their impact on health is imperative for developing effective interventions. This study focused on two distinct dietary patterns: the inflammatory potential of the diet, as assessed by the energy-adjusted Dietary Inflammatory Index (E-DII), and a healthy plant-based dietary pattern, captured by the healthful Plant-based Diet Index (hPDI). The DII and its energy-adjusted version, the E-DII, developed by Shivappa et al., are well-established indices to assess the inflammatory potential of dietary components.4,5 They have been validated for their association with several inflammatory markers6–8 and metabolic and cardiovascular risk factors. 9 Recent research has linked the DII with the risk of sarcopenia and age-associated adverse effects such as disability and frailty in older populations. 10 Similarly, the hPDI, assessing the quality of a plant-based diet, has been associated with age-related ailments, including obesity, 11 cardiovascular events, 12 kidney disease, 13 and T2DM. 14
Gut microbiota play a crucial role in healthy aging and, conversely, are influenced by age-related physiological changes in the gastrointestinal tract alongside environmental factors. The gut microbiota of older individuals display a reduced microbial diversity, a decrease in short-chain fatty acid-producing bacteria, and changes in dominant bacterial genera, which can impact overall health. 15 Diet affects gut microbiota characteristics across different age groups, including older adults. 16 While research has linked diet patterns like the Mediterranean diet to health outcomes and gut microbiota composition, 17 studies particularly examining the relationship between the E-DII, hPDI, and microbiota in aging populations are limited. The Multiethnic Cohort–Adiposity Phenotype Study observed positive associations between the DII and total fat mass, mediated by specific bacterial taxa in a population aged 60–77 years. 18 Shen et al. reported that a diet rich in healthy plant-based foods positively correlates with microbiota alpha diversity and a higher abundance of polysaccharide-degrading bacterial species in an older population. 19
Given the limited number of studies exploring the correlation between E-DII or hPDI, gut microbiota, and health parameters within a healthy older population, our study aims to investigate associations between the diet indices and the composition of the gut microbiome. Additionally, we explore the potential involvement of the gut microbiota in mediating the relationships of the E-DII and hPDI with various markers associated with age-related ailments. Our study population focuses on home-dwelling individuals without severe pre-existing chronic conditions, allowing us to prioritize preventive measures for promoting healthy aging. By employing two indices with different focuses and assessing a broad range of health parameters, our study aims to provide insights into the interplay among diet, gut microbiota, and overall health in older adults.
Methods
Study design and participants
This study presents a secondary, exploratory cross-sectional analysis of baseline data from a double-blind, randomized, placebo-controlled trial conducted at the Institute of Food and One Health, Leibniz University of Hanover, Germany. The primary aim of the original trial was to evaluate and improve the status of essential nutrients in older adults. The trial included 134 home-dwelling participants aged ≥70 years. Full details of the study design and participants have been published elsewhere.20,21 Eligibility was determined through a phone interview, excluding individuals with a BMI >35 kg/m2, severe gastrointestinal or cardiovascular diseases, or those on immunosuppressants or chronic corticosteroids. Eligible participants attended a comprehensive clinical examination day, which included blood sampling, anthropometric measurements, and the completion of health questionnaires. Additionally, participants were instructed to provide a stool sample and complete a 3-day food diary in the week preceding the clinical examination.
The study adhered to the guidelines of the Declaration of Helsinki (revised version, October 2008, Seoul, South Korea) and was registered in the German Clinical Register (DRKS00021302). Written informed consent was obtained from all participants prior to their enrollment.
This present analysis includes data from 129 participants who provided a fecal sample before the start of the intervention (Figure 1). Flowchart of the study population. E-DII: energy adjusted Dietary Inflammatory Index; hPDI: healthful Plant-based Diet Index.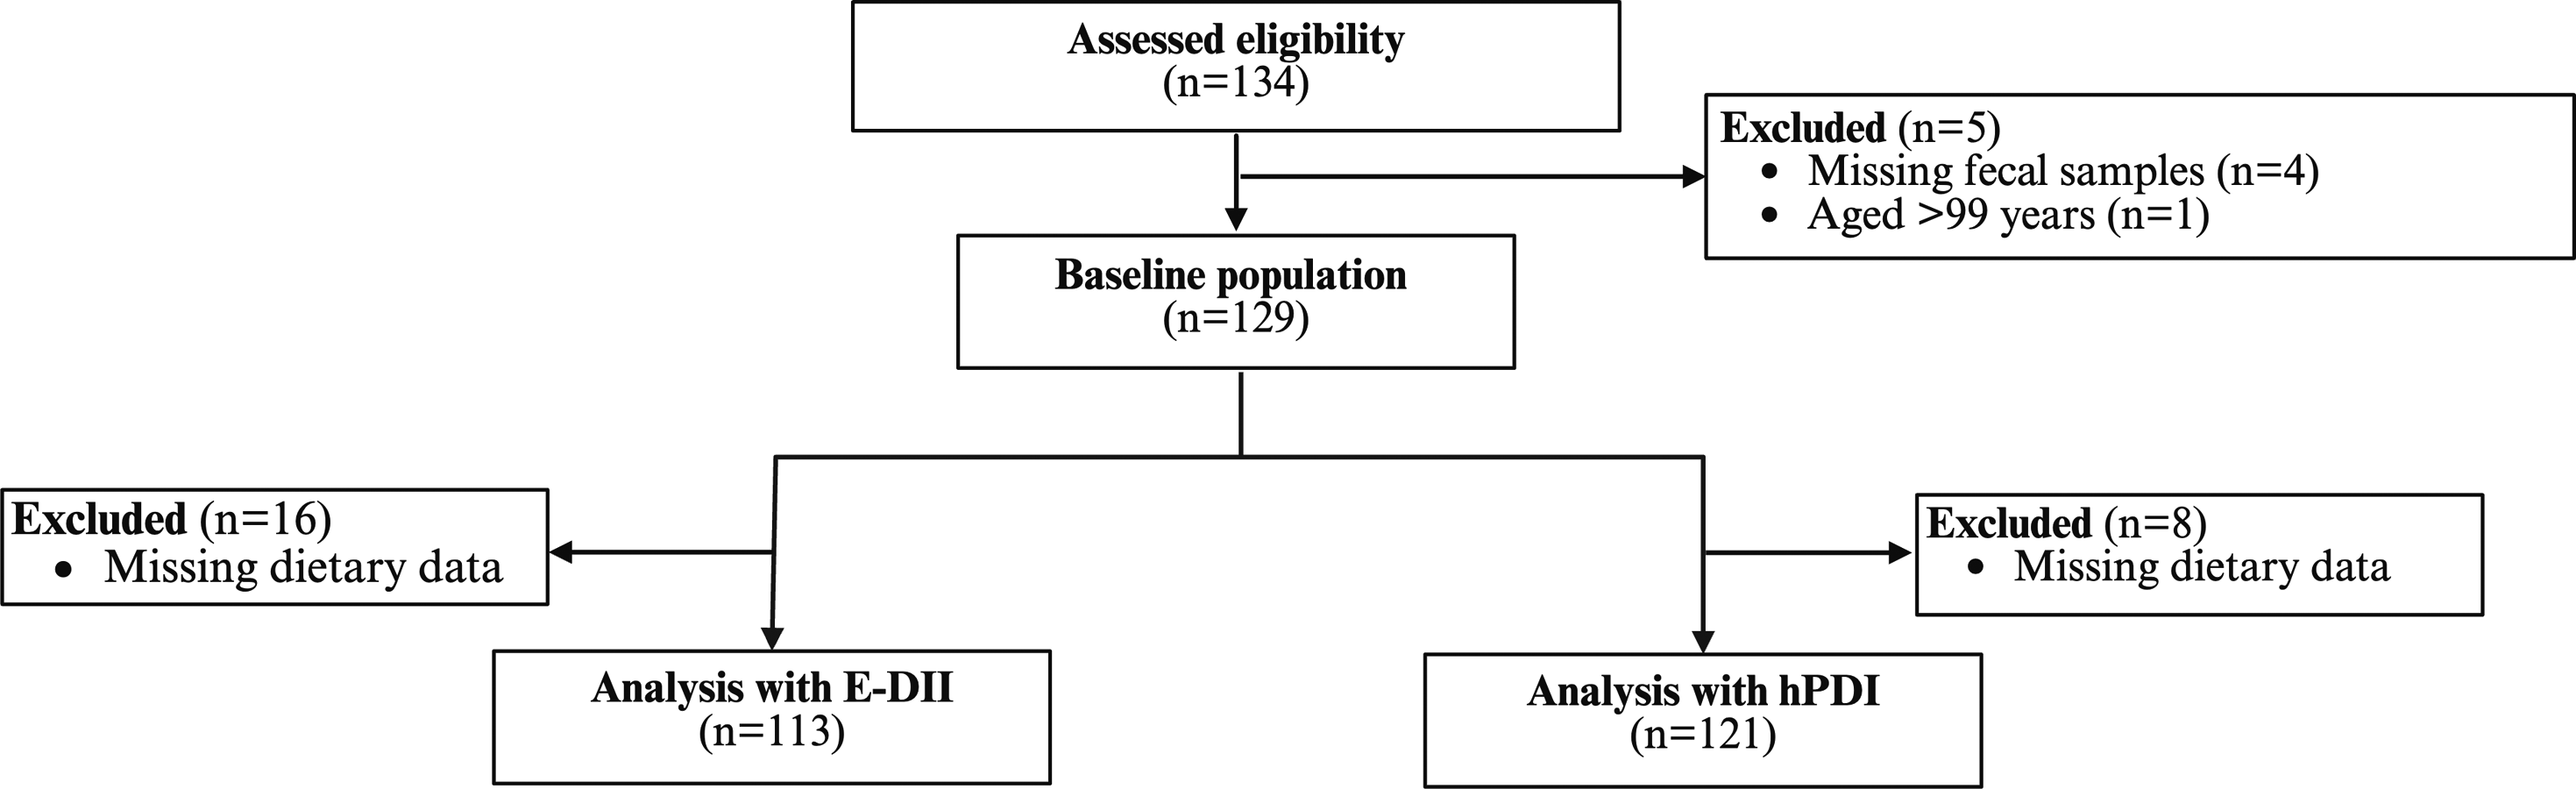
Clinical investigation day
On the clinical investigation day, participants arrived fasted (no food and caloric drinks for at least 12 hours prior) at the university. Blood samples were collected through venipuncture of the arm vein using Safety-Multifly® needles (Sarstedt, Nümbrecht, Germany). All samples were promptly stored at approximately 5°C and transferred to external laboratories on the same day or stored at −80°C for subsequent analyses. After the blood draw, measurements of body weight and height (Seca GmbH & Co. KG, Hamburg, Germany), waist and hip circumferences, and body composition were conducted. Analyses of body composition included fat mass (FM), lean body mass (BLM), total body water (TBW), and phase angle (PA), using an eight-point bioelectrical impedance analyzer (BIA, mBCA525, Seca Company, Hamburg, Germany). Participants completed a questionnaire regarding their medical history, medication use (frequency and dosage), and present health status. An optional assessment for cognitive impairment was conducted using the Saint Louis University Mental Status examination (SLUMS). 22 Physical function was evaluated using the Physical Functioning Scale of the 36-Item Short-Form Health Survey (SF-36). 23
Dietary intake and dietary indices
Participants documented their dietary intake through 3-day food protocols, encompassing two consecutive weekdays and one weekend day. A trained nutritionist analyzed the recorded dietary information using PRODI6.4® dietary software, aligning with the German Federal Food Code 3.02 by Nutri-Science GmbH in Freiburg, Germany. To assess distinct dietary patterns, we chose two indices: the energy-adjusted Dietary Inflammatory Index (E-DII) and the healthful Plant-Based Diet Index (hPDI).
E-DII
The DII is a population-based dietary index developed from existing literature to quantify the overall inflammatory potential of an individual’s diet. Detailed information about the development and scoring algorithm is available elsewhere.4,5 To calculate the DII for each participant, food and nutrient intake data from dietary protocols were linked to the corresponding inflammatory effect scores designated in the DII. A z-score was created for each food component and converted to a centered proportion score. We employed 30 out of a potential 45 components to derive the DII score for our analytical purposes. The included parameters were alcohol, vitamin B12, vitamin B6, β-carotene, caffeine, carbohydrate, cholesterol, energy, total fat, fiber, folate, iron, magnesium, monounsaturated fatty acid (MUFA), niacin, omega-3 fatty acid, omega-6 fatty acid, onion, protein, polyunsaturated fatty acid (PUFA), riboflavin, saturated fat, thiamin, vitamin C, vitamin D, vitamin E, zinc, and green/black tea. Recognizing the link between overall energy consumption and inflammation, we applied the nutrient residual model described by Willet et al. 24 to adjust the nutrient intake date for energy, thereby calculating the E-DII. A higher E-DII score indicates a more pro-inflammatory diet, while a lower score suggests a diet with a more anti-inflammatory profile.
hPDI
The hPDI was calculated according to Satija et al. 25 Food items were grouped into 18 groups based on nutritional and culinary similarities by summing intakes of all food items in each food group. Groups were divided into healthy plant foods (e.g., whole grain, fruits, and vegetables), less healthy plant foods (e.g., sugar-sweetened beverages or refined grains), and animal food groups (e.g., animal fats, dairy, and eggs). The food groups (servings/day) were categorized into quintiles, and each quintile was assigned a score between 1 and 5. Participants received a score of 1–5 for each healthy plant food group (1 for the lowest quintile, 5 for the highest), and a reversed score for animal and unhealthy plant food groups (1 for the highest quintile, 5 for the lowest). The scores were summed across the 18 food groups to derive the hPDI score, ranging from 18 to 90. A higher hPDI score reflects a higher intake of healthy plant-based foods, a lower intake of animal products, and less healthy plant-based food. 25
Biochemical analysis
The analytical procedures for 25-hydroxycholecalciferol (25-(OH)D), holotranscobalamin (holoTC), homocysteine, and red blood cell (RBC) folate were conducted according to the methodologies outlined in the works of Kerlikowsky et al. 20 and Savic-Hartwig et al. 21 Glucose, creatinine, uric acid, triglycerides, high-density lipoprotein (HDL), low-density lipoprotein (LDL), and cholesterol concentrations were determined using a photometric method (Beckman Coulter GmbH, Krefeld, Germany). HbA1c analysis was performed using high-pressure liquid chromatography (Bio-Rad Laboratories GmbH, Feldkirchen, Germany). Ferritin concentration was assessed using the chemiluminescence immunoassay method (CLIA) with DXI800 instrumentation (Beckman Coulter GmbH, Krefeld). Transferrin and CRP levels were measured using turbidimetry (Beckman Coulter GmbH, Krefeld). Insulin concentrations were determined employing the electrochemiluminescence immunoassay method (ECLIA) with cobas 801e instrumentation (Roche Diagnostics GmbH, Mannheim, Germany). The Omega-3 index (O3I) was determined by calculating the sum of eicosapentaenoic acid (EPA) to docosahexaenoic acid (DHA) in total red blood cell membranes relative to total fatty acid content, using dry blood spots and gas chromatography in a certified laboratory (OmegaQuant Analytics, Sioux Falls, SD, USA). Further methodological details are described elsewhere. 26
Fecal sample collection and 16S rRNA gene sequencing
Stool samples were collected at home before the examination using a fecal collection kit from Süsse Labortechnik, Gudensberg, Germany. The collection tubes contained 3.5 mL of RNASepar stabilizer. Upon arrival at the university, fecal samples were promptly stored at −80°C. Participants documented stool consistency using the Bristol Stool Chart (BSC). 27 DNA was extracted using the ZymoBIOMICS Miniprep Kit (ZYMO, USA). Amplification of the V3/V4 region and sequencing on Illumina MiSeq (2 × 300 bp) were conducted as previously described. 28 Sequences were processed via the DADA2 pipeline (v1.20) and annotated based on RDP’s taxonomy. Chimera was eliminated, and sequences with counts ≥5 that were annotated at the phylum level were included in follow-up analyses. All raw data are available at the European Nucleotide Archive (PRJEB74908).
Statistical analysis
Justification of sample size
The sample size for the original randomized controlled trial was based on multiple nutritional biomarkers (RBC folate, 25(OH)D, holoTC, O3I), with the parameter requiring the largest sample size used for the calculation. Assuming a two-sided significance level of 0.05, a statistical power of 80%, and a 10% dropout rate, 120 participants (60 per group) were required. For this exploratory secondary analysis, the sample size of 129 participants reflects those who met the inclusion criteria and provided fecal samples at baseline.
Associations between diet indices and health outcomes
We examined associations between E-DII and hPDI and health outcomes using multiple linear regression models with the lm() function in R. Separate regression analyses were conducted for each diet index, with the continuous dietary score as the independent variable and health outcomes as the dependent variables, adjusting for the potential covariates age, sex, BMI, and medication use. Medication use was included as a categorical variable, categorized into the following groups: no medication, antihypertensives, statins, proton pump inhibitors, other medications, or polypharmacy (use of five or more different medications). Participants were instructed to discontinue supplement intake 3 months before the baseline assessment, as supplementation was an exclusion criterion. However, we included pre-study supplement use as a covariate for some models to account for potential washout or carry-over effects. Models including ferritin, transferrin, RBC folate, holoTC, methylmalonic acid, 25-(OH)D, or the O3I were further adjusted for supplementation specific to each nutrient. Also, models, including serum uric acid, were further adjusted for dietary purine intake. To validate the regression models, we scrutinized the assumptions by inspecting regression diagnostic plots created with the fundamental R function plot(). Where assumptions for the regression models were not met, we transformed variables using the natural logarithm (ln) with the log() function in R. We calculated standardized beta coefficients for regression models utilizing the betaDelta package (version 1.0.5). 29 p-values <0.05 were considered statistically significant.
Associations between dietary indices, health outcomes, and gut microbiota composition
We processed the gut microbiota data using the absolute abundance table of amplicon sequencing variants (ASVs) and analyzed sequences matched to taxa and health outcomes through the mia package (version 1.11.1). 30 We assessed alpha diversity using the Shannon diversity index 31 and phylogenetic diversity using the Faith index. 32 Associations between alpha diversity and dietary indices were analyzed using linear regression models. We explored beta diversity through principle coordinate analysis (PCoA) on relative abundances employing the Bray-Curtis index. The quantification of relationships with beta diversity was estimated using Permutational Multivariate Analysis of Variance (PERMANOVA) with the vegan package. 33 Based on Bray-Curtis dissimilarity, the proportion of variation in taxonomy explained by diet indices, dietary factors, biomarkers, and covariates was measured using PERMANOVA. We calculated Q-values using the false discovery rate (FDR) according to the Benjamini-Hochberg method. 34 In line with other explorative microbiome studies, a Q-value <0.25 was considered statistically significant due to high dimensionality and variability of microbiota data. 35
To investigate associations among taxa abundances, diet indices, and health outcomes, we employed Multivariate Association with Linear Models (MaAsLin2) (version 1.16.0). 36 Samples were filtered to encompass a minimum prevalence of 10% of the total samples, with a minimum relative abundance of 1%. The analysis employed default settings within MaAsLin2, and statistical significance was ascribed to Q-values <0.25, following the original default recommendation. 36 We visualized coefficients obtained from the MaAsLin2 analysis in a heatmap using the pheatmap package (version 1.0.12.). 37
Mediation analysis
We conducted a mediation analysis using the Mediation package (version 4.5.0) to explore whether the observed associations between dietary patterns and health outcomes were mediated by specific microbial genera.
38
In essence, mediation analysis aims to elucidate the mechanisms through which an exposure variable (X) influences the outcome variable (Y) by considering a set of potential mediators (M) (Figure 2). We used the relative abundance of gut microbiota genera normalized by CLR transformation. For all models, we report two key measures: the average causal mediation effect (ACME) and the average direct effect (ADE). The ACME indicates the average magnitude of the effect of dietary patterns on health outcomes mediated by the presence of specific microbiota genera. An ACME p-value of <0.05 indicates a statistically significant effect of dietary patterns on health outcomes mediated by gut microbiota genera. The ADE represents the direct impact of dietary patterns on metabolic biomarkers considering the microbiota. Mediation model: The relation between dietary indices and metabolic biomarkers through the indirect effect of gut microbiota genera.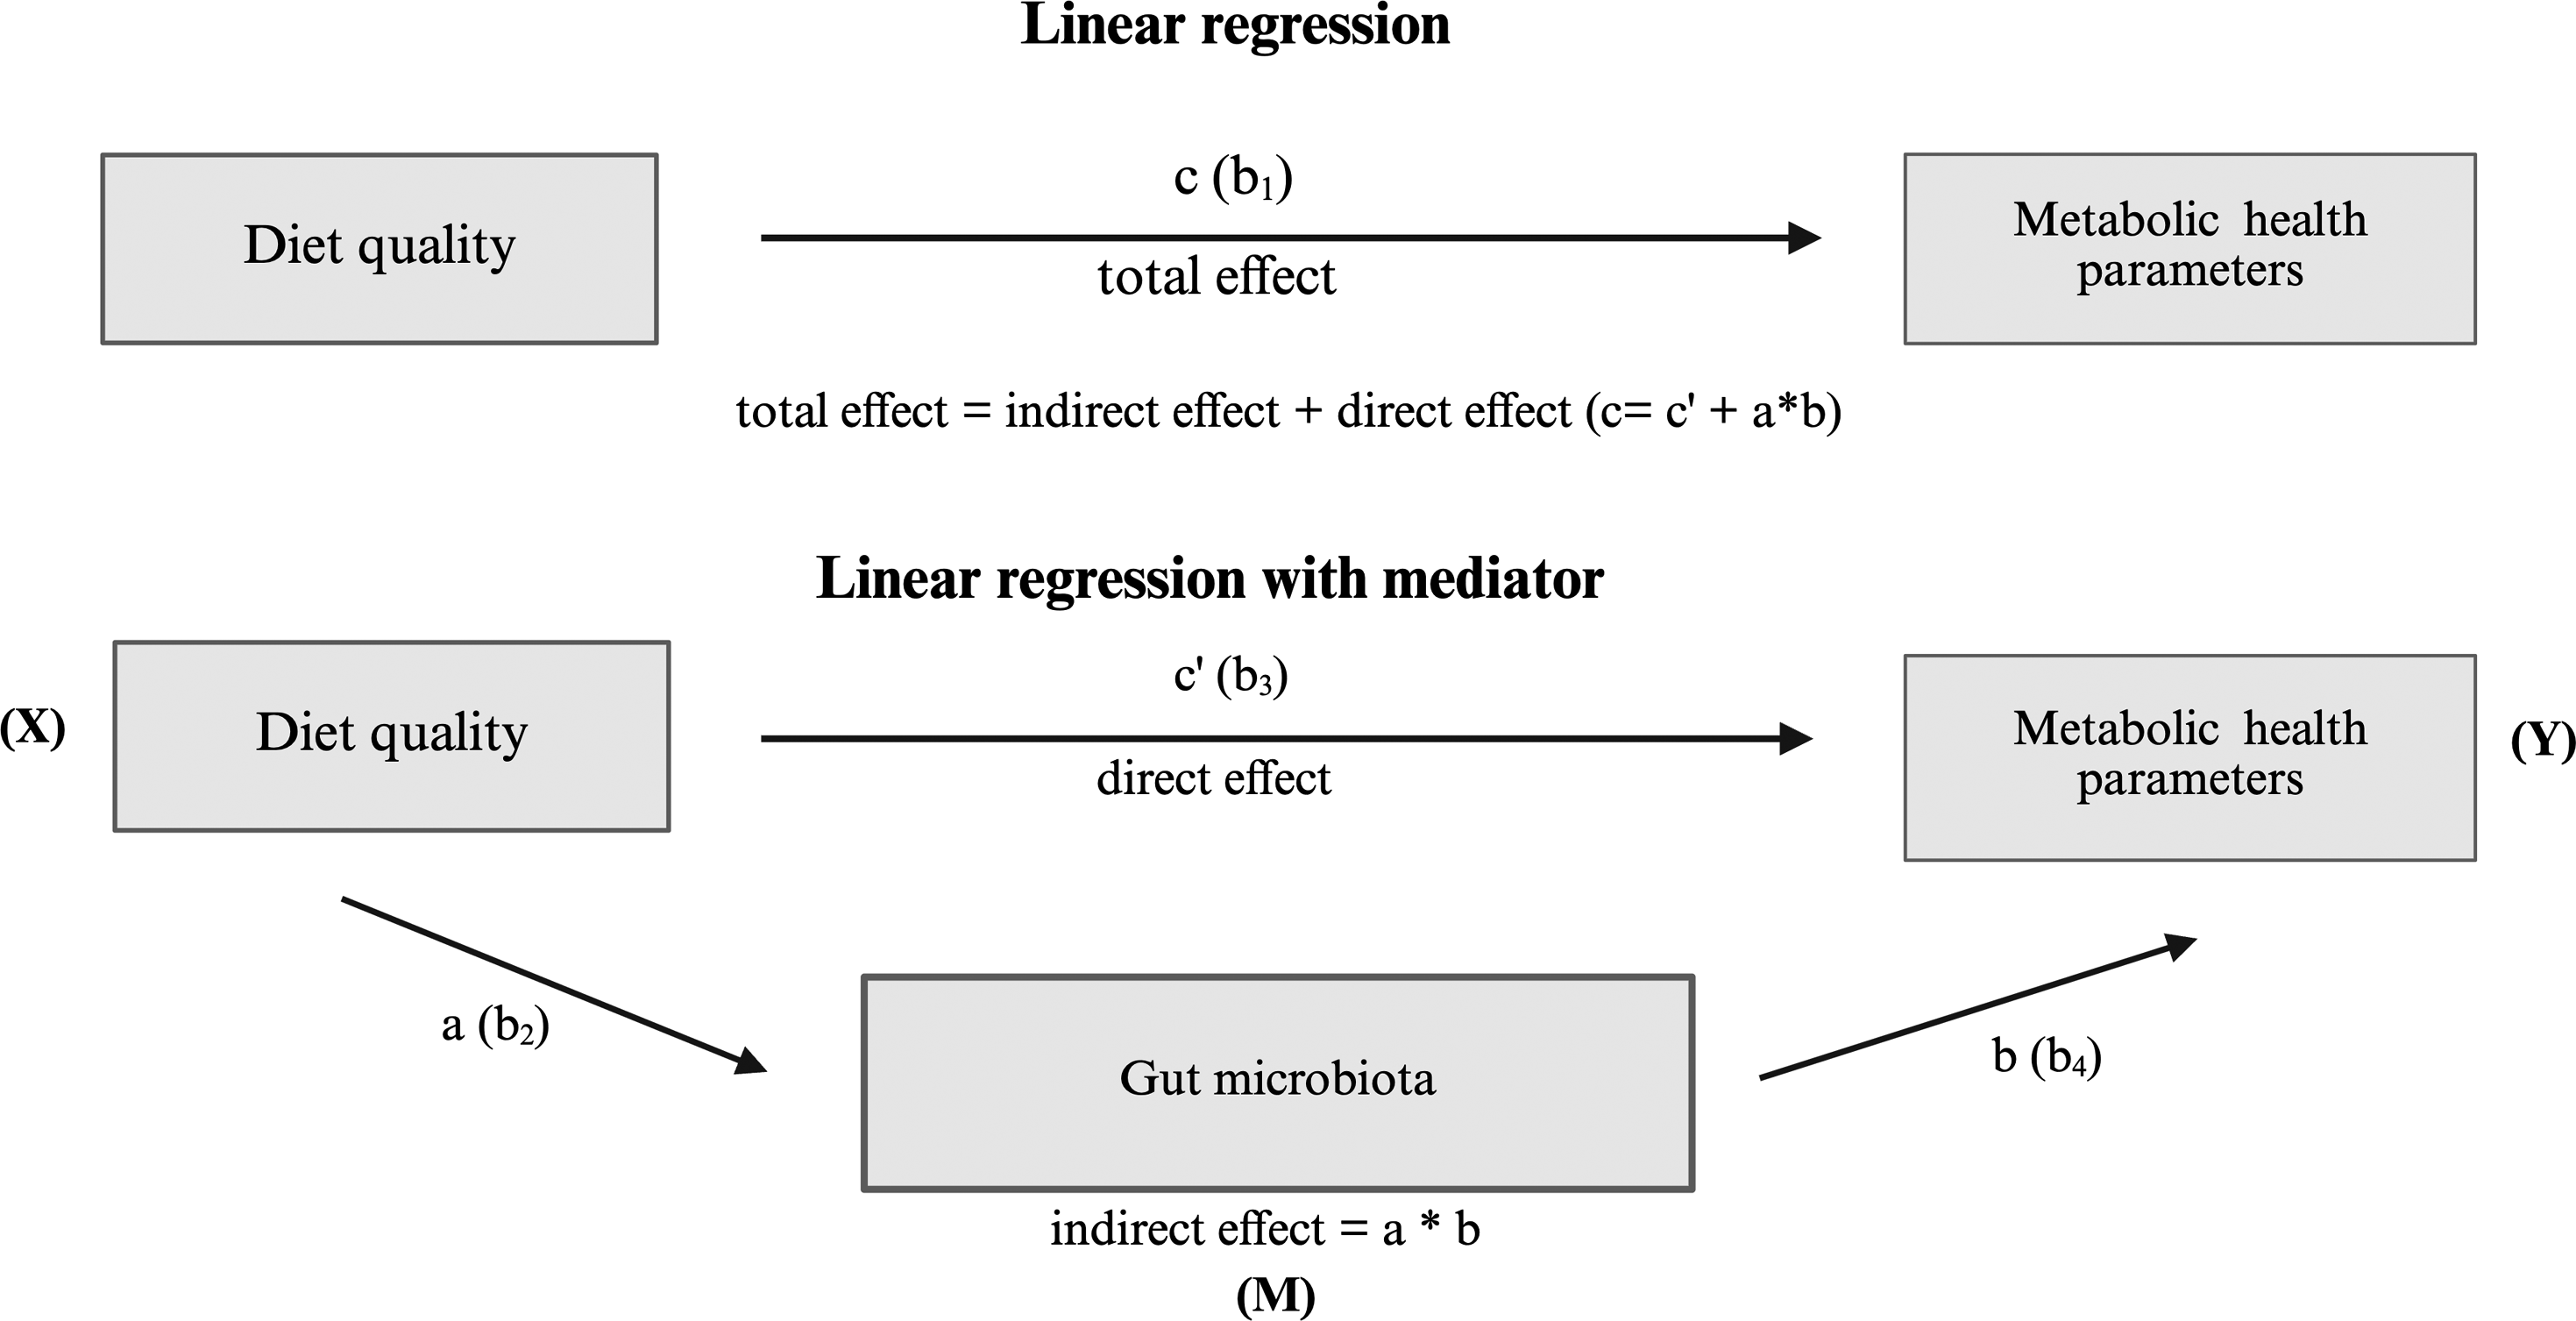
All analyses, including microbiome data, were adjusted for the same covariates as the models examining associations between the indices and health markers, with the additional adjustment for BSC. Visualizations were created using the ggplot2 package (version 3.4.4). 39 All statistical analyses were performed in the R programming language (version 4.3.2). 40
Results
Characterization of the study population
A total of 134 eligible participants were enrolled in the study, with five individuals subsequently excluded due to the lack of fecal samples. One participant aged 100 years was further excluded from the analyses due to extreme outlier status within our predominantly 70- to 80-year-old cohort, which disrupted statistical models. The final cohort comprised 129 participants, 36 males and 93 females. Sixteen participants were excluded from the calculation of E-DII and eight from the hPDI calculation due to incomplete dietary data (Figure 1).
Detailed anthropometric, demographic, lifestyle, and health behavior characteristics of the baseline study population have been comprehensively documented and reported by Kerlikowsky et al. 20 Supplemental Table 1 provides additional characterization of the study population concerning the metabolic health markers and dietary indices used in this study. The median and interquartile range (IQR) for E-DII was 0.17 (−0.62, 1.13), and for hPDI 56 (50, 60). Linear regression analysis showed a strong negative correlation between E-DII and hPDI (β = −0.55, 95% CI: −1.57, 0.47, p < 0.001).
Associations between diet indices and health biomarkers
Associations between dietary indices, main characteristics, and metabolic biomarkers.
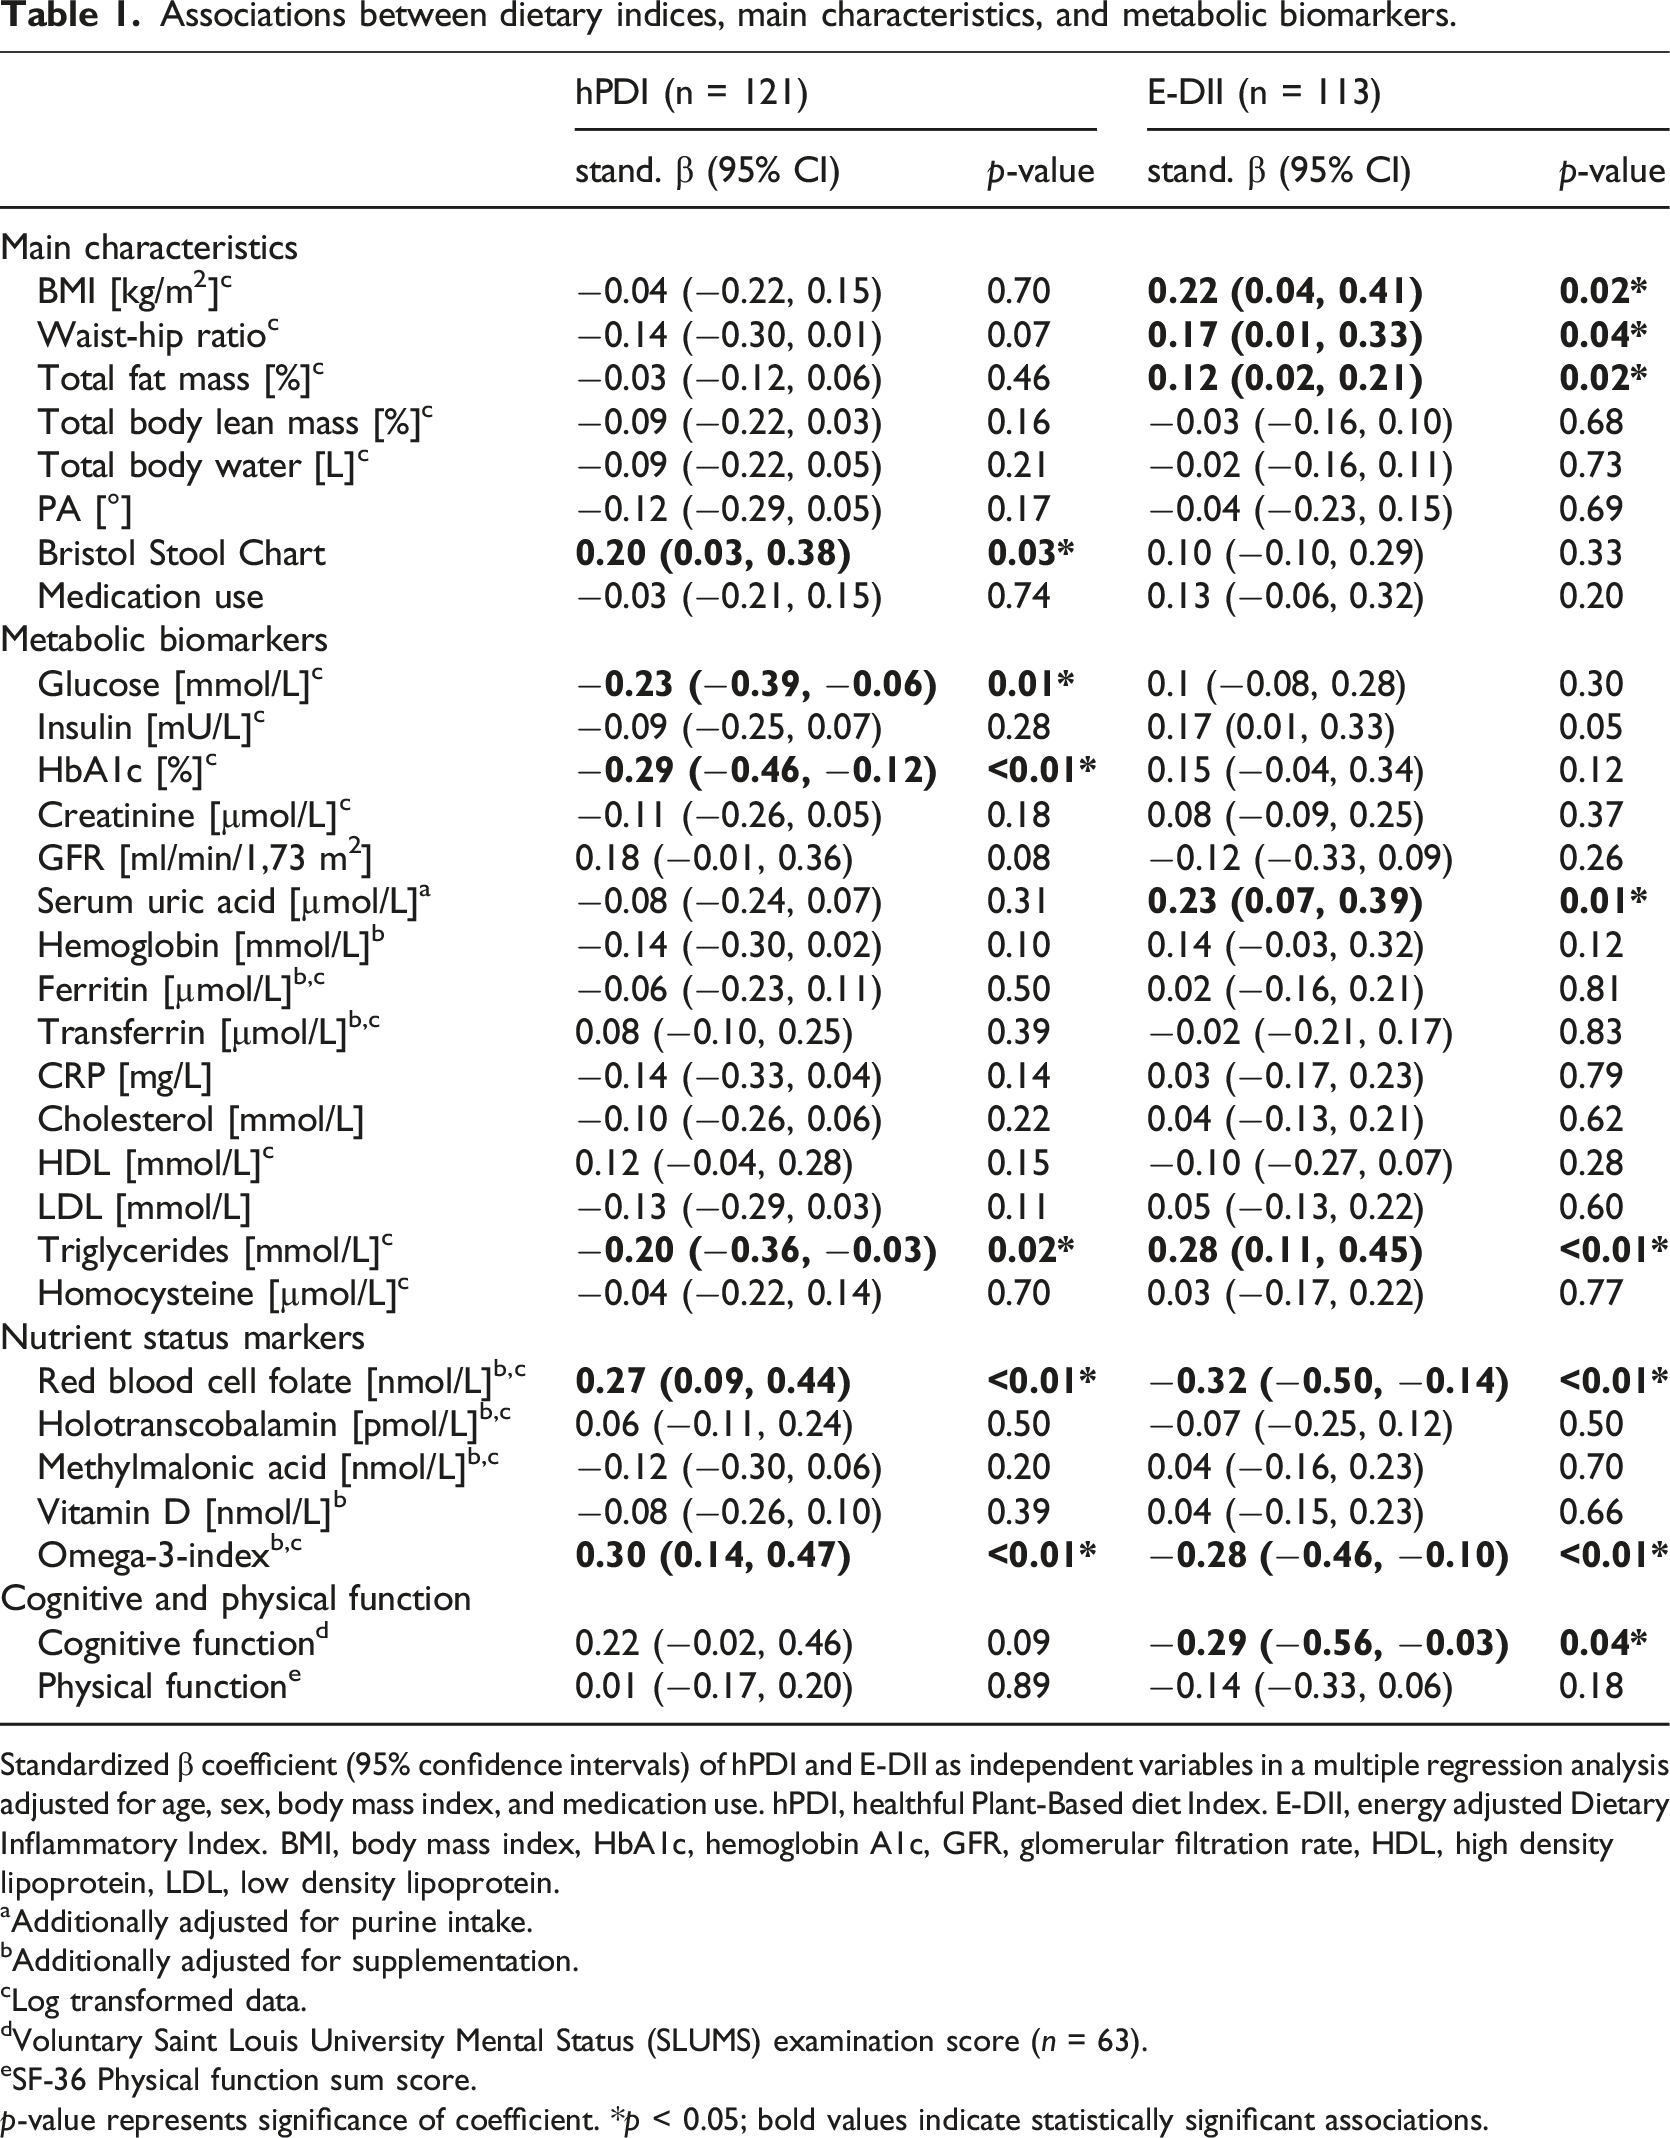
Standardized β coefficient (95% confidence intervals) of hPDI and E-DII as independent variables in a multiple regression analysis adjusted for age, sex, body mass index, and medication use. hPDI, healthful Plant-Based diet Index. E-DII, energy adjusted Dietary Inflammatory Index. BMI, body mass index, HbA1c, hemoglobin A1c, GFR, glomerular filtration rate, HDL, high density lipoprotein, LDL, low density lipoprotein.
aAdditionally adjusted for purine intake.
bAdditionally adjusted for supplementation.
cLog transformed data.
dVoluntary Saint Louis University Mental Status (SLUMS) examination score (n = 63).
eSF-36 Physical function sum score.
p-value represents significance of coefficient. *p < 0.05; bold values indicate statistically significant associations.
Microbiota composition in relation to dietary indices and metabolic biomarkers
No significant associations were found between the dietary indices and the alpha diversity index Shannon (E-DII: β = −0.02, 95% CI: −0.20, 0.17, p = 0.86; hPDI: β = 0.00, 95% CI: −0.18, 0.18, p = 1.00), or the phylogenetic diversity index Faith (E-DII: β = 0.02, 95% CI: −0.17, 0.21, p = 0.84; hPDI: β = −0.03, 95% CI: −0.21, 0.14, p = 0.73) after adjusting for age, sex, BMI, BSC, and medication use (Supplemental Figure 1). Gut microbiota composition estimated by Bray Curtis dissimilarity revealed no significant variations across the dietary indices (E-DII: R2 = 0.01, Q = 0.34; hPDI: R2 = 0.01. Q = 0.25) (Figure 3(a) and (b)). Principle coordinate analysis (PCoA) of all samples using Bray-Curtis dissimilarity and quantified by Permutational Multivariate Analysis Of Variance (PERMANOVA). (a) PCoA based on energy adjusted Dietary Inflammatory Index. (b) PCoA based on healthful Plant-based Diet Index. (c) Proportion of variation in taxonomy explained by diet indices, dietary factors, biomarkers and covariates measured by PERMANOVA (based on Bray-Curtis dissimilarity). Analyses were adjusted for age, sex, BMI, medication use, and Bristol Stool Chart. E-DII: energy adjusted Dietary Inflammatory Index; hPDI: healthful Plant-based Diet Index; HbA1c: hemoglobin A1c; BMI: body mass index. 1Voluntary Saint Louis University Mental Status (SLUMS) examination score (n = 63). 2Additionally adjusted for energy intake. 3Additionally adjusted for purine intake. 4Additionally adjusted for supplementation. Q-values were calculated based on Benjamini-Hochberg method with a target rate of 0.25. *Q < 0.25.
While neither E-DII nor hPDI emerged as major drivers of overall variation in the gut microbiota, PERMANOVA analysis indicated that specific dietary factors significantly accounted for variance in microbiota composition. The consumption of the food groups nuts, whole grains, and sweets and desserts (R2 = 0.01, Q = 0.21) exhibited significant explanatory ability for microbiota composition after adjusting for age, sex, BMI, BSC, and medication use (Figure 3(c)). Further analyses focused on the metabolic parameters previously identified in the regression models as significantly correlated with dietary indices. Cognitive function (R2 = 0.02, Q = 0.21), serum uric acid (R2 = 0.01, Q = 0.21, RBC folate (R2 = 0.01, Q = 0.21), glucose (R2 = 0.01, Q = 0.21), and triglycerides (R2 = 0.01, Q = 0.21) were found to explain variation in microbiota composition significantly (Figure 3(c)). Additionally, several parameters included as confounders in our analysis significantly accounted for variance in microbiota composition, including BSC (R2 = 0.01, Q = 0.21), sex (R2 = 0.01, Q = 0.21), and BMI (R2 = 0.01, Q = 0.21) (Figure 3(c)). However, age (R2 = 0.01, Q = 0.28) and medication use (R2 = 0.01, Q = 0.81) did not exhibit significant explanatory ability (Figure 3(c)). The complete list of coefficients and Q-values from the PERMANOVA analysis is provided in Supplemental Table 2.
After identifying variables significantly associated with the dietary indices and contributing to variation in microbiota composition, we examined specific bacterial genera potentially correlating with these variables. Filtering for abundance (≥1%) and prevalence (≥10%) retained 52 genera for inclusion in linear mixed model analysis. Confounder-adjusted MaAsLin2 analysis did not reveal significant associations between the dietary indices and individual bacterial genera (Q > 0.25). However, we observed a positive correlation between the abundance of Roseburia and the consumption of sweets and desserts (coeff. = 0.01, Q = 0.19). Additionally, consumption of nuts positively correlated with Gemmiger abundance. Biomarker analysis indicated a lower Gemmiger (coeff. = −0.02, Q = 0.23) and Oscillibacter abundances (coeff. = −0.01, Q = 0.24) were associated with higher serum uric acid concentrations. Conversely, higher Bacteroides abundance correlated with higher RBC folate concentration (coeff. = 0.03, Q = 0.22) (Figure 4). Although whole grains, cognitive function, glucose, and triglyceride concentration were associated with beta diversity, these variables did not correlate with the relative abundance of bacterial genera when applying the prevalence and abundance filter and adjusting for confounders in the linear mixed model analysis (Q < 0.25). Coefficients and Q-values for MaAsLin2 models are provided in Supplemental Table 3. Relationships between, dietary patterns, microbial genera, and blood biomarkers. Heatmap colors represent coefficients from linear mixed models in MaAsLin2. Models adjusted for age, BMI, Bristol Stool Chart, medication use, and sex. Additional adjustment included energy intake,1 purine intake,2 and folate supplementation.3 Genera were filtered ≥10% prevalence and ≥1% abundance. Statistical significance was determined using the Benjamini-Hochberg method for multiple comparison adjustment, with a target rate of 0.25 for Q-values. *Q < 0.25.
Investigating the relationship between dietary indices, health parameters, and microbiota composition, we found associations, particularly between E-DII and RBC folate, as well as serum uric acid concentration and specific bacterial genera. To explore whether the microbiota influenced the impact of E-DII on folate and uric acid, we performed mediation analyses. Using the 52 genera identified after prevalence and abundance filtering in MaAsLin2 analysis, we filtered for undefined taxa, resulting in 44 genera for mediation analysis with a focus on genera associated with folate (Bacteroides) and uric acid (Gemmiger and Oscillibacter).
In our mediation models: Model 1: Linear regression predicted serum uric acid and RBC folate as dependent variables based on E-DII (path c, Figure 2). Model 2: Linear regression assessed the relationship of E-DII on all 44 genera of the gut microbiota (path a, Figure 2). Model 3: Investigated the relationship between E-DII and uric acid or RBC folate, considering the influence of the gut microbiota (paths b and c', Figure 2).
The study discovered a direct effect of E-DII on serum uric acid, considering the Oscillibacter (ADE = 19.50, p < 0.01) or Gemmiger (ADE = 19.69, p < 0.01) abundance. However, the mediation analysis did not reveal any significant mediation effects of Oscillibacter or Gemmiger on the relationship between E-DII and serum uric acid levels (ACME = 1.57, p = 0.08 and ACME = 1.38, p = 0.34, respectively).
Additionally, a direct effect of E-DII on RBC folate was observed, controlling for Bacteroides abundance (ADE = −25.13, p < 0.001). However, mediation analysis did not indicate that Bacteroides mediated this effect (ACME = 1.04, p = 0.74) (Figure 5). Further examination of all other genera showed no mediator effects between E-DII, RBC folate, serum uric acid, and other microbiota genera (all p-values of ACMEs >0.05) (Supplemental Table 4). Mediation analysis of the association between energy adjusted Dietary Inflammatory Index and red blood cell-folate concentration and serum uric acid concentration. E-DII: energy adjusted Dietary Inflammatory Index; RBC folate: red blood cell folate. Figure presents the average direct effect (ADE) and average causal mediation effects (ACMEs). *p < 0.05.
Discussion
This study investigated the associations between distinct dietary patterns, evaluated through the E-DII and hPDI, and microbiota composition and the potential mediating role of gut microbiota in linking dietary patterns to various health markers in older adults. While we did not observe direct correlations between the dietary indices and fecal microbial diversity, significant associations emerged between both indices and diverse health outcomes, encompassing body composition, metabolic biomarkers, cognitive function, and nutritional status markers. Notably, some of these associations significantly explained variations in microbial community composition. Furthermore, specific microbial genera were associated with serum uric acid and RBC folate concentrations, indicating potential independent effects beyond dietary factors, as shown by mediation analysis.
Numerous studies underscore the intricate interplay between dietary patterns and disease susceptibility, particularly through their influence on age-related changes in gut microbiota, such as reduced microbiota diversity and shifts from beneficial to pathogenic bacteria and metabolites.15,16 For example, the Mediterranean diet has been linked to mitigating aging processes by modulating the gut microbiota composition and promoting the production of short-chain fatty acids (SCFAs). 17 However, the potential associations between healthy plant-based diet patterns and anti-inflammatory diet patterns with the microbiota of older individuals remain largely unexplored. In this study, neither the E-DII nor the hPDI demonstrated significant associations with alpha diversity or substantial explanatory power concerning overall microbiota composition, contrasting with previous research, mainly due to different age demographics or underlying chronic conditions.41–43 For instance, the Multiethnic Cohort Adiposity study, which included 1655 individuals aged 60–77 years, highlighted positive associations between the E-DII and total fat mass, mediated by specific bacterial taxa like Flavonifractor, Ruminococcus gnavus group, and Tyzzerella. 18 This study featured a much larger study population and a higher proportion of obese and overweight individuals, resulting in a more heterogeneous population, which could explain the different results. Meanwhile, studies investigating the hPDI in similar age cohorts (mean age 71 years) reported contrasting findings. Shen et al. observed positive correlations with the microbiota alpha diversity and polysaccharide-degrading species (n = 705). 19 In contrast, Li et al. identified positive associations between the abundance of specific bacterial species in a cohort of 303 men. 44 It is worth noting that both studies conducted metagenomic analyses, introducing methodological differences that complicate direct comparisons to our study. Additionally, our study population was relatively homogeneous regarding lifestyle and environmental factors, which might have contributed to the challenge of detecting significant microbiota differences across the dietary indices.
Interestingly, despite the lack of direct correlations between diet indices and microbiota composition, specific dietary components, body composition markers, and metabolic, nutritional, and cognitive function markers appeared pivotal in explaining microbial composition variance. However, our differential abundance analysis revealed associations with only a few variables and microbial genera. Nevertheless, the analysis benefited from the robustness of the methodology, which accounted for confounders, prevalence, and abundance filtering and used a linear mixed model tailored to microbial community data.
We observed a positive link between the consumption of nuts and the abundance of Gemmiger, a genus previously identified as a potential anti-aging marker due to its predictive ability for butyrate production. 45 Nuts are rich in complex polyphenols and dietary fiber, possessing prebiotic properties, 46 which may promote the growth of Gemmiger. However, the literature does not conclusively define the role of Gemmiger on human health, as some studies have observed enriched Gemmiger abundance in certain diseases. 47 In contrast, others have noted reduced Gemmiger abundance. 48
We also observed a positive association between the abundance of Roseburia and the consumption of sweets and desserts. This finding is intriguing because a high intake of sweets and desserts is not typically expected to correlate with an increased abundance of the generally considered commensal genus Roseburia. According to the literature, Roseburia is usually less abundant in aging populations and certain disease states 49 but is more prevalent in centenarians. 50 Additionally, Roseburia is recognized as a butyrate-producing genus crucial for colonic motility, immunity, and anti-inflammatory processes. 51 Our observation suggests other factors influencing Roseburia abundance may be involved, which were not addressed in this study. Furthermore, since our analysis was limited to the genus level, more detailed analyses at finer taxonomic levels might provide additional insights. At present, the study does explain the observed correlation.
In addition to food components, RBC folate was positively associated with the abundance of Bacteroides. Although the direction and causality of this association remain unclear, our mediation analysis suggests that it is independent of dietary intake, pointing to a potential involvement of microbial metabolism. Malinowska et al. investigated the folate-producing capacity of the fecal microbiota in vitro by incubating fecal samples from 200 individuals anaerobically for 24 hours and measuring folate concentrations before and after incubation. The observed increase in folate concentration correlated positively with the abundance of Bacteroides, indicating microbial folate biosynthesis under culture conditions. 52 However, this in vitro folate production capacity did not correlate with the serum folate concentration of the respective individuals, suggesting that gut-derived folate may not substantially influence circulating folate concentration or that serum folate might not be a sensitive marker for microbial contributions. Although serum folate is commonly used as a biomarker of folate status, it primarily reflects recent dietary intake and is subject to short-term fluctuations. 53 This may limit its sensitivity to detect more subtle or cumulative contributions from endogenous sources such as microbial folate production. In contrast, RBC folate, which was used as the biomarker in our study, reflects folate availability over the lifespan of erythrocytes and is considered a more stable indicator of long-term folate status. 53 The observed positive association between Bacteroides abundance and RBC folate in our cohort may therefore point to a potential and previously underappreciated contribution of microbial folate biosynthesis to host folate status. Whether microbially synthesized folate in the colon is absorbed and subsequently incorporated into erythropoiesis remains unknown. This observation highlights a gap in current human research, particularly in older adults, and calls for future studies using isotopically labeled folate tracers and functional metagenomics to clarify the extent to which microbial folate production contributes to systemic folate status.
Fecal cultures were incubated anaerobically for 24 hours, and folate concentrations were measured before and after. The increase in folate concentration was positively correlated with the abundance of Bacteroides genera, suggesting folate synthesis under cultural conditions. Notably, this bacterial folate biosynthesis capacity did not correlate with serum folate levels. Although the study showed that gut-produced folate does not affect serum folate concentration, it cannot determine erythrocyte folate concentration, which is the status marker used in this study. RBC folate concentration is a more reliable indicator of folate status. It reflects folate intake over the past 3 months and is less affected by daily variations in folate intake. 53
Besides RBC folate concentration, serum uric acid concentration was negatively associated with Gemmiger and Oscillibacter abundances. However, the direction of this association also remains unclear, and mediation analysis indicates its independence from the diet, suggesting a potential role for Gemmiger and Oscillibacter in microbial uric acid metabolism. While the kidney primarily excretes uric acid, approximately 25% is excreted into the intestinal tract, where the gut microbiota metabolizes it further, 54 thus contributing to uric acid catabolism. Some bacteria produce uric acid-metabolizing enzymes like uricase, allantoinase, and allantoicase, which sequentially degrade uric acid to urea. However, no studies have indicated that Gemmiger or Oscillibacter produce these enzymes. Lower plasma uric acid levels have been associated with reduced risk of kidney disease 55 and cardiovascular events 54 , highlighting the potential health benefits of bacteria with uric acid-metabolizing capacities.
Our study has limitations that warrant consideration. Firstly, relying on self-reported dietary data and short-term food protocols introduces the potential for inaccuracies in calculating dietary indices. We could not calculate all components of the E-DII, including some phenolic derivatives, which could influence microbiota composition. Nonetheless, the E-DII remains a valid instrument for assessing the inflammatory potential of the diet, even when fewer than 30 components are included in the calculation. 4 Additionally, the study’s limited sample size and cross-sectional design restrict its ability to establish causal relationships and discern long-term effects. Another limitation is using single time-point stool samples rather than multiple samples collected over time from the same individuals. This approach may not fully capture temporal variability in gut microbiota composition, potentially leading to an underestimation of the strength of the association between dietary factors and microbial populations. Furthermore, stool samples have inherent limitations, such as incomplete separation of fecal bacteria and intestinal flora that cannot be eliminated and limited information about the microbiota of the small intestine or mucosa-associated microbiota. 56 Moreover, 16S rRNA sequencing provides only genera-level resolution, which may obscure finer taxonomic distinctions within the microbiota. The study also needs detailed information on potential metabolites and metabolic pathways that could influence health outcomes, leaving hypotheses regarding the involvement of specific microbial genera in metabolic processes without definitive evidence. Finally, this study represents a secondary, exploratory analysis of baseline data from a randomized trial. Therefore, no dedicated power calculation was performed for the specific outcomes of this analysis, since the sample size was originally determined for the primary endpoint of the intervention study. Nevertheless, the integration of dietary pattern scores, microbiota profiles, and a broad range of metabolic and cognitive health markers in a healthy, older population provides a valuable contribution to the existing literature. Studies combining these interrelated domains in this age group remain scarce, underlining the relevance of our findings for future aging and microbiome research.
In conclusion, by examining a wide range of health markers, including body composition, metabolic and cognitive parameters, and nutritional status indicators, while accounting for various confounders, this study offers an integrative view of the interplay between distinct dietary patterns, health, and gut microbiota in healthy older adults. Although no associations were found between microbiota composition and the dietary indices, nor was a mediating effect of the microbiome observed, our results confirm previously reported associations between dietary pattern and health markers. Importantly this study extends existing knowledge to a well-characterized cohort of community-dwelling older adults without chronic diseases, a group that is often underrepresented in microbiome and nutrition research.
Our study suggests that a more anti-inflammatory and healthful plant-based diet correlates with favorable metabolic, cognitive, and nutritional status among older adults. Moreover, the observed associations between uric acid and RBC folate concentration with specific microbial genera suggest potential roles in folate and uric acid metabolism. Future research using advanced sampling methods, multi-omic integration, and longitudinal designs are needed to further elucidate the complex interaction between diet, gut microbiota, and healthy aging.
Supplemental Material
Supplemental Material - Exploring the relationship between dietary indices, gut microbiota, and health status in healthy, older individuals
Supplemental Material for Exploring the relationship between dietary indices, gut microbiota, and health status in healthy, older individuals by Madeline Bartsch, Felix Kerlikowksy, Andreas Hahn, Shoma Berkemeyer, Sabrina Woltemate, Marius Vital, Mattea Müller in Nutrition and Healthy Aging.
Footnotes
Acknowledgements
We would like to thank the participants who contributed their time to this study.
Author’s Contributions
Funding
The authors disclosed receipt of the following financial support for the research, authorship, and/or publication of this article: This research was partially funded by food federation Germany (Lebensmittelverband Deutschland e.V.), Claire-Waldoff-Straße 7, 10117 Berlin. The sponsor had no role in the design, collection, analysis, or interpretation of the data, the writing of the manuscript, or the decision to publish the results. MB was supported by the CARLA Talent Academy – Health and Living of Osnabrück University of Applied Sciences. MM was supported by the Joachim-Herz-Foundation (Add-on Fellowship for interdisciplinary Life Sciences).
Declaration of Conflicting Interests
The authors declared no potential conflicts of interest with respect to the research, authorship, and/or publication of this article.
Supplemental Material
Supplemental material for this article is available online.
Appendix
References
Supplementary Material
Please find the following supplemental material available below.
For Open Access articles published under a Creative Commons License, all supplemental material carries the same license as the article it is associated with.
For non-Open Access articles published, all supplemental material carries a non-exclusive license, and permission requests for re-use of supplemental material or any part of supplemental material shall be sent directly to the copyright owner as specified in the copyright notice associated with the article.