
Abstract
Since 2006 English Local Authorities (LA) have had discretionary powers to implement a type of landlord licensing scheme, Selective Licensing (SL), in the private rental sector. The scheme is intended to improve housing standards in areas marked by antisocial behaviour, poor housing conditions, low housing demand, and high levels of migration, deprivation, and crime. Yet up to 2019, only 15% of LA had adopted SL. We examine temporal, socio-economic, and geographical factors associated with SL adoption between 2006 and 2019, focusing on: (A) overall temporal trends in adoption, (B) socio-economic factors in adoption on their own; and in relation to (C) regional diffusion processes. To examine these factors, we applied cumulative adoption rate, logit, and spatial autoregressive logit (SAL) models considering 1st and 2nd order LA neighbours. The influence of socio-economic factors was studied using multiple variables and by coding the LA with the Census 2011 LA classification. The adoption curve showed that the policy has only been adopted at a slow rate. The adoption rate did however increase slightly at the point when the justifiable reasons for implementing SL were expanded. The logit and SAL models showed that higher proportions of the population receiving Income Support was a powerful determinant, while spatial spillovers were not statistically significant. The same was true in SAL with Census classification exposure showing stronger associations with larger urban areas than with spatial spillovers. We note that SL is absent from large parts of Mid- and South-England, so even without evidence of regional diffusion on a local scale it may still exist on a larger scale. We conclude that SL adoption has been slow, regionally patchy, and more correlated with socio-economic factors than with regional diffusion processes. Resource and staffing constraints as well as internal organisational/political and policy-related factors are likely barriers to adoption. More qualitative evidence is needed from local areas including from those that never adopted SL.
Keywords
Introduction
Poor housing conditions in England’s expanding private rental sector (PRS) have significant implications for the health and well-being of tenants, exacerbating existing health and social inequalities (Department for Levelling Up, Housing, and Communities, 2022b; Garrett et al., 2021; Howden-Chapman et al., 2023). To address such issues, the 2004 Housing Act empowered English local authorities from 2006 onwards to implement Selective Licensing (SL), a scheme aimed at improving housing standards. Despite widespread housing issues (Department for Levelling Up, Housing, and Communities, 2022a), only 15% of local authorities adopted SL by 2019 (Alexiou and Fahy, 2025), suggesting that unexplored barriers are affecting adoption. The goal of this paper is to assess temporal, geographical, and socio-economic variation associated with SL adoption and to discuss the results in relation to key models of policy adoption and diffusion.
In 1998, major areas of public policy such as housing, planning, education, health, and regeneration were in large part devolved to new elected seats of power in Northern Ireland, Scotland, and Wales. Powers reserved for the UK Westminster Parliament were the majority of taxation as well as social security, defence, energy, immigration, and constitutional matters (McKee et al., 2017). The devolution of housing policy has been somewhat fragmented. Most taxation issues have remained with Westminster where decisions around tax allowances may affect, for instance, the economics of landlordism (Maclennan et al., 2019). Social security for housing (primarily Local Housing Allowance) and housing policies such as Help-to-Buy schemes have also remained within the domain of Westminster (Maclennan et al., 2019). The UK mortgage market is determined by the Bank of England who set the base interest rates themselves. The regulation of tenure security, rental contracts, and dispute resolution, however, is the responsibility of the devolved governments (Maclennan et al., 2019). In England, Central government sets the overarching policies and regulatory frameworks and local authorities are responsible for regulation and enforcement locally (National Audit Office, 2021b). Local government also plays a key part in administering and enforcing planning laws as well as operating local planning systems (Maclennan et al., 2019). In between local and national government, some regions have formed a metropolitan layer of government with their own housing agendas. The devolution of powers to local authorities has been challenging. Many local authorities are trapped in a debt crisis as they face increasing demands for social care, temporary housing, and other services, while the core funding from central government has shrunk in absolute and in real terms and options to increase local taxes are severely limited (Alexiou et al., 2023; Hastings et al., 2017; Jeffery, 2025). At the same time, uneven economic growth has resulted in a persistent north-south divide across the country (Marmot et al., 2020).
In this space, the Housing Act (2004; enacted 2006) gave local authorities in England powers to intervene in the private rental market by setting up zoned landlord licensing schemes, known as Selective Licensing (SL), most commonly for 5 years at the time (Department for Communities and Local Government, 2015a). The schemes are for landlords of private rented homes occupied by single-occupancy households, which typically means single persons, couples, or groups of related tenants.
Through SL, local authorities can proactively conduct health and safety inspections on registered properties and subsequently mandate landlords to remove hazards (Office of the Deputy Prime Minister, 2004). The registration process also involves documentation of gas and electricity safety certificates, checks of ownership and whether the landlord is a ‘fit and proper person’. SL generates licence fee income for the participating local authorities which can be put towards the costs of running a scheme.
The ultimate goal of SL is to improve PRS housing conditions. Local authorities are expected to target certain types of areas that according to the policy contain or attract problems with poor housing conditions, known as ‘initial conditions’. The initial conditions were originally areas with high levels of antisocial behaviour (ASB) or low housing demand (Department for Communities and Local Government, 2015a). The permissible conditions were expanded in 2015 to include areas with poor housing conditions, or areas high in migration, deprivation, or crime (Department for Communities and Local Government, 2015a). From 2015 to 2024, if more than 20% of the local authority by area or proportion of private rental homes were included in schemes, the local authorities had to obtain permission from central government to adopt SL (Ministry of Housing, Communities and Local Government, 2024b).
Local authority adoption of SL has been surprisingly slow considering the widespread problems with poor housing standards in PRS (Department for Levelling Up, Housing, and Communities, 2022a; Garrett et al., 2021). Our data show that only 15% of local authorities implemented one or more SL schemes from when the law was enacted in 2006 to the end of the study period in 2019 (Alexiou and Fahy, 2025).
The use and effectiveness of SL have been subject to reviews based on interviews and surveys of local authority implementers (Lawrence and Wilson, 2019; National Audit Office, 2021b). With this work, however, we undertake quantitative analysis of secondary data to better understand what characterises areas with SL and discuss important barriers or enablers for adoption in relation to key theories for policy adoption (Dolowitz and Marsh, 2000; Gavens et al., 2019). If it is the case that SL improves housing conditions, as much of the reports to date suggests (Lawrence and Wilson, 2019), its uneven adoption creates a ‘postcode lottery’ for tenants across England, i.e. arbitrary geographical differences to service provision that are not explained simply in terms of tailoring to different local needs (Redhead and Lynch, 2024).
The following section reviews the theoretical and empirical literature on policy adoption and diffusion.
Policy adoption: Internal determinants and diffusion mechanisms
Clark (1984) defined innovation diffusion as “… the way new ideas are accepted (or not) by those to whom they are relevant”. The field of innovation diffusion was championed in the 1950s by Torsten Hägerstrand, a geographer who investigated for example the uneven acceptance of government farm subsidies (Clark, 1984). Innovation diffusion was soon adapted to study how policies spread investigating processes such as learning, imitation, socialisation, and competition (Berry and Berry, 2007). Shipan and Volden defined policy diffusion as “… one government’s policy choices being influenced by the choices of other governments” (Shipan and Volden, 2012). There is a rich literature on how policies spread, especially between individual states in the US with examples such as anti-smoking, same-sex marriage bans, education reforms, abortion, death penalty, and health insurance (Shipan and Volden, 2008). The general pattern for policy adoption is a cumulative S-shaped curve going from a few ‘innovators’ over ‘early adaptors’ to the bulk of ‘early majority’ and ‘late majority’ to a few ‘laggards’ (Berry and Berry, 2007; Clark, 1984). The curve can flatten if the diffusion process is slow in less connected regions or affected by the mix of processes and systems involved (Berry and Berry, 2007). Well-promoted and acceptable policies may instead follow an r-shaped curve steeply rising at first then gradually tailing off (Haupt, 2023).
Considering Berry and Berry’s classification (2007) in local authorities, they could at the most fundamental level be learning from the positive or negative experiences of others, or they might be imitating other areas on the basis that the policy must be appropriate if they share similar characteristics, or that the first adopter is perceived as the leader of the pack (Berry and Berry, 2007; Shipan and Volden, 2012). Both of these processes could be interpreted as benchmarking, i.e. actions involving comparison with other actors (Cook et al., 2019). However, if a policy is clearly perceived to be the norm, they might adopt it at face value (socialisation). Policy adoption might also be driven by competition between local authorities, i.e. adopting policies of a competitor to attract/retain certain resources. The US literature has many examples of the reverse, i.e. where individual states avoid policies that could turn them into ‘welfare magnets’ and hence engage in a ‘race to the bottom’ (Shipan and Volden, 2012). Competition for qualified staff could also play a role in the decision to implement in the first place (Cook et al., 2019).
System-level theories have developed in recent years that broaden the debate on the point that ‘good enough’ decisions are often made with incomplete information (bounded rationality) and by actors who, depending on the context, may compete or cooperate within sub-systems (Cairney et al., 2025). Policy adoption decisions are complex, multi-faceted, and more so for intersectoral policies (Cairney et al., 2025). The role of power relations, media, and lobby groups is also given consideration in more recent work (Garlick et al., 2025; Haupt, 2023). An often-cited view is also that innovation requires a ‘policy window’, a change in leadership or a crisis where a particular policy can be passed as ‘decisive action’ or a ‘new direction’ (Berry and Berry, 2007). Some take the view that politicians do whatever will get them re-elected in the short term (Berry and Berry, 2007). While decisions are envisioned to be evidence-based, understandings of what constitutes ‘evidence’ vary (McGill et al., 2015) and decisions are often based on personal experience, expert contacts, and diverse assemblages of materials (Gavens et al., 2019; Lundin et al., 2015; Prince, 2012).
This paper specifically draws on the three theories of internal determinants, national interaction, and regional diffusion (Berry and Berry, 2007). The internal determinants model assumes that the actors have perfect information about the policy and that implementation is solely driven by internal socio-economic characteristics as well as internal organisational and political factors. A policy can be considered incompatible with local needs, too complex, or too costly to implement, or the cost-effectiveness too hard to prove (trialability), e.g. due to the nature of the potential outcomes (observability) (Berry and Berry, 2007). In some cases, a policy may seem redundant if alternative (competing) policies with similar goals are being implemented (Berry and Berry, 2007). Local authorities have statutory functions which in part limit their ideological scope, but right-wing parties generally have less inclination to intervene in markets such as PRS than left-wing parties (Blick, 2025).
Some sceptics take the view that a local discretionary policy (such as SL) could be a central government ploy to avoid implementing a more effective yet politically unpopular national policy, i.e. that they become political ‘pressure valves’ (Shipan and Volden, 2012). On the other hand, if many local authorities implement a discretionary policy, it could put pressure on central government to turn it into a national policy (‘snowballing’) (Shipan and Volden, 2012). Whilst some see devolution as kind of ‘policy lab’ where central government can test out new ideas before formulating them into national policy (Shipan and Volden, 2012).
The national interaction model assumes that the ‘burden of proof’ for adopting grows over time and that more and more actors will consider it through their interactions at all levels from the local to the national (Berry and Berry, 2007). The regional diffusion model however assumes that the information more likely travels through local networks leading to a slower, more organic policy diffusion.
The goal of this paper is to assess temporal, geographical, and socio-economic variation associated with SL adoption and to discuss the results in relation to three key models, i.e. internal determinants, national interaction, and regional diffusion (Berry and Berry, 2007). Accordingly, we study whether adopting local authorities are geographically clustered once underlying socio-economic characteristics have been taken into account (Spinelli, 2022). Clustering may imply spatial spillovers (Anselin, 2003), indicating that the policy has been poorly promoted and that local networks have driven the diffusion of policy adoption (Lundin et al., 2015). If the opposite is the case, it would indicate that internal determinants are more important in predicting SL adoption (Berry and Berry, 2007).
Methods
All English local authorities (N = 309) were sent Freedom of Information requests at least twice requesting information about any SL schemes implemented within their area since 2006 (Alexiou and Fahy, 2025). First in 2021, and a second time for validation purposes in 2024. In the latest round, we shared a web page with details of the SL schemes identified during the first round. All local authorities responded in the first round and 82 local authorities (27%) responded in the second round. We also consulted our network of housing professionals and received 11 responses. For this paper, we focus on when each local authority first adopted SL in the time period before the COVID-19 emergency disrupted intervention delivery (Petersen et al., 2022).
We opted for a cross-sectional design with contextual data from the early stages of SL adoption and spatial lags based on adoption at any point during the study period.
We first looked at the cumulative adoption curve (Berry and Berry, 2007) for local authorities with SL (N = 49) overall and by the political party with most seats in May of the adoption year (Lawson, 2025).
We excluded the City of London (a small financial district in central London distinct from the 32 London local authorities) and the Isles of Scilly. Both have very small populations and did not adopt SL. With only 49 local authorities adopting SL, we reduced the number of exposure variables to five on a rule-of-10 (Kirkwood and Sterne, 2003). In addition, we used the Census 2011 local authority classification in parallel tests. The Census classification is based on clustering in a multi-dimensional space of over 50 Census variables (Office for National Statistics, 2023) and a classification of urban morphology (Batty, 2013; Harris et al., 2005).
Socio-economic exposure variables were obtained from Census 2011, Indices of Multiple Deprivation (IMD), and the police across different domains: age (ONS, 2015), ethnicity, born abroad, housing tenure, overcrowding, disability, occupational class (ONS, 2021), Income Support (Department for Communities and Local Government, 2015b), single tier government organisation status (Ministry of Housing, Communities and Local Government, 2024a), and ASB (Smith, 2014) (Table 1, S1). Income Support is highly correlated with IMD and used as a more easily interpretable proxy for social deprivation in this study. Only some variables from each domain were brought forward as candidates for the logit models to avoid multicollinearity.
Initial logit models with treatment status as the binary outcome and single exposure variables showed that proportion of population in receipt of Income Support had by far the greatest effect and it was retained as a forced exposure variable in the main model (Greenland et al., 2016). Preliminary analysis showed that the squared form of this variable did not improve the model. This was achieved by specifying the same model with the variable interacted with itself and tested with a Likelihood Ratio test. The candidate variable with the greatest change-in-estimate for the forced exposure variable (Income Support) was subsequently added to the main model. This step was repeated until five exposure variables were reached. Area under the Receiver Operator Characteristics curve was reported as a goodness of fit for the logit models.
In addition to the main logit model, we also fitted spatial autoregressive logit models with 1st order neighbours and 1st and 2nd order neighbours combined as well as spatial lag-only logit models (Spinelli, 2022).
For map visualisation, we rescaled the local authority boundaries according to the number of people renting from private landlords (Census 2011) to create a cartogram (Dougenik et al., 1985; Fink, 2022). The cartogram expands high-density regions with a large private rental population such as London relative to less densely populated regions with smaller private rental populations (Figures 1 and S1-S2 in Supplementary Material). Boundary data were obtained from Office for National Statistics licensed under the Open Government Licence v.3.0 and contains OS data © Crown copyright and database right 2016. Selective Licensing (SL) policy adoption by local authorities in England, 2006-19 (left panel). Proportion of population in receipt of Income Support quintiles in 2012 (right panel). The area of each local authority has been scaled relative to the number of people renting privately (Census 2011).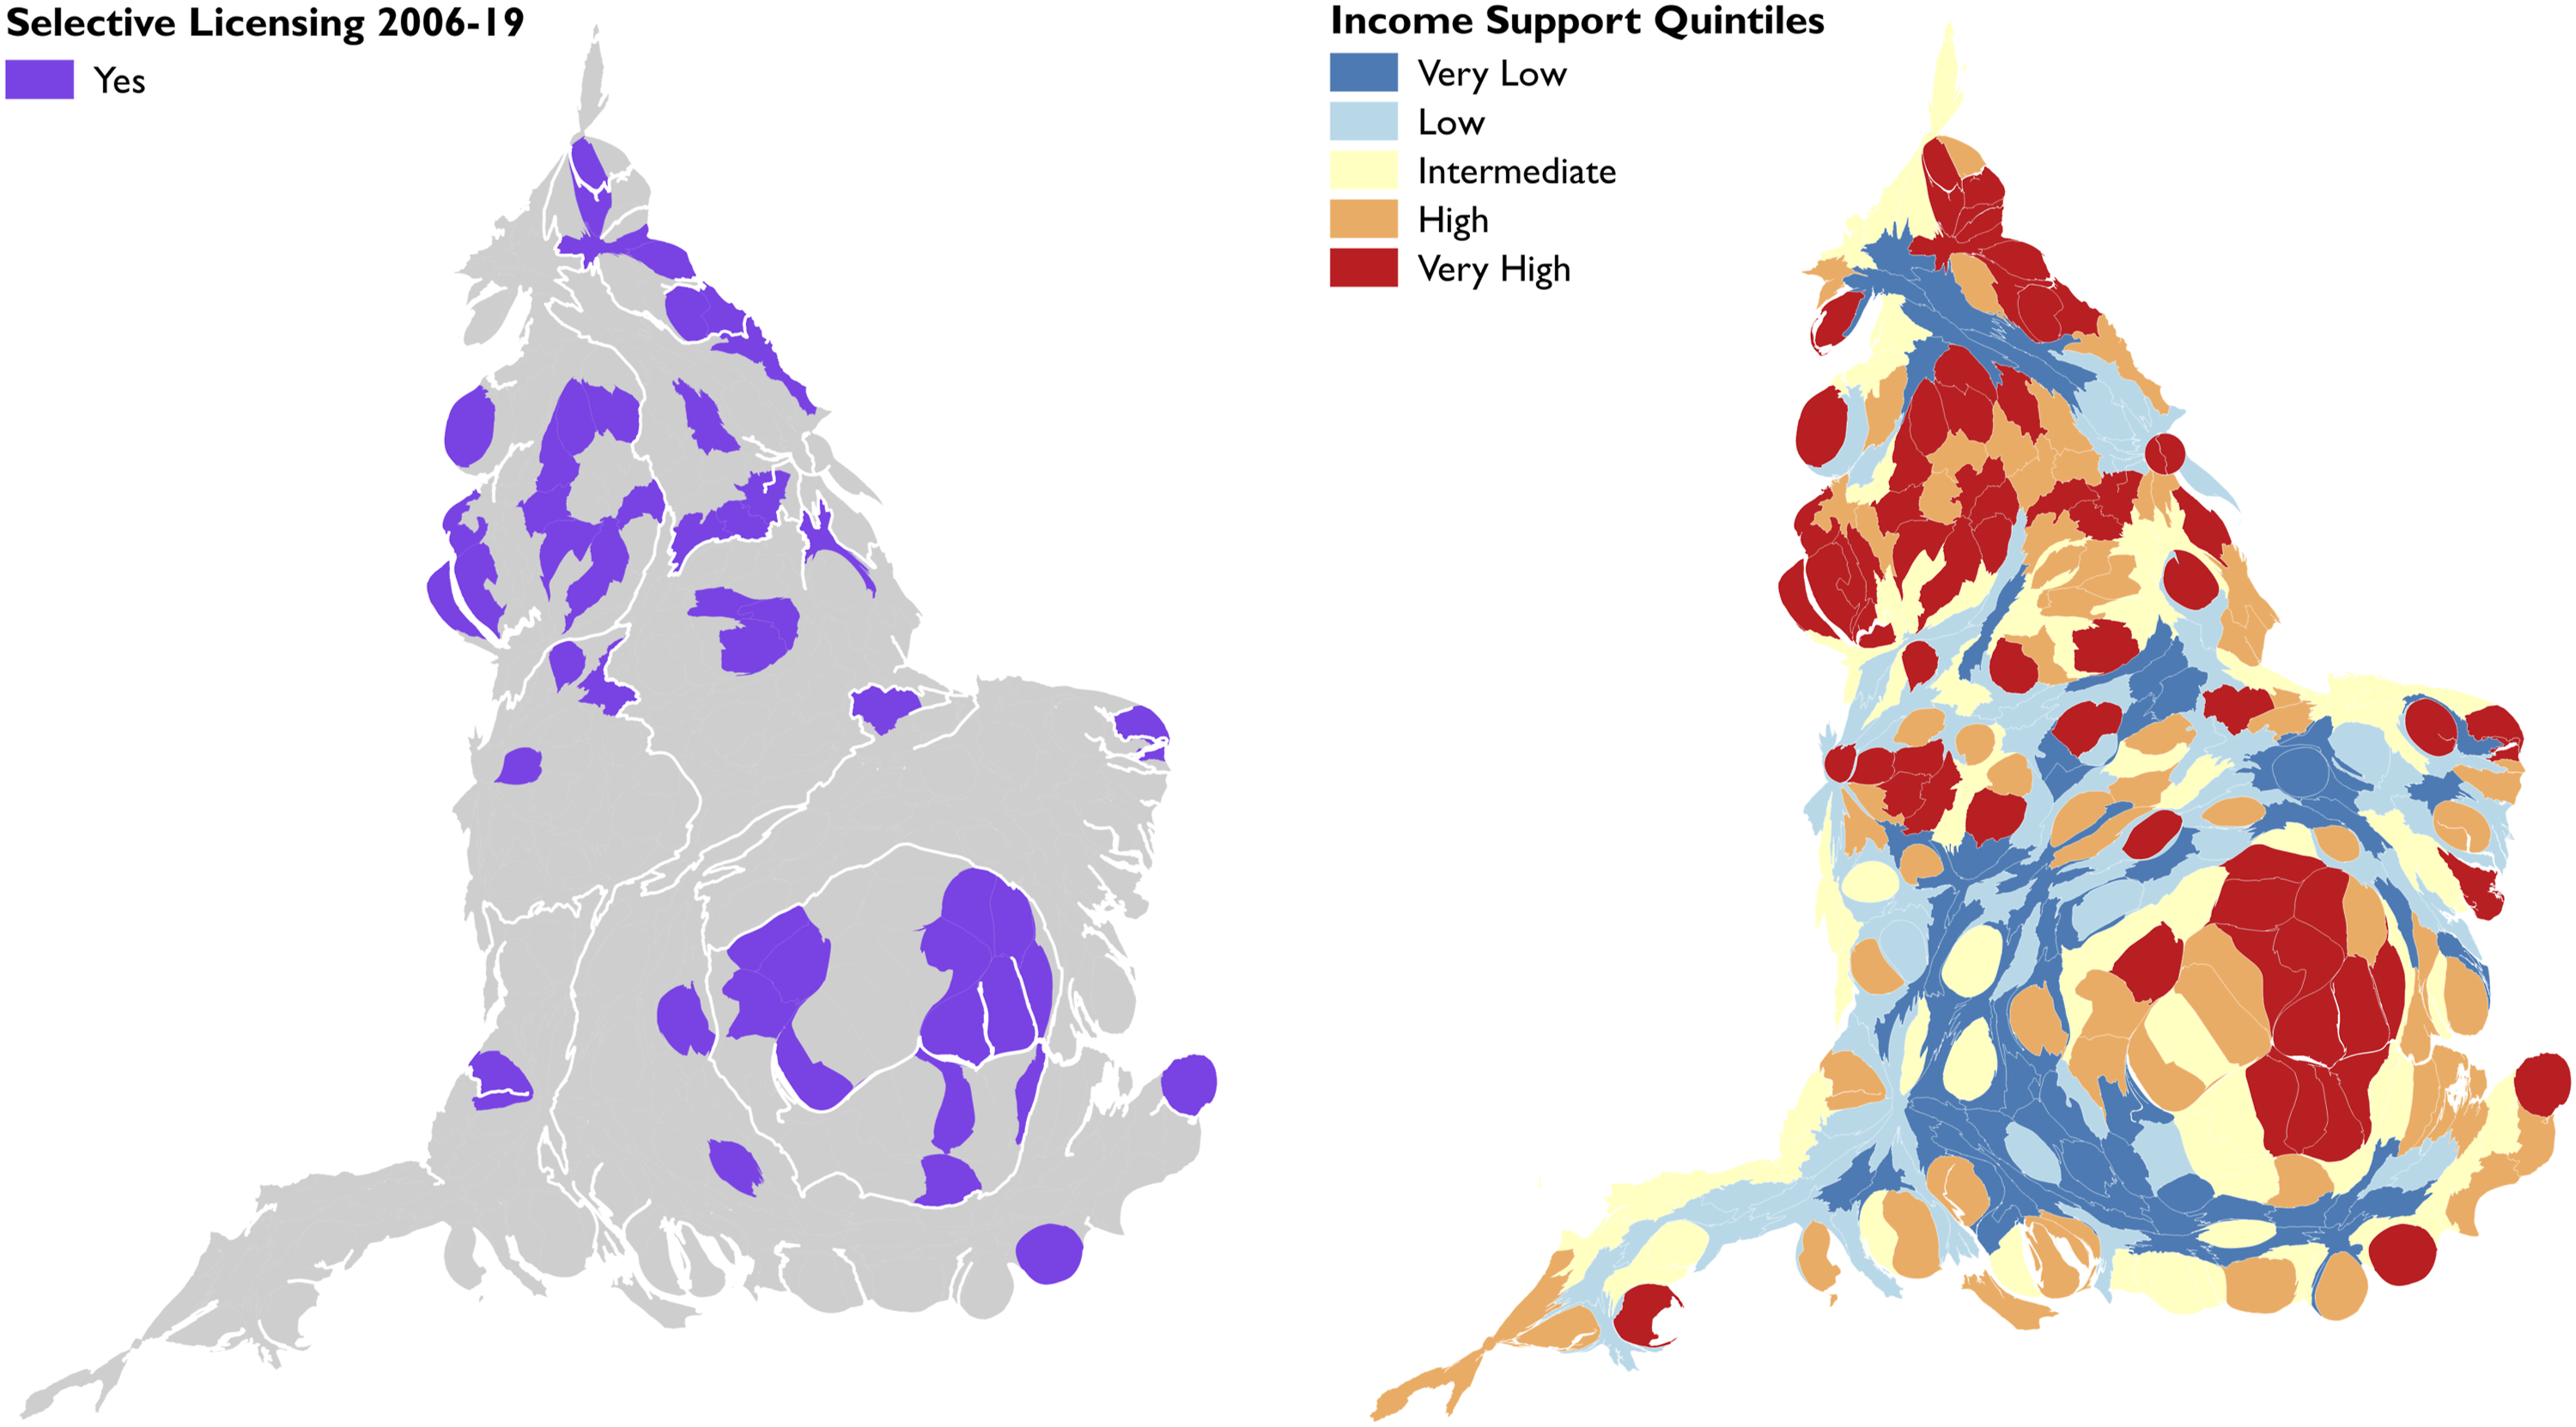
Results
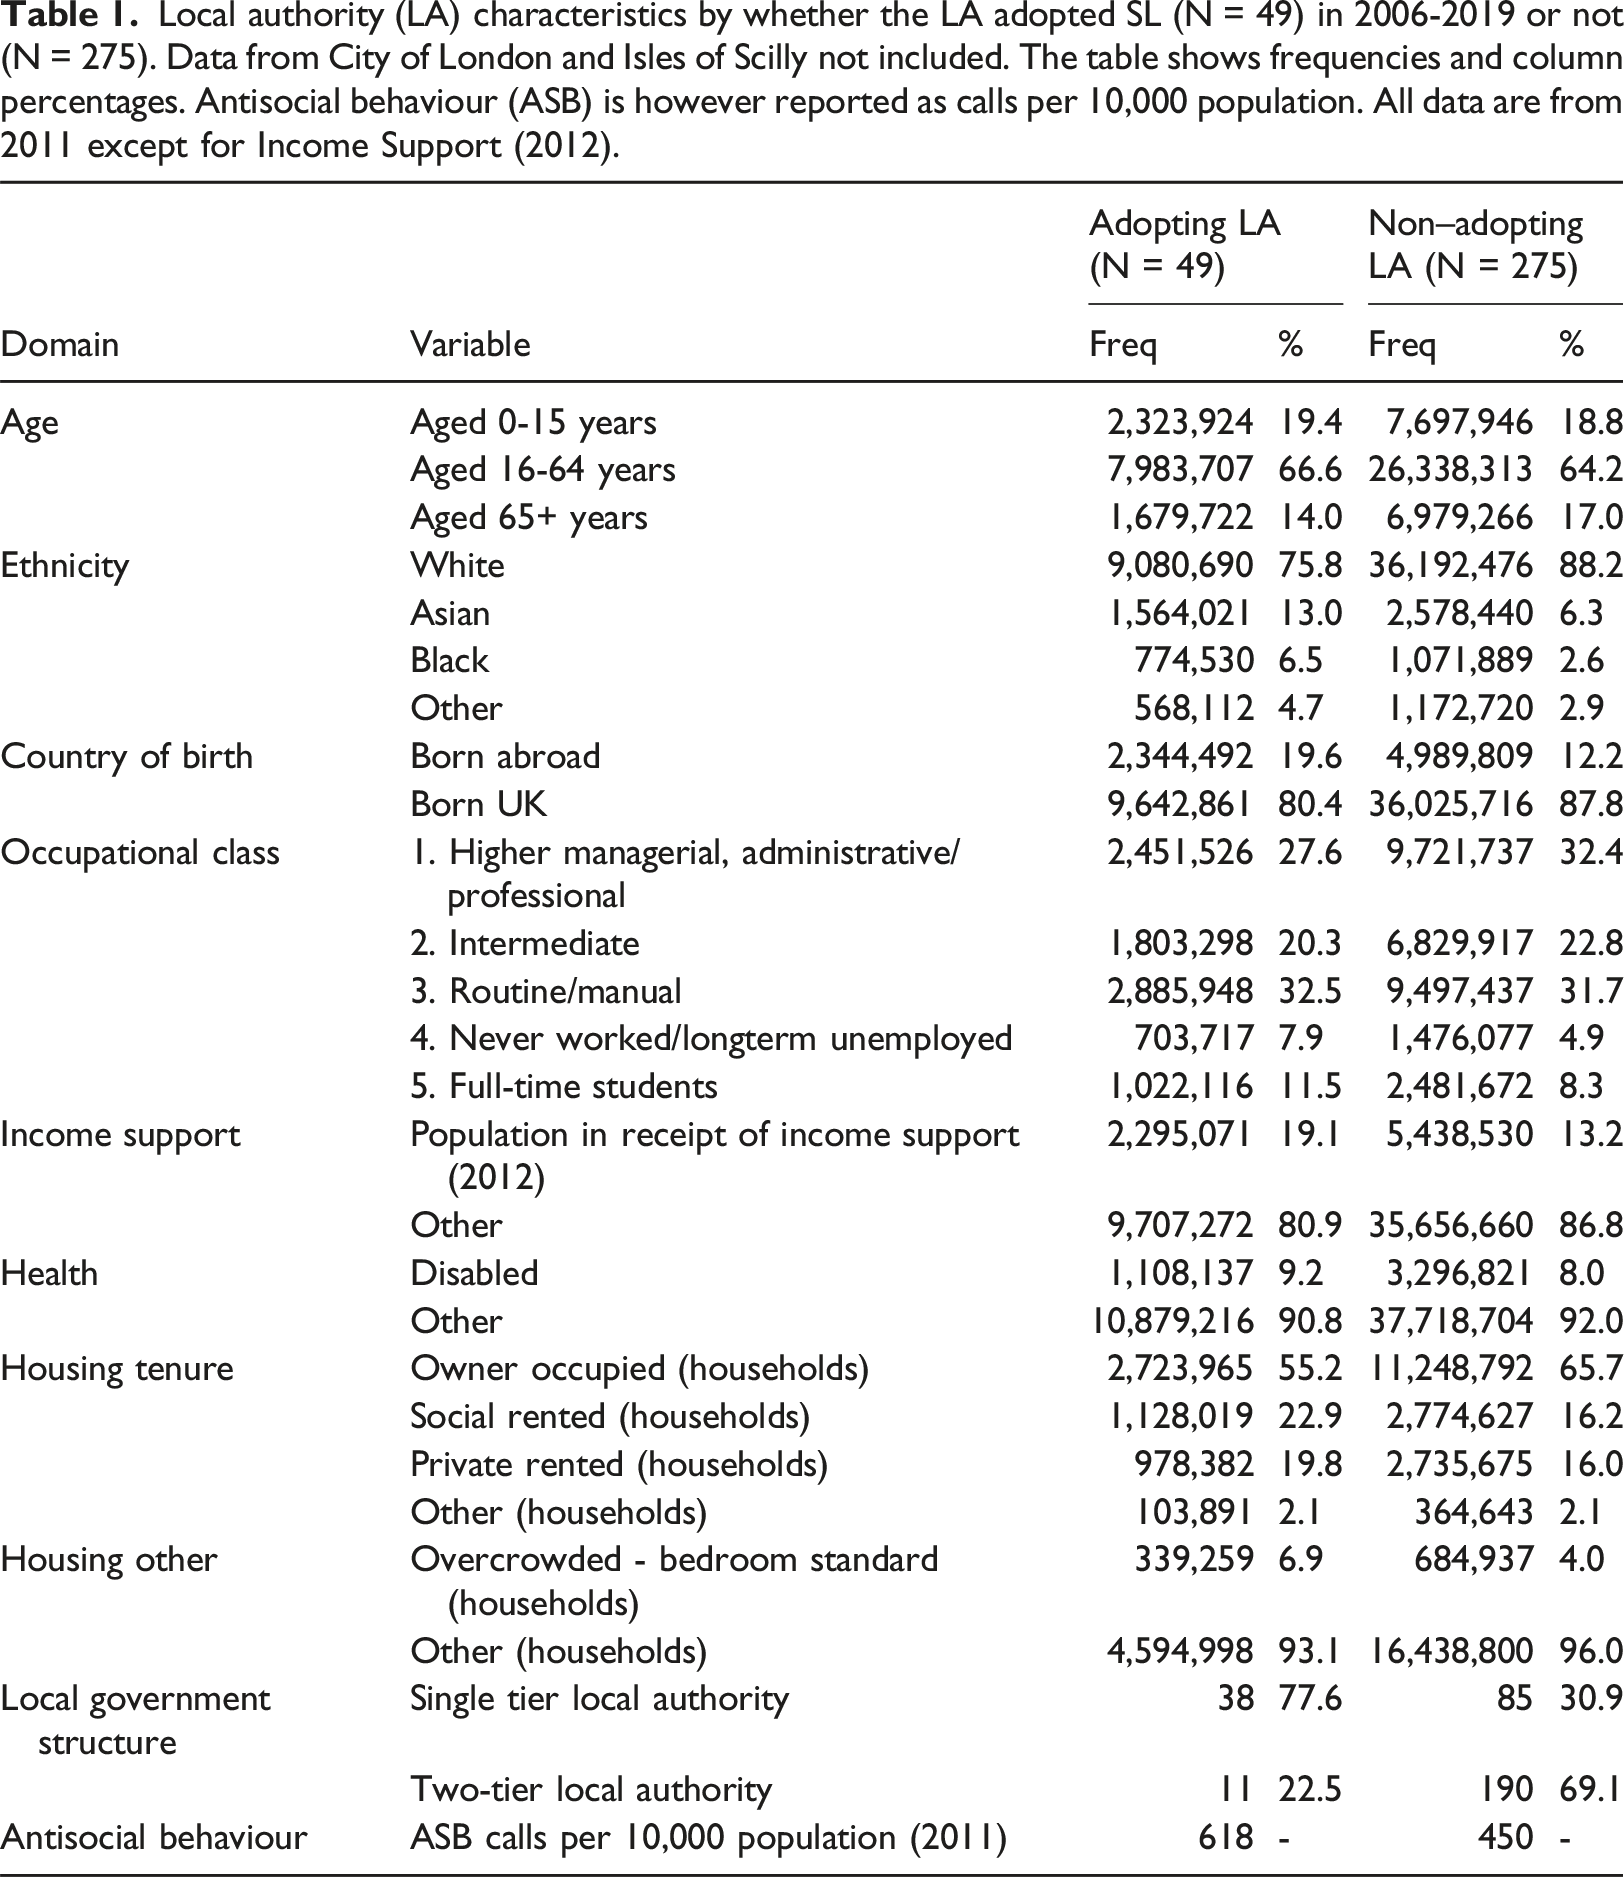
Local authority (LA) characteristics by whether the LA adopted SL (N = 49) in 2006-2019 or not (N = 275). Data from City of London and Isles of Scilly not included. The table shows frequencies and column percentages. Antisocial behaviour (ASB) is however reported as calls per 10,000 population. All data are from 2011 except for Income Support (2012).
The adoption curve for SL showed that the adoption only progressed slowly before 2015 and then increased slightly (Figure S4). Before 2015, SL could only be adopted on the grounds of ASB problems and low housing demand. In 2015, the grounds for designation were expanded to include poor property conditions, high crime, high levels of deprivation, and high migration (Lawrence and Wilson, 2019). The parties with the most seats were Labour (N = 40), Conservative (N = 8), and Liberal Democrats (N = 1). Prior to 2015, the local authorities were almost exclusively Labour. Most of the local authorities with Conservative dominance adopted after 2015.
Logit and spatial autoregressive logit models of SL policy adoption by local authorities in England considering 1st and 2nd order neighbours. Isles of Scilly and City of London excluded. Out of 324 local authorities, 49 adopted SL. (A) Socio-economic factors; (B) Census 2011 Local Authority classification supergroups.
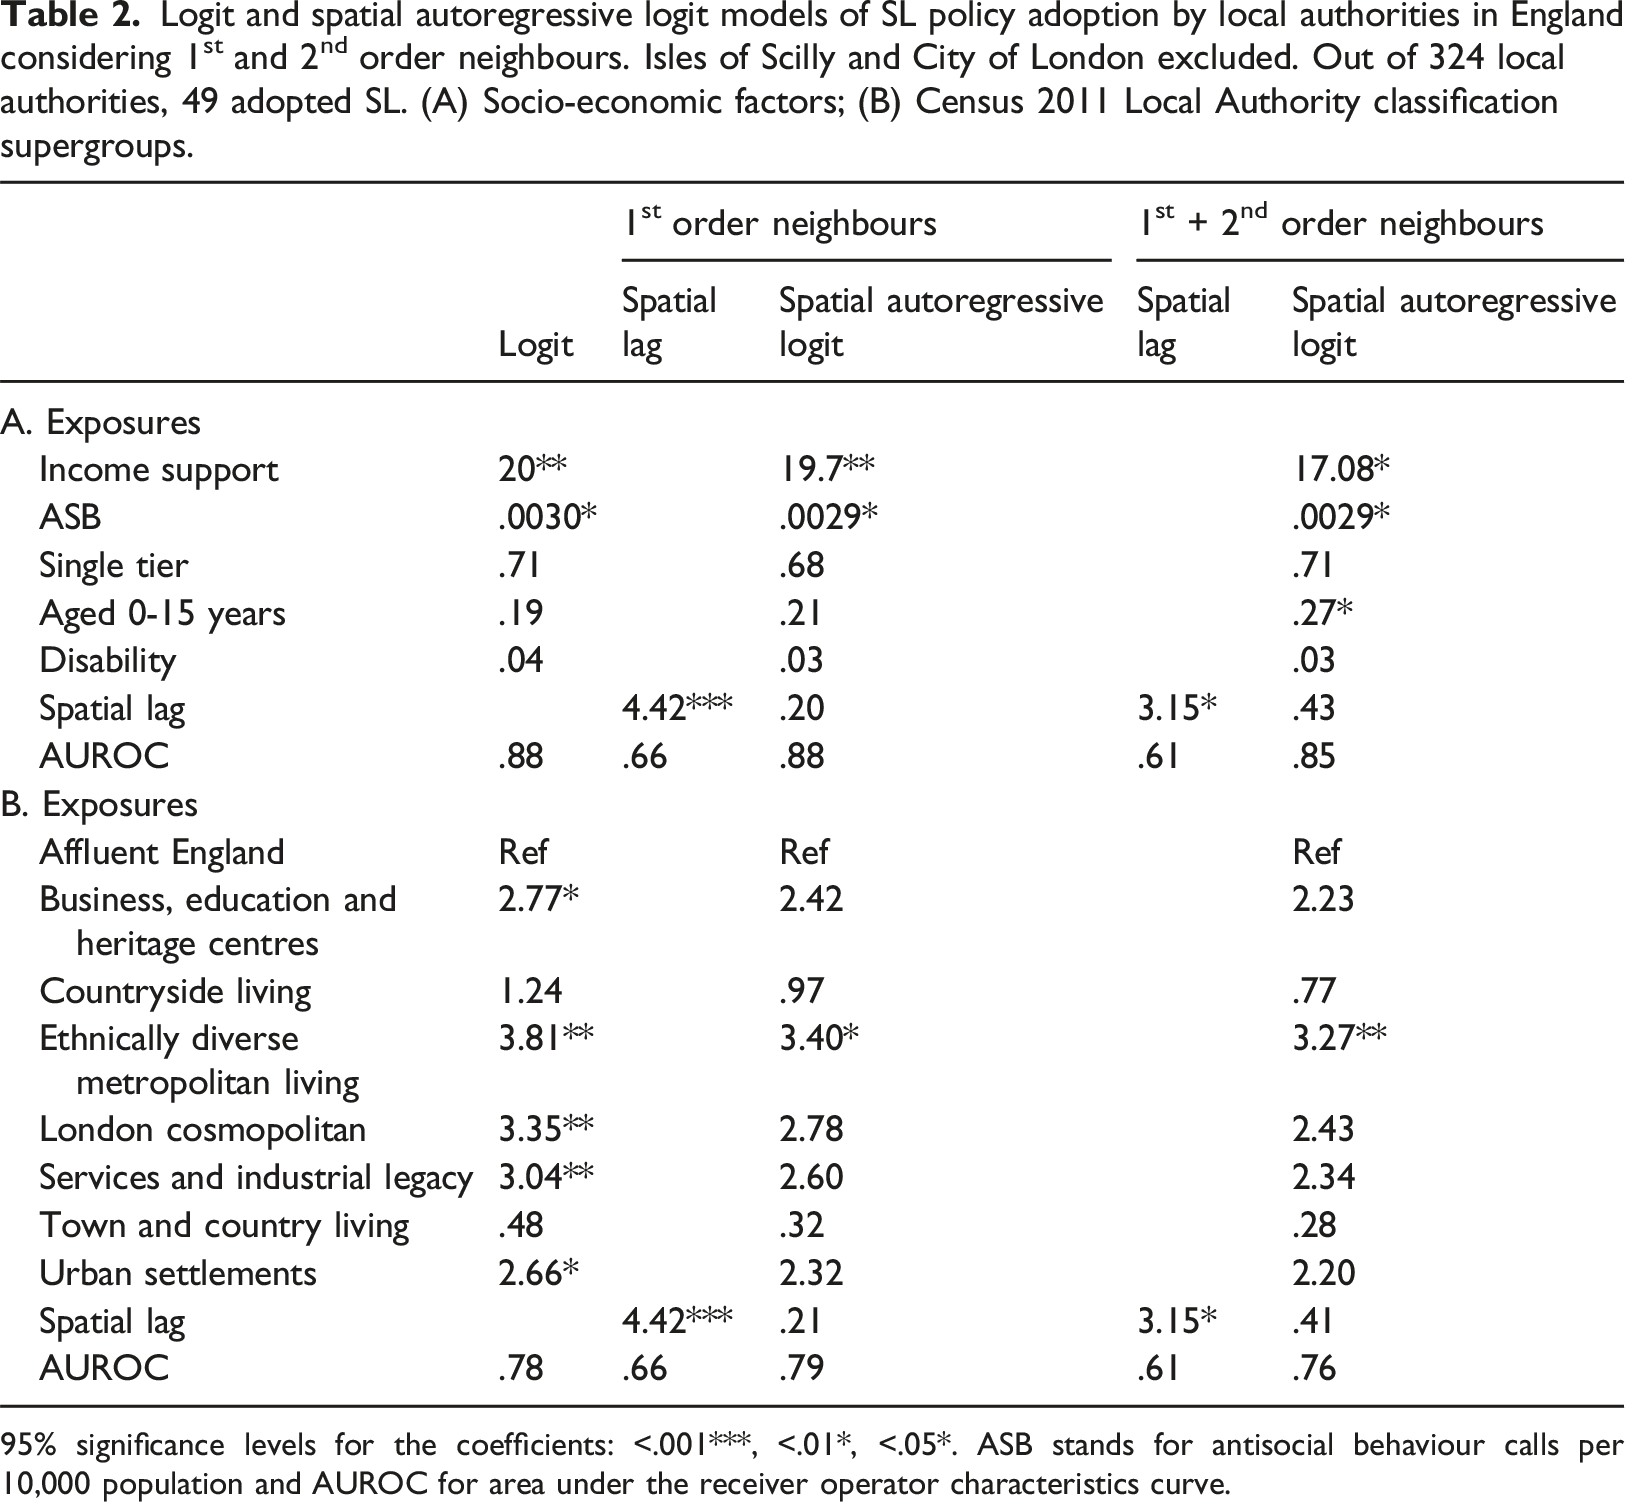
95% significance levels for the coefficients: <.001***, <.01*, <.05*. ASB stands for antisocial behaviour calls per 10,000 population and AUROC for area under the receiver operator characteristics curve.
Discussion
The SL adoption curve showed that the spread of the policy is still at an early stage even 14 years after local authorities first gained these new powers to intervene in PRS. The adoption rate increased slightly from 2015 coinciding with the expansion of permissible justifications in the policy guidance (Department for Communities and Local Government, 2015a).
No statistically significant spatial spillovers were found suggesting that internal determinants and national interactions are more likely drivers of policy adoption than local networks per se (Spinelli, 2022). The fact that SL was only adopted at a slow and gradual rate suggests a role for the national interaction model (Berry and Berry, 2007). Given that socio-economic factors were powerful determinants, this would in addition support a role for the internal determinants model. The fact that the adoption process appeared sensitive to the expansion of permissible justifications in 2015 suggests further support for both the national interaction and the internal determinants model. First, the response could be in reaction to how the policy variation was promoted at the time. Second, the expansion of reasons could mean a better fit with internal determinants. We did not find evidence of the regional diffusion model. SL is almost absent in some regions, especially Midlands and the South of England, so even if we do not have evidence of the regional diffusion model on a local scale it may still exist on a larger scale. We therefore hypothesise that SL eventually would diffuse to become better represented in these regions in line with the regional diffusion model.
The proportion of people in receipt of social welfare benefits was strongly correlated with SL adoption. This ties with the fact that the policy was intended – especially from 2015 onwards - to address problems in deprived areas, including areas marked by ASB (from the original 2006 guidance), poor housing conditions, migration, and crime (Department for Communities and Local Government, 2015a). Low-income groups excluded from social housing are typically limited to the cheaper and lower-quality end of the PRS market, and more so in high-demand areas (Bailey, 2020). These groups hence depend more on enforcement to access a decent standard of housing. The results with the Census local authority classification furthermore showed that SL adoption was strongly associated with larger cities and that SL was almost absent in affluent and more rural local authorities.
The austerity funding cuts to local authorities in the aftermath of the global financial crisis hit low-income areas the hardest (Hastings et al., 2017). First, the more deprived urban local authorities faced disproportional cuts, and second, these cuts then in turn hit services used more by low-income groups disproportionally to other groups. Many local authorities cut their spending on discretionary policies during this time period (Phillips et al., 2019). It is therefore plausible that they for that reason alone lacked capacity to implement SL.
Local authorities have gained powers in other ways to intervene in PRS and this may have impacted on the adoption of SL. They can intervene ad hoc in response to complaints using the same instruments without implementing SL. The Housing and Planning Act 2016 (enacted May 2016) furthermore introduced a database of rogue landlords and allowed local authorities to issue financial penalties, rent repayment, and banning orders (National Audit Office, 2021b). An unforeseen consequence of issuing penalties is that they often go unpaid and then add to the local authority’s legal burden (National Residential Landlords Association, 2024).
Shipan and Volden (2012) found that smaller US cities were more likely to adopt policies of their state administration compared to larger cities although their regulatory actions were conditional on resource capacity and local competition (Shipan and Volden, 2012). Schönefeld et al. (2023) found that larger municipalities in Germany and Finland were more likely to adopt climate adaptation policies than smaller ones (Schönefeld et al., 2023).
From a different angle, a recent government white paper announced that the smaller size of two-tier local authorities in England could be a hindrance in delivering ‘sustainable and high-quality services’ (Ministry of Housing, Communities and Local Government, 2024a). Andrews et al. (2006) studied size effects for different types of local authority-delivered services (Andrews et al., 2006). They looked at performance indicators and resident satisfaction rather than the actual decision to adopt a specific policy. Leisure and cultural services performed best in larger local authorities while educational services had the least size effect. Housing services ranked in the middle. Andrews et al. (2006) also observed that the size-performance relationship for many services was in fact non-linear. In our models, the Income Support variable was a much more powerful predictor of SL adoption than single-tier status. We can therefore not conclude that size specifically is a critical factor in policy adoption once socio-economic factors about the resident population are taken into consideration.
The Government commissioned an independent review of the use and effectiveness of SL in 2019 (Lawrence and Wilson, 2019). English local authorities (N = 326) were invited to take part in a survey and 84% responded (Lawrence and Wilson, 2019). When those with a current scheme were asked about problems in PRS, more than half indicated the following problems: poor housing conditions, deprivation, ASB, and crime. When asked about the justification for implementing SL, poor housing conditions and ASB were the predominant answers. Low demand also played a role although only outside London. Most (91%) stated that SL was fairly effective or better at dealing with poor housing conditions, ASB, and low demand. The process for adopting SL was however often described as complex, bureaucratic, and costly. Staff recruitment/retention was mentioned as a limitation for operating large schemes. The maximum 20% coverage rule was highlighted as a potential barrier for smaller local authorities suggesting that only larger schemes are considered cost-effective or that problems were not concentrated on any one area sufficient to meet the designation criteria. Another potential barrier mentioned was lack of property-level PRS data. Among those that never adopted SL but had considered it (N = 40), some reported lack of resources or political will (N = 11), lack of evidence (N = 9), or that the issues were with houses of multiple occupation rather than single occupancy households covered by SL (N = 7) (Lawrence and Wilson, 2019).
The National Audit Office (NAO), UK’s independent public spending watchdog, interviewed officials from 12 local authorities across England about PRS regulation and fairness for tenants in 2021 (National Audit Office, 2021b). Those who had experience with running a SL scheme stated that it improved their data and understanding of the sector, increased awareness of tenant and landlord rights, and increased resources for proactive enforcement. The results also highlighted some important barriers to adopting SL including insufficient staff with the right skill base, lack of resources and time to prepare the mandatory local consultation or the application to central government in case of schemes exceeding the 20% threshold, that 5-year schemes were too short to make schemes worthwhile, poor communication from central government, low success rate applying for large schemes, and limited feedback on rejected applications.
The Lawrence and Wilson (2019) review begs the question why SL has not been more widely adopted if indeed perceived by local authorities to address key housing problems in such an effective manner while only a few gave reasons for non-adoption. The NAO report conveyed greater concerns over barriers for adopting SL based on a limited number of implementer interviews (National Audit Office, 2021b). Although the Lawrence and Wilson (2019) and the NAO report outline some of the many potential barriers there are for adoption, it is also clear that more evidence is needed in this area. We are therefore currently carrying out a mixed methods study to address this.
In summary, adopting local authorities tended to implement selective licensing in disadvantaged urban areas. However, adoption across England has been slow – even amongst such areas – and has hardly occurred at all for other types of area. There are several possible explanations for the slow adoption of SL. Many local authorities lack resources to take on a non-mandatory policy such as SL due to austerity cuts (Alexiou et al., 2023; Fahy et al., 2023; Hastings et al., 2017; Jeffery, 2025). At the same time qualified staff are reported to be in short supply (National Audit Office, 2021b). The public consultation process and initial data gathering can be costly at a point where there is uncertainty about the outcome (Lawrence and Wilson, 2019). There can be resistance from landlord lobby groups and strain from dealing with legal challenges from landlords. Other factors may also play a role. There could be internal organisational or political factors and/or policy-related factors including lack of cost-effectiveness data, that SL is perceived as too complex, or that it was poorly promoted (Berry and Berry, 2007). Labour-dominated local authorities were the most common adopters of SL throughout. The fact that local authorities with Conservative dominance mainly adopted after 2015 suggests that the new reasons may have broadened the ideological appeal of the policy. Overall, more qualitative evidence is needed from local authorities including from those that never adopted SL and from the parts of the Midlands and the South of England where SL has been absent to date.
Limitations
A limitation of assessing the temporal and spatial spread of SL is the lack of a national register. We have mitigated this via Freedom of Information Act (2000) requests with all local authorities.
The size of the data set in terms of the number of adopting local authorities (N = 49) sets limits for the number of indicators and domains that can be studied to avoid overfitting and we have applied a rule-of-10 (Kirkwood, B. and Sterne, 2003). The models can help with the interpretation of SL adoption, but we cannot rule out a role for unobserved variables due to the study design. We also studied exposure by Census 2011 classification which is based on over 50 different variables to provide an alternative with more broadly defined exposure categories.
The spatial autoregressive logit models consider SL adoption as a binary outcome together with spatial lags. The underlying data set also contains information on when SL was first adopted. We acknowledge that models spanning both spatial and temporal variation should be considered in future applications although the utility of such approaches would potentially still be limited by sample size.
We did not use row-standardisation for the spatial contiguity matrices assuming that local authorities with more neighbours have more opportunities to interact than if they had fewer (Neumayer and Plümper, 2016). We do not have specific evidence for this and therefore carried out the tests with row-standardisation as a sensitivity check. The assumption would in that case be that a local authority with, say, half the number of neighbours as another one interacts twice as much with each neighbour than the other one. Row-standardisation would change the results slightly although it would not lead to different conclusions.
There are several limitations when studying the potential role of political parties – mainly beyond the scope of this paper. These include that the data show the party with the most seats, which is not the same as having control unless they have majority and we do not know about local coalitions either. Policy adoption takes time and lags could be considered in more detailed analysis not to mention changes due to the ongoing local government reform.
Conclusions
English Local Authorities have had the power to implement SL in the private rental sector since 2006. The schemes are intended to target problems in their areas such as low housing demand, poor housing conditions and high levels of anti-social behaviour, deprivation, crime and migration. As of 2019, only 15% of local authorities had adopted SL.
The cumulative adoption curve showed that the policy has only been adopted at a slow rate. The adoption rate did however increase slightly at the point when the justifiable reasons for implementing SL were expanded. The spatial autoregressive logit models showed that socio-economic factors related to area deprivation were the most powerful determinants and that spatial spillovers were not statistically significant. We note that SL is absent from large parts of Mid- and South-England, so even without evidence of regional diffusion on a local scale it may still exist on a larger scale.
We conclude that SL adoption has been slow and regionally patchy, while correlated with socio-economic factors. Resource and staffing constraints as well as internal organisational/political and policy-related factors are likely barriers. More qualitative evidence is therefore urgently needed from local authorities, including from those that never adopted SL.
Supplemental Material
Supplemental Material - ‘Very’ selective licensing – An exploration of English local authorities’ adoption of a discretionary landlord licensing scheme, 2006-2019
Supplemental Material for ‘Very’ selective licensing – An exploration of English local authorities’ adoption of a discretionary landlord licensing scheme, 2006-2019 by Jakob Petersen, Alexandros Alexiou, Katie Fahy, Debbie Humphry, Katharina Janke, Dalya Marks, Rose McDonald, Maureen Seguin, Jill Stewart, Roz Spencer, Frank de Vocht, Matt Egan in Environment and Planning B: Urban Analytics and City Science.
Footnotes
Acknowledgements
We thank Prof Tomoki Nagaya, Tohoku University, for advice on spatial statistics at an early stage of the project. We are also indebted to Dr Tanith Rose and Prof Ben Barr, University of Liverpool, who made contributions to the protocol for the wider study. Prof Barr also helped secure funding for the project.
Ethical approval
Ethical approval has been obtained from London School of Hygiene & Tropical Medicine’s ethics committee (LSHTM submission number: 29809).
Funding
The authors disclosed receipt of the following financial support for the research, authorship, and/or publication of this article: this study is funded by the National Institute of Health and Care Research (NIHR) Public Health Research (PHR) stream (NIHR154797). The views expressed are those of the authors and not necessarily those of the NIHR or the Department of Health and Social Care.
Declaration of conflicting interests
The authors declared the following potential conflicts of interest with respect to the research, authorship, and/or publication of this article: RS works for Safer Renting, a part of the third sector organisation Cambridge House (![]() ; accessed 12 May 2025), a London based independent charity committed to promoting change that can improve the quality of life and wellbeing of people who are affected by the systemic poverty, social injustice and inequality in our society. ME and JS are advisors to a Safer Renting research project. ME was commissioned by Cambridge House to conduct a rapid literature review for this project. DM works part-time at LSHTM and part-time as a Senior Public Health Strategist at Islington Borough Council. ME and JS are two of the co-chairs of the London Public Health and Housing Network. This is an unfunded role. The Network links third sector and community stakeholders, local (London) public sector practitioners, national policy stakeholders, and researchers interested in Public Health and Housing. DH is a member of Homes for All campaign, Acorn Community Union, and Medact as well as board member for Action on Empty Homes. The research team includes private rented housing tenants, private rented housing landlords, and owner occupiers. Some members of the team reside in local authorities that have implemented selective licensing schemes.
; accessed 12 May 2025), a London based independent charity committed to promoting change that can improve the quality of life and wellbeing of people who are affected by the systemic poverty, social injustice and inequality in our society. ME and JS are advisors to a Safer Renting research project. ME was commissioned by Cambridge House to conduct a rapid literature review for this project. DM works part-time at LSHTM and part-time as a Senior Public Health Strategist at Islington Borough Council. ME and JS are two of the co-chairs of the London Public Health and Housing Network. This is an unfunded role. The Network links third sector and community stakeholders, local (London) public sector practitioners, national policy stakeholders, and researchers interested in Public Health and Housing. DH is a member of Homes for All campaign, Acorn Community Union, and Medact as well as board member for Action on Empty Homes. The research team includes private rented housing tenants, private rented housing landlords, and owner occupiers. Some members of the team reside in local authorities that have implemented selective licensing schemes.
Data Availability Statement
Supplemental Material
Supplemental material for this article is available online.
Author biographies
References
Supplementary Material
Please find the following supplemental material available below.
For Open Access articles published under a Creative Commons License, all supplemental material carries the same license as the article it is associated with.
For non-Open Access articles published, all supplemental material carries a non-exclusive license, and permission requests for re-use of supplemental material or any part of supplemental material shall be sent directly to the copyright owner as specified in the copyright notice associated with the article.